

Summary
The neural basis of abnormal social behavior in autism spectrum disorders (ASD) remains incompletely understood. Here we used two complementary, but independent brain-wide mapping approaches, mouse resting-state fMRI and c-Fos-iDISCO+ imaging, to construct brain-wide activity and connectivity maps of the Cntnap2 knockout (KO) mouse model of ASD. At the macroscale level, we detected reduced functional coupling across social brain regions, despite general patterns of hyperconnectivity across major brain structures. Oxytocin administration, which rescues social deficits in KO mice, strongly stimulated many brain areas and normalized connectivity patterns. Notably, chemogenetically-triggered release of endogenous oxytocin strongly stimulated the nucleus accumbens (NAc), a forebrain nucleus implicated in social reward. Furthermore, NAc-targeted approaches to activate local oxytocin receptors sufficiently rescued their social deficits. Our findings establish circuit- and systems-level mechanisms of social deficits in Cntnap2 KO mice, and reveal the NAc as a region that can be modulated by oxytocin to promote social interactions.
Introduction
Social deficits are at the core of autism spectrum disorders (ASD), a neurodevelopmental disorder with rapidly rising prevalence (Baio et al., 2018; Kogan et al., 2018). Efforts to develop more effective treatments are hindered by our limited understanding of the neural basis of social behavior, and its disruption in ASD (Barak and Feng, 2016; Chadman, 2014; Ghosh et al., 2013). Several decades of research have revealed the complex and context-dependent nature of social behavior and how it is influenced by neuromodulators such as oxytocin (OXT; Anderson, 2016; Insel, 2010; Meyer-Lindenberg et al., 2011; Mitre et al., 2018; Stanley and Adolphs, 2013; Steinman et al., 2019). Although several brain regions have been identified to play key roles in social behavior (Chen and Hong, 2018; Kim et al., 2015; Ko, 2017a; Lebow and Chen, 2016b; Walum and Young, 2018), it is not known how individual components interact to generate neurotypical social behavior, and how such interactions are altered in ASD. Furthermore, abnormal functional connectivity has been variably identified in ASD using resting state functional MRI (rsfMRI) (Di Martino et al., 2014; Hull et al., 2016; King et al., 2019), but there is no consensus as to which specific abnormalities are linked to social deficits. A possible contributing factor is the heterogeneous genetic architecture of ASD (Jeste and Geschwind, 2014; Takumi et al., 2019). Indeed, emerging observations support the notion that genetic heterogeneity contributes substantially to clinical heterogeneity as evidenced by characteristic phenotypes associated with specific mutations (Bernier et al., 2014; DiMario et al., 2015; de la Torre-Ubieta et al., 2016; Hagerman et al., 2017; Ruzzo et al., 2019). To advance our understanding of the mechanisms behind social deficits in ASD, a reasonable approach is to map circuit phenotypes associated with a specific ASD-risk gene mutation using monogenic in vivo models of ASD, offsetting the challenges imposed by ASD’s genetic heterogeneity.
We previously reported social deficits in mice harboring mutations in the Contactin-associated protein-like 2 gene (CNTNAP2; Penagarikano et al., 2011; Penagarikano et al., 2015), in which loss-of-function recessive mutations cause a syndromic form of ASD (Strauss et al., 2006). This mouse knockout model (Cntnap2−/− or Cntnap2 KO) has been established as a robust model for studying the neurobiological mechanisms of ASD (Brumback et al., 2018; Levy et al., 2019; Penagarikano et al., 2011; Scott et al., 2019; Selimbeyoglu et al., 2017). A prominent feature of the KO mouse is a dysfunctional central OXT system that appears to be linked with its social deficits. Cntnap2 is strongly expressed in OXT neurons, and deleting Cntnap2 in mice reduces the total amount of brain OXT and the number of OXT-immunoreactive neurons in the paraventricular nucleus (PVN) of the hypothalamus (Penagarikano et al., 2015). Remarkably, either exogenous supplementation of OXT, or activation of endogenous OXT release via chemogenetic or pharmacological strategies, temporarily normalizes the social impairment (Penagarikano et al., 2015). Recently, defects in the OXT system have also been linked to several other monogenic forms of ASD (Harony-Nicolas et al., 2017; Hörnberg et al., 2020; Kitagawa et al., 2021; Lewis et al., 2020), further highlighting its role in ASD-related social functioning.
Here, we performed extensive circuit mapping in the Cntnap2 KO by integrating, for the first time, two methods that allow brain-wide mapping of neuronal activity: high-field mouse fMRI (Ahrens and Dubowitz, 2001; Grandjean et al., 2020) and lightsheet imaging of c-Fos expression in iDISCO+ cleared brains (DeNardo et al., 2019; Renier et al., 2016). We identified evidence of dysregulated resting-state functional connectivity (rsFC) in KO mice across a key set of social brain regions and their connectivity relationship to the rest of the brain. Exogenously administered OXT either partially or fully reversed these aberrant patterns of connectivity in KO mice by activating a variety of brain areas, in a manner positively correlated with the density of OXT fiber projections. The nucleus accumbens (NAc) was strongly activated by experimentally stimulated release of endogenous OXT in KO mice, consistent with its emergent role as a hub in the “social salience and reward network” (Dölen et al., 2013; Johnson et al., 2017). To directly test the contribution of OXT in the NAc in the social impairment and rescue in KO mice, we induced either pharmacological or optogenetic activation of OXT signalling in the NAc, and found that either treatment sufficiently increased social behavior. These results are the first to demonstrate brain-wide functional network abnormalities related to social deficits, as well as their restoration by OXT in a genetic model of ASD that exhibits construct, face, and predictive validity to the human condition (Penagarikano et al., 2011, 2015).
Results
Exogenous OXT rescues aberrant functional connectivity in KO mice
Since individuals with ASD commonly exhibit abnormal patterns of rsFC (Hahamy et al., 2015; Hull et al., 2016; Lau et al., 2019; Lawrence et al., 2019; Takumi et al., 2019), we asked whether we could also find aberrant rsFC in Cntnap2 KO mice, and if OXT could rescue it. We acquired blood oxygen-level dependent (BOLD)-weighted rsfMRI data from dexmedetomidine-sedated WT and KO mice, prior to and post OXT administration (i.p., 1mg/kg) and computed rsFC (Methods; Figure S1). We compared the average rsFC between 7 major brain structures classified according to the Allen Mouse Brain Atlas (Lein et al., 2007; Wang et al., 2020), namely the olfactory (OLF), isocortex (CTX), hippocampus (HPC), forebrain nuclei (FN), thalamus (TH), hypothalamus (HYPO), and midbrain (MID), identifying 5 pairs of connections that exhibited distinct macroscale rsFC in KO mice, 4 of which were stronger (in the order of decreasing statistical significance: FN-HPC, FN-TH, FN-MID, and OLF-MID) and only 1 of which was weaker (OLF-HYPO; p<0.01; Figure 1A). These results demonstrate profound rsFC differences in KO mice at the macroscale level, centered around the FN.
Fig. 1: Structure- and function-based comparisons of functional connectivity between WT and KO mice before and after OXT.

(A) Top: macroscale comparison of basal rsFC between WT and KO mice (KO-WT) in pairs of seven major brain structures (OLF, olfactory cortex; CTX, isocortex; FN, forebrain nuclei; HPC, hippocampus; TH, thalamus; HYPO, hypothalamus; MID, midbrain). Lines indicate significant WT-KO rsFC differences (p < 0.01, Monte Carlo permutation test). Line thickness indicates higher statistical significance. Red, WT < KO; blue, KO < WT. *p < 0.01, **p < 0.005, ***p < 0.001. Bottom: heatmap represents rsFC differences (red-blue, Δz) for each pair.
(B) Heatmaps representing basal WT-KO rsFC differences (upper triangle, red-blue) and p values (lower triangle, grayscale; unpaired t test, uncorrected values) for each pair. Colored boxes indicate pairwise rsFC of social-social (red), social-other (purple), and other-other (blue) regions (Monte Carlo permutation test). *p < 0.05; ns, not significant.
(C and D) Macroscale rsFC shifts triggered by i.p. OXT injection compared to baseline (OXT-BL; t = 30 min) for WT (C) and KO (D) mice.
(E and F) Heatmaps representing OXT-induced rsFC changes (upper triangle, red-blue) and p values (lower triangle, greyscale; paired t test, uncorrected values) for each ROI pair in WT (E) and KO (F) mice. *p < 0.05; ns, not significant.
Since KO mice display deficits in social behavior (Penagarikano et al., 2011, 2015), we next examined whether they also exhibit specific rsFC impairments in brain regions established to play important roles in mouse social behavior (e.g. medial prefrontal cortex (mPFC), olfactory brain regions, NAc, bed nucleus of stria terminalis (BNST), septal regions, hypothalamus, see Methods for entire list; Figure 1B; Chen and Hong, 2018; Kim et al., 2015; Ko, 2017; Lebow and Chen, 2016). The average rsFC across these key social regions was significantly lower in Cntnap2 KO mice relative to WT (p=0.01; Figure 1B, S2B). In contrast, the average rsFC between this group of key social regions and the rest of the brain (e.g. thalamus, sensory cortices, brainstem; referenced as “other” regions from here on) was significantly higher in KO mice (p<0.001). No significant genotype difference was observed between the average rsFC across the “other” regions (p=0.74), indicating that genotype differences in rsFC may be specific to connections shared with social regions. Taken together, these data show that KO mice display a specific impairment in rsFC involving key social areas, manifesting as weaker connectivity within this group of functionally linked brain regions, and stronger connectivity between these and the rest of the brain.
Notably, i.p. OXT had a much stronger impact on the macroscale rsFC on KO mice compared to WT controls. In WT, OXT significantly attenuated the rsFC between 5 pairs of macroscale connections (OLF-CTX, CTX-FN, FN-HPC, CTX-HYPO, and OLF-HYPO; p<0.01; Figure 1C). In KO mice, a higher number of macroscale connections were modified by OXT – these include rsFC attenuation in 8 pairs of connections (FN-HPC, OLF-MID, HPC-HYPO, FN-MID, CTX-TH, CTX-MID, CTX-HPC, CTX-HYPO) and increase in 2 pairs (FN-HYPO, OLF-HYPO; p<0.01; Figure 1D). These changes to rsFC were sufficient for partially rescuing the basal connectivity phenotype of KO mice as reported above. To identify specific brain areas that are most likely to serve as a connectivity “hub” for the effect of OXT on rsFC, we established a ranked list of top 10 strengthened and 10 weakened ROI pairs after OXT administration for each of WT and KO datasets, then identified which individual regions appeared most frequently in this list. In WT, the motor cortex (MOT), infralimbic and prelimbic cortex (LIM), anterior cingulate cortex (ACC), and the lateral septum (LS) were identified as top regions in the list. In KO, the NAc, BNST, medial septum (MS), and the HPC were identified as the top regions (Table S1). Notably, 3 of these 4 top regions in KO mice belong to the forebrain nuclei, which exhibited the highest number of aberrant macroscale connections prior to OXT application as noted above. Furthermore, these 4 top regions belong to the previously proposed “social decision-making network” (O’Connell and Hofmann, 2012) and align with the currently hypothesized mechanism of social facilitation by OXT - strengthening the connectivity across a network of brain areas involved in social functions (Johnson and Young, 2017).
To further understand the effect of OXT on these connectivity hub regions in KO mice, we examined the time course of OXT-induced rsFC shifts in two ROI pairs featuring the 4 connectivity hub regions, NAc-BNST and MS-HPC. These connections showed a robust, and progressive change in rsFC in response to OXT administration in KO mice (p<0.05; Figure S2C). No significant change in rsFC was detected in either WT mice receiving OXT or KO mice receiving saline (p>0.05), consistent with the previously reported absence of OXT-mediated increase in social behavior in WT mice (Penagarikano et al., 2015). Finally, we examined whether OXT normalized the basal rsFC differences observed in social regions. We found that OXT elevated rsFC across these social regions, but reduced rsFC between social and other regions, reversing the basal phenotypes in KO mice (p<0.001; Figure 1E,F, S2B).
Atlas-based connectivity analysis averages signals within pre-determined ROIs based on atlas parcellation, and therefore can mask sub-regional effects. To overcome this limitation, we next computed pairwise rsFC across 40 ROIs defined by data-driven Independent Component Analysis (ICA; Smith et al., 2013), which decomposes imaging data into independent spatial maps and associated time courses (Beckmann and Smith, 2004). In agreement with the atlas-based connectivity analysis, OXT administration appeared to specifically modulate the KO brain, significantly shifting the rsFC between 3 pairs of independent components (ICs) in KO mice, but none in WT (Figure 2A–C; FDR<0.1). Two were reduced: IC1 (centered around the visual cortex)-IC3 (lateral hypothalamus), and IC11 (anterior cingulate cortex)-IC31 (dorsal striatum), both of which represent connections between “social” and “other” areas. Therefore, these results are in accordance with our atlas-based ROI pairwise connectivity comparisons in which OXT reduces the overall rsFC between the two groups. In contrast, OXT increased the relative rsFC between IC18 (ventral striatum/NAc) and IC35 (retrosplenial area), despite our classification of this connection as being between “social” and “other” regions. Both brain regions are of special interest – the retrosplenial area is a component of the default mode network (DMN), a group of midline cortical regions whose activity is correlated at rest in humans (Raichle, 2015) and mice (Stafford et al., 2014). Interestingly, the rsFC between the retrosplenial cortex and the rest of the DMN is impaired in ASD (Starck et al., 2013), and correlated with social symptom severity in humans (Lynch et al., 2013) and in Cntnap2 KO mice (Liska et al., 2018).
Fig. 2: Independent component analysis of functional connectivity between WT and KO mice, before and after OXT.
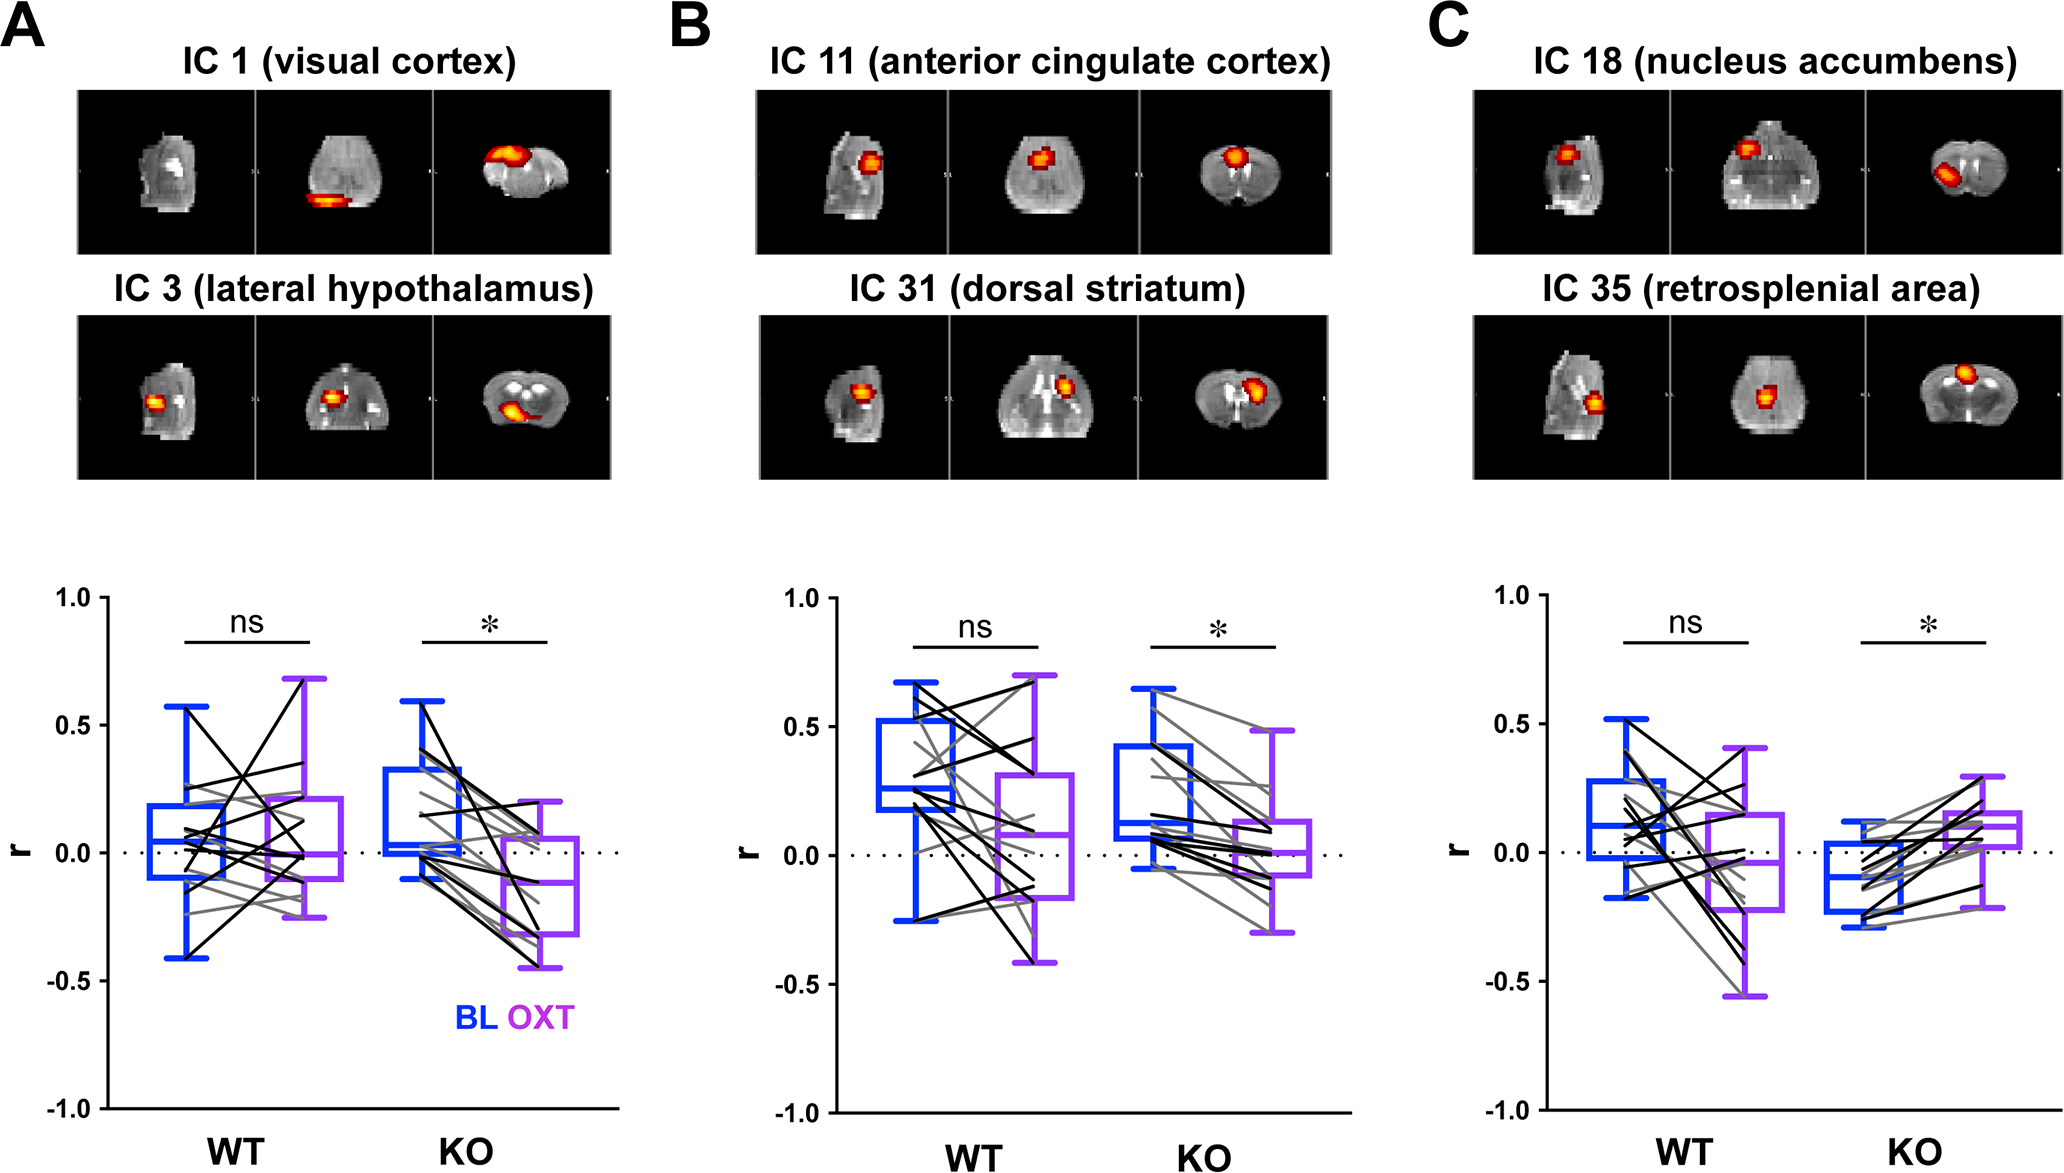
(A-C) Box-whisker plots represent a summary of r values (whisker: min-max values, box: 25–75th percentile, lines: individual before-after values, black for males and grey for females) of between-component connectivity for each genotype group, before and after OXT (t=30 min). Out of 40 identified independent components (ICs), OXT significantly modified rsFC between 3 KO pairs, and no WT pairs (paired t-test, * FDR<0.1).
Together, these rsfMRI data suggest that KO mice exhibit aberrant rsFC at the macroscale and individual circuit level, largely reversed after OXT administration. These data also highlight the potential importance of several forebrain nuclei, specifically NAc, BNST, and septal areas, whose rsFC with other brain regions is robustly modified after OXT administration in KO mice. Their well-known contributions to social behavior (Anderson, 2016; Chen and Hong, 2018; Kim et al., 2015) as core components of social salience and reward networks (Johnson and Young, 2017) suggest that these regions play key roles in the pro-social effect of OXT in KO mice.
Exogenous OXT robustly increases the BOLD signal in the KO mouse brain
The above data indicate that OXT strongly modifies rsFC across the KO brain to closely resemble WT patterns, while having a negligible effect on the WT brain. We next examined whether a disparity in OXT-triggered brain activity could underlie these differences, hypothesizing that OXT would strongly modulate the brain activity of KO mice while having a limited effect on WT mice (Penagarikano et al., 2015). To test this, we measured brain-wide changes in activity triggered by OXT administration in WT and KO mice using pharmacological MRI (phMRI; Leslie and James, 2000). In line with previous findings (Galbusera et al., 2017), peripherally administered OXT failed to increase the relative amplitude of the BOLD signal in any brain region of WT mice (vs. saline injected WT mice; Figure 3A; see S1B, S3A for acquisition and analysis schematics). In contrast, OXT administration robustly increased the relative BOLD signal amplitude across numerous brain regions in KO mice (vs. saline injected KO mice; Figure 3A, S3B). Significant negative BOLD fluctuations were observed in WT mice injected with OXT; however, they were not statistically different from responses to saline injections (Figure S3C). These results suggest that the observed stimulatory effect of OXT on brain activity is unique to KO mice, which parallels its KO-restricted behavioral effects of OXT (Penagarikano et al., 2015).
Fig. 3: Exogenous OXT induces a selective pattern of BOLD signal increases in the KO mouse.
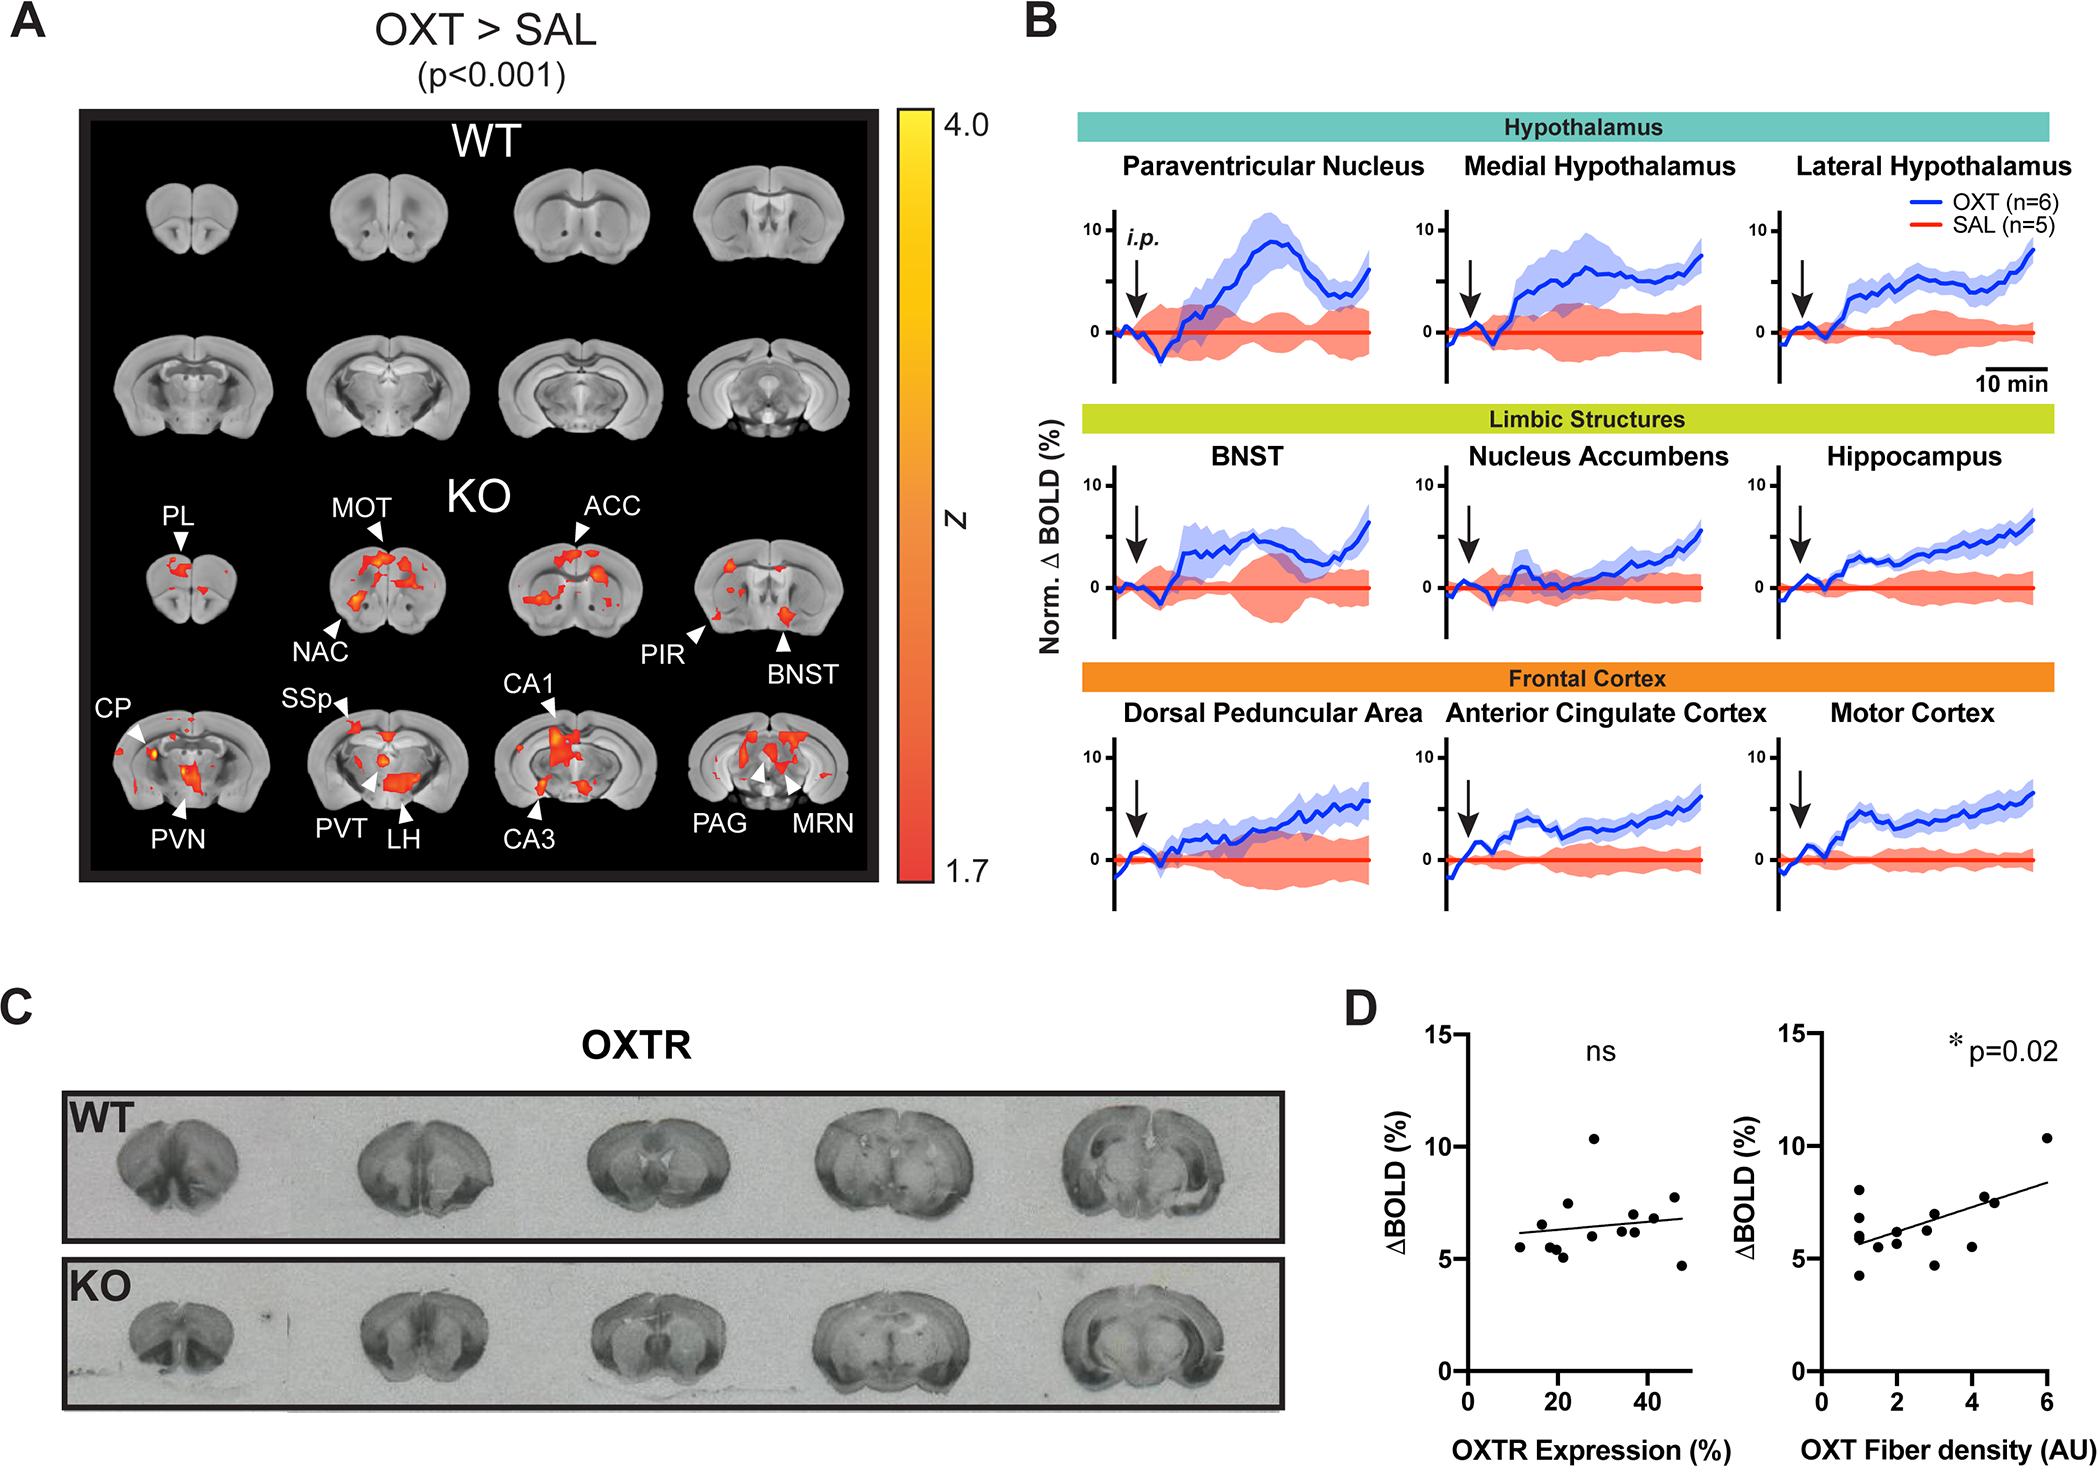
(A) Red-orange blobs overlaid on a reference structural scan indicate significantly activated voxels (OXT>SAL). n=5–6/group. (B) Time plots compare % BOLD signal change induced by OXT or SAL in selected brain regions. (C) OXT receptor (OXTR) autoradiography images reveal a relatively preserved pattern of OXTR expression in KO. (D) Scatter plots and regression lines compare correlations between average % BOLD change by OXT and OXTR expression density (left) or OXT fiber density (right) in each examined ROI (circle). * p<0.05; ns, not significant.
The PVN showed the strongest increase in BOLD signal compared with other regions, raising the possibility that exogenously administered OXT was triggering the release of its endogenous form (Figure S3B). Robust activation by OXT was also detected in several regions with established roles in social behavior, including the lateral and medial hypothalamus (Anderson, 2016), the BNST (Lebow and Chen, 2016), and the dorsal peduncular area, a sub-region of the mPFC (Riga et al., 2014; Figure 3A, S3B). Outside of these key social regions, OXT also activated various other cortical (e.g. somatosensory, motor, and retrosplenial cortex) and subcortical (e.g. hippocampus, thalamus, midbrain including the ventral tegmental area) regions. These align with the previously reported ability of OXT to influence the excitability of social and other brain regions, including the PVN (Inenaga and Yamashita, 1986), mPFC (Nakajima et al., 2014), hippocampus (Owen et al., 2013), auditory cortex (Marlin et al., 2015), and olfactory cortex (Oettl et al., 2016).
We next compared the dynamics of BOLD signal fluctuations in brain regions exhibiting the strongest degree of activation by OXT, including hypothalamic, limbic and frontal cortical areas (Figure 3B). As mentioned above, the PVN displayed the strongest BOLD activation, having a peak response at ~8% above baseline at t=~20 minutes post injection, followed by a reduced, but sustained level throughout the rest of the scan period (t=~40 minutes post injection). Other hypothalamic areas (e.g. medial and lateral hypothalamus) and limbic structures (e.g. BNST, NAc, hippocampus, dorsal peduncular area) lacked the peak response, but still maintained a sustained pattern of BOLD increase. Other cortical areas including the anterior cingulate cortex and motor cortex showed a mixed response, composed of an initial peak followed by a sustained response. Together, these results suggest that OXT injection in KO mice stimulates several brain regions, many of which have previously been identified as critical for social function (Johnson and Young, 2017). The BOLD activation kinetics in these regions are in line with the behavioral time course of administered OXT identified in published studies (~20 minutes post i.p. administration; Penagarikano et al., 2015).
Given the robust and region-specific phMRI activation of the KO brain by OXT, we explored whether differences in OXT receptor (OXTR) expression could account for these effects by comparing OXTR expression between WT and KO mouse brains with receptor autoradiography. KO mice exhibited a largely similar pattern of brain-wide OXTR binding to WT (Figure 3C). The highest binding densities in both groups were observed in the olfactory areas, including the piriform cortex, anterior olfactory nuclei, and taenia tecta; various cortical areas including the mPFC, somatosensory, auditory, association and motor cortex; hippocampal CA3; hypothalamus; and the amygdala; similar to previously reported findings in WT mice (Gigliucci et al., 2014; Hammock and Levitt, 2013). One notable exception to the typical expression pattern was found in the dorsal region of the lateral septum where the binding density in KO mice appeared to be higher than that of WT mice (Figure S3D). This is particularly interesting in light of work in voles, in which a high level of OXTR expression in this region has been positively correlated with an inability to form social pair bonds (Insel and Shapiro, 1992).
To test whether OXTR expression patterns were implicated in the robust BOLD signal increases in KO mice after OXT administration, we examined whether a regional correlation exists between the amount of OXT-induced BOLD signal change in KO mice and the previously reported density of brain-wide OXTR expression in WT mice (Mitre et al., 2016). This analysis revealed no significant correlation between the two parameters (r2=0.02; p=0.63; linear regression analysis; Figure 3D, Table S2). Next, we explored whether the BOLD signal increases were related to the density of central OXT projections instead (Liao et al., 2020), finding a significant correlation (r2= 0.33; p=0.02; linear regression analysis; Figure 3D, Table S2) between the two parameters. This supported the possibility of exogenous OXT administration triggering secretion of its endogenous form by PVN OXT neurons, through their centrally projecting fibers that terminate in an array of downstream brain regions.
iDISCO+-based brain-wide activity mapping confirms OXT activation patterns
To obtain a brain-wide activity map at a cellular resolution at higher resolution and without potentially interfering sedation effects in fMRI (Fukuda et al., 2013; Hablitz et al., 2019), we performed lightsheet imaging of the immediate early gene product c-Fos (a proxy marker of cellular activity; Gallo et al., 2018) in iDISCO+-cleared brains (DeNardo et al., 2019; Renier et al., 2016) and examined whether these data corresponded to the fMRI results. In agreement with the phMRI results (Figure 3), OXT had an overwhelmingly stimulatory effect on the KO brain (vs. SAL), increasing the number of c-Fos+ cells in many areas important for sensory and social functions including the NAc, BNST, anterior insula, somatosensory cortex, visual cortex and the temporal association area (p<0.005; Figure 4A). Also concordant with our phMRI results, OXT had an overall inhibitory effect on WT brain activity (vs. SAL), significantly reducing the number of c-Fos+ cells in regions including the CA1 and CA3 of the hippocampus, as well as a few cortical regions including temporal association cortex (TEa) and auditory cortex (AUD; p<0.005; Figure 4A). A notable difference between the fMRI and c-Fos-iDISCO+ datasets was the strong activation of sensory cortical areas in KO mice, especially the somatosensory cortex and visual cortex that were identified as two of the most significantly activated regions by c-Fos-DISCO+ (p<0.005; Figure S4A–D). These disparities may be due to amplification of the strong modulatory effects of OXT in these regions uncovered by the lack of sedation in these animals (e.g. Feng et al., 2018). These polarizing effects of OXT largely minimized the baseline activity differences between WT and KO mice observed in saline controls (Figure 4B), in strong agreement with our rsfMRI observations (Figure 1).
Fig. 4: Exogenous OXT induces an overlapping change in brain-wide c-Fos and BOLD activity.
(A-B) Within-genotype (A) and between-genotype (B) comparisons of regional activity levels between OXT and SAL injected mice using c-Fos-iDISCO+. Red (OXT>SAL or KO>WT) and green (SAL>OXT or WT<KO) blobs overlaid on the reference brain image indicate voxels with significantly different (p<0.005) c-Fos+ cell counts. (C) Bar-whisker plots (whisker: min-max values, box: 25–75th percentile, circles: individual ROI values) compare the average % change in c-Fos+ cell counts between WT (black) and KO (grey) mice. Kruskal-Wallis test. (D) Significant correlation between OXT-induced regional activity changes measured by phMRI (x-axis) and iDISCO+ (y-axis) indicated by a regression line. (E) Heatmap illustrating WT vs. KO regional % changes to c-Fos+ cell count after OXT. Circles, individual ROI average values. n=4–5/group. * p<0.05.
We next examined whether these distinct brain activity patterns elicited by OXT in KO mice were localized to any specific brain structures or their subregions by performing an atlas-based analysis. Then, we compared the % change in c-Fos+ cell count for each of the 6 major brain structures as identified above, plus the cortical subplate (CS), another major brain structure that could not be investigated via fMRI due to a loss of signal from geometric distortions common in echo planar imaging (Febo, 2011). As in our voxel-wise analyses, brain regions classified as part of the CTX (p<0.0001), HPC (p=0.002), and TH (p=0.045) were more strongly activated in KO mice compared to WT (Figure 4C, E). To directly test whether the iDISCO+ brain activity mapping results reliably validate the robust opposing effect of OXT in WT vs. KO mice observed with phMRI (Figure 3), we identified 22 ROIs present in both datasets and plotted the % activation against each other (Methods, Table S3). This analysis confirmed that, despite measuring remarkably diverse features representing brain activity at different scales in different cohorts of mice, the two brain-wide datasets are indeed significantly correlated (r2=0.16; p=0.008; Figure 4D). Moreover, the iDISCO+ results also validated the phMRI data on a regional basis – out of the 13 brain regions identified as having the highest degree of OXT-induced activation within the phMRI dataset, 5 regions also showed significant OXT-mediated increases in c-Fos+ cell counts with iDISCO+ brain activity mapping analysis (FDR<0.1; Figure S4A–C). This group of OXT-activated brain regions were composed of several social and motor-sensory regions, including the BNST, primary and secondary somatosensory cortex, primary motor cortex and the anterior visual area. In summary, these iDISCO+ results reveal robust activation of social and sensory regions by OXT in KO mice, resulting in a normalization of aberrant activity patterns in these mice. Taken together, these observations provide independent confirmation of the fMRI results at a cellular level, highlighting the complementarity of these two powerful brain-mapping approaches.
DREADD stimulation of endogenous OXT release strongly activates KO NAc
Having established, with 3 separate methods (i.e. phMRI, rsfMRI, c-Fos-iDISCO+), that OXT specifically impacts brain activity and functional connectivity in KO mice including a network of key social areas, we asked to what extent these results were a consequence of the central activity of OXT, versus its potential indirect effects through peripheral receptors (Qin et al., 2009; Quintana et al., 2015). To isolate the central component of the OXT-mediated effects observed in KO mice, we used the Designer Receptors Exclusively Activated by Designer Drug (DREADD) approach specifically targeted to PVN OXT neurons (AAV-OXT-hM3D(Gq)-mCherry or AAV-hSyn-DIO-hM3D(Gq)-mCherry in heterozygous Oxt-Cre mice; Fields et al., 2012; Grund et al., 2019; Krashes et al., 2011; Penagarikano et al., 2015; Tang et al., 2020; Figure 5A), we chemogenetically stimulated the activity of these neurons in a group of WT and KO mice to trigger endogenous delivery of OXT via its natural axon projections throughout the brain (Knobloch et al., 2012). Another group of mice received AAV-mOXT-Venus (without the construct for hM3D(Gq), the DREADD receptor) or AAV-hSyn-DIO-mCherry injections into the PVN to serve as controls. Using immunohistochemistry and confocal imaging, we established c-Fos+ cell counts in the PVN and several forebrain areas (NAc, BNST, lateral septum, mPFC, and basolateral amygdala), regions selected based on their strong modulation of activity and rsFC by exogenous OXT in KO mice (Figures 1–4).
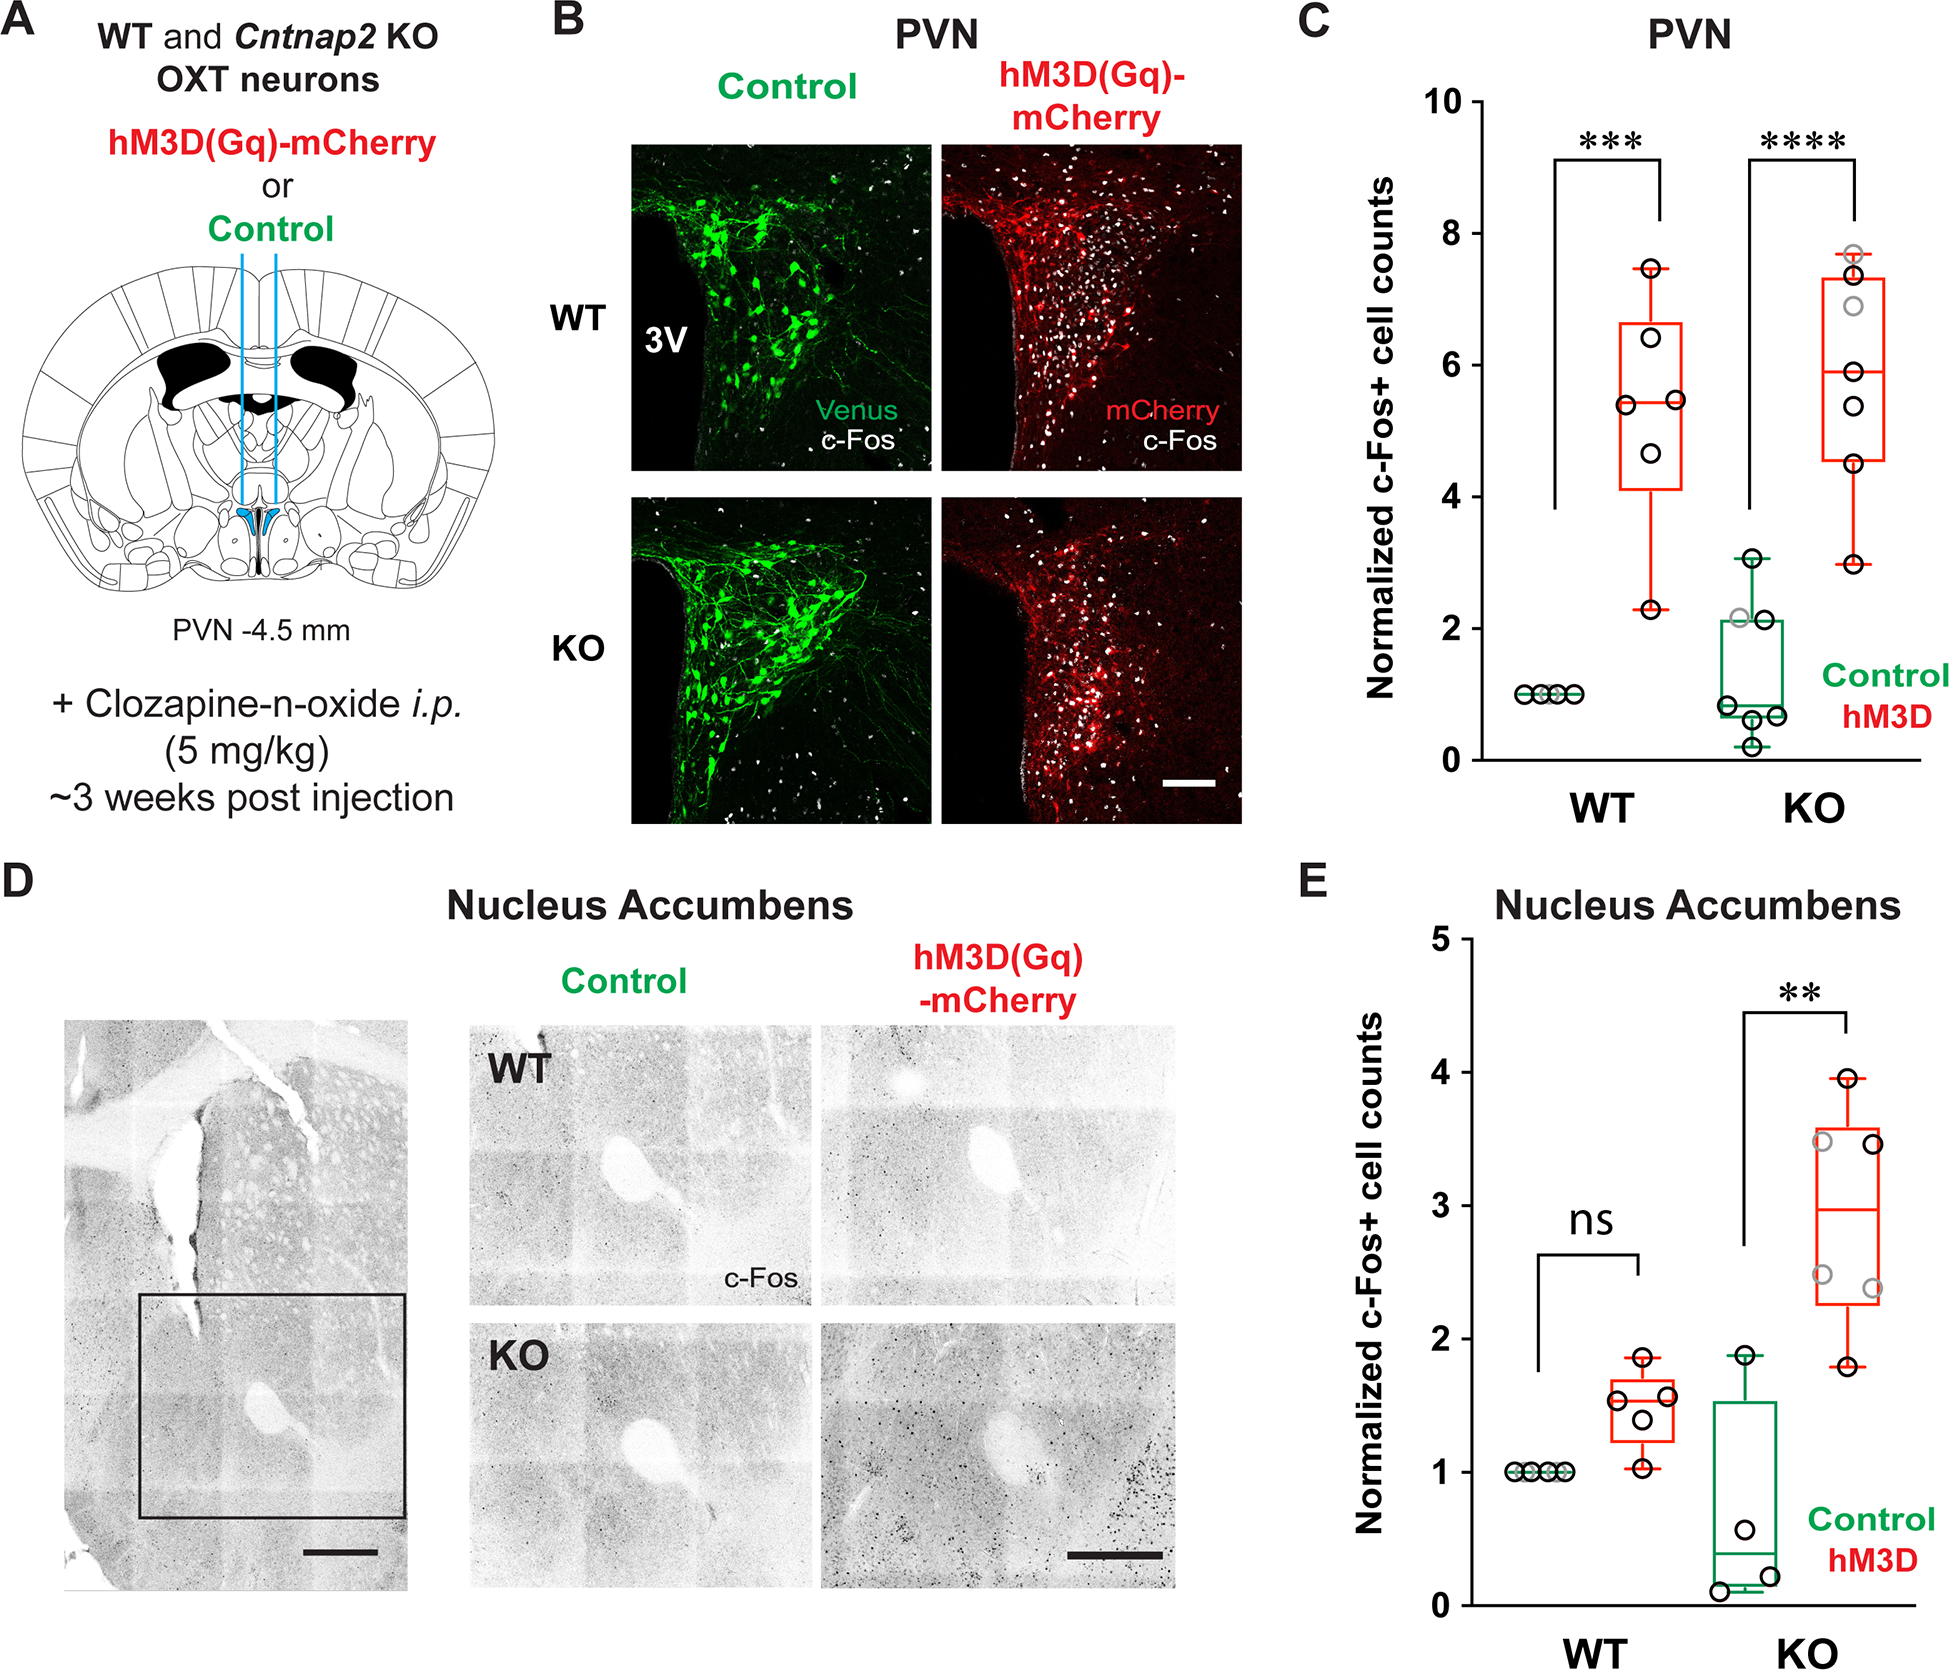
Fig. 5: Chemogenetic activation of endogenous OXT release strongly activates the NAc.

(A) A schematic of the DREADD approach used to activate endogenous OXT release. (B) Confocal images displaying AAV-driven expression of fluorescent reporter proteins (Venus (control), green or hM3D(Gq)-mCherry, red) in PVN OXT neurons, overlaid with c-Fos immunostaining as a proxy for neuronal activation post CNO injection (white). 3V, 3rd ventricle. Scale bar = 100 μm. (C) Box-whisker plot (whiskers: min-max values, box: 25–75th percentile, circles: individual values, black for males and grey for females) compares the number of c-Fos+ cells in WT and KO PVN after hM3D or control virus injections. Circles represent individual datapoints (grey: females, black: male). (D) Confocal images showing immunostained c-Fos+ cells in the NAc. Scale bar = 500 μm. (E) DREADD-stimulation of PVN OXT neurons significantly increases c-Fos+ cell counts in KO NAc, not WT. Kruskal-Wallis test. ** p<0.01, *** p<0.005, **** p<0.001, ns, not significant.
As a proof-of-principle experiment, we first examined the effect of the DREADD treatment in the PVN, and as expected, observed in both WT and KO mice a large (~5-fold) increase in the number of c-Fos+ cells following delivery of the DREADD agonist at a dose that rescues social behavior in KO mice (5 mg/kg i.p. Clozapine-n-oxide; Figure 5B,C; Table S4; Penagarikano et al., 2015). We next examined c-Fos+ cell counts in other regions of interest. Notably, the NAc in KO mice showed a significant DREADD-mediated increase in the number of c-Fos+ cells (p=0.008; Figure 5D,E; Table S4). This effect was absent in WT NAc after DREADD treatment (p=0.75). Additionally, there was a near-significant basal difference in c-Fos+ cell counts between WT and KO mice in the BNST (p=0.08), suggesting its potential abnormal activity in the KO brain. In contrast, the lateral septum and BNST, other forebrain nuclei areas that we earlier identified as being activated by i.p. OXT (Figure 3,4; Table S4) did not exhibit significant activation increases following chemogenetically stimulated endogenous OXT release (Figure S5). The mPFC and basolateral amygdala, two other brain areas well established to play central roles in social behavior (Ko, 2017; Selimbeyoglu et al., 2017; Yang and Wang, 2017), but which receive sparse OXT fiber projections (Liao et al., 2020), also did not show any increase in c-Fos+ cell counts in KO mice in after DREADD activation (Figure S5; Table S5). These results suggested to us that the NAc was the most likely region to mediate the previously demonstrated pro-social behavior in KO mice elicited by chemogenetic activation of PVN OXT neurons (Penagarikano et al., 2015). This is consistent with the known role of the NAc as a hub in social reward (Clithero et al., 2011; Kohls et al., 2013; Spreckelmeyer et al., 2009; Vanderschuren et al., 2016), and its involvement in ASD-related social deficits based on data from humans (Scott-Van Zeeland et al., 2010; Supekar et al., 2018; van Rooij et al., 2018) and other ASD mouse models based on human genetic evidence (Karayannis et al., 2014; Walsh et al., 2018).
Experimental enhancement of NAc OXT signalling sufficiently increases social behavior in KO mice
To directly examine the functional contribution of OXT signalling in the NAc to the pro-social effect of OXT in KO mice in vivo, we performed a home cage reciprocal social interaction assay in mice after a bilateral microinjection of TGOT (a selective OXTR agonist; Eliava et al., 2016; Lowbridge et al., 1977) into the NAc through an implanted cannula (Figure 6A,B; S6A). Although both NAc core and shell areas have been implicated in in social reward learning (Dolen et al., 2013; Hung et al., 2017), in this experiment we specifically targeted the NAc shell (NAcSh) area due to its heavy innervation with OXT fibers (Liao et al., 2020), the previously demonstrated excitatory response to OXT application in vivo (Moaddab et al., 2015), and the proposed role for the NAcSh as a social hub region (Johnson et al., 2017). In a separate trial, each mouse received an equal amount of saline infusion as control experiments. We found that KO mice spent a significantly longer amount of time investigating a novel, sex-matched juvenile mouse after receiving TGOT, when compared to the saline trials (n=10 mice, p=0.04; Figure 6B). These results demonstrate that OXTR activation in the NAcSh is sufficient to increase social interaction in KO mice.
Fig. 6: OXT in NAc increases social behavior in KO mice.
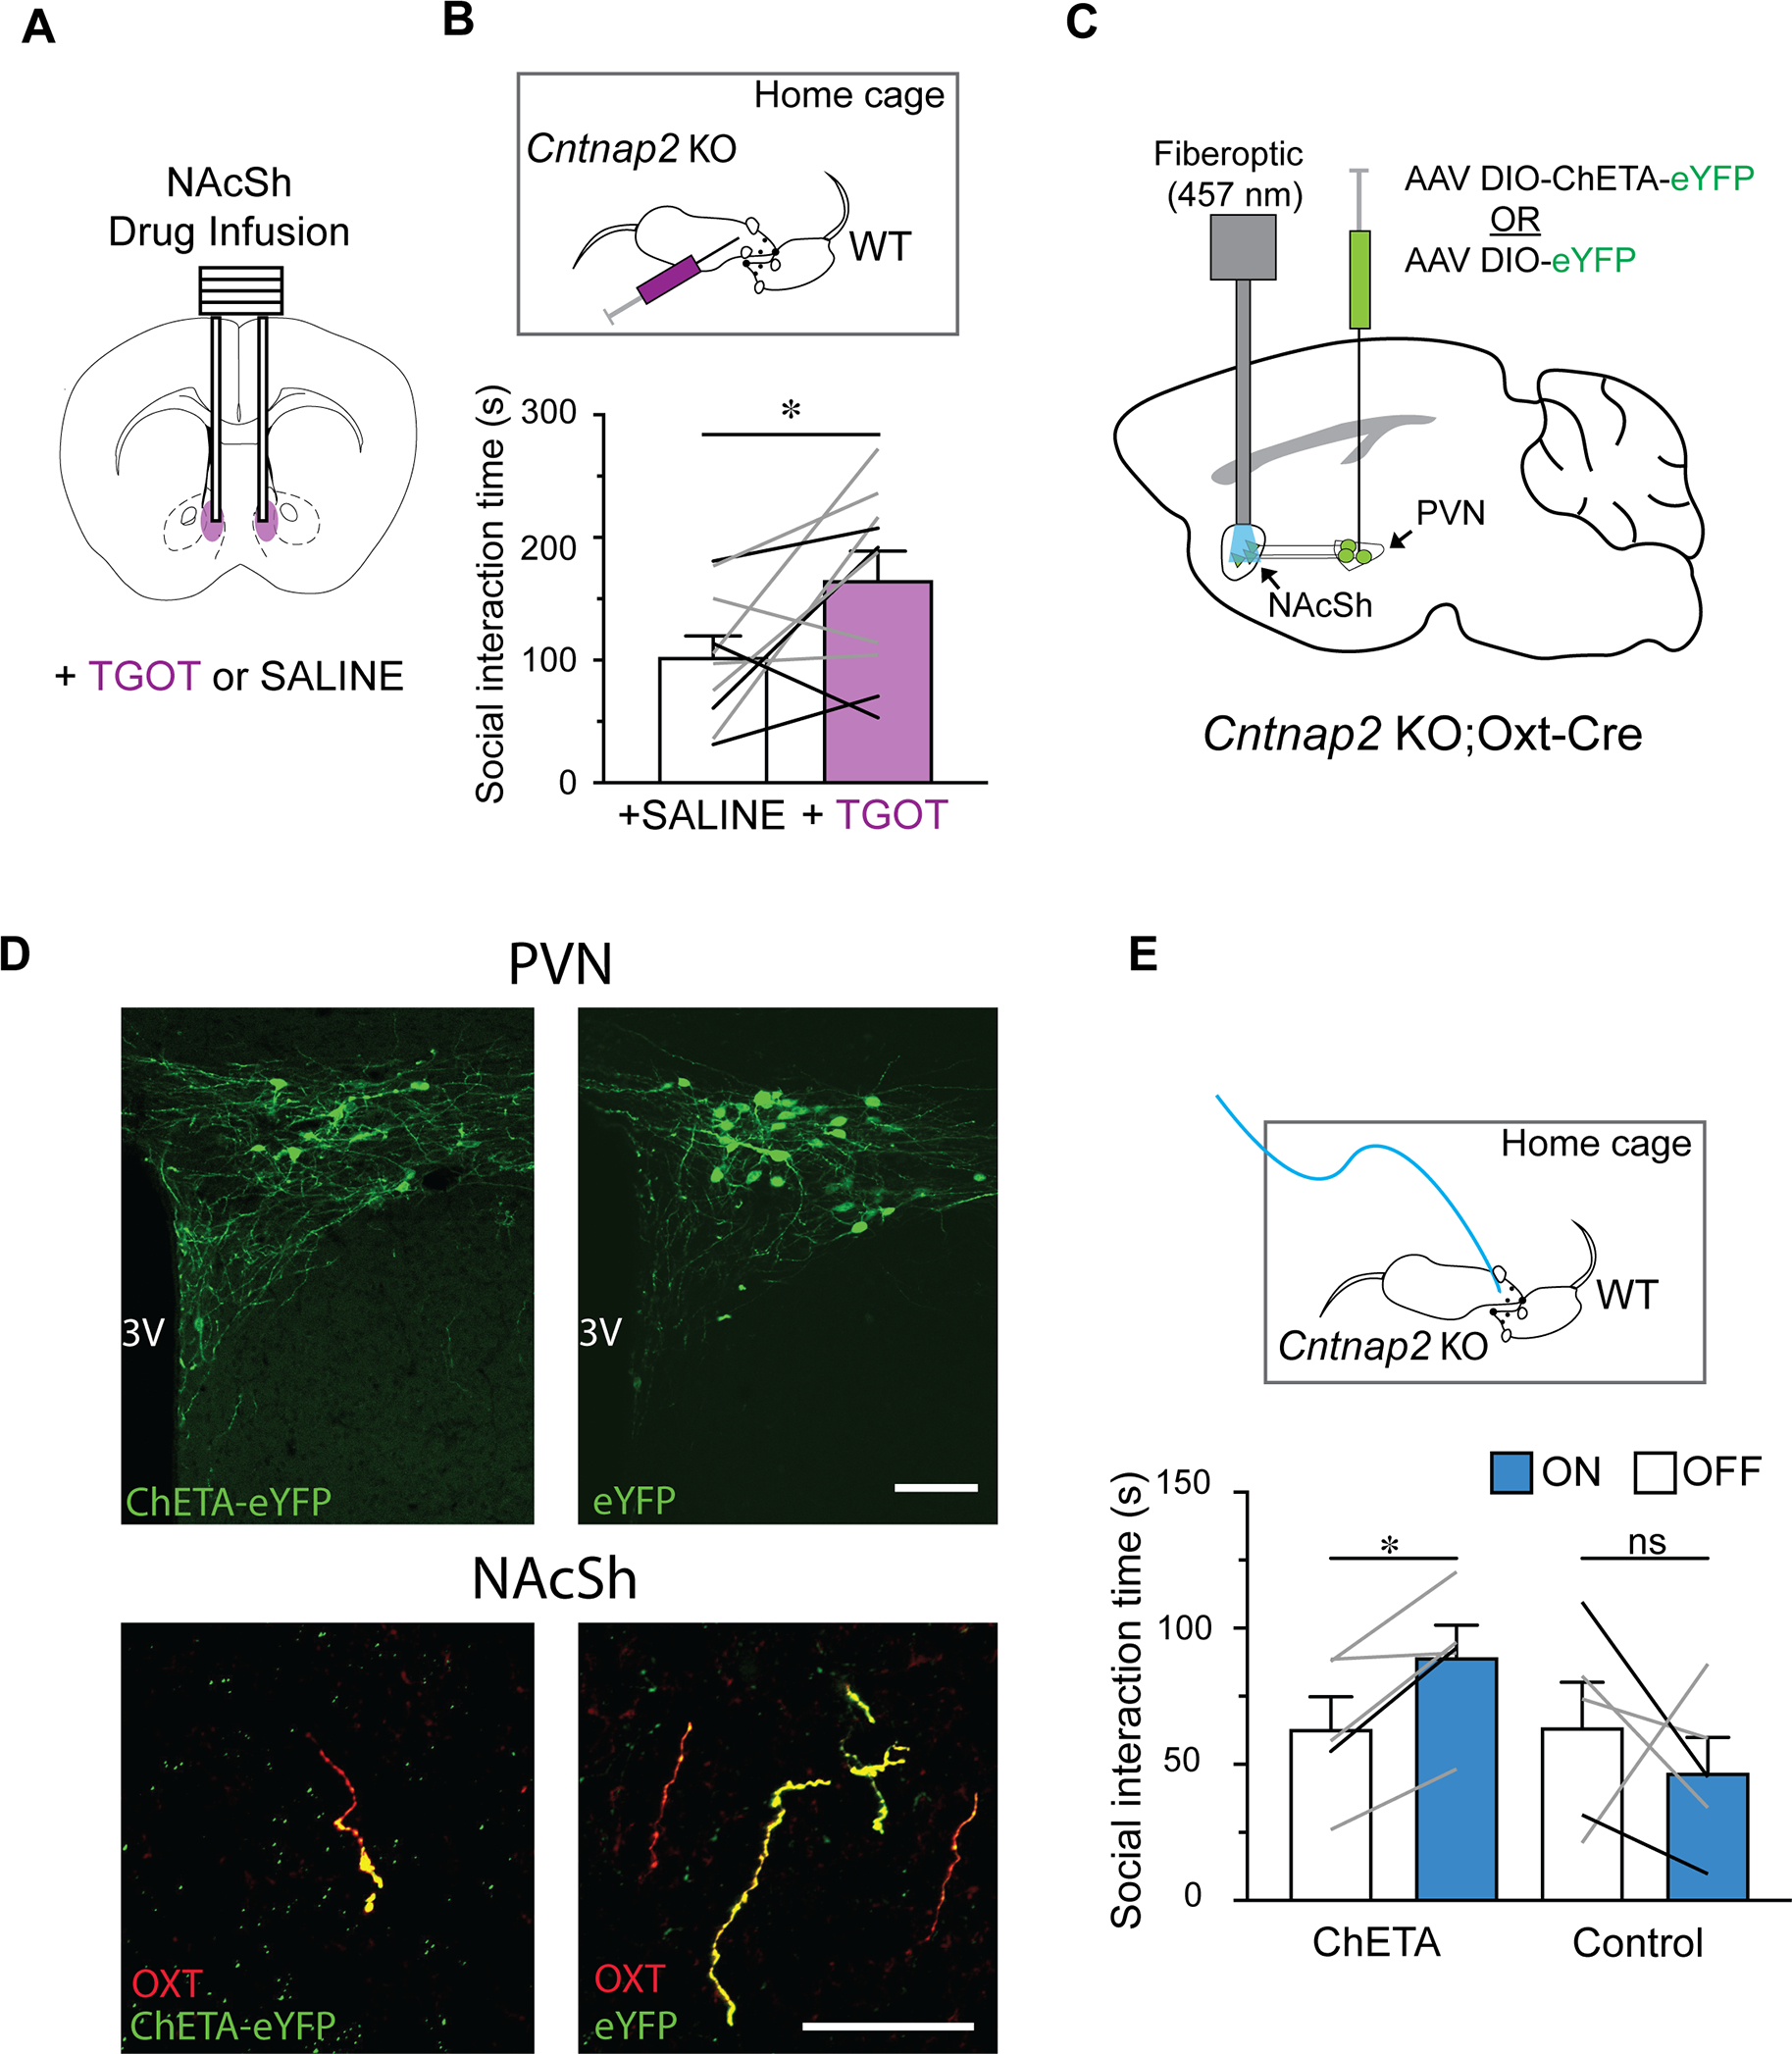
(A) Schematic of in vivo NAcSh infusion. (B) Top, schematic of home-cage social interaction assay combined with NAcSh infusion. Bottom, average social interaction time of KO mice with novel WT mice significantly increases after TGOT infusion. Paired t-test. (C) Schematic illustrating in vivo optogenetic stimulation of NAcSh-targeted OXT release. (D) Confirmation of eYFP expression in the PVN and NAcSh of mice injected with AAVs packaging either ChETA-eYFP (left) or eYFP Control (right). Scale bars = 100 μm (top), 50 μm (bottom). (E) Top, schematic of optogenetic stimulation during home cage reciprocal social interaction. Bottom, optogenetic stimulation significantly increases the average social interaction time of ChETA-expressing, but not control, KO mice. Lines represent individual animals (grey: female, black: male). One-way RM ANOVA, *, p<0.05; ns, not significant. Data are represented as mean ± SEM.
Finally, we asked whether the pro-social effects of OXT in KO mice could simply be replicated by triggering local endogenous OXT release within the NAcSh. To test this, we used an optogenetic strategy wherein expression of ChETA, a variant of Channelrhodopsin with fast time kinetics (Gunaydin et al., 2010), was targeted to PVN OXT neurons (Figure 6C). Histological examination of these mice confirmed robust expression of eYFP in the PVN and OXT fibers in the NAcSh (Figure 6D), as well as proper targeting of the implanted cannulae (Figure S6B). ChETA and control mice were tested with the home cage reciprocal social interaction assay, with or without blue light (457 nm) stimulation throughout the entire experimental period (10 minutes). We observed that light stimulation significantly increased the social behaviour of KO-ChETA mice when compared to trials performed without light stimulation (p=0.03; Figure 6E). We did not observe a similar effect in control KO mice (p=0.75; Figure 6E), confirming that the behavioural change induced by blue light was driven by optogenetic excitation of OXT neuron terminals. These two lines of independent evidence, pharmacological and optogenetic, establish that OXT signalling in the NAcSh serves as an important modulator likely mediating the pro-social effect of exogenous and endogenous OXT in KO mice.
Discussion
A major hypothesis suggests the behavioral symptoms of ASD are explained by aberrant rsFC, especially long-range disconnection that may occur as a result of developmental events (Geschwind and Levitt, 2007). Reflecting this hypothesis, and consistent with the human imaging data in subjects with idiopathic ASD (Cherkassky et al., 2006; Hull et al., 2016; Just et al., 2004; Kennedy and Courchesne, 2008; Starck et al., 2013), our rsfMRI results indicate the presence of abnormal basal rsFC in KO mice, such that core brain regions involved in social functions display a pattern of hypoconnectivity with each other, and hyperconnectivity with other regions (Figure 1). In contrast, rsFC between brain regions whose major functions lie outside of the social domain (e.g. motor and sensory functions) do not show any genotype differences. Overwhelming patterns of hypoconnectivity including the limbic and paralimbic system have been reported from the Autism Brain Imaging Data Exchange (ABIDE) study, which aimed to gain a consensus of the connectivity phenotype by aggregating a large number of ASD rsfMRI datasets (>1,000 subjects; Di Martino et al., 2014). Our findings of hypoconnectivity across many social brain regions including limbic areas in the KO mouse are remarkably similar to the findings of this well-powered clinical study in humans. The ABIDE study also found patterns of hyperconnectivity involving subcortical areas, similar to our results (macroscale hyperconnectivity between FN-HPC, FN-THAL, and FN-MID). Therefore, the Cntnap2 KO rsfMRI results presented here are surprisingly concordant with the rsFC patterns observed in the brains of individuals with ASD. These phenotypic similarities underscore the potential utility of some genetic mouse models for gaining a greater understanding of ASD neurobiology and development of translatable treatment options. At the same time, we recognize the heterogeneous etiology of ASD and do not suppose that this or any other single gene model is representative of the spectrum of this complex disorder.
Strikingly, administration of OXT normalized the network connectivity abnormalities in KO mice, increasing rsFC across social brain regions, and decreasing it between these regions and other brain regions that were hyperconnected in KO mice without such treatment (Figure 1). This observation is also consistent with OXT’s previously proposed role in functionally coupling the nodes of social brain regions, facilitating social behavior (Johnson and Young, 2017). Interestingly, these effects were not observed in WT mice, revealing a unique mechanism by which OXT impacts the KO brain. It is important to note that the formulation of social or non-social brain regions is not absolute and is rather dependent on the nature of the behaviors in question. Our categorization of social brain regions in this study is consistent with and based on previous literature defining networks of brain regions playing core roles in a wide range of social behavior, including the “mammalian social behavior network” (Newman, 1999), the “social decision-making network” (O’Connell and Hofmann, 2012), and the “social salience neural network” (Johnson et al., 2017).
The importance of the NAc in various types of social behavior is well-documented across many species, including prairie voles (Aragona et al., 2003), mice (Dolen et al., 2013; Ko, 2017), rats (Ploeger et al., 1991), and humans (Floresco, 2015). We present several lines of experimental evidence that establish the NAc as an important region for the pro-social effects of OXT in Cntnap2 KO mice (Penagarikano et al., 2015), further supporting its role as a hub in social reward network whose coordinated activity is critical for producing normal social behaviour (Johnson and Young, 2017). First, our macroscale-level analysis identified the forebrain nuclei as the major brain structure exhibiting the highest number of aberrant connections in KO mice (Figure 1A). Second, OXT either partially or fully rescued these rsFC phenotypes (Figure 1D). Third, the NAc is the only forebrain nucleus robustly activated by endogenous OXT (Figure 5D,E), highlighting its potential role as a substrate region for the pro-social effect of OXT in KO mice. Confirming this hypothesis, our behavioral experiments (Figure 6) demonstrate that either agonist activation of OXTR signalling in the NAcSh, or optogenetically stimulating NAcSh-specific secretion of endogenous OXT sufficiently increases social behavior in KO mice. Importantly, the NAcSh has previously been identified as the integrative hub of the “social salience neural network” (Johnson et al., 2017). Our data are highly consistent with this model, and further reveal that OXT signalling impairments within the NAc and the resulting functional uncoupling of the social brain may underlie social deficits caused by a loss of Cntnap2.
OXT is very weakly permeable through the blood brain barrier (Ermisch et al., 1985), generating an ongoing debate as to whether and how peripherally administered OXT can affect brain activity (Leng and Ludwig, 2016; Quintana et al., 2018). Several possibilities exist. First, i.p. OXT may activate peripheral OXTRs, which in turn stimulates the activity of PVN OXT neurons through activation of a transynaptic circuit, such as the one involved in OXT-induced feeding regulation (Iwasaki et al., 2015) and OXT inhibition of methamphetamine addiction (Everett et al., 2021). Indeed, our phMRI results show a robust increase (~8 %) in the BOLD signal around the PVN in KO mice about 10 minutes after the injection, demonstrating rapid activation of the central OXT system (Figure 3). This central effect is long-lasting, with the BOLD signal elevation persisting throughout the scan duration (~40 minutes). Since the half-life of OXT is only a few minutes long (Ludwig and Leng, 2006), we hypothesize that PVN OXT neurons stimulate continued release of OXT onto downstream regions through the known positive feedback loop (Ludwig and Leng, 2006). Another possibility accounting for the KO-specific effect of OXT could be an elevated OXTR expression at the sensory circumventricular organs, where there is increased access to circulating peptides due to higher permeability of the blood brain barrier (Hosono et al., 1999). It may be possible that subfornical organ (SFO) neurons, once activated by the circulating OXT, excite PVN OXT neurons to stimulate endogenous release. Lastly, there is also a possibility that the permeability of the blood brain barrier in KO mice is increased, allowing a higher amount of OXT to get into the brain. Interestingly, Nrx-IV, the invertebrate ortholog of Caspr2 (the protein encoded by the Cntnap2 gene), has previously been demonstrated to play a role in regulating a form of glia-glia contact important for maintaining septate junctions forming the drosophila blood-brain barrier (Bellen et al., 1998). Since Caspr2 expression is thought to be associated with both neurons and glia in mice (Poliak et al., 1999), our observation raises the possibility that mutant mice may have a disrupted blood brain barrier, a hypothesis that can be investigated in future studies.
In summary, we have uncovered the ability of OXT to robustly stimulate brain activity and reverse aberrant patterns of rsFC in a mouse model of ASD. Integration of multiple brain-wide datasets identify the NAc being a key region in this process, which we confirm with circuit-specific experimental approaches. These provocative findings reveal that mutations in a single ASD gene, Cntnap2, can drastically amplify and/or reverse the neuromodulatory effects of OXT in specific brain regions, leading to behavioral modifications. Future studies aimed at identifying the molecular, cellular, and synaptic mechanisms that underlie the robust effects of OXT at the NAc will deepen our understanding of the link between Cntnap2 and the central OXT system. Furthermore, identifying whether similar mechanisms also drive the social behavior phenotypes of other genetic models of ASD will be crucial for investigating whether our findings can be generalized for other ASD gene mutations. Interestingly, recent studies involving other genetic models of ASD also implicate OXT neurons in their social deficits (Harony-Nicolas et al., 2017; Hörnberg et al., 2020; Kitagawa et al., 2021; Lewis et al., 2020), supporting the emerging view that the OXT system may act as a convergence point connecting ASD gene mutations to social impairment.
STAR Methods
Resource Availability:
Lead Contact
Further information and requests for resources and reagents should be directed to and will be fulfilled by the Lead Contact, Daniel H. Geschwind (dhg@mednet.ucla.edu)
Materials Availability
This paper does not report original materials.
Data and code availability
All data reported in this paper will be shared by the lead contact upon request.
This paper does not report original code.
Any additional information required to reanalyze the data reported in this paper is available from the lead contact upon request.
Experimental Model
Mutant mice lacking the Cntnap2 gene (Caspr2-null mice or Cntnap2−/−) were obtained from Dr. Elior Peles (Poliak et al., 2003) and backcrossed to the C57BL/6J background for over 12 generations. Experimental Cntnap2 mutant and WT mice were obtained from heterozygous crossings and used for experiments when they reached adulthood (8 weeks or older). Both sexes were used as experimental animals – they were randomly assigned to groups and no obvious differences were noted. The three obtained genotypes were housed together with three to four same sex mice per cage. A subset of experimental mice were obtained from crossing male breeder mice that are heterozygous for Cntnap2 KO and homozygous Oxt-Cre (obtained from JAX, #024234) with female heterozygous Cntnap2 KO mice to produce offspring experimental mice that are homozygous for Cntnap2 KO and heterozygous for Oxt-Cre (Cntnap2−/−;OxtCre/+). All mice were kept in 12 hr light/12 hr dark cycle and had ad-lib access to food and water. All procedures involving animals were performed in accordance with the UCLA Animal Research Committee, and the NIH Guide for the Care and Use of Laboratory Animals.
Method Details
Magnetic resonance imaging
The mouse to be scanned was first briefly anesthetized with 2% isoflurane vaporized in oxygen flowing at 1 L/min, then placed on an MRI-compatible cradle. A single-channel surface coil (Bruker) was placed over the head of the mouse. For resting-state scans, a 3 mm-thick agar gel cap (Sigma, 3% in distilled water) was placed between the head and the surface coil, in order to reduce signal distortion in the blood-oxygen-level-dependent (BOLD) signal (Adamczak et al., 2010). To minimize time-dependent effects of the anesthetic on the BOLD signal, these initial steps were performed within a 10–15-minute time window (Magnuson et al., 2014). Isoflurane was gradually discontinued and sedation was initiated with a single subcutaneous (s.c.) injection of dexmedetomidine (Dexdomitor®, Zoetis; 0.15 mg/kg) followed by continuous s.c. infusion at 0.3 mg/kg/hr throughout the duration of the imaging as described in a previous publication (Adamczak et al., 2010). Respiration and body temperature of the mouse were continuously monitored remotely, and maintained in a physiological range (37 ± 1 °C; Small Animal Instruments Inc.) by a homeothermically-controlled forced warm air over the body (SA11 Instr, Inc., USA). At the end of the imaging session, sedation was reversed by atipamezole (Antisedan®, Pfizer) at 1.5 mg/kg (i.p.). Magnetic resonance imaging was performed using a 7 Tesla (T) Biospec small animal MRI system using Paravision 5.2 software (Bruker). Data were acquired using the S116 Bruker gradients (400 mT/m) in combination with a single-channel surface coil (described above) and a 72 mm birdcage transmit coil. An initial series of scans was performed to confirm proper head position, then localized FASTMAP shimming was performed to improve field homogeneity.
pharmacological MRI
T2-weighted structural scans were acquired with a Rapid-Relaxation-with-Enhancement (RARE) sequence (RARE factor=8, Echo time (TE)=56 ms, repetition time (TR)=6,018 ms, 4 averages, field-of-view (FOV)=1.8× 1.2cm, slice thickness=0.5 mm, 18 slices, FA=90 deg, bandwidth (BW)=50 kHz, matrix=60×40). Then, 45-minute long functional (BOLD) data were acquired using the same image geometry as the structural scans, with a one-shot, interleaved, gradient-echo echo planar imaging sequence with the following parameters: TE=16 ms, TR=2,000 ms, FA=70 degrees, BW 400 kHz and a data matrix of 60×40). 10 dummy scans were used to allow the T1 signal to reach steady-state prior to signal acquisition. OXT (Sigma, 1 mg/kg i.p at 1 mg/mL) or saline was administered following 5 minutes of baseline imaging data collection, after which imaging data was acquired in a continuous manner for the next 40 minutes.
Resting-state MRI
Structural and functional data were acquired using above-described parameters, with the following modifications: field-of-view (FOV)=3.0×3.0 cm, matrix=128×64; functional (BOLD) scans acquired using a two-shot gradient-echo echo-planar imaging (GE-EPI) sequence, TE=19 ms, TR=1,000 ms (2,000 ms per volume), FA=70 degrees, BW 400 kHz and a data matrix of 128×64, Fourier transformed to 128×128, voxel resolution 0.23×0.23×0.5 mm). For each mouse, one 5-minute resting-state scan (150 volumes) was acquired at the baseline, and then OXT (Sigma, 1 mg/kg i.p. at 1 mg/mL) or saline of the same volume was administered via a catheter placed prior to scanning. 5-minute resting-state scans were acquired every 10 minutes, during the 40-minute period following OXT/saline administration.
OXT receptor autoradiography
Following anesthesia and decapitation, brains were quickly removed and frozen in −70°C isopentane, and stored at −80°C. Sets of coronal brain sections (20 μm) were cut in a cryostat and thawmounted on Superfrost plus slides (stored at −80°C until processing for autoradiography). Autoradiography was performed using 40 pM concentration of OXT receptor ligand, 125I-ornithine vasotocin (OVT; PerkinElmer, NEX254) following standard protocols (Ferretti et al., 2019; Menon et al., 2018). Briefly, sections were thawed at room temperature, and fixed in 0.1% paraformaldehyde. After wash in 50 mM Tris-HCl (pH 7.4), the sections were incubated in 50pM 125I-labeled ligand in 50 mM Tris, 10 mM MgCl2, 0.1% bovine serum albumin (BSA), and 0.05% bacitracin. Excess ligand was removed by washing in 50 mM Tris-HCl (pH 7.4) / 10 mM, then in 50 mM Tris-HCl (pH 7.4) / 10 mM MgCl2. Finally, the sections were air-dried and exposed to Kodak BioMax MR film. Receptor binding patterns were qualitatively assessed.
iDISCO+ brain-wide imaging
Sample processing and imaging
Animals were single housed for 2 hours prior to OXT administration (Sigma, 1 mg/kg i.p). They were returned to their single-housed cages immediately after injection. 2 hours after injection, they were perfused transcardially with PBS followed by 4% PFA in PBS. Brains were extracted and postfixed overnight at 4°C. The brains were then divided into two halves by cutting in the sagittal plane, then processed with the iDISCO+ immunolabeling, following a previously described protocol (Renier et al., 2016). Samples were stained with c-Fos primary antibody (Synaptic Systems 226 003, 1:500), then Alexafluor 647 secondary antibody (ThermoFisher Scientific, 1:500). At least one day after clearing, iDISCO+ samples were imaged on a light-sheet microscope (Ultramicroscope II, LaVision Biotec) equipped with a sCMOS camera (Andor Neo) and a 2Å~ /0.5 NA objective lens (MVPLAPO 2Å~) using 488-nm and 640-nm lasers. The samples were scanned with a z-thickness of 3 μm using the continuous light-sheet scanning method with the dynamic horizontal focus for the 640-nm channel (20 acquisitions per plane), and without horizontal scanning for the 488-nm autofluorescence. Modifications and continuous updates to the iDISCO+ protocol can be found at http://www.idisco.info.
Chemogenetic activation of endogenous OXT release
Bilateral stereotaxic injections of 500 nL of AAV2-mOXT-hM3D(Gq)-mCherry-WPRE (custom generated from Signagen with plasmid from D. Geschwind laboratory (Penagarikano et al., 2015), or AAV2-hSyn-DIO-hM3D(Gq)-mCherry (Krashes et al., 2011) were performed into the PVN of the hypothalamus in WT and KO mice according to the following coordinates from Bregma: antero-posterior −0.60 mm; dorso-ventral −4.80 mm; lateral+/−0.20 mm. Another group of WT and KO mice received injections of AAV2-mOXT-Venus (V. Grinevich laboratory, Germany; Grinevich, 2016; Knobloch et al., 2012) or AAV2-hSyn-DIO-mCherry (Krashes et al., 2011) to control for the effects of surgeries and CNO administration. Mice who received injections of the viruses containing the Double-Floxed Inverted Open reading frame (DIO) were also heterozygous for the Oxt-Cre transgene (OxtCre/+). Injections were performed at a rate of 100 nL/min with a glass micropipette (50 μm tip diameter) using a Nanoliter 2000 microinjection system (WPI) attached to a Micro4 pump (WPI).
Three weeks after stereotaxic viral injections, WT and KO mice were singly housed and given clozapine-n-oxide (Enzo Life Sciences, 5 mg/kg, i.p.) after a habituation period of at least 1 hour. 2 hours after injection, mice were deeply anesthetized with 4% isoflurane and intracardially perfused with 4 % paraformaldehyde 0.1M phosphate-buffered saline (freshly diluted from 16 or 32% stock, Electron Microscopy Sciences). Brains were subsequently removed and incubated in 0.1 M phosphate-buffered solution containing 30 % sucrose at 4 °C for 2–3 days. Brains were then embedded in optimal cutting temperature solution (TissueTech) at −80°C, and cryosectioned at 50 μm thickness. Sections were stained with rabbit polyclonal anti-c-Fos antibody (1:500, Santa Cruz, sc-52) and goat anti-rabbit Alexa 647 secondary antibody (1:500). Confocal images were obtained at 10x magnification using a Zeiss 880 laser-scanning confocal microscope and analyzed using ImageJ (NIH).
Home cage social interaction test
Home cage social interaction assay of adult KO mice was performed adapting a previously used juvenile social play protocol (Peñagarikano et al., 2015). Briefly, adult KO mice and another group of juvenile (3–5 weeks old) WT mice, serving as novel social stimuli, were each singly housed in a new complete cage set up. They were then allowed to habituate for at least 1 hour in a dark room with white noise. Immediately prior to the social interaction assay, each pair of sex-matched, juvenile-adult pair separately underwent another phase of 10-minute solitary home cage exploration period in new home cages without lids. The pair was then placed together into another new home cage with no lid, meeting each other for the first time. They were allowed to freely interact for 10 minutes.
In vivo infusion of TGOT into the NAc shell
Adult KO mice were implanted with bilateral guide cannulae (Plastics One; 26G, 1.0 mm spacing, 3.5 mm long) targeting the NAcSh using the following stereotaxic coordinates from Bregma: anterio-posterior +1.3 mm; dorso-ventral −3.5 mm; lateral +/−0.5 mm. After at least 4 days of recovery, experimental mice were subjected to home cage social interaction tests described as above. Prior to the 10-minute solitary home cage exploration period, TGOT (0.25 μL/side for a total of 0.5 μL/mouse, dissolved at 14 ng/μL in 0.9% saline; Phoenix Pharmaceuticals) or an equivalent volume of saline was delivered to each side of the NAcSh for a total of 0.5 μL injection volume per mouse. Infusion was delivered a rate of 0.1 μL/min via a bilateral internal cannula (Plastics One; 33G, 1.0 mm spacing, 4.5 mm long). The internal cannula was left in place for 2.5 minutes after injection to allow for diffusion into the surrounding brain tissue. Each mouse underwent both TGOT and saline infusion trials separated by at least 1 day, the order of which were counterbalanced within the experimental group. After the conclusion of behavior experiments, mice were injected with a small volume (~0.1 μL) of 1% Evans blue (Sigma; diluted to 1% in 0.9% saline) through the internal cannula for visualization of injection sites, then perfused with paraformaldehyde solution (4% in PBS, Wako Chemicals). The brains were extracted, vibratome-sectioned and imaged on a confocal microscope (LSM 900, Zeiss) to confirm cannula placement.
Optogenetic stimulation of OXT release in the NAcSh
Adult KO mice were stereotaxically injected AAV1-Ef1a-DIO ChETA-EYFP (500 nL/side; Addgene #26968; Gunaydin et al., 2010) into the PVN of the hypothalamus as described above. Another group of KO mice were injected with or AAV2-CAG-Flex-eGFP-WPRE (Addgene #51502; Oh et al., 2014) or AAV2-mOXT-Venus (generated by V. Grinevich laboratory, Germany; Grinevich, 2016; Knobloch et al., 2012) to serve as controls. Following viral injections, dual-core optic cannula (200 μm core, 700 μm spacing, 0.39 NA, Thorlabs) was implanted into the NAcSh of each mouse using the following stereotaxic coordinates from Bregma: antero-posterior +1.3 mm; dorso-ventral −3.5 mm; lateral +/−0.35 mm. The cannulae were fixed to the skull of mice using Metabond (Parkell).
After at least 3 weeks have passed, home cage social interaction assay (described above) was performed with or without optogenetic stimulation in separate trails. A patch cord was connected to the implanted mice immediately prior to the 10-minute habituation stage in the cage without the lid. During optogenetic stimulation trials, mice received light stimulation (473 nm DPSS laser at 30 Hz, 10 ms width) at ~30 mW laser intensity measured from the tip of each dual-core cannula (~15 mW estimated laser intensity from each core) throughout the entire free social interaction period. Trials were separated by at least 1 day, and the order of the two trials were counterbalanced. After the conclusion of behavior experiments, mice were perfused with paraformaldehyde solution (4% in PBS, Wako Chemicals) The brains were extracted, vibratome-sectioned and imaged on a confocal microscope (LSM 900, Zeiss) to confirm cannula placement and PVN-specific expression of eYFP, eGFP, or Venus. A subset of sections were stained with PS38 mouse monoclonal anti-oxytocin antibody (1:500, a gift of H. Gainer; Ben-Barak et al., 1985) and goat anti-mouse Alexa 555 secondary antibody (1:500; Thermofisher) to confirm cellular identity.
Quantification and Statistical Analysis
Each n represents the number of animals. N values for each experimental dataset are listed in the figure legends. Summary data are either represented as box-whisker plots (whisker: min-max values, box: 25–75th percentile) or bar plots (mean ± SEM) with individual values. Kolmogorov-Smirnov test was performed to check for normality of datasets prior to conducting t-test or ANOVA. The details of each analysis method and statistical test used are listed below.
MRI analysis
Analysis was performed using FSL tools (Smith et al., 2004; see Figure S1B for an illustration of the analysis pipeline). The following pre-analysis corrections were performed: BET brain extraction, MCFLIRT motion correction, slice timing correction, and smoothing at 5 mm. Scans with a large magnitude of head movement were identified and excluded from further analysis. Using FLIRT, all structural scans were co-registered to a single structural scan selected as a reference. The same transformation matrix was then applied to functional (BOLD) scans.
For Atlas-based analyses, regions-of-Interest (ROIs) were defined using a parcellated in vivo mouse brain atlas custom-constructed from the Allen brain histological atlas (Lein et al., 2007) co-registered to Dorr 3D mouse brain atlas (Dorr et al., 2008). The parcellated atlas was co-registered to each functional scan. 46 brain ROIs were defined intra- and inter-hemispherically: OLF, olfactory cortex, ORB, orbital area, ACC, anterior cingulate cortex, ASA, association areas, AUD, auditory cortex, INS, insular cortex, LIM, limbic cortex, MO, motor cortex, SS, somatosensory cortex, PIR, piriform cortex, RSA, retrosplenial area, DP, dorsal peduncular cortex, NAC, nucleus accumbens, LS, lateral septum, HPC, hippocampal area, BNST, bed nucleus of stria terminalis, CP, caudoputamen, LH, lateral hypothalamus, TH, thalamus, PAL, pallidum, MH, medial hypothalamus, MS, medial septum, MID, midbrain, PVN, paraventricular nucleus of the hypothalamus, RN, reticular nucleus, VTA, ventral tegmental area (L, left, R, right). Grouping of major brain structures (CTX, HPC, MID, THAL, HYPO, FN, OLF) followed the annotation rules of the Allen Brain Atlas (Lein et al., 2007; Wang et al., 2020). Classification of “social” (OLF, ORB, ACC, INS, LIM, PIR, DP, NAC, LS, BNST, LH, MH, MS, and PVN) and “other” regions (the rest of ROIs) was performed based on established roles evident in existing literature (e.g. Anderson, 2016; Chen and Hong, 2018; Kim et al., 2015).
Pharmacological MRI
Statistically significant BOLD activation associated with OXT or saline administration was first identified at the single-subject level using general linear modeling (GLM; cluster thresholds: z<1.7, p<0.05; multiple-comparison corrected) in FSL’s FEAT tool (Woolrich et al., 2001). Then, group-level comparisons were made between OXT and saline administered mice for each genotype using a t-test (cluster thresholds: z<1.7, p<0.001; Woolrich et al., 2004). To assess ΔBOLD post OXT administration, the average BOLD time course from each ROI defined by the 46-region parcellated atlas was extracted and baseline-subtracted, then values from the last 150 volumes were averaged. Values for OXTR expression were obtained by averaging male and virgin female percentage of OXTR-expressing DAPI-positive cells for each ROI (Mitre et al., 2016). Values for OXT fiber density were obtained by assigning numerical values to previously reported regional fiber intensity ratings (Liao et al., 2020) as follows: − (0), ± (1), + (2), ++(3), +++ (4), ++++ (5), +++++ (6). Sub-regional values were averaged. Regression analysis was performed using Prism 9 (GraphPad). p-values below 0.05 were considered to be statistically significant.
Resting-state MRI
Pairwise-ROI analysis
For atlas-based ROI analysis, the average BOLD time course from each ROI defined by the 46-region parcellated atlas was extracted. rsFC between ROI pairs was computed using Pearson’s correlation analysis, and then Fisher’s z transformation was applied using MATLAB R2018b (Mathworks). Statistical differences between experimental groups were tested using Monte Carlo permutation tests using the perm package in R (10,000 repetitions; Fay and Shaw, 2010; https://CRAN.R-project.org/package=perm) for comparisons between major brain structure groupings and “social vs. other” comparisons. T-test function in MATLAB was used to assess statistical significance for individual pairwise-ROI comparisons. p-values below 0.05 were considered to be statistically significant.
For independent component (IC)-based ROI analysis, group-ICA was performed on all functional scans to identify 40 ICs followed by a dual regression to back-project spatial maps and time series for individual scans using FSL’s MELODIC and dual regression tools (Beckmann and Smith, 2004). Correlation matrices were made for all 40 component pairs to assess between-component connectivity. Paired t-tests, corrected at FDR=0.1, were performed within each genotype group to test the effect of OXT on between-component correlations.
Brain-wide analysis of c-Fos+ cell counts in iDISCO+ samples
Cell counts were calculated blind to experimental conditions. Images from iDISCO+ samples immunostained for Fos+ cells were quantified using the ClearMap cell detection module (Renier et al., 2016), with cell detection parameters optimized and validated by expert users based on the intensity and shape parameters of Fos immunolabeling profile (specific values available upon request). The image stack of autofluorescence in the 488 nm channel was aligned to the Allen Institute’s Common Coordinate Framework (CCF; Wang et al., 2020) using the Elastix toolbox and subsequently, the corresponding 640 nm channel image stack was transformed to the same coordinates. Statistical comparisons at the voxel level were performed using an unpaired t-test within ClearMap. To generate region-based quantification, CCF parcellations collapsed into ~100 regions were applied to the whole brain quantification data. Regional values were then statistically compared with Kruskal-Wallis test with Dunn’s multiple comparison test using Prism 9 (GraphPad). Regression analysis comparing fMRI and iDISCO data was performed using Prism 9. p-values below 0.05 were considered to be statistically significant.
Region-specific analysis of c-Fos+ cell counts after OXT-DREADD activation
Outlines over each brain region were drawn with references to The Allen Mouse Brain Atlas (Lein et al., 2007; Allen Institute, http://mouse.brain-map.org/) then the number of c-Fos+ cells was quantified by a blinded experimenter using the Analyze Particles tool in FIJI (Schindelin et al., 2012). Counts for each section were normalized to the size of selected area, except for the PVN where raw counts were used for comparisons. Statistical comparisons were performed using One-way ANOVA with Tukey’s multiple comparisons test or Kruskal-Wallis test with Dunn’s multiple comparison test with Prism 9 (Graphpad), where p-values of below 0.05 were considered as statistically significant.
Home cage social interaction test
Video-recordings of home cage reciprocal social interaction tests were manually analyzed by a blinded observer. Each social interaction event (i.e. sniffing or touching) was logged using BORIS (Friard and Gamba, 2016). Although rarely observed, pairs of mice displaying excessive aggressive behavior were excluded from the final dataset. Statistical comparison of behavioral datasets was performed using Prism (paired t-test or RM ANOVA as appropriate). p-values below 0.05 were considered as statistically significant.
Supplementary Material
Key resources table.
| REAGENT or RESOURCE | SOURCE | IDENTIFIER |
|---|---|---|
| Antibodies | ||
| Rabbit anti-c-Fos | Synaptic Systems | Cat# 226 003; RRID AB_2231974 |
| Rabbit anti-c-Fos | Santa Cruz | Cat# sc-52; RRID:AB_2106783) |
| Mouse anti-oxytocin (PS-38) | H. Gainer lab; Ben-Barak et al., 1985 | RRID:AB_2315026 |
| Goat anti-rabbit Alexa Fluor Plus 647 | ThermoFisher | Cat#A32733; RRID:AB_2866492 |
| Goat anti-mouse Alexa Fluor Plus 555 | ThermoFisher | Cat#A32727; RRID:AB_2633276 |
| Bacterial and virus strains | ||
| AAV2-mOXT-hM3D(Gq)-mCherry-WPRE | Signagen with Plasmid from D. Geschwind lab; Penagarikano et al., 2015 | RRID: Addgene_70717 |
| AAV2-hSyn-DIO-hM3D(Gq)-mCherry | Krashes et al., 2011 | RRID: Addgene_44361 |
| AAV2-mOXT-Venus | V. Grinevich lab; Knobloch et al., 2012 | n/a |
| AAV2-hSyn-DIO-mCherry | Roth lab DREADDs (unpublished) | RRID: Addgene _50459 |
| AAV1-Ef1a-DIO ChETA-EYFP | Gunaydin et al., 2010 | RRID: Addgene _26968 |
| AAV2-CAG-Flex-eGFP-WPRE | Oh et al., 2014 | RRID: Addgene _51502 |
| Chemicals, peptides, and recombinant proteins | ||
| Oxytocin | Sigma-Aldrich | Cat#O3251 |
| isopentane | Sigma-Aldrich | Cat#PHR1661 |
| 125I-OVT | PerkinElmer | Cat#NEX254 |
| Trizma-HCl | Sigma-Aldrich | Cat#T5941 |
| MgCl2 | Sigma-Aldrich | Cat#M8266 |
| PBS | Ambion | Cat#AM9624 |
| Triton-X100 | Sigma-Aldrich | Cat#X100-500mL |
| Tween-20 | Sigma-Aldrich | Cat#P9416-100mL |
| DMSO | Fisher Scientific | Cat#D128-4 |
| Sodium Azide | Sigma-Aldrich | Cat#58032-100G |
| Glycine | Sigma-Aldrich | Cat#G7126-500G |
| Heparin | Sigma-Aldrich | Cat#H3393-50KU |
| Hydrogen Peroxide (30%) | Sigma-Aldrich | Cat#216763-100ML |
| DiChloroMethane | Sigma-Aldrich | Cat#270997-12X100mL |
| DiBenzylEther | Sigma-Aldrich | Cat#108014-1KG |
| Paraformaldehyde (16%) | EMS | Cat#15710-S |
| Paraformaldehyde (32%) | EMS | Cat#15714 |
| Sucrose | Sigma-Aldrich | Cat#S0389 |
| Clozapine-n-oxide | Enzo Life Sciences | Cat#BML-NS105 |
| Optimal Cutting Temperature (OCT) solution | TissueTech | Cat#4583 |
| [Thr4,Gly7]-Oxytocin (TGOT) | Phoenix Pharmaceuticals | Cat#051-04 |
| Evans Blue | Sigma-Aldrich | Cat#E2129 |
| Agar | Fisher Scientific | Cat#BP9744500 |
| Critical commercial assays | ||
| Deposited data | ||
| Experimental models: Cell lines | ||
| Experimental models: Organisms/strains | ||
| B6.129(Cg)-Cntnap2tm1Pele/J | E. Peles lab; Poliak et al., 2003 | Cat#017482; RRID:IMSR_JAX:017482 |
| B6;129S-Oxttm1.1(cre)Dolsn/J | The Jackson Laboratory; Wu et al., 2012 | Cat#024234; RRID:IMSR_JAX:024234) |
| Oligonucleotides | ||
| Recombinant DNA | ||
| Software and algorithms | ||
| Prism 9 | GraphPad | https://www.graphpad.com/scientific-software/prism/ |
| Python 2.7 | Python Software Foundation | https://www.python.org/ |
| Zen Software | Zeiss Microscope | https://www.zeiss.com/microscopy/int/products/microscope-software/zen.html |
| Adobe Illustrator | Adobe | https://www.adobe.com/ca/products/illustrator.html |
| MATLAB 2018b | Mathworks | https://www.mathworks.com/products/matlab.html |
| ClearMap | Renier et al., 2016 | https://idisco.info/clearmap-2/ |
| Paravision 5.2 | Bruker | https://www.bruker.com/en/products-and-solutions/preclinical-imaging/paravision-360.html |
| FSL Tools | FSL | https://fsl.fmrib.ox.ac.uk/fsl/ |
| Perm package in R | Fay and Shaw, 2010 | https://CRAN.R-project.org/package=perm |
| BORIS | Friard and Gamba, 2016 | https://www.boris.unito.it/ |
| FIJI | Schindelin et al., 2012 | https://imagej.net/software/fiji/ |
| Other | ||
Highlights.
We integrate brain-wide c-Fos-iDISCO+ imaging and fMRI in an ASD mouse model
Overlapping activity and connectivity profiles reveal disrupted brain networks
Oxytocin strongly activates KO brain to normalize functional connectivity patterns
We identify nucleus accumbens as a key hub for OXT modulation of KO social behavior
Acknowledgments
D.H.G. and K.Y.C. were supported by the National Institute of Mental Health (NIMH; R01MH100027). D.H.G., N.G.H., and K.Y.C. were supported by the Simons Foundation Autism Research Initiative (Award 401457). K.Y.C. was supported by the NIMH (K99MH115143) and CIHR (Postdoctoral Fellowship). N.G.H. was supported by the National Institute of Neurological Disorders and Stroke (NINDS; R01NS091222) and the UCLA Brain Injury Research Center. L.A.D. was supported by NIH K01MH116264 and a NARSAD Young Investigator Award. R.A.I.B. was supported by the British Academy and Autism Research Trust. V.G. was supported by the German Research Foundation (DFG) grants GR 3619/15-1 and GR 3619/16-1 and the SFB Consortium 1158-2. O.P. was supported by MICINN (RTI2018-101427-B-I00). We thank Hal Gainer for the generous gift of anti-oxytocin antibody; Charles Bourque for helpful comments on the manuscript; Sophy Xiong, Jonathan Abrams, Qiuli Bi, and Andrew Frew for technical assistance; and members of the D.H.G. and P.G. laboratories for stimulating discussions and troubleshooting support.
Footnotes
Declaration of Interests
The authors report no competing interests.
Supplemental video and Excel table titles and legends
None
Publisher's Disclaimer: This is a PDF file of an unedited manuscript that has been accepted for publication. As a service to our customers we are providing this early version of the manuscript. The manuscript will undergo copyediting, typesetting, and review of the resulting proof before it is published in its final form. Please note that during the production process errors may be discovered which could affect the content, and all legal disclaimers that apply to the journal pertain.
References
- Adamczak JM, Farr TD, Seehafer JU, Kalthoff D, and Hoehn M (2010). High field BOLD response to forepaw stimulation in the mouse. Neuroimage 51, 704–712. [DOI] [PubMed] [Google Scholar]
- Ahrens ET, and Dubowitz DJ (2001). Peripheral somatosensory fMRI in mouse at 11.7 T. NMR Biomed 14, 318–324. [DOI] [PubMed] [Google Scholar]
- Anderson DJ (2016). Circuit modules linking internal states and social behaviour in flies and mice. Nat Rev Neurosci 17, 692–704. [DOI] [PubMed] [Google Scholar]
- Aragona BJ, Liu Y, Curtis JT, Stephan FK, and Wang Z (2003). A critical role for nucleus accumbens dopamine in partner-preference formation in male prairie voles. The Journal of neuroscience : the official journal of the Society for Neuroscience 23, 3483–3490. [DOI] [PMC free article] [PubMed] [Google Scholar]
- Baio J, Wiggins L, Christensen DL, Maenner MJ, Daniels J, Warren Z, Kurzius-Spencer M, Zahorodny W, Robinson Rosenberg C, White T, et al. (2018). Prevalence of Autism Spectrum Disorder Among Children Aged 8 Years - Autism and Developmental Disabilities Monitoring Network, 11 Sites, United States, 2014. Morbidity and mortality weekly report Surveillance summaries (Washington, DC : 2002) 67, 1–23. [DOI] [PMC free article] [PubMed] [Google Scholar]
- Barak B, and Feng G (2016). Neurobiology of social behavior abnormalities in autism and Williams syndrome. Nature neuroscience 19, 647–655. [DOI] [PMC free article] [PubMed] [Google Scholar]
- Beckmann CF, and Smith SM (2004). Probabilistic independent component analysis for functional magnetic resonance imaging. IEEE Trans Med Imaging 23, 137–152. [DOI] [PubMed] [Google Scholar]
- Bellen HJ, Lu Y, Beckstead R, and Bhat MA (1998). Neurexin IV, caspr and paranodin--novel members of the neurexin family: encounters of axons and glia. Trends Neurosci 21, 444–449. [DOI] [PubMed] [Google Scholar]
- Ben-Barak Y, Russell JT, Whitnall MH, Ozato K, and Gainer H (1985). Neurophysin in the hypothalamo-neurohypophysial system. I. Production and characterization of monoclonal antibodies. J. Neurosci 5, 81–97. [DOI] [PMC free article] [PubMed] [Google Scholar]
- Bernier R, Golzio C, Xiong B, Stessman HA, Coe BP, Penn O, Witherspoon K, Gerdts J, Baker C, Vulto-van Silfhout AT, et al. (2014). Disruptive CHD8 mutations define a subtype of autism early in development. Cell 158, 263–276. [DOI] [PMC free article] [PubMed] [Google Scholar]
- Brumback AC, Ellwood IT, Kjaerby C, Iafrati J, Robinson S, Lee AT, Patel T, Nagaraj S, Davatolhagh F, and Sohal VS (2018). Identifying specific prefrontal neurons that contribute to autism-associated abnormalities in physiology and social behavior. Mol Psychiatry 23, 2078–2089. [DOI] [PMC free article] [PubMed] [Google Scholar]
- Chadman KK (2014). Making progress in autism drug discovery. Expert Opin Drug Discov 9, 1389–1391. [DOI] [PubMed] [Google Scholar]
- Chen P, and Hong W (2018). Neural Circuit Mechanisms of Social Behavior. Neuron 98, 16–30. [DOI] [PMC free article] [PubMed] [Google Scholar]
- Cherkassky VL, Kana RK, Keller TA, and Just MA (2006). Functional connectivity in a baseline resting-state network in autism. Neuroreport 17, 1687–1690. [DOI] [PubMed] [Google Scholar]
- Clithero J, Reeck C, Carter R, Smith D, and Huettel S (2011). Nucleus Accumbens Mediates Relative Motivation for Rewards in the Absence of Choice. Frontiers in Human Neuroscience 5. [DOI] [PMC free article] [PubMed] [Google Scholar]
- de la Torre-Ubieta L, Won H, Stein JL, and Geschwind DH (2016). Advancing the understanding of autism disease mechanisms through genetics. Nature medicine 22, 345–361. [DOI] [PMC free article] [PubMed] [Google Scholar]
- DeNardo LA, Liu CD, Allen WE, Adams EL, Friedmann D, Fu L, Guenthner CJ, Tessier-Lavigne M, and Luo L (2019). Temporal evolution of cortical ensembles promoting remote memory retrieval. Nature neuroscience 22, 460–469. [DOI] [PMC free article] [PubMed] [Google Scholar]
- Di Martino A, Yan CG, Li Q, Denio E, Castellanos FX, Alaerts K, Anderson JS, Assaf M, Bookheimer SY, Dapretto M, et al. (2014). The autism brain imaging data exchange: towards a large-scale evaluation of the intrinsic brain architecture in autism. Mol Psychiatry 19, 659–667. [DOI] [PMC free article] [PubMed] [Google Scholar]
- DiMario FJ, Sahin M, and Ebrahimi-Fakhari D (2015). Tuberous Sclerosis Complex. Pediatric Clinics of North America 62, 633–648. [DOI] [PubMed] [Google Scholar]
- Dolen G, Darvishzadeh A, Huang KW, and Malenka RC (2013). Social reward requires coordinated activity of nucleus accumbens oxytocin and serotonin. Nature 501, 179–184. [DOI] [PMC free article] [PubMed] [Google Scholar]
- Dorr AE, Lerch JP, Spring S, Kabani N, and Henkelman RM (2008). High resolution three-dimensional brain atlas using an average magnetic resonance image of 40 adult C57Bl/6J mice. Neuroimage 42, 60–69. [DOI] [PubMed] [Google Scholar]
- Eliava M, Melchior M, Knobloch-Bollmann HS, Wahis J, da Silva Gouveia M, Tang Y, Ciobanu AC, Triana del Rio R, Roth LC, Althammer F, et al. (2016). A New Population of Parvocellular Oxytocin Neurons Controlling Magnocellular Neuron Activity and Inflammatory Pain Processing. Neuron 89, 1291–1304. [DOI] [PMC free article] [PubMed] [Google Scholar]
- Ermisch A, Barth T, Ruhle HJ, Skopkova J, Hrbas P, and Landgraf R (1985). On the blood-brain barrier to peptides: accumulation of labelled vasopressin, DesGlyNH2-vasopressin and oxytocin by brain regions. Endocrinol Exp 19, 29–37. [PubMed] [Google Scholar]
- Everett NA, Turner AJ, Costa PA, Baracz SJ, and Cornish JL (2021). The vagus nerve mediates the suppressing effects of peripherally administered oxytocin on methamphetamine self-administration and seeking in rats. Neuropsychopharmacology 46, 297–304. [DOI] [PMC free article] [PubMed] [Google Scholar]
- Fay MP, and Shaw PA (2010). Exact and Asymptotic Weighted Logrank Tests for Interval Censored Data: The interval R Package. Journal of Statistical Software 36, 1–34. [DOI] [PMC free article] [PubMed] [Google Scholar]
- Febo M (2011). Technical and conceptual considerations for performing and interpreting functional MRI studies in awake rats. Front Psychiatry 2, 43. [DOI] [PMC free article] [PubMed] [Google Scholar]
- Feng Z-X, Dong H, Qu W-M, and Zhang W (2018). Oral Delivered Dexmedetomidine Promotes and Consolidates Non-rapid Eye Movement Sleep via Sleep-Wake Regulation Systems in Mice. Front Pharmacol 9, 1196. [DOI] [PMC free article] [PubMed] [Google Scholar]
- Ferretti V, Maltese F, Contarini G, Nigro M, Bonavia A, Huang H, Gigliucci V, Morelli G, Scheggia D, Manago F, et al. (2019). Oxytocin Signaling in the Central Amygdala Modulates Emotion Discrimination in Mice. Curr Biol 29, 1938–1953 e1936. [DOI] [PubMed] [Google Scholar]
- Fields RL, Ponzio TA, Kawasaki M, and Gainer H (2012). Cell-type specific oxytocin gene expression from AAV delivered promoter deletion constructs into the rat supraoptic nucleus in vivo. PloS one 7, e32085. [DOI] [PMC free article] [PubMed] [Google Scholar]
- Floresco SB (2015). The nucleus accumbens: an interface between cognition, emotion, and action. Annu Rev Psychol 66, 25–52. [DOI] [PubMed] [Google Scholar]
- Friard O, and Gamba M (2016). BORIS: a free, versatile open-source event-logging software for video/audio coding and live observations. Methods in Ecology and Evolution 7, 1325–1330. [Google Scholar]
- Fukuda M, Vazquez AL, Zong X, and Kim SG (2013). Effects of the alpha(2)-adrenergic receptor agonist dexmedetomidine on neural, vascular and BOLD fMRI responses in the somatosensory cortex. Eur J Neurosci 37, 80–95. [DOI] [PMC free article] [PubMed] [Google Scholar]
- Galbusera A, De Felice A, Girardi S, Bassetto G, Maschietto M, Nishimori K, Chini B, Papaleo F, Vassanelli S, and Gozzi A (2017). Intranasal Oxytocin and Vasopressin Modulate Divergent Brainwide Functional Substrates. Neuropsychopharmacology : official publication of the American College of Neuropsychopharmacology 42, 1420–1434. [DOI] [PMC free article] [PubMed] [Google Scholar]
- Gallo FT, Katche C, Morici JF, Medina JH, and Weisstaub NV (2018). Immediate Early Genes, Memory and Psychiatric Disorders: Focus on c-Fos, Egr1 and Arc. Front Behav Neurosci 12, 79. [DOI] [PMC free article] [PubMed] [Google Scholar]
- Geschwind DH, and Levitt P (2007). Autism spectrum disorders: developmental disconnection syndromes. Curr Opin Neurobiol 17, 103–111. [DOI] [PubMed] [Google Scholar]
- Ghosh A, Michalon A, Lindemann L, Fontoura P, and Santarelli L (2013). Drug discovery for autism spectrum disorder: challenges and opportunities. Nat Rev Drug Discov 12, 777–790. [DOI] [PubMed] [Google Scholar]
- Gigliucci V, Leonzino M, Busnelli M, Luchetti A, Palladino VS, D’Amato FR, and Chini B (2014). Region specific up-regulation of oxytocin receptors in the opioid oprm1 (−/−) mouse model of autism. Front Pediatr 2, 91. [DOI] [PMC free article] [PubMed] [Google Scholar]
- Grandjean J, Canella C, Anckaerts C, Ayranci G, Bougacha S, Bienert T, Buehlmann D, Coletta L, Gallino D, Gass N, et al. (2020). Common functional networks in the mouse brain revealed by multi-centre resting-state fMRI analysis. Neuroimage 205, 116278. [DOI] [PMC free article] [PubMed] [Google Scholar]
- Grinevich V, Knobloch HS, Roth LC, Althammer F, Domansky A, Vinnikov I, Stanifer M, Boulant S (2016). Somatic transgenesis (Viral vectors), Masterclass in Neuroendocrinology Series: Molecular Neuroendocrinology: From Genome to Physiology, First Edition. Edited by Murphy David and Gainer Harold. John Wiley & Sons, Ltd. 2016, pp. 243–274. [Google Scholar]
- Grund T, Tang Y, Benusiglio D, Althammer F, Probst S, Oppenlander L, Neumann ID, and Grinevich V (2019). Chemogenetic activation of oxytocin neurons: Temporal dynamics, hormonal release, and behavioral consequences. Psychoneuroendocrinology 106, 77–84. [DOI] [PubMed] [Google Scholar]
- Gunaydin LA, Yizhar O, Berndt A, Sohal VS, Deisseroth K, and Hegemann P (2010). Ultrafast optogenetic control. Nat Neurosci 13, 387–392. [DOI] [PubMed] [Google Scholar]
- Hablitz LM, Vinitsky HS, Sun Q, Stæger FF, Sigurdsson B, Mortensen KN, Lilius TO, and Nedergaard M (2019). Increased glymphatic influx is correlated with high EEG delta power and low heart rate in mice under anesthesia. Science Advances 5, eaav5447. [DOI] [PMC free article] [PubMed] [Google Scholar]
- Hagerman RJ, Berry-Kravis E, Hazlett HC, Bailey DB, Moine H, Kooy RF, Tassone F, Gantois I, Sonenberg N, Mandel JL, et al. (2017). Fragile X syndrome. Nature Reviews Disease Primers 3, 17065. [DOI] [PubMed] [Google Scholar]
- Hahamy A, Behrmann M, and Malach R (2015). The idiosyncratic brain: distortion of spontaneous connectivity patterns in autism spectrum disorder. Nature neuroscience 18, 302–309. [DOI] [PubMed] [Google Scholar]
- Hammock EA, and Levitt P (2013). Oxytocin receptor ligand binding in embryonic tissue and postnatal brain development of the C57BL/6J mouse. Front Behav Neurosci 7, 195. [DOI] [PMC free article] [PubMed] [Google Scholar]
- Harony-Nicolas H, Kay M, du Hoffmann J, Klein ME, Bozdagi-Gunal O, Riad M, Daskalakis NP, Sonar S, Castillo PE, Hof PR, et al. (2017). Oxytocin improves behavioral and electrophysiological deficits in a novel Shank3-deficient rat. Elife 6. [DOI] [PMC free article] [PubMed] [Google Scholar]
- Hörnberg H, Pérez-Garci E, Schreiner D, Hatstatt-Burklé L, Magara F, Baudouin S, Matter A, Nacro K, Pecho-Vrieseling E, and Scheiffele P (2020). Rescue of oxytocin response and social behaviour in a mouse model of autism. Nature 584, 252–256. [DOI] [PMC free article] [PubMed] [Google Scholar]
- Hosono T, Schmid HA, Kanosue K, and Simon E (1999). Neuronal actions of oxytocin on the subfornical organ of male rats. Am J Physiol 276, E1004–1008. [DOI] [PubMed] [Google Scholar]
- Hull JV, Dokovna LB, Jacokes ZJ, Torgerson CM, Irimia A, and Van Horn JD (2016). Resting-State Functional Connectivity in Autism Spectrum Disorders: A Review. Front Psychiatry 7, 205. [DOI] [PMC free article] [PubMed] [Google Scholar]
- Hung LW, Neuner S, Polepalli JS, Beier KT, Wright M, Walsh JJ, Lewis EM, Luo L, Deisseroth K, Dölen G, et al. (2017). Gating of social reward by oxytocin in the ventral tegmental area. Science 357, 1406–1411. [DOI] [PMC free article] [PubMed] [Google Scholar]
- Inenaga K, and Yamashita H (1986). Excitation of neurones in the rat paraventricular nucleus in vitro by vasopressin and oxytocin. J Physiol 370, 165–180. [DOI] [PMC free article] [PubMed] [Google Scholar]
- Insel TR (2010). The challenge of translation in social neuroscience: a review of oxytocin, vasopressin, and affiliative behavior. Neuron 65, 768–779. [DOI] [PMC free article] [PubMed] [Google Scholar]
- Insel TR, and Shapiro LE (1992). Oxytocin receptor distribution reflects social organization in monogamous and polygamous voles. Proceedings of the National Academy of Sciences of the United States of America 89, 5981–5985. [DOI] [PMC free article] [PubMed] [Google Scholar]
- Iwasaki Y, Maejima Y, Suyama S, Yoshida M, Arai T, Katsurada K, Kumari P, Nakabayashi H, Kakei M, and Yada T (2015). Peripheral oxytocin activates vagal afferent neurons to suppress feeding in normal and leptin-resistant mice: a route for ameliorating hyperphagia and obesity. Am J Physiol Regul Integr Comp Physiol 308, R360–369. [DOI] [PubMed] [Google Scholar]
- Jeste SS, and Geschwind DH (2014). Disentangling the heterogeneity of autism spectrum disorder through genetic findings. Nat Rev Neurol 10, 74–81. [DOI] [PMC free article] [PubMed] [Google Scholar]
- Johnson ZV, and Young LJ (2017). Oxytocin and vasopressin neural networks: Implications for social behavioral diversity and translational neuroscience. Neuroscience & Biobehavioral Reviews 76, 87–98. [DOI] [PMC free article] [PubMed] [Google Scholar]
- Johnson ZV, Walum H, Xiao Y, Riefkohl PC, and Young LJ (2017). Oxytocin receptors modulate a social salience neural network in male prairie voles. Hormones and Behavior 87, 16–24. [DOI] [PMC free article] [PubMed] [Google Scholar]
- Just MA, Cherkassky VL, Keller TA, and Minshew NJ (2004). Cortical activation and synchronization during sentence comprehension in high-functioning autism: evidence of underconnectivity. Brain 127, 1811–1821. [DOI] [PubMed] [Google Scholar]
- Karayannis T, Au E, Patel JC, Kruglikov I, Markx S, Delorme R, Heron D, Salomon D, Glessner J, Restituito S, et al. (2014). Cntnap4 differentially contributes to GABAergic and dopaminergic synaptic transmission. Nature 511, 236–240. [DOI] [PMC free article] [PubMed] [Google Scholar]
- Kennedy DP, and Courchesne E (2008). The intrinsic functional organization of the brain is altered in autism. Neuroimage 39, 1877–1885. [DOI] [PubMed] [Google Scholar]
- Kim Y, Venkataraju KU, Pradhan K, Mende C, Taranda J, Turaga SC, Arganda-Carreras I, Ng L, Hawrylycz MJ, Rockland KS, et al. (2015). Mapping social behavior-induced brain activation at cellular resolution in the mouse. Cell Rep 10, 292–305. [DOI] [PMC free article] [PubMed] [Google Scholar]
- King JB, Prigge MBD, King CK, Morgan J, Weathersby F, Fox JC, Dean DC 3rd, Freeman A, Villaruz JAM, Kane KL, et al. (2019). Generalizability and reproducibility of functional connectivity in autism. Mol Autism 10, 27. [DOI] [PMC free article] [PubMed] [Google Scholar]
- Kitagawa K, Matsumura K, Baba M, Kondo M, Takemoto T, Nagayasu K, Ago Y, Seiriki K, Hayata-Takano A, Kasai A, et al. (2021). Intranasal oxytocin administration ameliorates social behavioral deficits in a POGZWT/Q1038R mouse model of autism spectrum disorder. Mol Brain 14, 56. [DOI] [PMC free article] [PubMed] [Google Scholar]
- Knobloch HS, Charlet A, Hoffmann LC, Eliava M, Khrulev S, Cetin AH, Osten P, Schwarz MK, Seeburg PH, Stoop R, et al. (2012). Evoked axonal oxytocin release in the central amygdala attenuates fear response. Neuron 73, 553–566. [DOI] [PubMed] [Google Scholar]
- Ko J (2017). Neuroanatomical Substrates of Rodent Social Behavior: The Medial Prefrontal Cortex and Its Projection Patterns. Frontiers in Neural Circuits 11. [DOI] [PMC free article] [PubMed] [Google Scholar]
- Kogan MD, Vladutiu CJ, Schieve LA, Ghandour RM, Blumberg SJ, Zablotsky B, Perrin JM, Shattuck P, Kuhlthau KA, Harwood RL, et al. (2018). The Prevalence of Parent-Reported Autism Spectrum Disorder Among US Children. Pediatrics 142. [DOI] [PMC free article] [PubMed] [Google Scholar]
- Kohls G, Perino MT, Taylor JM, Madva EN, Cayless SJ, Troiani V, Price E, Faja S, Herrington JD, and Schultz RT (2013). The nucleus accumbens is involved in both the pursuit of social reward and the avoidance of social punishment. Neuropsychologia 51, 2062–2069. [DOI] [PMC free article] [PubMed] [Google Scholar]
- Krashes MJ, Koda S, Ye C, Rogan SC, Adams AC, Cusher DS, Maratos-Flier E, Roth BL, and Lowell BB (2011). Rapid, reversible activation of AgRP neurons drives feeding behavior in mice. J Clin Invest 121, 1424–1428. [DOI] [PMC free article] [PubMed] [Google Scholar]
- Lau WKW, Leung M-K, and Lau BWM (2019). Resting-state abnormalities in Autism Spectrum Disorders: A meta-analysis. Scientific Reports 9, 3892. [DOI] [PMC free article] [PubMed] [Google Scholar]
- Lawrence KE, Hernandez LM, Bookheimer SY, and Dapretto M (2019). Atypical longitudinal development of functional connectivity in adolescents with autism spectrum disorder. Autism Res 12, 53–65. [DOI] [PMC free article] [PubMed] [Google Scholar]
- Lebow MA, and Chen A (2016). Overshadowed by the amygdala: the bed nucleus of the stria terminalis emerges as key to psychiatric disorders. Molecular Psychiatry 21, 450–463. [DOI] [PMC free article] [PubMed] [Google Scholar]
- Lein ES, Hawrylycz MJ, Ao N, Ayres M, Bensinger A, Bernard A, Boe AF, Boguski MS, Brockway KS, Byrnes EJ, et al. (2007). Genome-wide atlas of gene expression in the adult mouse brain. Nature 445, 168–176. [DOI] [PubMed] [Google Scholar]
- Leng G, and Ludwig M (2016). Intranasal Oxytocin: Myths and Delusions. Biol Psychiatry 79, 243–250. [DOI] [PubMed] [Google Scholar]
- Leslie RA, and James MF (2000). Pharmacological magnetic resonance imaging: a new application for functional MRI. Trends Pharmacol Sci 21, 314–318. [DOI] [PubMed] [Google Scholar]
- Levy DR, Tamir T, Kaufman M, Parabucki A, Weissbrod A, Schneidman E, and Yizhar O (2019). Dynamics of social representation in the mouse prefrontal cortex. Nature neuroscience. [DOI] [PubMed] [Google Scholar]
- Lewis EM, Stein-O’Brien GL, Patino AV, Nardou R, Grossman CD, Brown M, Bangamwabo B, Ndiaye N, Giovinazzo D, Dardani I, et al. (2020). Parallel Social Information Processing Circuits Are Differentially Impacted in Autism. Neuron 108, 659–675.e656. [DOI] [PMC free article] [PubMed] [Google Scholar]
- Liao P-Y, Chiu Y-M, Yu J-H, and Chen S-K (2020). Mapping Central Projection of Oxytocin Neurons in Unmated Mice Using Cre and Alkaline Phosphatase Reporter. Frontiers in Neuroanatomy 14. [DOI] [PMC free article] [PubMed] [Google Scholar]
- Liska A, Bertero A, Gomolka R, Sabbioni M, Galbusera A, Barsotti N, Panzeri S, Scattoni ML, Pasqualetti M, and Gozzi A (2018). Homozygous Loss of Autism-Risk Gene CNTNAP2 Results in Reduced Local and Long-Range Prefrontal Functional Connectivity. Cerebral cortex (New York, NY : 1991) 28, 1141–1153. [DOI] [PubMed] [Google Scholar]
- Lowbridge J, Manning M, Haldar J, and Sawyer WH (1977). Synthesis and some pharmacological properties of [4-threonine,7-glycine]oxytocin, [1-(L-2-hydroxy-3-mercaptopropanoic acid),4-threonine,7-glycine]oxytocin (hydroxy[thr4, gly7]oxytocin), and [7-glycine]oxytocin, peptides with high oxytocic-antidiuretic selectivity. J. Med. Chem 20, 120–123. [DOI] [PubMed] [Google Scholar]
- Ludwig M, and Leng G (2006). Dendritic peptide release and peptide-dependent behaviours. Nat Rev Neurosci 7, 126–136. [DOI] [PubMed] [Google Scholar]
- Lynch CJ, Uddin LQ, Supekar K, Khouzam A, Phillips J, and Menon V (2013). Default mode network in childhood autism: posteromedial cortex heterogeneity and relationship with social deficits. Biol Psychiatry 74, 212–219. [DOI] [PMC free article] [PubMed] [Google Scholar]
- Magnuson ME, Thompson GJ, Pan WJ, and Keilholz SD (2014). Time-dependent effects of isoflurane and dexmedetomidine on functional connectivity, spectral characteristics, and spatial distribution of spontaneous BOLD fluctuations. NMR Biomed 27, 291–303. [DOI] [PMC free article] [PubMed] [Google Scholar]
- Marlin BJ, Mitre M, D’Amour J A, Chao MV, and Froemke RC (2015). Oxytocin enables maternal behaviour by balancing cortical inhibition. Nature 520, 499–504. [DOI] [PMC free article] [PubMed] [Google Scholar]
- Menon R, Grund T, Zoicas I, Althammer F, Fiedler D, Biermeier V, Bosch OJ, Hiraoka Y, Nishimori K, Eliava M, et al. (2018). Oxytocin Signaling in the Lateral Septum Prevents Social Fear during Lactation. Curr Biol 28, 1066–1078 e1066. [DOI] [PubMed] [Google Scholar]
- Meyer-Lindenberg A, Domes G, Kirsch P, and Heinrichs M (2011). Oxytocin and vasopressin in the human brain: social neuropeptides for translational medicine. Nat Rev Neurosci 12, 524–538. [DOI] [PubMed] [Google Scholar]
- Mitre M, Marlin BJ, Schiavo JK, Morina E, Norden SE, Hackett TA, Aoki CJ, Chao MV, and Froemke RC (2016). A Distributed Network for Social Cognition Enriched for Oxytocin Receptors. The Journal of Neuroscience 36, 2517–2535. [DOI] [PMC free article] [PubMed] [Google Scholar]
- Mitre M, Minder J, Morina EX, Chao MV, and Froemke RC (2018). Oxytocin Modulation of Neural Circuits. Curr Top Behav Neurosci 35, 31–53. [DOI] [PMC free article] [PubMed] [Google Scholar]
- Moaddab M, Hyland BI, and Brown CH (2015). Oxytocin excites nucleus accumbens shell neurons in vivo. Molecular and Cellular Neuroscience 68, 323–330. [DOI] [PubMed] [Google Scholar]
- Nakajima M, Gorlich A, and Heintz N (2014). Oxytocin modulates female sociosexual behavior through a specific class of prefrontal cortical interneurons. Cell 159, 295–305. [DOI] [PMC free article] [PubMed] [Google Scholar]
- Newman SW (1999). The Medial Extended Amygdala in Male Reproductive Behavior A Node in the Mammalian Social Behavior Network. Annals of the New York Academy of Sciences 877, 242–257. [DOI] [PubMed] [Google Scholar]
- O’Connell LA, and Hofmann HA (2012). Evolution of a Vertebrate Social Decision-Making Network. Science 336, 1154–1157. [DOI] [PubMed] [Google Scholar]
- Oettl LL, Ravi N, Schneider M, Scheller MF, Schneider P, Mitre M, da Silva Gouveia M, Froemke RC, Chao MV, Young WS, et al. (2016). Oxytocin Enhances Social Recognition by Modulating Cortical Control of Early Olfactory Processing. Neuron 90, 609–621. [DOI] [PMC free article] [PubMed] [Google Scholar]
- Oh SW, Harris JA, Ng L, Winslow B, Cain N, Mihalas S, Wang Q, Lau C, Kuan L, Henry AM, et al. (2014). A mesoscale connectome of the mouse brain. Nature 508, 207–214. [DOI] [PMC free article] [PubMed] [Google Scholar]
- Owen SF, Tuncdemir SN, Bader PL, Tirko NN, Fishell G, and Tsien RW (2013). Oxytocin enhances hippocampal spike transmission by modulating fast-spiking interneurons. Nature 500, 458–462. [DOI] [PMC free article] [PubMed] [Google Scholar]
- Penagarikano O, Abrahams BS, Herman EI, Winden KD, Gdalyahu A, Dong H, Sonnenblick LI, Gruver R, Almajano J, Bragin A, et al. (2011). Absence of CNTNAP2 leads to epilepsy, neuronal migration abnormalities, and core autism-related deficits. Cell 147, 235–246. [DOI] [PMC free article] [PubMed] [Google Scholar]
- Penagarikano O, Lazaro MT, Lu XH, Gordon A, Dong H, Lam HA, Peles E, Maidment NT, Murphy NP, Yang XW, et al. (2015). Exogenous and evoked oxytocin restores social behavior in the Cntnap2 mouse model of autism. Science translational medicine 7, 271ra278. [DOI] [PMC free article] [PubMed] [Google Scholar]
- Ploeger GE, Willemen AP, and Cools AR (1991). Role of the nucleus accumbens in social memory in rats. Brain Res Bull 26, 23–27. [DOI] [PubMed] [Google Scholar]
- Poliak S, Gollan L, Martinez R, Custer A, Einheber S, Salzer JL, Trimmer JS, Shrager P, and Peles E (1999). Caspr2, a new member of the neurexin superfamily, is localized at the juxtaparanodes of myelinated axons and associates with K+ channels. Neuron 24, 1037–1047. [DOI] [PubMed] [Google Scholar]
- Poliak S, Salomon D, Elhanany H, Sabanay H, Kiernan B, Pevny L, Stewart CL, Xu X, Chiu SY, Shrager P, et al. (2003). Juxtaparanodal clustering of Shaker-like K+ channels in myelinated axons depends on Caspr2 and TAG-1. J Cell Biol 162, 1149–1160. [DOI] [PMC free article] [PubMed] [Google Scholar]
- Qin J, Feng M, Wang C, Ye Y, Wang PS, and Liu C (2009). Oxytocin receptor expressed on the smooth muscle mediates the excitatory effect of oxytocin on gastric motility in rats. Neurogastroenterol Motil 21, 430–438. [DOI] [PubMed] [Google Scholar]
- Quintana DS, Alvares GA, Hickie IB, and Guastella AJ (2015). Do delivery routes of intranasally administered oxytocin account for observed effects on social cognition and behavior? A two-level model. Neurosci Biobehav Rev 49, 182–192. [DOI] [PubMed] [Google Scholar]
- Quintana DS, Smerud KT, Andreassen OA, and Djupesland PG (2018). Evidence for intranasal oxytocin delivery to the brain: recent advances and future perspectives. Therapeutic Delivery 9, 515–525. [DOI] [PubMed] [Google Scholar]
- Raichle ME (2015). The brain’s default mode network. Annu Rev Neurosci 38, 433–447. [DOI] [PubMed] [Google Scholar]
- Renier N, Adams EL, Kirst C, Wu Z, Azevedo R, Kohl J, Autry AE, Kadiri L, Umadevi Venkataraju K, Zhou Y, et al. (2016). Mapping of Brain Activity by Automated Volume Analysis of Immediate Early Genes. Cell 165, 1789–1802. [DOI] [PMC free article] [PubMed] [Google Scholar]
- Riga D, Matos MR, Glas A, Smit AB, Spijker S, and Van den Oever MC (2014). Optogenetic dissection of medial prefrontal cortex circuitry. Front Syst Neurosci 8, 230. [DOI] [PMC free article] [PubMed] [Google Scholar]
- Ruzzo EK, Perez-Cano L, Jung JY, Wang LK, Kashef-Haghighi D, Hartl C, Singh C, Xu J, Hoekstra JN, Leventhal O, et al. (2019). Inherited and De Novo Genetic Risk for Autism Impacts Shared Networks. Cell 178, 850–866.e826. [DOI] [PMC free article] [PubMed] [Google Scholar]
- Schindelin J, Arganda-Carreras I, Frise E, Kaynig V, Longair M, Pietzsch T, Preibisch S, Rueden C, Saalfeld S, Schmid B, et al. (2012). Fiji: an open-source platform for biological-image analysis. Nat Methods 9, 676–682. [DOI] [PMC free article] [PubMed] [Google Scholar]
- Scott R, Sanchez-Aguilera A, van Elst K, Lim L, Dehorter N, Bae SE, Bartolini G, Peles E, Kas MJH, Bruining H, et al. (2019). Loss of Cntnap2 Causes Axonal Excitability Deficits, Developmental Delay in Cortical Myelination, and Abnormal Stereotyped Motor Behavior. Cerebral cortex (New York, NY : 1991) 29, 586–597. [DOI] [PubMed] [Google Scholar]
- Scott-Van Zeeland AA, Dapretto M, Ghahremani DG, Poldrack RA, and Bookheimer SY (2010). Reward processing in autism. Autism Res 3, 53–67. [DOI] [PMC free article] [PubMed] [Google Scholar]
- Selimbeyoglu A, Kim CK, Inoue M, Lee SY, Hong ASO, Kauvar I, Ramakrishnan C, Fenno LE, Davidson TJ, Wright M, et al. (2017). Modulation of prefrontal cortex excitation/inhibition balance rescues social behavior in CNTNAP2-deficient mice. Science Translational Medicine 9, eaah6733. [DOI] [PMC free article] [PubMed] [Google Scholar]
- Smith SM, Jenkinson M, Woolrich MW, Beckmann CF, Behrens TE, Johansen-Berg H, Bannister PR, De Luca M, Drobnjak I, Flitney DE, et al. (2004). Advances in functional and structural MR image analysis and implementation as FSL. Neuroimage 23 Suppl 1, S208–219. [DOI] [PubMed] [Google Scholar]
- Smith SM, Vidaurre D, Beckmann CF, Glasser MF, Jenkinson M, Miller KL, Nichols TE, Robinson EC, Salimi-Khorshidi G, Woolrich MW, et al. (2013). Functional connectomics from resting-state fMRI. Trends Cogn Sci 17, 666–682. [DOI] [PMC free article] [PubMed] [Google Scholar]
- Spreckelmeyer KN, Krach S, Kohls G, Rademacher L, Irmak A, Konrad K, Kircher T, and Gründer G (2009). Anticipation of monetary and social reward differently activates mesolimbic brain structures in men and women. Social Cognitive and Affective Neuroscience 4, 158–165. [DOI] [PMC free article] [PubMed] [Google Scholar]
- Stafford JM, Jarrett BR, Miranda-Dominguez O, Mills BD, Cain N, Mihalas S, Lahvis GP, Lattal KM, Mitchell SH, David SV, et al. (2014). Large-scale topology and the default mode network in the mouse connectome. Proceedings of the National Academy of Sciences of the United States of America 111, 18745–18750. [DOI] [PMC free article] [PubMed] [Google Scholar]
- Stanley DA, and Adolphs R (2013). Toward a neural basis for social behavior. Neuron 80, 816–826. [DOI] [PMC free article] [PubMed] [Google Scholar]
- Starck T, Nikkinen J, Rahko J, Remes J, Hurtig T, Haapsamo H, Jussila K, Kuusikko-Gauffin S, Mattila ML, Jansson-Verkasalo E, et al. (2013). Resting state fMRI reveals a default mode dissociation between retrosplenial and medial prefrontal subnetworks in ASD despite motion scrubbing. Front Hum Neurosci 7, 802. [DOI] [PMC free article] [PubMed] [Google Scholar]
- Steinman MQ, Duque-Wilckens N, and Trainor BC (2019). Complementary Neural Circuits for Divergent Effects of Oxytocin: Social Approach Versus Social Anxiety. Biol Psychiatry 85, 792–801. [DOI] [PMC free article] [PubMed] [Google Scholar]
- Strauss KA, Puffenberger EG, Huentelman MJ, Gottlieb S, Dobrin SE, Parod JM, Stephan DA, and Morton DH (2006). Recessive symptomatic focal epilepsy and mutant contactin-associated protein-like 2. The New England journal of medicine 354, 1370–1377. [DOI] [PubMed] [Google Scholar]
- Supekar K, Kochalka J, Schaer M, Wakeman H, Qin S, Padmanabhan A, and Menon V (2018). Deficits in mesolimbic reward pathway underlie social interaction impairments in children with autism. Brain 141, 2795–2805. [DOI] [PMC free article] [PubMed] [Google Scholar]
- Takumi T, Tamada K, Hatanaka F, Nakai N, and Bolton PF (2019). Behavioral neuroscience of autism. Neurosci Biobehav Rev. [DOI] [PubMed] [Google Scholar]
- Tang Y, Benusiglio D, Lefevre A, Hilfiger L, Althammer F, Bludau A, Hagiwara D, Baudon A, Darbon P, Schimmer J, et al. (2020). Social touch promotes interfemale communication via activation of parvocellular oxytocin neurons. Nat Neurosci 23, 1125–1137. [DOI] [PubMed] [Google Scholar]
- van Rooij D, Anagnostou E, Arango C, Auzias G, Behrmann M, Busatto GF, Calderoni S, Daly E, Deruelle C, Di Martino A, et al. (2018). Cortical and Subcortical Brain Morphometry Differences Between Patients With Autism Spectrum Disorder and Healthy Individuals Across the Lifespan: Results From the ENIGMA ASD Working Group. Am J Psychiatry 175, 359–369. [DOI] [PMC free article] [PubMed] [Google Scholar]
- Vanderschuren LJ, Achterberg EJ, and Trezza V (2016). The neurobiology of social play and its rewarding value in rats. Neurosci Biobehav Rev 70, 86–105. [DOI] [PMC free article] [PubMed] [Google Scholar]
- Walsh JJ, Christoffel DJ, Heifets BD, Ben-Dor GA, Selimbeyoglu A, Hung LW, Deisseroth K, and Malenka RC (2018). 5-HT release in nucleus accumbens rescues social deficits in mouse autism model. Nature 560, 589–594. [DOI] [PMC free article] [PubMed] [Google Scholar]
- Walum H, and Young LJ (2018). The neural mechanisms and circuitry of the pair bond. Nat Rev Neurosci 19, 643–654. [DOI] [PMC free article] [PubMed] [Google Scholar]
- Wang Q, Ding S-L, Li Y, Royall J, Feng D, Lesnar P, Graddis N, Naeemi M, Facer B, Ho A, et al. (2020). The Allen Mouse Brain Common Coordinate Framework: A 3D Reference Atlas. Cell 181, 936–953.e920. [DOI] [PMC free article] [PubMed] [Google Scholar]
- Woolrich MW, Ripley BD, Brady M, and Smith SM (2001). Temporal Autocorrelation in Univariate Linear Modeling of FMRI Data. NeuroImage 14, 1370–1386. [DOI] [PubMed] [Google Scholar]
- Woolrich MW, Behrens TEJ, Beckmann CF, Jenkinson M, and Smith SM (2004). Multilevel linear modelling for FMRI group analysis using Bayesian inference. NeuroImage 21, 1732–1747. [DOI] [PubMed] [Google Scholar]
- Wu Z, Xu Y, Zhu Y, Sutton AK, Zhao R, Lowell BB, Olson DP, and Tong Q (2012). An obligate role of oxytocin neurons in diet induced energy expenditure. PLoS One 7, e45167. [DOI] [PMC free article] [PubMed] [Google Scholar]
- Yang Y, and Wang J-Z (2017). From Structure to Behavior in Basolateral Amygdala-Hippocampus Circuits. Frontiers in Neural Circuits 11. [DOI] [PMC free article] [PubMed] [Google Scholar]
Associated Data
This section collects any data citations, data availability statements, or supplementary materials included in this article.
Supplementary Materials
Data Availability Statement
All data reported in this paper will be shared by the lead contact upon request.
This paper does not report original code.
Any additional information required to reanalyze the data reported in this paper is available from the lead contact upon request.