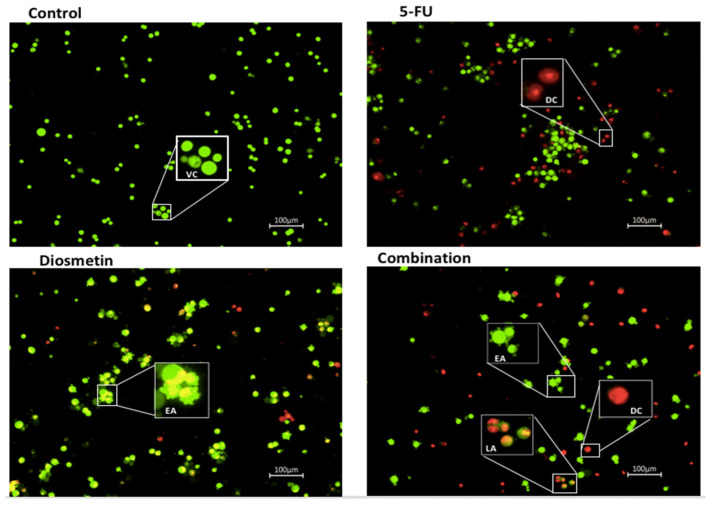
Figure 11.
HCT116 cells stained with AO/PI after 72 h of treatment with the IC50 of monotherapy and combination therapy. The control group remained untreated. VC: viable cells (green), EA: early apoptosis (green cells with blebbing), LA: late apoptosis (orange), DC: dead cells (red). 10× magnification.

