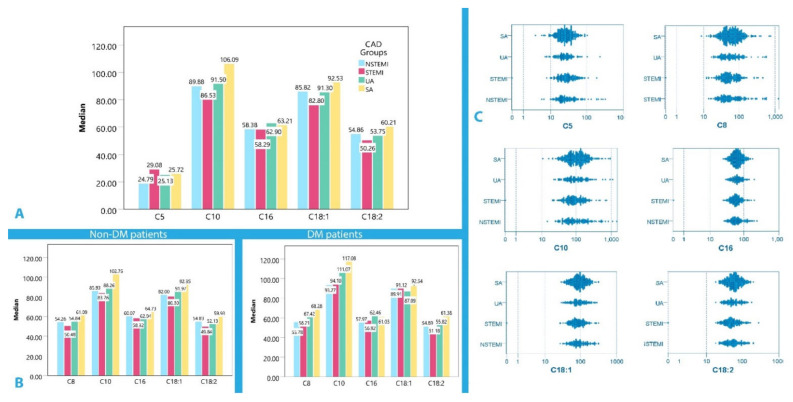
Figure 1.
(A) Box plot with the respective medians for each of the important acylcarnitines for the CAD groups, (B) Box plot with the respective medians for each of the important acylcarnitines for the CAD groups in DM and non-DM patients, (C) ACS vs. CCS 2-D log scaled plots for C5, C8, C10, C16, C18:1, and C18:2 level distributions.

