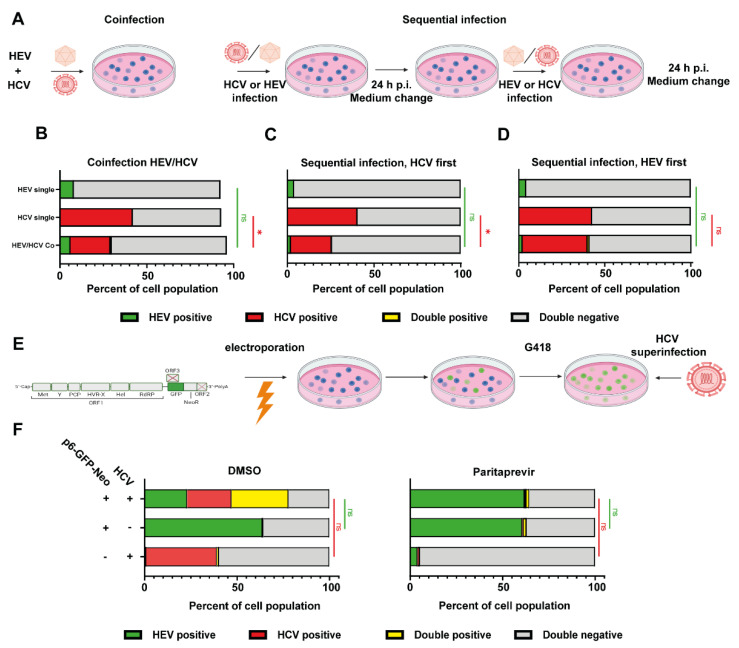
Figure 5.
Co-infection and sequential super-infection with HCVcc and HEVcc. (A) Schematic representation of experimental setup for panels (B–D): Huh7.5 cells were co-infected with HEVcc (based on Kernow-C1 p6 strain) and HCVcc (based on Jc1). HEV and HCV inoculum were incubated on the cells for 24 h, either together (B), or sequentially (C,D). Four days post infection, cells were analyzed with immunofluorescence against HEV capsid protein ORF2. The number of foci was manually counted. Depicted are mean percentage ± SD of positive cells from three independent experiments for HEV, HCV, none or both as determined via image analysis with Cell Profiler. (Two-way ANOVA with Tukey’s multiple comparison test on normalized infection events). (E) Schematic representation of experimental setup for panel (F): Huh7.5 hepatoma cells were transfected with a HEV subgenomic GFP-reporter replicon comprised of all non-structural proteins of HEV Kernow-C1 p6. Cells were selected and maintained analogous to Huh7 Lunet sg/neo cells. (F) Five days after super-infection with HCV, the cells were analyzed by immunofluorescence. Graphs show mean percentage of positive cells ± SD of three independent experiments for HEV, HCV, none or both as determined via image analysis with Cell Profiler. Cells were treated with DMSO or 10 µM paritaprevir. Treatment was started 4 h post electroporation. (Two-way ANOVA with Tukey’s multiple comparison test on normalized infection events). * = p value < 0.05.

