. 2022 Mar 8;11:e75568. doi: 10.7554/eLife.75568

Figure 5. The nanodisc environment and visualization of lipids in a crevice of the transmembrane domain (TMD).

(A) Top: central slice of the side view of the RyR1-ACP/Ca2+A open and RyR1-ACP/Ca2+A-inactivated cryogenic electron microscopy cryo-EM maps highlighting the density corresponding to the upper and lower nanodisc belts. Bottom: corresponding views seen from the cytoplasmic direction. For clarity, the nanodisc density (green) was extracted and low-pass filtered to 7 Å resolution. The top belt of the nanodisc expands slightly to accommodate the conformational change; see also Figure 5—video 1. (B) Side and luminal views of the TMD of RyR1-ACP/Ca2+A inactivated with putative lipid densities shown in blue. (C) Lipid-binding pocket of RyR1-ACP/Ca2+A inactivated lined by lipophilic amino acids from S3 and S4 of the voltage sensor-like domain (S1–S4; yellow) and core helices S5 and S6 (cyan) from two different protomers. Amino acids within 5 Å from the lipids are shown (sticks) with their corresponding side chain densities. Densities corresponding to the lipids contoured at 8σ (in blue) are modeled as a PC (16:0-11:0) for lipid 1 and a 16C acyl chain for lipid 2. (D) Molecular lipophilicity potential of the surface lining the crevice, ranging from hydrophilic (cyan) to hydrophobic (golden). The hydrophobic tails of the lipids are shown in blue, and the negative electrostatic surface potential of the polar lipid head is shown in red.

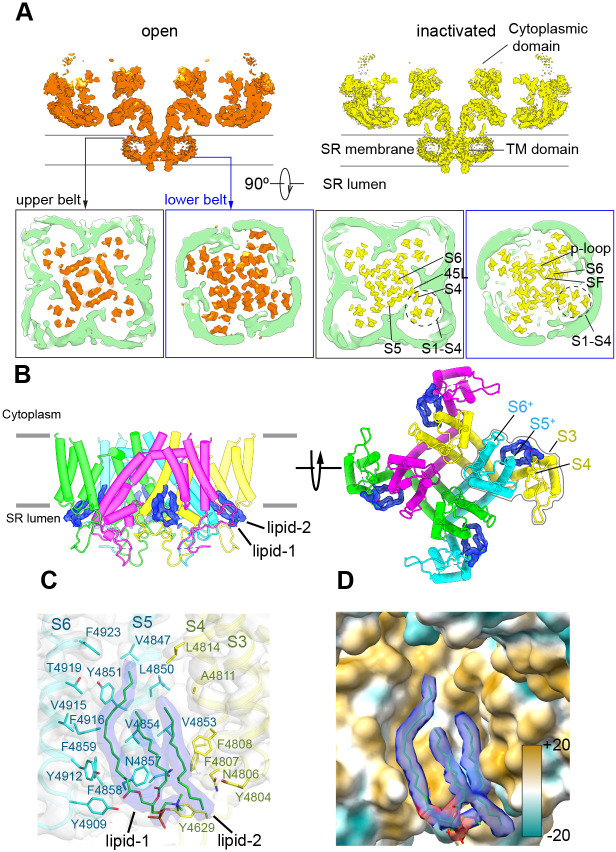
Figure 5.

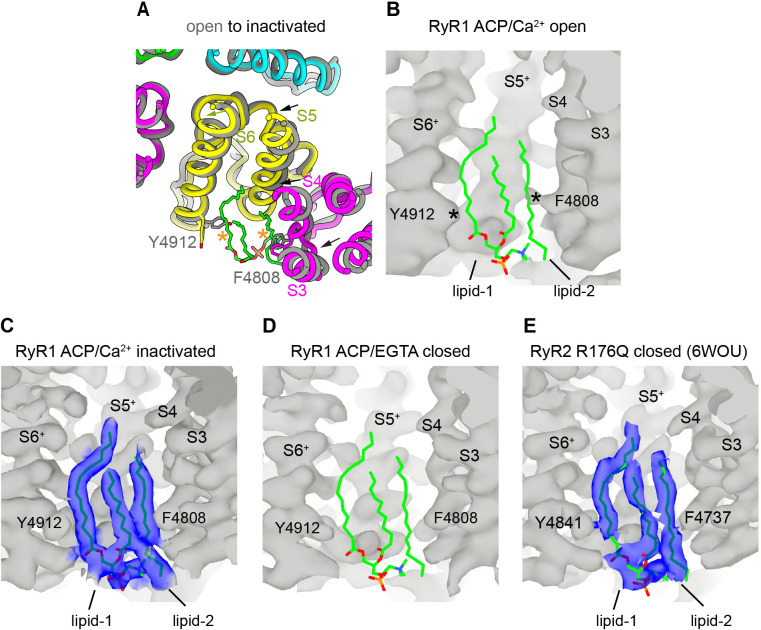
Figure 5—figure supplement 1. Lipid-binding pocket lined by the S3/S4 and S5+/S6+ helices in inactivated and closed structures of RyR suggests a conserved functional site.

Figure 5—figure supplement 1.

(A) Cytoplasmic fourfold view of part of the transmembrane domain (TMD) showing the movement of the transmembrane helices S3, S4, and S5 (arrows) into the lipid pocket while transitioning from RyR1-ACP/Ca2+ open to inactivated conformations. No ordered lipids were observed in the open channel. Each subunit is displayed with a different color. (B) Side view of the lipophilic pocket in RyR1-ACP/Ca2+ open with overlaid lipid backbone extracted from the RyR1-ACP/Ca2+-inactivated conformation, showing expected steric hindrance of lipid 1 and lipid 2 with S6 and S4, respectively, as indicated with asterisks. See also Figure 6A, bottom panels. (C) Side view of RyR1-ACP/Ca2+ inactivated with resolved lipids. (D) Side view of the lipophilic pocket in RyR1-ACP/EGTA, with lower resolution but foreseeable lack of steric hindrance between protein and lipids. Overlaid lipid backbones are extracted from the inactivated conformation. (E) Side view of the lipophilic pocket in RyR2 closed at 3.27 Å resolution (PDB ID: 6WOU; Iyer et al., 2020) with lipids resolved in a comparable conformation to that found for RyR1 inactivated. Corresponding residues of interest are indicated. The + sign indicates transmembrane helices of the neighboring subunit.
Figure 5—video 1. Gating-induced conformational changes in nanodisc.
Download video file (2.2MB, mp4)
Conformational change in upper nanodisc belt while morphing from RyR1-ACP/Ca2+ inactivated to open conformations. The nanodisc can be seen expanding when transitioning to the open state. Volumes are low pass filtered and helices are displayed at a higher threshold for better visualization.