

Summary
Background
Serum ferritin concentrations are the most widely used indicator for iron deficiency. WHO determined that insufficient data are available to revise the serum ferritin thresholds of less than 12 μg/L for children and less than 15 μg/L for women, which were developed on the basis of expert opinion, to define iron deficiency. We aimed to derive new physiologically based serum ferritin concentration thresholds for iron deficiency in healthy young children and non-pregnant women using data from the US National Health and Nutrition Examination Survey (NHANES).
Methods
In this serial cross-sectional study, we examined the relationship of serum ferritin with two independent indicators of iron-deficient erythropoiesis, haemoglobin and soluble transferrin receptor (sTfR), in children (12–59 months) and non-pregnant women (15–49 years) using cross-sectional NHANES data from 2003–06, 2007–10, and 2015–18. NHANES is a US national stratified multistage probability sample that includes a household interview followed by a standardised physical examination in a mobile examination centre. We excluded individuals with missing serum ferritin, sTfR, haemoglobin, or white blood cell counts measurements; non-pregnant women with missing C-reactive protein (CRP), alanine aminotransferase (ALT) or aspartate aminotransferase (AST) data were also excluded. In addition, individuals with infection (white blood cell counts >10·0×109/L) and non-pregnant women with possible liver disease (ALT >70 IU/L or AST >70 IU/L) and inflammation (CRP >5·0 mg/L) were excluded. We examined distributions of haemoglobin and sTfR with serum ferritin and used restricted cubic spline regression models to determine serum ferritin thresholds for iron-deficient erythropoiesis.
Findings
5964 children and 10 462 non-pregnant women had physical examinations and were screened for inclusion in the study, of whom 2569 (43·1%) children and 7498 (71·7%) non-pregnant women were included. At lower serum ferritin concentrations, median haemoglobin concentration decreased as sTfR concentration increased, with each varying in a curvilinear manner. Using restricted cubic spline plateau points to determine the onset of iron-deficient erythropoiesis, the serum ferritin thresholds identified by haemoglobin and sTfR concentrations were not different. For children, the haemoglobin identified serum ferritin threshold was 19·9 μg/L (95% CI 18·8–22·6) and the sTfR identified serum ferritin threshold was 20·0 μg/L (19·4–20·9; p=0·89). For women the haemoglobin identified serum ferritin threshold was 25·2 μg/L (24·2–26·2) and the sTfR identified serum ferritin threshold was 24·0 μg/L (23·3–24·6; p=0·05).
Interpretation
The association between two independent indicators of iron-deficient erythropoiesis, haemoglobin and sTfR, identified serum ferritin concentration thresholds of about 20 μg/L for children and 25 μg/L for non-pregnant women, providing physiological evidence of potential new thresholds for consideration when determining the prevalence and distribution of iron deficiency in populations. In healthy children and non-pregnant women, physiologically based thresholds for iron deficiency might be more clinically and epidemiologically relevant than those based on expert opinion. Validation of this physiologically based approach in non-US populations might help the international harmonisation of serum ferritin thresholds for iron deficiency.
Funding
None.
Introduction
In 2020, WHO published guidelines for the use of serum ferritin concentrations to assess iron status in individuals and populations.1 After comprehensive systematic reviews of available data, methods, and literature, WHO concluded that serum ferritin concentration was a good marker of iron stores and should be used to diagnose iron deficiency in apparently healthy individuals.1 Nevertheless, WHO judged that the available studies were not sufficient to justify a change in current ferritin cutoff values to define iron deficiency.1 WHO acknowledged that these unrevised thresholds for serum ferritin are based on qualitative expert opinion, not on published data.1
A potential alternative method of determining serum ferritin thresholds for iron deficiency is the use of physiological indicators of iron deficiency in data from healthy populations. Decreases in serum ferritin concentrations are associated with reductions in body iron stores as iron depletion develops. With the onset of iron-deficient erythropoiesis, body iron stores are no longer sufficient to supply the amounts of iron needed for the synthesis of haemoglobin and other functional iron compounds, but additional decreases in serum ferritin do not provide a measure of the degree of iron deficiency.2–5 As iron deficiency becomes more severe, the haemoglobin concentration progressively declines. Iron deficiency anaemia is identified when haemoglobin falls beneath the population standard used to differentiate non-anaemic from anaemic states. In the US National Health and Nutrition Examination Survey (NHANES), two physiological indicators of the onset of iron-deficient erythropoiesis were measured: circulating haemoglobin concentration and soluble transferrin receptor (soluble transferrin receptor 1; sTfR) concentration.
In an otherwise healthy individual, when iron-deficient erythropoiesis develops the haemoglobin concentration decreases as the amount of available iron becomes insufficient to support haemoglobin synthesis. sTfR concentration is an indicator of iron-deficient erythropoiesis that is independent of haemoglobin concentration.2,4,6–8 As iron-deficient erythropoiesis develops, erythroid progenitors and other iron-requiring cells in the body increase the expression of cellular transferrin receptor 1 to secure more iron. Plasma sTfR is an extracellular fragment of cellular transferrin receptor that is shed into plasma, providing a measure of total body mass of cellular transferrin receptor.2,4,6–8 Approximately 80% of plasma sTfR is derived from erythroid marrow and, in the absence of iron deficiency, the concentration is proportional to the mass of the erythroid marrow. In the absence of erythroid hyperplasia, plasma sTfR concentrations are proportional to cellular iron demand and provide a sensitive, quantitative measure of the earliest stage of iron deficiency: iron-deficient erythropoiesis. The serum ferritin concentration at which the haemoglobin concentration begins to decline and sTfR begins to rise provides a physiological basis for identifying the onset of iron-deficient erythropoiesis.2,4,6–8
In an otherwise healthy population, we hypothesise that the serum ferritin concentration threshold at which the median haemoglobin concentration begins to decline identifies the concentration of body iron at which iron-deficient erythropoiesis begins. Similarly, the threshold at which the median sTfR begins to increase is an independent indicator of the onset of iron-deficient erythropoiesis.
The overall goal of our study is to develop a physiologically based method to determine thresholds for iron deficiency using data without other common causes of anaemia that are independent of iron deficiency. No nationally representative data from the healthy US population are available. However, serum ferritin, haemoglobin, and sTfR have been measured cross-sectionally in NHANES for several years in two groups at-risk of iron deficiency: children (12–59 months) and women of child-bearing age (15–49 years). The continuous high-quality data from NHANES using standardised laboratory analyses, in conjunction with the additional available information about health conditions of the participants, allows the exclusion of data from individuals with other common causes of anaemia at the population level that are independent of iron deficiency. However, NHANES data cannot be used to make nationally representative estimates of the healthy US population. Therefore, we aimed to define and use the children and non-pregnant women belonging to this subsample of NHANES data as an apparently healthy sample. Analysis of this apparently healthy subsample provides an opportunity to examine the relationship between serum ferritin, haemoglobin, and sTfR in children and non-pregnant women. We examined the distributions of serum ferritin, haemoglobin, and sTfR concentrations. We then used restricted cubic spline analysis to identify the serum ferritin threshold corresponding to the onset of iron-deficient erythropoiesis.
Methods
Study design and participants
In this serial cross-sectional study we assessed subpopulations of children and women from the NHANES. NHANES is a multipurpose survey designed to assess health and nutritional status of adults and children in the USA. NHANES is a continuous survey (1999–present) that includes a household interview followed by a standardised physical examination in a mobile examination centre.9 NHANES, done by the National Center for Health Statistics (NCHS; Hyattsville, MD, USA), relies on a stratified multistage probability sample that is based on the selection of counties, blocks, households, and persons within households to represent the civilian, non-institutionalised US population.9
NHANES measured serum ferritin and sTfR concentrations from 2003–10 and from 2015–18, but not from 2011–2014. For this analysis, we combined data from 2003–06, 2007–10, and 2015–18.9–15 We restricted our study sample to children (12–59 months) and non-pregnant women of child-bearing age (15–49 years) who received physical examinations in the mobile examination centres. We excluded individuals with missing serum ferritin, sTfR, haemoglobin, or white blood cell counts measurements; non-pregnant women with missing C-reactive protein (CRP), alanine aminotransferase (ALT) or aspartate aminotransferase (AST) data were also excluded. In addition, individuals with infection (white blood cell counts >10·0 × 109/L) and non-pregnant women with possible liver disease (ALT >70 IU/L or AST >70 IU/L)16 and inflammation (CRP >5·0 mg/L).17 The WHO cutoff for severe risk of iron overload is a serum ferritin concentration of more than 150 μg/L for women and girls older than 5 years,1 thus children and non-pregnant women who met this criterion were excluded. We then identified an apparently healthy subsample using NHANES available data to exclude individuals with other common causes of anaemia at the population level that are independent of iron deficiency, namely children with an indicator of infection and women of childbearing age with indicators of infection, inflammation, or liver disease.
Ethics approval was obtained from the NCHS Ethics Review Board and written informed consent was obtained from participants aged 12 years and older. Parental consent was obtained for those younger than 18 years.
Procedures
NHANES measured serum ferritin, sTfR, haemoglobin, CRP, alanine aminotransferase, and aspartate aminotransferase concentrations during 2003–10 and 2015–18.9–15 Serum ferritin, sTfR, and haemoglobin concentrations were measured for both children (12–59 months) and non-pregnant women (15–49 years), but CRP was measured only for participants aged 3 years and older during 2007–10 and aged 1 year and older during 2003–06 and 2015–18. Alanine aminotransferase and aspartate aminotransferase were measured only for participants aged 12 years and older during 2003–10 and 2015–18.9–15 During the years, various laboratories and assay methods were used for the sample analysis. Due to method changes between different assays, crossover studies were done by the NHANES group to compare the data, and adjustments were made accordingly based on the comparison before the data release to public.9–15
Serum ferritin concentration was measured by three methods during 2003–10 and 2015–18. In 2003, a single-incubation two-site immunoradiometric assay (BioRad Laboratories, Hercules, CA, USA) was used. This assay was discontinued by the manufacturer in early 2004, and serum ferritin concentration was measured in 2004–08 by the Roche Tina-quant serum ferritin immunoturbidimetric assay on the Hitachi 912 clinical analyser (Roche Diagnostics, Basel, Switzerland).10–15 Because of method differences between the BioRad and Roche SF assays, concentrations obtained for 2003 samples using the BioRad assay had to be statistically adjusted so that they could be compared with those obtained with the Roche assay. This was done before data release by NCHS by applying three piecewise linear regression equations described in detail elsewhere.10 The Hitachi 912 clinical analyser was discontinued by the manufacturer in 2009 so the Roche Elecsys 170 clinical analyser was used for the measurement of serum ferritin concentrations in 2009–10 and 2015–18.12–15 A crossover study was done to compare the 2009–10 SF data to the 2007–08 SF data. A deming regression analysis was done, and the following regression was obtained for serum ferritin (μg/mL) E170=10**(0·989*Log10(Hitachi 912) + 0·049).12 For our analyses, we converted the 2009–10 data and 2015–18 data from E170 to Hitachi 912 to allow accurate comparison with the 2003–08 data.
Haemoglobin concentration was measured as part of a complete blood count in the mobile examination centres with the Beckman Coulter MAXM hematology flow cytometer (Beckman Coulter, Fullerton, CA, USA) during 2003–12, then switched to the Beckman Coulter Unicel DxH 800 analyser after 2013.10–15 We used the original haemoglobin data without adjustment for altitude (data unavailable) or smoking status in women. Anaemia was defined as a haemoglobin concentration less than 11·0 g/dL for children and less than 12·0 g/dL for non-pregnant women.18 Complete blood counts that included white blood cell counts were measured in the NHANES mobile examination centres using the Beckman Coulter MAXM instrument to provide a distribution of blood cells for all participants.10–15
sTfR concentrations were measured at the National Center of Environmental Health, Centre for Disease Control and Prevention10–15 for NHANES 2003–10 and 2015–18. The Tina-quant sTfR assay (Roche Diagnostics, Mannheim, Germany) is an automated homogeneous immunoturbidimetric assay.19 There were no changes to the laboratory method or laboratory site, but the assay was done on three chemistry analysers (all manufactured by Roche Diagnostics): first on the Hitachi 912 (NHANES 2003–08), then on the Hitachi Mod P (NHANES 2009–10 and 2015), and finally on Roche c501 analyzers (NHANES 2016–18). The results from the three instruments were similar and no adjustment was needed.14 We used the thresholds generated from NHANES 2003–10 and defined sTfR concentrations of more than 5·33 mg/L as a threshold for iron deficiency in children and sTfR concentrations of more than 6·00 mg/L in non-pregnant women.20
CRP was measured at the University of Washington, Seattle, WA, USA, by latex enhanced nephelometry (Dade Behring, Deerfield, IL, USA) for NHANES 2003–10.10–13 However, in 2015–16, high-sensitivity CRP (HS-CRP) was measured at the Collaborative Laboratory Services (Ottumwa, IA, USA).14 HS-CRP was measured on the Beckman Coulter UniCel DxC 600 Synchron from 2015 to mid-2016 and the Beckman Coulter UniCel DxC 660i Synchron Access chemistry analysers after mid-2016; the results from two instruments did not need adjustment for accurate comparison.14 In 2017–18, HS-CRP was measured at the University of Minnesota, Advanced Research Diagnostics Laboratory (Minneapolis, MN, USA) with Roche Cobas 6000 chemistry analyser for the entire 2017–18 cycle.15 To account for the method and instrument changes, a regression analysis was done, and the following regression was obtained for HS-CRP (mg/L) Y (DxC 660i)=1·150 * X (Cobas 6000) – 0·3397.13 For our purpose, we converted the 2017–18 data from Cobas 6000 to DxC 660i to enable accurate comparison with the data from 2015–16.
Both alanine aminotransferase and aspartate aminotransferase are part of the standard biochemistry profile that was measured in the Collaborative Laboratory Services in Ottumwa (IA, USA) with the Beckman Synchron LX20 for data 2003–06. From 2007, alanine aminotransferase and aspartate aminotransferase were measured at Collaborative Laboratory Services laboratory using a Beckman Synchron LX20 for NHANES 2007–10 and Beckman UniCel DxC800 Synchron for NHANES 2015–16,10–14 and measured at the University of Minnesota Advanced Research Diagnostics Laboratory with the Roche Cobas 6000 (c501 module) analyser for NHANES 2017–18.13 Backward equations were used to adjust NHANES 2017–18 alanine aminotransferase and aspartate aminotransferase data to allow accurate comparison with the 2003–16 data.15
Statistical analysis
We assessed whether the characteristics differed between children or non-pregnant women that were eligible for inclusion and those with missing data using χ2 or t-tests (p<0·05; two tailed). For the included data, we visually examined serum ferritin distributions reported by NHANES in children (12–59 months) and non-pregnant women (15–49 years) because previous studies suggested that the serum ferritin distribution has a typically right-skewed distribution in these two groups.1 We log-transformed serum ferritin [log10(ferritin)] data to normalise distributions, calculated geometric means and 95% CIs, and described serum ferritin distributions by sociodemographic characteristics using SUDAAN (version 11.0.1) with sample exam weights (appendix p 1). Regarding sociodemographic characteristics, the poverty to income ratio reflects family income relative to the annual poverty threshold for household size. Within a group, the unadjusted and adjusted geometric means could be significantly different (p<0·05; two-tailed t-test); a Bonferroni adjustment was used to correct the p values for the significance test for the multiple comparisons across each sociodemographic characteristic in serum ferritin. Using exploratory data analysis techniques21 with R (version 4.0.2), we examined monotonic relationships between haemoglobin and serum ferritin, and between sTfR and serum ferritin using a scattergram superimposed with a plot of concentrations of median haemoglobin and median sTfR according to categories of serum ferritin concentrations for women (1 μg/L) and for children (5 μg/L). The category range was larger in children because of the smaller sample size. Restricted cubic spline regression models with five knots22 were used to examine the relationship of continuous serum ferritin with haemoglobin and continuous serum ferritin with sTfR for both children and non-pregnant women to identify potential serum ferritin thresholds for iron deficiency. We used two complementary analyses. For haemoglobin as our outcome variable, we modelled haemoglobin association with serum ferritin to identify the serum ferritin concentration at the haemoglobin plateau. To ascertain the consistency of this derived serum ferritin threshold, we modelled serum ferritin against sTfR and identified the serum ferritin concentration at the sTfR minima. Using the fitted function of these two separate restricted cubic splines, we solved the ordinary differential equation derivative solutions at the plateau or minima of each model in serum ferritin units. The restricted cubic spline analysis was repeated after stratification of the NHANES data by three 4-year periods (2003–06, 2007–10, and 2015–18) for children and non-pregnant women to examine variation or trends over the survey years. We calculated the restricted cubic spline model derivative solutions (ie, effect size) for each 4-year block. We tested for paired (ie, 2003–2006 vs 2007–2010; 2003–2006 vs 2015–2018; and 2007–2010 vs 2015–2018) and 3-way differences in effect size (effect size2003–06=effect size2007–10=effect size2015–18; p<0·05) using random-effect meta-analyses with 1 and 2 degrees of freedom, treating each 4-year block as an independent sample.23,24 Additionally, using the full NHANES serum ferritin and haemoglobin data (without exclusions to create the healthy populations), we calculated the prevalence of iron deficiency and iron deficiency anaemia using both the current WHO and the new physiologically based thresholds.
Role of the funding source
There was no funding source for this study.
Results
5964 children and 10 462 non-pregnant women had physical examinations and were screened for inclusion in the study, of whom 2569 (43·1%) children and 7498 (71·7%) non-pregnant women were included (figure 1). The proportion of children excluded due to missing serum ferritin data was not significantly different by race and ethnicity or sex, but they were significantly different by age (data not shown). Children and women aged 15–19 years, were more likely than older participants to be excluded due to missing serum ferritin data (p<0·0096). The amount of serum collected was smallest for the youngest age group (12–35 months) and increases with age group up to participants aged 12 years and older (data not shown). Due to assay prioritisation, participants with smaller specimen volume were more likely to miss a lower priority assay for NHANES, such as serum ferritin, which explains the higher percentage of missing serum ferritin results in children 12–59 months, but not in adolescents or adults. Missing data seemed to be distributed randomly, with no systematic bias identified.
Figure 1: Study profile.
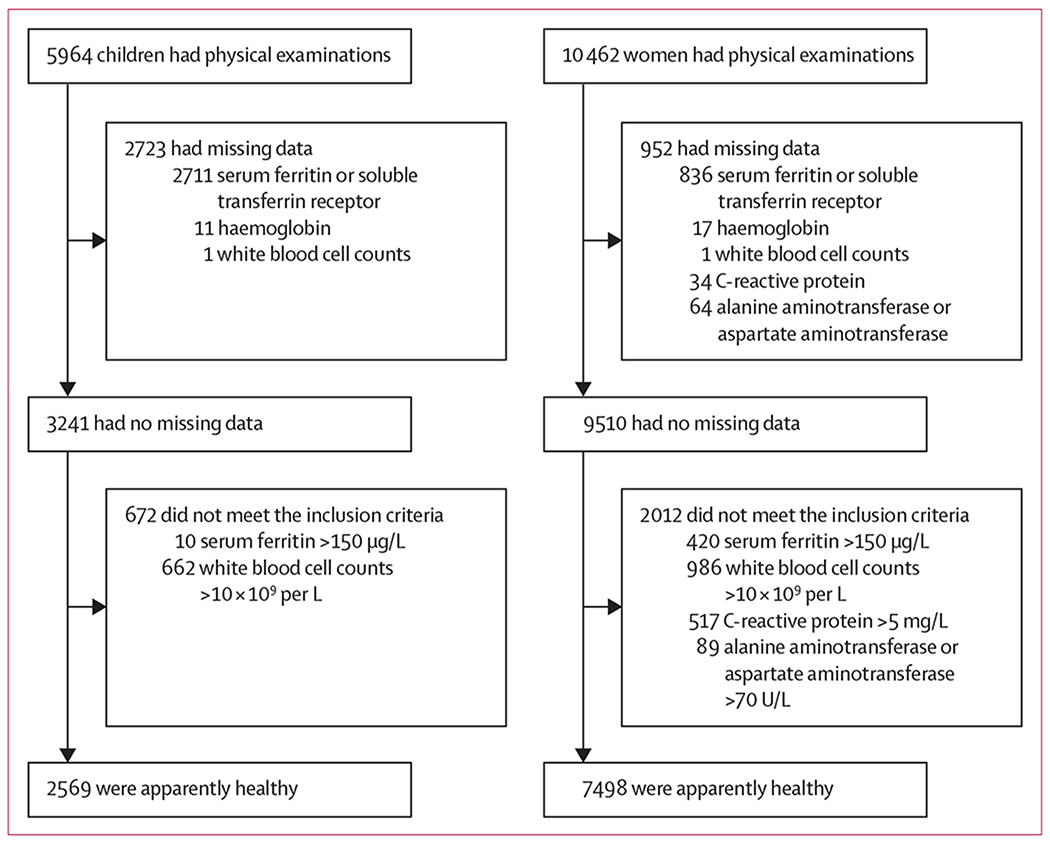
Flowchart of the selection of a healthy US-subpopulation of children (12–59 months) and non-pregnant women (15–49 years) participating in the National Health and Nutrition Examination Survey 2003–10 and 2015–18.
Geometric mean serum ferritin concentrations for children are shown in table 1 and geometric mean concentration for women are shown in table 2, with additional characterisation of the distributions in the appendix (pp 1–2).
Table 1:
Serum ferritin concentrations in a healthy population of US children
| Children | Unadjusted geometric mean (95% CI)* | Adjusted geometric mean (95% CI)* | Median (95% CI) | 5th percentile (95% CI) | 95th percentile (95% CI) | |
|---|---|---|---|---|---|---|
| Total | 2569 | 25·0 (24·3–25·7) | .. | 25·7 (25·0–26·8) | 9·4 (8·5–10·6) | 61·0 (57·1–64·0) |
|
| ||||||
| Survey year | ||||||
| 2003–04 | 440 (17·1%) | 24·9 (23·3–26·7) | 24·8 (23·4–26·3) | 24·6 (22·7–26·4) | 9·8 (9·1–11·9) | 59·3 (52·9–66·7) |
| 2005–06 | 413 (16·1%) | 26·1 (24·6–27·6) | 25·3 (23·4–26·9) | 27·0 (24·9–29·5) | 8·6 (7·5–10·5) | 64·0 (56·7–68·7) |
| 2007–08 | 428 (16·7%) | 25·2 (23·2–27·5) | 25·0 (23·4–26·9) | 26·4 (23·7–28·5) | 8·1 (7·2–10·1) | 66·1 (51·7–73·6) |
| 2009–10 | 496 (19·3%) | 23·8 (22·6–25·0) | 23·7 (22·4–25·1) | 23·9 (22·4–25·0) | 8·5 (6·4–9·9) | 57·0 (49·4–63·9) |
| 2015–16 | 436 (17·0%) | 25·7 (24·1–27·3) | 25·7 (24·0–27·5) | 26·3 (24·8–28·5) | 10·4 (9·2–12·1) | 61·2 (51·8–68·2) |
| 2017–18 | 356 (13·9%) | 24·7 (22·9–26·7) | 25·4 (23·4–27·5) | 24·6 (22·7–27·7) | 9·4 (7·4–12·7) | 58·5 (52·3–65·2) |
|
| ||||||
| Age (months) | ||||||
| 12–35 | 1204 (46·9%) | 22·2 (21·3–23·2) | 22·3 (21·4–23·4) | 22·2 (21·1–24·0) | 7·0 (6·4–8·4) | 58·7 (52·4–68·3) |
| 36–59 | 1365 (53·1%) | 26·9 (25·9–28·0)* | 26·8 (25·7–28·2)† | 27·0 (26·4–28·7) | 10·8 (9·7–12·0) | 61·2 (57·9–64·3) |
|
| ||||||
| Sex | ||||||
| Male | 1349 (52·5%) | 24·0 (23·0–25·0) | 23·8 (22·9–25·1) | 25·0 (23·4–26·1) | 8·9 (8·1–10·5) | 57·0 (52·5–60·9) |
| Female | 1220 (47·5%) | 26·2 (25·3–27·3)‡ | 26·3 (25·1–27·5)§ | 26·9 (25·9–27·9) | 9·8 (8·7–11·7) | 65·5 (60·6–69·3) |
|
| ||||||
| Race/ethnic group | ||||||
| Mexican–American | 643 (25·0%) | 22·0 (20·9–23·2) | 22·3 (20·9–23·4) | 23·0 (22·0–24·9) | 6·3 (5·0–8·2) | 55·4 (51·8–63·1) |
| non-Hispanic White | 795 (30·9%) | 24·8 (23·6–26·0)¶ | 24·6 (23·4–25·7)∥ | 25·0 (23·7–27·0) | 9·9 (9·1–11·0) | 59·0 (54·8–65·2) |
| non-Hispanic Black | 677 (26·4%) | 30·0 (28·6–31·6)** | 29·7 (28·2–31·6)†† | 29·8 (28·1–32·2) | 12·9 (11·3–14·8) | 68·7 (65·1–77·6) |
|
| ||||||
| Family income | ||||||
| <130% of poverty-to-income ratio | 1261 (49·1%) | 25·3 (24·3–26·4) | 25·2 (24·0–26·3) | 26·3 (25·1–27·4) | 9·1 (8·7–9·9) | 65·4 (61·0–69·0) |
| ≥130% of poverty-to-income ratio | 1137 (44·2%) | 24·7 (23·8–25·7) | 24·8 (24·0–25·7) | 25·0 (24·0–26·2) | 9·8 (8·8–11·2) | 57·8 (55·1–62·7) |
Unweighted n, all other analyses are weighted. Analyses for adjusted mean takes into account all the sociodemographic characteristics listed in the table (ie, the adjusted mean serum ferritin for each age group is adjusted for survey, sex, race/ethnic group, and family income).
Significantly different to unadjusted the 12–35 month group (p<0·0001).
Significantly different to the adjusted 12–35 month group (p<0·0001).
Significantly different to the unadjusted male group (p<0·0001).
Significantly different to the adjusted male group (p=0·0021).
Significantly different to the unadjusted Mexican-Americans group (p=0·0004).
Significantly different to the adjusted Mexican-American group (p=0·0038).
Significantly different to the unadjusted Mexican-American (p<0·0001) and non-Hispanic White (p<0·0001) groups.
Significantly different to the adjusted Mexican-American (p<0·0001) and non-Hispanic White (p<0·0001) groups.
Table 2:
Serum ferritin concentrations in a healthy population of US non-pregnant women
| Women | Unadjusted geometric mean (95% CI) | Adjusted geometric mean (95% CI) | Median (95% CI) | 5th percentile (95% CI) | 95th percentile (95% CI) | |
|---|---|---|---|---|---|---|
| Total | 7498 | 31·3 (30·6–32·1) | .. | 35·0 (34·3–35·6) | 6·0 (5·7–6·6) | 106·2 (103·1–109·9) |
|
| ||||||
| Survey year | ||||||
| 2003–04 | 1244 (16·6%) | 35·0 (32·8–37·3)* | 34·7 (32·4–37·2)† | 39·2 (36·5–41·4) | 6·2 (5·2–8·9) | 110·4 (99·1–113·2) |
| 2005–06 | 1386 (18·5%) | 33·4 (31·9–35·0)‡ | 33·3 (31·6–34·7)§ | 37·2 (35·5–40·6) | 6·2 (5·9–7·7) | 102·4 (95·7–113·2) |
| 2007–08 | 1301 (17·4%) | 30·5 (29·0–32·0) | 30·1 (28·8–31·6)¶ | 33·1 (32·3–35·5) | 5·2 (4·6–6·6) | 107·0 (100·1–115·9) |
| 2009–10 | 1561 (20·8%) | 31·4 (29·8–33·1)∥ | 31·4 (29·5–33·1) | 35·1 (32·7–37·1) | 5·7 (5·0–6·9) | 110·2 (102·8–115·9) |
| 2015–16 | 1088 (14·5%) | 26·2 (26.4·31.7) | 29·7 (27·5–32·4) | 33·2 (30·9–35·6) | 5·8 (4·7–7·4) | 101·1 (84·9–106·7) |
| 2017–18 | 918 (12·2%) | 28·2 (26·1–30·5) | 34·7 (32·4–37·2) | 30·1 (27·2–33·4) | 5·9 (5·1–6·7) | 104·2 (93·5–122·7) |
|
| ||||||
| Age (years) | ||||||
| 15–19 | 2056 (27·4%) | 25·0 (23·8–26·3)** | 25·3 (23·4–26·9)†† | 27·0 (25·8–29·2) | 6·0 (5·2–6·9) | 80·7 (74·7–87·1) |
| 20–34 | 2686 (35·8%) | 31·8 (30·9–33·3) | 33·1 (31·6–34·7) | 35·3 (34·3–37·0) | 6·9 (6·2–7·3) | 98·8 (94·5–104·2) |
| 35–49 | 2756 (35·8%) | 33·1 (31·7–34·2) | 33·1 (31·6–34·7) | 38·0 (36·5–40·2) | 5·4 (5·1–6·7) | 116·9 (110·7–122·5) |
|
| ||||||
| Race/ethnic group | ||||||
| Mexican–American | 1573 (21·0%) | 25·5 (23·8–27·3) | 26·3 (24·0–28·2) | 28·1 (26·6–31·4) | 4·9 (4·5–5·0) | 93·9 (87·4–101·2) |
| non-Hispanic White | 2760 (36·8%) | 34·0 (33·0–35·1)‡‡ | 34·0 (33·1–35·5)§§ | 37·0 (36·5–38·8) | 7·1 (6·4–8·0) | 107·9 (102·5–113·7) |
| non-Hispanic Black | 1773 (23·6%) | 27·3 (25·9–28·8) | 28·1 (26·9–29·5) | 29·8 (28·6–32·8) | 5·0 (4·1–5·2) | 112·4 (105·0–121·6) |
|
| ||||||
| Education | ||||||
| Less than high school | 2394 (31·9%) | 28·2 (26·9–29·6)¶¶ | 32·1 (30·2–33·9) | 31·0 (29·1–33·4) | 5·4 (5·1–6·2) | 102·8 (97·4–110·0) |
| High school diploma | 1220 (16·3%) | 32·1 (30·0–34·2) | 31·6 (29·5–33·9) | 36·4 (34·0–40·0) | 5·0 (4·9–6·2) | 106·7 (100·3–117·5) |
| More than high school | 2960 (39·5%) | 33·4 (32·4–34·4) | 31·9 (30·9–33·1) | 37·0 (36·1–38·4) | 7·0 (6·4–7·5) | 106·4 (102·1–111·0) |
|
| ||||||
| Family income | ||||||
| <30% of poverty-to-income ratio | 2560 (34·1%) | 28·6 (27·4–29·9) | 30·9 (29·5–32·4) | 32·0 (30·2–33·7) | 5·4 (5·2–6·2) | 105·0 (99·8–111·8) |
| ≥130% of poverty-to-income ratio | 4392 (58·6%) | 32·4 (31·4–33·4)∥∥ | 32·2 (30·9–33·1) | 36·0 (35·1–37·2) | 6·3 (5·9–7·1) | 106·1 (102·2–110·9) |
Unweighted n, all other analyses are weighted. Analyses for adjusted mean takes into account all the sociodemographic characteristics listed in the table (ie, the adjusted mean serum ferritin for each age group is adjusted for survey, sex, race/ethnic group, and family income).
Significantly different to the unadjusted survey years 2007–08 (p=0·001); 2009-10 (p=0·010), 2015–16 (p=0·0011), and 2017–18 (p=0·0001).
Significantly different to the adjusted survey years 2007–08 (p=0·0018), 2009–10 (p=0·033) and 2015–16 (p=0·0063).
Significantly different to the unadjusted survey years 2007–08 (p=0·0076), 2015–16 (p=0·0066), and 2017–18 (p=0·0004).
Significantly different to the adjusted survey years 2007–08 (p=0·0032) and 2015–16 (p=0·018).
Significantly different to the adjusted survey years 2003–04 (p=0·0018) and 2005–06 (p=0·0032), 2015–16 (p=0·0066), and 2017–18 (p=0·0004).
Significantly different to the unadjusted survey year 2003–04 (p=0·010) and 2017–18 (p=0·027).
Significantly different to the unadjusted 20–34 year (p<0·0001) and 34–49 year (p<0·0001) age groups.
Significantly different to the adjusted 20–34 year (p<0·0001) and 34–49 year (p=0·0030) age groups.
Significantly different to the unadjusted Mexican-American (p<0·0001) and non-Hispanic Black (p<0·0001) groups.
Significantly different to the adjusted Mexican-American (p<0·0001) and non-Hispanic Black (p<0·0001) groups.
Significantly different to the unadjusted high school diploma (p=0·0009) and more than high school (p<0·0001) groups.
Significantly different to the unadjusted ≥130% of poverty-to-income ratio group (p<0·0001).
Median haemoglobin to serum ferritin and sTfR to serum ferritin contenctration plots for children are shown in figure 2 and are reported in figure 3 for women. These empirical distribution plots indicated clear non-linear trends with distinct thresholds at certain concentrations of serum ferritin, and inflection points at concentrations of haemoglobin or sTfR. Using restricted cubic spline regression analysis, we found curvilinear associations between continuous serum ferritin and haemoglobin and between serum ferritin and sTfR for both children and non-pregnant women. In children, the serum ferritin concentrations at the haemoglobin plateau point (19·9 μg/L [95% CI 18·8–22·6]) and the sTfR minima point (20·0 μg/L [19·4–20·9]) were not significantly different (p=0·89; table 3). When stratified by age, the haemoglobin plateau point in older children (aged 36–59 months; 21·8 μg/L [20·0–25·0]) was significantly different from that in younger children (aged 12–35 months; 17·6 μg/L [16·3–21·1]; p=0·037); the median sTfR minima was significantly different for older children (22·1 μg/L [21·0–23·8]) compared with younger children (17·6 μg/L [16·9–18·6]; p<0·0001; table 3). The restricted cubic spline regression curves for both haemoglobin and sTfR in children are reported in figure 2.
Figure 2: Serum ferritin threshold calculation for children.

(A) Serum ferritin concentrations with median haemoglobin concentration. (B) Serum ferritin concentrations with median sTfR. (C) Haemoglobin restricted cubic spline regression with 5 knots, vertical line indicates the plateau point; shaded areas inside the dashed lines are 95% CIs. (D) sTfR restricted cubic spline regression with 5 knots, vertical line indicates line indicates the minima point; shaded areas inside the dashed lines are 95% CIs. sTfR=soluble transferrin receptor.
Figure 3: Serum ferritin threshold calculation for non-pregnant women.

(A) Serum ferritin concentrations with median haemoglobin concentration. (B) Serum ferritin concentrations with median sTfR. (C) Haemoglobin restricted cubic spline regression with 5 knots, vertical line indicates the plateau point; shaded areas inside the dashed lines are 95% CIs. (D) sTfR restricted cubic spline regression with 5 knots, vertical line indicates line indicates the minima point; shaded areas inside the dashed lines are 95% CIs. sTfR=soluble transferrin receptor.
Table 3:
Serum ferritin concentration thresholds identified in a healthy sample of US children
| Total (n=2569) | 12–35 months (n=1204) | 36–59 months (n=1365) | p value (12–35 months vs 36–59 months) | |
|---|---|---|---|---|
| Haemoglobin | ||||
|
| ||||
| Serum ferritin corresponding to haemoglobin plateau point | 19·9 (18·8–22·6) | 17·6 (16·3–21·1) | 21·8 (20·0–25·0) | 0·0371 |
| Serum ferritin corresponding to haemoglobin threshold values* | NA | NA | NA | .. |
| Restricted cubic spline Model Adjusted R2 (%) | 3·0% | 3·5% | 1·6% | .. |
|
| ||||
| sTfR | ||||
|
| ||||
| Serum ferritin corresponding to sTfR minima point | 20·0 (19·4–20·9) | 17·6 (16·9–18·6) | 22·1 (21·0–23·8) | <0·0001 |
| Serum ferritin corresponding to sTfR threshold values | 10·1 | 10·1 | 7·5 | .. |
| Restricted cubic spline Model Adjusted R2 (%) | 19·9% | 26·0% | 9·2% | .. |
Data are serum ferritin concentration, μg/L (95% CI). Unweighted n and analyses. Haemoglobin threshold value was <11·0 g/dL.18 sTfR threshold value was >5·33 mg/L.20 All plateau and minima estimate and their 95% CIs, were obtained from 5000 bootstrap replicates. All CIs have been corrected for bias using the bias corrected acceleration approach.25 NA=not applicable. sTfR=Soluble transferrin receptor.
Because the predicted values do not have haemoglobin below 11·0 g/dL, gradient search23 was not feasible.
The patterns in non-pregnant women generally were not different to those found in children (table 3). The serum ferritin concentration at the haemoglobin plateau point (25·2 μg/L [95% CI 24·2–26·2]) and the sTfR minima point (24·0 μg/L [23·3–24·6]) were not significantly different (p=0·05; table 4). The haemoglobin plateau point (26·6 μg/L [25·6–27·9]) in older women (20–49 years) was not significantly different from that in younger women (15–19 years; 22·3 μg/L [20·4–30·0]), but the sTfR minima point was significantly higher in older women (25·5 μg/L [24·7–26·3]) compared with younger women (20·6 [19·7–22·0]; p<0·0001; table 4). The restricted cubic spline regression curves for haemoglobin and sTfR are reported in figure 3.
Table 4:
Serum ferritin concentration thresholds identified in a healthy sample of US non-pregnant women
| Total (n=7498) | 15–19 years (n=2056) | 20–49 years (n=5442) | p value (15–19 years vs 20–49 years) |
|
|---|---|---|---|---|
| Haemoglobin | ||||
|
| ||||
| Serum ferritin corresponding to haemoglobin plateau point | 25·2 (24·2–26·2) | 22·3 (20·4–30·0) | 26·6 (25·6–27·9) | 0·0709 |
| Serum ferritin corresponding to haemoglobin threshold values | 8·6 | 6·9 | 9·3 | .. |
| Restricted cubic spline Model Adjusted R2 (%) | 32·8% | 25·9% | 35·4% | .. |
|
| ||||
| sTfR | ||||
|
| ||||
| Serum ferritin corresponding to sTfR minima point | 24·0 (23·3–24·6) | 20·6 (19·7–22·0) | 25·5 (24·7–26·3) | <0·0001 |
| Serum ferritin corresponding to sTfR threshold values | 7·2 | 8·0 | 9·3 | .. |
| Restricted cubic spline Model Adjusted R2 (%) | 39·2% | 37·4% | 40·3% | .. |
Data are serum ferritin concentration, μg/L (95% CI), unless otherwise stated. Unweighted n and analyses. Haemoglobin threshold value was <12·0 g/dL.18 sTfR threshold value was >6·00 mg/L.20 All plateau and minima estimate and their 95% CIs, were obtained from 5000 bootstrap replicates. All CIs have been corrected for bias using the bias corrected acceleration approach.25 Serum ferritin geometric means were not statistically significantly different between women aged 20–34 years and 35–49 years (table 2) thus we combined the two groups for the restricted cubic spline analysis. sTfR=Soluble transferrin receptor.
The proportion of the NHANES populations considered to be iron deficient using the physiologically based thresholds and the current serum ferritin thresholds are reported in the appendix (pp 2–3).
The restricted cubic spline stratification results of NHANES from 2003–06, 2007–10, and 2015–18 are reported in the appendix (p 1) as independent periods rather than as combined data. For children, no significant differences were found between the serum ferritin thresholds identified during the three time periods (appendix p 1). For non-pregnant women, no significant differences were found between the serum ferritin thresholds for 2003–06 and 2007–10, but the serum ferritin threshold identified for 2015–18 was lower (appendix p 2).
The differences between the proportions of children and women classified as iron deficient or with iron deficiency anaemia by median haemoglobin and sTfR indicators of iron-deficient erythropoiesis and the WHO recommended thresholds are reported in the appendix (pp 2–4).
Discussion
Our results identify physiologically based serum ferritin thresholds for iron deficiency of about 20 μg/L for children (12–59 months), and of about 25 μg/L for non-pregnant women (15–49 years), using restricted cubic spline analysis of haemoglobin and sTfR concentrations (tables 3 and 4; figures 2 and 3). Because no nationally representative data from the healthy US population are available, we used a subsample of apparently healthy participants from NHANES from the 2003–06, 2007–10, and 2015–18 cycles for whom data on comprehensive laboratory and health characteristics were available. The thresholds identified are higher than those for otherwise healthy children (<12 μg/L) and women (<15 μg/L) developed on the basis of expert opinion that are specified in WHO guidelines;1 however, WHO judged that the overall certainty of the evidence for the current guideline recommendations of <12 μg/L for children and <15 μg/L for women was low to very low.1 The differences between the groups classified as iron deficient using our physiologically based indicators of iron-deficient erythropoiesis and those classified with the WHO recommended thresholds1 are shown in the appendix (pp 2–3). We suggest our thresholds reflect the onset of iron-deficient erythropoiesis, whereas the WHO values characterise a more advanced stage of established iron-deficient erythropoiesis. According to the WHO, iron deficiency is considered to exist when bone marrow iron staining is absent,1 but other evidence suggests that iron-deficient erythropoiesis develops even without absent bone marrow iron stores.6,8 More than 90% of the daily iron flux is derived from macrophage recycling of iron from erythrocytes at the end of their life span. A small amount of storage iron might be required for mobilisation to support the erythroid and tissue iron supply.6,8,26
Our results provide additional evidence that a small amount of storage iron, indicated by the higher serum ferritin thresholds from the NHANES data, might still be present during the initial development of iron deficiency. We used median haemoglobin concentration and median sTfR concentration as independent indicators of the onset of iron-deficient erythropoiesis. Exploratory analysis found curvilinear relationships between serum ferritin concentration and both median haemoglobin and median sTfR concentrations (figures 2A, B and 3A, B). We then used restricted cubic spline analysis to identify plateau points as potential serum ferritin thresholds for iron-deficient erythropoiesis (figures 2C, D and 3C, D) in the combined NHANES 2003–06, 2007–10, and 2015–18 data. Restricted cubic spline analysis is useful for modelling the non-linear relationship between a continuous variable (eg, serum ferritin concentration) and an outcome (haemoglobin or sTfR concentrations).22 A previous study of Canadian children (12–36 months old), which used restricted cubic spline analysis of haemoglobin alone, identified a serum ferritin threshold of 17·9μg/L,27 which was not substantially different from the serum ferritin threshold we report for this age group (table 3). We report the overall pooled data serum ferritin thresholds for children and for non-pregnant women (tables 3, 4). This was done for simplicity and practical use; of note, the different age-stratified values were significantly different.
Future studies should focus on whether age-stratified thresholds are warranted in children and non-pregnant women. We evaluated replication of the physiologically based serum ferritin thresholds for iron deficiency by considering the NHANES from 2003–06, 2007–10, and 2015–18 as independent sets of data. For children, no significant differences were found during the three time periods (appendix p 2). For non-pregnant women, the serum ferritin threshold identified for 2015–18 was lower than that identified during 2003–06 and 2007–10 (appendix p 3). We suggest that variation in the serum ferritin threshold found for 2015–18 might be due to variation in the methods and instrumentation used for haemoglobin, serum ferritin, and sTfR during the three time periods (appendix p 3), but we have no means of incorporating estimates of such variation in the restricted cubic spline analysis. Nontheless, the physiologically based serum ferritin threshold concentrations are substantially higher than the WHO guideline of 12 μg/L for children and 15 μg/L for non-pregnant women. Validation of the physiologically based serum ferritin thresholds for iron deficiency will require analysis of high-quality data from other similar, but non-US, populations. We anticipate that harmonisation of results will require consideration of variation in methods, instrumentation, and other factors.
With the onset of iron-deficient erythropoiesis, body iron stores become unable to provide the iron needed for production of red blood cells and the synthesis of iron-requiring functional compounds. Circulating haemoglobin iron, constituting roughly three-quarters or more of the total body iron in children and women of childbearing age, is primarily affected. A variety of molecular pathways are activated to preserve the availability of iron for vital functions in other tissues at the expense of circulating haemoglobin iron.2,3 Nonetheless, even in the absence of anaemia, these compensatory mechanisms are unable to prevent the adverse effects of iron deficiency in nonerythroid tissues, identified by WHO as fatigue, impaired physical performance, decreased work productivity, and suboptimal brain development.1 The threshold of serum ferritin at which the haemoglobin begins to decline and the sTfR begins to rise represents the development of iron deficiency because the supply of iron from body stores is unable to meet iron requirements. In the 2003–06, 2007–10, and 2015–18 NHANES data, the serum ferritin thresholds identified by restricted cubic spline analysis of haemoglobin and plasma sTfR concentrations was not significantly different. This suggests that the median serum ferritin concentrations in the healthy NHANES subsamples were not largely affected by causes of infection, inflammation, liver disease, or other conditions that we were not able to exclude in our analysis.
By identifying individuals at an earlier stage of iron deficiency, our physiologically based thresholds identify a larger proportion of people as iron deficient without anaemia. With increasing recognition of the effects of tissue iron deficiency despite the patient not having anaemia, use of physiologically based thresholds could help to identify the functional consequences of iron deficiency without anaemia. The lower median serum ferritin concentration in children compared with women is probably explained by increased iron requirements for growth, along with differences in the amounts of bioavailable dietary iron and other factors. Although the proportion of women who were iron deficient was somewhat higher than that in children, the divergence seems insufficient to offset the imbalance in median serum ferritin.
Our study has limitations. Serum ferritin concentration is increased with inflammation, infection, liver disease, and other disorders. Our efforts to exclude children with infection and women with infection, inflammation, and potential liver disease might not have excluded all individuals with other causes of anaemia or with conditions that increase serum ferritin independently of body iron stores. By contrast, sTfR is much less affected by infection and inflammation, and it typically would be decreased rather than increased by confounding infectious and inflammatory conditions present in the US population.19,26 Consequently, the close association between the serum ferritin thresholds identified by the robust running median curve of haemoglobin and sTfR concentrations suggest little influence from potentially confounding conditions, such as inflammation associated with obesity or that was not detected by CRP. Both the serum ferritin and sTfR assay methods changed over the course of the NHANES studies. The regression equations used to adjust serum ferritin and sTfR concentrations over the years of the NHANES data assume that the assays remain stable over time. We have examined only data from an apparently healthy subsample of individuals from the USA and extension to data from other healthy populations is needed to assess the generalisability of the restricted cubic spline analytic approach and the thresholds identified. The serum ferritin thresholds resulting from analysis of data from healthy individuals might be applied to other populations if appropriate adjustments can be made to account for the effects of inflammation and infection on serum ferritin, but future research could evaluate the best method to account for inflammation and infection. Combining serum ferritin thresholds with information from other laboratory measures could lead to the development of algorithms that would help distinguish iron deficiency from other causes of a decreased haemoglobin concentration. We have not analysed serum ferritin thresholds using NHANES categories of race or ethnicity because these are sociological rather than biological classifications.28
Despite these limitations, the approach of using physiologically based measures for analysis of carefully standardised data collected over two decades offers potential advantages. Although we have examined only data from the USA, our method can readily be extended to data from other healthy populations. Overall, the physiologically based approach might help identify thresholds for iron deficiency that are more clinically and epidemiologically relevant than reference ranges based on the small studies of patients who have undergone bone marrow examination, phlebotomy, or iron treatment.
Supplementary Material
Research in context.
Evidence before this study
Serum ferritin concentrations are the most widely used indicator for iron deficiency. For this study, we have relied on the comprehensive systematic reviews of the available data, methods, and literature on serum ferritin thresholds by WHO; no additional systematic searches have been done. WHO determined that current serum ferritin thresholds for iron deficiency, which are based on expert opinion, are supported by a low to very low certainty of evidence. However, WHO concluded that insufficient data are available to alter the guidelines for the use of a less than 12 μg/L serum ferritin concentration cutoff for children and less than 15 μg/L serum ferritin cutoff for women as thresholds to assess iron deficiency in individuals and populations.
Added value of this study
Accurate assessment of iron status is crucial for screening and diagnosis of iron deficiency clinically, epidemiologically, and in evaluating preventive or therapeutic public health programmes. The thresholds recommended in current guidelines or used by different laboratories vary considerably and are based on expert opinion or statistical analyses of the distribution of serum ferritin in samples from various sources. We used two independent indicators of iron deficiency, haemoglobin and soluble transferrin receptor (sTfR). The serum ferritin concentration at which the haemoglobin concentration begins to decline and the sTfR concentration begins to rise provides a physiological basis for identifying a serum ferritin concentration that indicates the onset of iron-deficient erythropoiesis. The thresholds identified from our analysis suggest that the onset of iron-deficient erythropoiesis begins at higher serum ferritin concentrations in children and non-pregnant women than those in the guidelines recommended by the WHO, which identify a more advanced stage of iron deficiency.
Detecting individuals at an earlier stage of iron deficiency will identify a higher proportion of individuals as iron deficient without anaemia. With increasing recognition of the effects of tissue iron deficiency in the absence of anaemia, use of physiologically based thresholds could help identify the functional consequences of iron deficiency without anaemia.
Implications of all the available evidence
Physiologically based thresholds for iron deficiency might be more relevant for clinical diagnosis, population surveys, public health planning, and epidemiological analysis than those based on analysis of serum ferritin distributions alone or on expert opinion, which is derived from small studies of patients who have undergone bone marrow examination, phlebotomy, or iron treatment. Future evaluations of a physiologically based approach in other healthy populations might help the international harmonisation of serum ferritin thresholds for iron deficiency.
Footnotes
Declaration of interests
We declare no competing interests.
See Online for appendix
For the NHANES data see https://www.cdc.gov/nchs/nhanes/
Data sharing
The US National Health and Nutrition Examination Survey (NHANES) data is in the public domain and is available online.
References
- 1.WHO. WHO guideline on use of ferritin concentrations to assess iron status in individuals and populations. Geneva: World Health Organization; 2020. [PubMed] [Google Scholar]
- 2.Brittenham GM. Pathophysiology of iron homeostasis. In: Hoffman R BE, Silberstein LE, Heslop H, Weitz JI, Anastasi J, Salama ME, Abutalib SA, eds. Hematology: Basic Principles and Practice. 7th edn. New York: Elsevier, 2018. [Google Scholar]
- 3.Camaschella C Iron deficiency. Blood 2019; 133: 30–39. [DOI] [PubMed] [Google Scholar]
- 4.Cook JD. The measurement of serum transferrin receptor. Am J Med Sci 1999; 318: 269–76. [DOI] [PubMed] [Google Scholar]
- 5.Skikne BS, Flowers CH, Cook JD. Serum transferrin receptor: a quantitative measure of tissue iron deficiency. Blood 1990; 75: 1870–76. [PubMed] [Google Scholar]
- 6.Beguin Y Soluble transferrin receptor for the evaluation of erythropoiesis and iron status. Clin Chim Acta 2003; 329: 9–22. [DOI] [PubMed] [Google Scholar]
- 7.Gammella E, Buratti P, Cairo G, Recalcati S. The transferrin receptor: the cellular iron gate. Metallomics 2017; 9: 1367–75. [DOI] [PubMed] [Google Scholar]
- 8.Lynch S, Pfeiffer CM, Georgieff MK, et al. Biomarkers of Nutrition for Development (BOND)-Iron Review. J Nutr 2018; 148 (suppl 1): 1001–67s. [DOI] [PMC free article] [PubMed] [Google Scholar]
- 9.National Center for Health Statistics. National Health and Nutrition Examination Survey: Plan and Operations, 1999–2010. 1999. https://www.cdc.gov/nchs/data/series/sr_01/sr01_056.pdf (accessed May 18, 2020).
- 10.National Center for Health Statistics. National Health and Nutrition Examination Survey 2003-2004 Laboratory Data. 2003. https://wwwn.cdc.gov/nchs/nhanes/search/datapage.aspx?Component=Laboratory&CycleBeginYear=2003 (accessed May 18, 2020).
- 11.National Center for Health Statistics. National Health and Nutrition Examination Survey 2005-2006 Laboratory Data. 2005. https://wwwn.cdc.gov/nchs/nhanes/search/datapage.aspx?Component=Laboratory&CycleBeginYear=2005 (accessed May 18, 2020).
- 12.National Center for Health Statistics. National Health and Nutrition Examination Survey 2007–2008 Laboratory Data. https://wwwn.cdc.gov/nchs/nhanes/search/datapage.aspx?Component=Laboratory&CycleBeginYear=2007 (accessed May 18, 2020).
- 13.National Center for Health Statistics. National Health and Nutrition Examination Survey 2009–2010 Laboratory Data. 2009. https://wwwn.cdc.gov/nchs/nhanes/search/datapage.aspx?Component=Laboratory&CycleBeginYear=2009 (accessed May 18, 2020).
- 14.National Center for Health Statistics. National Health and Nutrition Examination Survey 2015–2016 Laboratory Data. 2015. https://wwwn.cdc.gov/nchs/nhanes/search/datapage.aspx?Component=Laboratory&CycleBeginYear=2015 (accessed May 18, 2020).
- 15.National Center for Health Statistics. National Health and Nutrition Examination Survey 2017–2018 Laboratory Data. 2017. https://wwwn.cdc.gov/nchs/nhanes/search/datapage.aspx?Component=Laboratory&CycleBeginYear=2017 (accessed May 18, 2020).
- 16.Fleming DJ, Jacques PF, Dallal GE, Tucker KL, Wilson PW, Wood RJ. Dietary determinants of iron stores in a free-living elderly population: the Framingham Heart Study. Am J Clin Nutr 1998; 67: 722–33. [DOI] [PubMed] [Google Scholar]
- 17.Dati F, Schumann G, Thomas L et al. Consensus of a group of professional societies and diagnostic companies on guidelines for interim reference ranges for 14 proteins in serum based on the standardization against the IFCC/BCR/CAP reference material (CRM 470). Eur J Clin Chem Clin Biochem 1996; 34: 517–20. [PubMed] [Google Scholar]
- 18.WHO, Centers for Disease Control and Prevention. Assessing the iron status of populations: including literature reviews. Report of a Joint World Health Organization/Centers for Disease Control and Prevention Technical Consultation on the Assessment of Iron Status at the Population Level. 2nd edn. Geneva, WHO, 2004. [Google Scholar]
- 19.Suominen P, Punnonen K, Rajamäki A, Irjala K. Evaluation of new immunoenzymometric assay for measuring soluble transferrin receptor to detect iron deficiency in anemic patients. Clin Chem 1997; 43: 1641–46. [PubMed] [Google Scholar]
- 20.Mei Z, Pfeiffer CM, Looker AC, et al. Serum soluble transferrin receptor concentrations in US preschool children and non-pregnant women of childbearing age from the National Health and Nutrition Examination Survey 2003–2010. Clinica Chimica Acta 2012; 413: 1479–84. [DOI] [PubMed] [Google Scholar]
- 21.Tukay JW. Exploratory Data Analysis. Reading, MA: Addison-Wesley; 1977 [Google Scholar]
- 22.Harrel FE. Regression Modeling Strategies: With Applications to Linear Models, Logistic Regression, and Survival Analysis. 2nd edn. New York: Springer, 2001. [Google Scholar]
- 23.Borenstein M, Hedges LV, Higgins JPT, Rothstein HR. Introduction to meta-analysis. Chichester: John Wiley & Sons, 2009. [Google Scholar]
- 24.Viechtbauer W Conducting meta-analyses in R with the metafor Package. J Stat Softw 2010; 36: 48. [Google Scholar]
- 25.DiCiccio TJ, Efron B. Bootstrap confidence intervals. Statistical Science 1996; 11: 189–228. [Google Scholar]
- 26.Cogswell ME, Looker AC, Pfeiffer CM, et al. Assessment of iron deficiency in US preschool children and nonpregnant females of childbearing age: national Health and Nutrition Examination Survey 2003–2006. Am J Clin Nutr 2009; 89: 1334–42. [DOI] [PubMed] [Google Scholar]
- 27.Abdullah K, Birken CS, Maguire JL, et al. Re-evaluation of serum ferritin cut-off values for the diagnosis of iron deficiency in children aged 12–36 months. J Pediatr 2017; 188: 287–290. [DOI] [PubMed] [Google Scholar]
- 28.Weyand AC, McGann PT. Eliminating race-based reference ranges in haematology: a call to action. Lancet Haematol 2021; 8: e462–66. [DOI] [PubMed] [Google Scholar]
Associated Data
This section collects any data citations, data availability statements, or supplementary materials included in this article.
Supplementary Materials
Data Availability Statement
The US National Health and Nutrition Examination Survey (NHANES) data is in the public domain and is available online.