

Abstract
We examined phosphorylated nuclear factor erythroid 2–related factor 2 (P‐NRF2) expression in surgically resected primary hepatocellular carcinoma (HCC) and investigated the association of P‐NRF2 expression with clinicopathological features and patient outcome. We also evaluated the relationship among NRF2, cancer metabolism, and programmed death ligand 1 (PD‐L1) expression. In this retrospective study, immunohistochemical staining of P‐NRF2 was performed on the samples of 335 patients who underwent hepatic resection for HCC. Tomography/computed tomography using fluorine‐18 fluorodeoxyglucose was performed, and HCC cell lines after NRF2 knockdown were analyzed by array. We also analyzed the expression of PD‐L1 after hypoxia inducible factor 1α (HIF1A) knockdown in NRF2‐overexpressing HCC cell lines. Samples from 121 patients (36.1%) were positive for P‐NRF2. Positive P‐NRF2 expression was significantly associated with high alpha‐fetoprotein (AFP) expression, a high rate of poor differentiation, and microscopic intrahepatic metastasis. In addition, positive P‐NRF2 expression was an independent predictor for recurrence‐free survival and overall survival. NRF2 regulated glucose transporter 1, hexokinase 2, pyruvate kinase isoenzymes L/R, and phosphoglycerate kinase 1 expression and was related to the maximum standardized uptake value. PD‐L1 protein expression levels were increased through hypoxia‐inducible factor 1α after NRF2 overexpression in HCC cells. Conclusions: Our large cohort study revealed that P‐NRF2 expression in cancer cells was associated with clinical outcome in HCC. Additionally, we found that NRF2 was located upstream of cancer metabolism and tumor immunity.
Abbreviations
- AFP
alpha‐fetoprotein
- CI
confidence interval
- 18F‐FDG
fluorine‐18 fluorodeoxyglucose
- G6Pase
glucose‐6‐phosphatase
- GLUT1
glucose transporter 1
- HCC
hepatocellular carcinoma
- HIF1α
hypoxia inducible factor 1α
- HK2
hexokinase 2
- HR
hazard ratio
- IFN‐γ
interferon gamma
- IHC
immunohistochemistry
- IQR
interquartile range
- mRNA
messenger RNA
- NRF2
nuclear factor erythroid 2–related factor 2
- OS
overall survival
- PCR
polymerase chain reaction
- PD‐L1
programmed death ligand 1
- PET/CT
positron emission tomography/computed tomography
- PGK1
phosphoglycerate kinase 1
- PKLR
pyruvate kinase isoenzymes L/R
- P‐NRF2
phosphorylated nuclear factor erythroid–derived 2‐like 2
- RFS
recurrence‐free survival
- SUVmax
standardized uptake value maximum
Hepatocellular carcinoma (HCC) is a common cancer worldwide.( 1 ) Hepatic resection is a safe and effective treatment in patients with HCC, and preserves liver function. However, the proportion of patients who develop intrahepatic recurrence remains high.( 2 , 3 )
Nuclear factor erythroid 2–related factor 2 (NRF2) is an antioxidant protein–associated transcription factor.( 4 ) We previously reported that NRF2 is involved in the metastasis of HCC.( 5 ) High expression of NRF2 is significantly associated with poor prognosis in various cancers,( 6 , 7 ) and suppressing NRF2 led to the down‐regulation of a series of genes involved in the pentose phosphate pathway, which is a branch of glycolytic metabolism.( 8 )
The recent large phase 3 study IMbrave150 demonstrated improvements in HCC prognosis for atezolizumab, an anti–programmed cell death ligand 1 (PD‐L1) antibody + bevacizumab, an angiogenesis inhibitor, compared with sorafenib.( 9 ) Recently, we revealed that PD‐L1 expression in cancer cells was associated with poor clinical outcome in 418 patients with HCC, and a high maximum standardized uptake value (SUVmax) on fluorine‐18 fluorodeoxyglucose (18F‐FDG) positron emission tomography/computed tomography (PET/CT) was associated with high PD‐L1 expression in patients with HCC.( 10 , 11 ) High NRF2 expression was related to high PD‐L1 expression in various cancers.( 12 , 13 ) However, the relationship among NRF2 protein expression, 18F‐FDG PET/CT, and PD‐L1 protein expression in HCC is unclear.
In this study, we examined the prognostic impact of NRF2 protein expression in patients with HCC and the association of NRF2 with PD‐L1 expression and the SUVmax on 18F‐FDG PET/CT.
Materials and Methods
Cell Culture and Reagents
HuH7 and Hep3B cells were obtained from the American Type Culture Collection (Manassas, VA). HuH7 and Hep3B were cultured in Dulbecco’s modified Eagle’s medium with 10% fetal bovine serum, 100 IU/mL penicillin, and 100 μg/mL streptomycin at 37ºC in 10% CO2. Antibodies against phosphorylated NRF2 (P‐NRF2), NRF2, PD‐L1, and HIF1α were purchased from Abcam (Cambridge, United Kingdom). β‐actin antibody was obtained from Sigma‐Aldrich (St. Louis, MO). Stealth RNA interference (RNAi; Thermo Fisher Scientific, Waltham, MA; GE Healthcare Dharmacon, Lafayette, CO) was used to knock down HIF1A.
Generation of NRF2‐Expressing Cells and NFE2L2 and HIF1A Gene Suppression
NRF2 plasmid (NM_006164; Origene) was transfected into HCC cells using the jetPRIME kit (Polyplus Transfection). An empty vector (pCMV6‐Entry Vector; Origene) was also transfected into HCC cells as a control. Forty‐eight hours after transfection, HCC cells were selected with 500 μg/mL G418 (Sigma‐Aldrich). The limiting dilution method was used for the isolation of single‐cell clones from the transfected HCC cells. Selected single cells were placed in each well of culture plates, and the clonal populations growing from each cell were isolated. HCC cells were checked for mycoplasma infection before and after transfection, and all were negative.
We used NFE2L2‐knockdown or HIF1A‐knockdown cells. Transient gene suppression was achieved in HuH7 and Hep3B HCC cells using Stealth RNAi. Cells were prepared in complete growth medium without antibiotics (50,000 cells per 500 µL; 30%‐50% confluency 24 hours after plating). Then reverse transfection was performed using 10 nM Stealth RNAi with Opti‐MEM I Reduced Serum Medium and Lipofectamine RNAiMAX for 24 hours at 37°C in a CO2 incubator.
Western Blotting
Samples were lysed in lysis buffer containing 50 mmol/L Tris HCl (pH 6.8) and 10% sodium dodecyl sulfate, and the protein concentration of each sample was determined using a Bio‐Rad Protein Assay kit (Hercules, CA). Samples were heated at 95°C for 5 minutes and subjected to electrophoresis using SuperSep Ace 12% gels (Fujifilm) at 20 mA for 80 minutes. The Trans‐Blot Turbo Transfer System (Bio‐Rad) was used to transfer proteins onto polyvinylidene fluoride membranes (Bio‐Rad). Primary and secondary antibodies were diluted in iBind solution (Invitrogen, Waltham, MA). Primary antibodies were anti‐rabbit NRF2 antibody (dilution 1:1,000; Abcam), anti‐rabbit P‐NRF2 (dilution 1:1,000; Abcam), anti‐rabbit HIF1α (dilution 1:1000; Abcam), anti‐rabbit PD‐L1 (dilution 1:500; Abcam), and anti‐rabbit glyceraldehyde 3‐phosphate dehydrogenase (GAPDH; dilution 1:5,000; GeneTex, Irvine, CA). Secondary antibody was goat anti‐rabbit immunoglobulin G (IgG) H&L (1:5,000; Abcam) and anti‐mouse IgG H&L (1:5,000; Abcam). The membranes were incubated in iBind solution (Invitrogen) with primary and secondary antibodies. Each blot was incubated with Chemiluminescent HRP Antibody Detection Reagent (Denville Scientific, Holliston, MA) and imaged using Amersham Imager 600 (GE Healthcare).
Immunohistochemical Staining
Immunohistochemical (IHC) staining for P‐NRF2 and PD‐L1 was performed on 4‐μm‐thick formalin‐fixed and paraffin‐embedded sections. Sections were first deparaffinized and then blocked with 10% normal goat serum. The tissue sections were incubated with P‐NRF2 primary antibody (rabbit monoclonal; 1:100; clone #EP1809Y; Abcam) at 4°C overnight. Stained slides were scanned using the NanoZoomer (Hamamatsu Photonics KK, Japan). IHC data for P‐NRF2 staining were evaluated by three experienced researchers (N.I., K.Y., and K.K.) who were blinded to the clinical statuses of the patients. The final assessments were achieved by consensus. The staining intensities of cancer cells with nuclear staining for P‐NRF2 were scored as 0 (negative), 1 (weak), 2 (moderate), or 3 (strong). Tumor cell staining was scored as 0 (0%), 1 (1%‐25%), 2 (26%‐50%), 3 (51%‐75%), or 4 (76%‐100%). IHC for PD‐L1 was performed as described previously.( 11 ) We set the cutoff of PD‐L1 positivity at 1%.( 11 , 14 )
Immunofluorescence
Treated cells were first incubated with 4% paraformaldehyde for 10 minutes at room temperature and then blocked with 5% goat serum for 60 minutes at room temperature. Cells were then incubated with primary antibodies (P‐Nrf2, dilution 1:2,000, Abcam; PD‐L1, dilution 1:1,000, Cell Signaling Technology, Danvers, MA) at 4°C overnight, followed by incubation with Alexa Fluor 597‐conjugated or Alexa Fluor 488‐conjugated secondary antibodies (1:250, Thermo Fisher Scientific) for 1 hour at room temperature. Cells were then stained with diamidino‐phenylindole for 10 minutes at room temperature. After washes, cells were observed using a fluorescence microscope (Biorevo BZ‐9000; Keyence, Osaka, Japan).
RNA Extraction, Real‐Time Polymerase Chain Reaction, and Polymerase Chain Reaction Array
Total RNA was extracted from cells using the Maxwell RSC simplyRNA Cells Kit (Promega, Madison, WI). Quantitative real‐time polymerase chain reaction (PCR) was performed using the ABI Prism 7000 Sequence Detection System (Applied Biosystems, Foster City, CA). The primers used in this study were as follows: glucose transporter 1 (GLUT1) forward 5′‐CTGCAACGGCTTAGACTTCGAC‐3’ and reverse 5’‐TCTCTGGGT‐AACAGGGATCAAACA‐3’; hexokinase 2 (HK2) forward 5’‐AACAGCCTGGACGAGAGCATC‐3’ and reverse 5’‐AGGTCAAACTCCTCTCGCCG‐3′; phosphoglycerate kinase 1 (PGK1) forward 5′‐ATGCTGAGGCTGTCACTCGG‐3′ and reverse 5′‐CACAGCAAGTGGCAGTGTCTCC‐3′; and pyruvate kinase L/R (PKLR) forward 5′‐TGGGAAAACTGGGTGGGATGGATG‐3′ and reverse 5′‐GAAGGAAGCAGCCGGGGATTTGAC‐3′. Relative expression was calculated using the 2−∆∆Ct method. Each sample was analyzed in triplicate. PCR array was performed using RT2 Profiler PCR Arrays (Qiagen, Hilden, Germany).
Determination of Cell Viability
Cell viability was evaluated using the CellTiterGlo luminescent cell viability assay kit (Promega), which determines cellular viability using adenosine triphosphate levels.
Transwell Migration and Invasiveness Assay
Cell migration and invasiveness assays used Falcon Permeable Supports for 24‐well plates with an 8.0‐µm Transparent PET Membrane (Corning, Corning, NY). Cell invasion assays were performed using 15 µL Matrigel Matrix (5 mg/mL) (Corning) to coat the bottom of each Transwell insert. Stained cells using Diff‐Quik (JACLaS, Tokyo, Japan) on the Transwell membrane surface were counted in five randomly selected fields at ×200 magnification and quantified using Image J software (https://imagej.net/). The experiment was repeated 3 times.
Tissue Samples
A total of 355 patients with HCC who underwent hepatic resection at the Department of Surgery and Science, Kyushu University Hospital, between January 2002 and December 2018, were enrolled in this study. The details of our surgical techniques and patient selection criteria for hepatic resection in HCC were previously reported.( 15 ) No patients received preoperative treatment. Patients were followed up as outpatients every 1 to 3 months after discharge. Dynamic computed tomography was performed by radiologists every 3 months, and magnetic resonance imaging was performed if recurrence was suspected. Clinical information and follow‐up data were obtained from medical records. This study was approved by the ethics committee of Kyushu University (approval code: 2020‐745).
18F‐FDG PET/CT
In each patient, 185 MBq FDG was intravenously administered after fasting for at least 4 hours. Scans were conducted from the middle of the thigh to the top of the skull 60 minutes after FDG administration. FDG‐PET/CT images were obtained using an integrated PET/CT scanner (Discovery STE; GE Medical Systems, Milwaukee, WI) or Biograph mCT (Siemens Medical Solutions, Erlangen, Germany). All emission scans were performed in the 3‐dimensional mode, and the acquisition time per bed position was 3 minutes for Discovery STE and 2 minutes for Biograph mCT. We reconstructed PET images using the ordered subset expectation maximization method (VUE Point Plus) with two full iterations of 28 subsets for the Discovery STE and iterative True‐X algorithm, and time‐of‐flight (Ultra HD‐PET) with two full iterations of 21 subsets. The True‐X algorithm incorporates an additional specific correction for the point‐spread function. The FWHM values of the Discovery STE and Biograph mCT were 5.2 and 4.4 mm, respectively. A low‐dose 16‐slice CT image (tube voltage 120 kV; effective tube current 30‐250 mA; Discovery STE) and a low‐dose 32‐slice CT image (tube voltage 120 kV; angular and longitudinal dose modulation; CAREDose4D; Biograph mCT) from the vertex to the proximal thigh were performed for attenuation correction and to determine the precise anatomical location of the lesions before the acquisition of PET images. CT scans were reconstructed by filtered back projection into 512 × 512 pixel images with a slice thickness of 5 mm to match the PET scan. FDG uptake in lesions was evaluated using SUVmax and calculated using a dedicated workstation for each scanner. The best cutoff values of these markers were determined by the receiver operating characteristic curve.
Statistical Analysis
Standard statistical analyses were used to evaluate descriptive statistics, such as medians, frequencies, and percentages. Continuous variables without a normal distribution and variables, such as the data obtained using cell lines, were compared using the Mann‐Whitney U test. A logistic regression analysis was performed to identify variables for P‐NRF2 expression. Categorical variables were compared using the χ2 test or Fisher’s exact test. Survival data were used to establish a univariate Cox proportional hazards model. Covariates that were significant at P < 0.05 were included in the multivariate Cox proportional hazards model. Cumulative overall survival (OS) and recurrence‐free survival (RFS) rates were calculated using the Kaplan‐Meier method, and differences between the curves were evaluated using the log‐rank test. Differences were considered significant at P < 0.05. All statistical analyses were performed using JMP15 software (SAS Institute Inc., Cary, NC).
Results
P‐NRF2 Expression and Clinicopathological Characteristics in HCC
To estimate the expression levels of P‐NRF2 in HCC, we performed IHC staining of 335 HCC tissues. The cancer cells showed nuclear staining for P‐NRF2 (Fig. 1). We used Q score to quantify expression, which is the sum of the intensity and proportion scores and ranges from 0 to 7.( 16 ) The median P‐NRF2 Q score was 3. A Q score < 4 was considered negative and a Q score ≥ 4 was positive. The associations between P‐NRF2 expression and clinicopathological characteristics in patients with HCC were evaluated. Table 1 summarizes the clinicopathological factors of patients with high and low P‐NRF2 expression. A total of 121 (36.1%) patients were positive for P‐NRF2. P‐NRF2 protein expression was higher in patients with high AFP (P = 0.0229), high rates of poorly differentiated HCC (P < 0.0001), and microscopic intrahepatic metastasis (P = 0.0244).
FIG. 1.
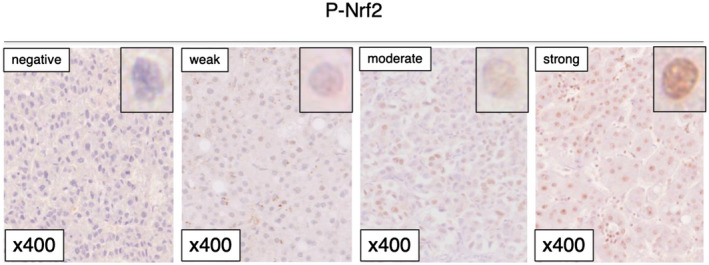
IHC staining of P‐NFR2 in patients with HCC.
TABLE 1.
Association Between P‐NRF2 and Patient Clinicopathological Factors
| Characteristic | P‐NRF2‐Low (n=214) | P‐NRF2‐High (n = 121) | P Value |
|---|---|---|---|
| Age (years) | 70 (64‐77) | 69 (63‐76) | 0.8083 |
| Sex, male/female | 154/60 | 87/34 | 0.9904 |
| BMI (kg/m2) | 22.96 (20.79‐25.35) | 23.67 (21.68‐25.85) | 0.1614 |
| Diabetes mellitus | 71 (33.1%) | 38 (31.4%) | 0.7394 |
| HBs‐Ag‐positive | 37 (17.2%) | 20 (16.5%) | 0.8587 |
| HCV‐Ab‐positive | 108 (50.4%) | 58 (47.9%) | 0.6560 |
| Albumin (g/dL) | 4.0 (3.8‐4.2) | 3.9 (3.7‐4.3) | 0.1081 |
| Child‐Pugh classification, grade B | 6 (2.8%) | 5 (4.1%) | 0.5346 |
| AFP (ng/mL) | 8.9 (4.0‐48.1) | 16.9 (4.8‐417) | 0.0229 |
| DCP (mAU/mL) | 99 (25‐418) | 105 (27‐793) | 0.3388 |
| Tumor size (cm) | 3.2 (2.4‐4.8) | 3.4 (2.3‐5.5) | 0.5961 |
| Solitary/multiple | 178/36 | 98/23 | 0.6139 |
| BCLC staging, B or C | 27 (12.6%) | 22 (18.1%) | 0.1661 |
| Gross classification, single nodular type | 129 (60.3%) | 80 (66.1%) | 0.2896 |
| Poorly differentiated | 40 (18.6%) | 48 (39.6%) | < 0.0001 |
| Microscopic vascular invasion | 62 (28.9%) | 34 (28.1%) | 0.8652 |
| Microscopic intrahepatic metastasis | 22 (10.2%) | 23 (19.0%) | 0.0244 |
| F3 or F4 | 86 (40.1%) | 52 (42.9%) | 0.6184 |
The data are presented as n (%) or median (IQR).
Abbreviations: BCLC, Barcelona Clinic Liver Cancer; BMI, body mass index; DCP, des‐gamma‐carboxyprothrombin; HBs‐Ag, hepatitis B surface antigen; and HCV‐Ab, hepatitis C virus antibody.
P‐NRF2 Expression and SUVmax
Next, we assessed the association between IHC staining for P‐NRF2 and SUVmax in 171 patients with HCC. P‐NRF2‐positive expression in cancer cells was associated with a significantly high SUVmax compared with P‐NRF2‐negative expression (P‐NRF2‐positive: median 4.89, interquartile range [IQR] 3.66‐6.73; P‐NRF2‐negative: median 3.38, IQR 2.91‐4.21; P < 0.0001) (Fig. 2).
FIG. 2.
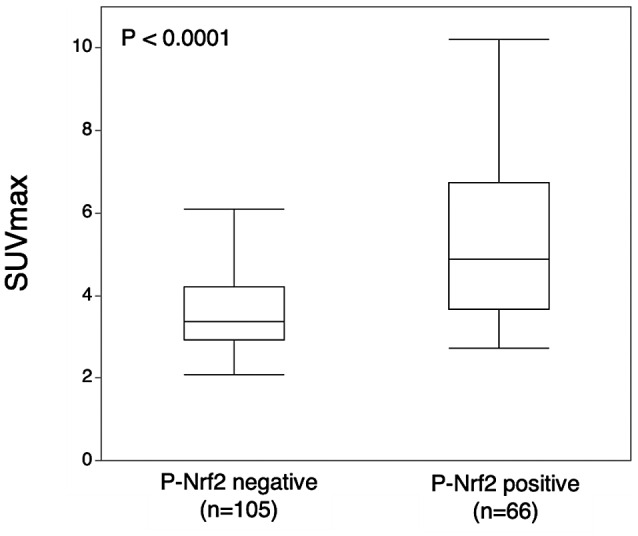
Relationship between P‐NRF2 and SUVmax. The median SUVmax values with P‐NRF2 negativity and positivity were 3.38 (IQR 2.91‐4.21) and 4.89 (IQR 3.66‐6.73), respectively (P < 0.0001).
P‐NRF2 Expression and Patient Survival
Next, we assessed whether P‐NRF2 expression was related to postoperative survival using the Kaplan‐Meier method. The 10‐year RFS and OS rates were 19.0% and 31.5%, respectively, in patients with high P‐NRF2 expression, and 24.9% and 60.9%, respectively, in patients with low P‐NRF2 expression (Fig. 3A,B). Patients with high P‐NRF2 expression had a significantly worse prognosis than those with low P‐NRF2 expression for RFS (log rank P < 0.001) and OS (log rank P < 0.0001) (Fig. 3A,B). Among the 193 cases with recurrence, the rate of postoperative intrahepatic metastasis with multiple nodules was higher in patients with high P‐NRF2 expression than in those with low P‐NRF2 expression (22 of 76 [29.0%] vs. 11 of 117 [9.4%]; P = s0.0005). There was no significant difference in the rate of distant metastasis between high and low P‐Nrf2 expression group (11 of 76 [14.5%] vs. 12 of 117 [10.3%]; P = 0.3810). The rate of repeat hepatic resection or local ablation therapy for intrahepatic recurrence tended to be higher in patients with low P‐NRF2 expression than in those with high P‐NRF2 expression (36 of 76 [47.4% vs. 70 of 117 [59.8%]; P = 0.0892). The rate of using molecular target agents was higher in patients with high P‐NRF2 expression than in those with low P‐NRF2 expression (6 of 76 [7.9%] vs. 2 of 117 [1.7%]; P = 0.0365).
FIG. 3.
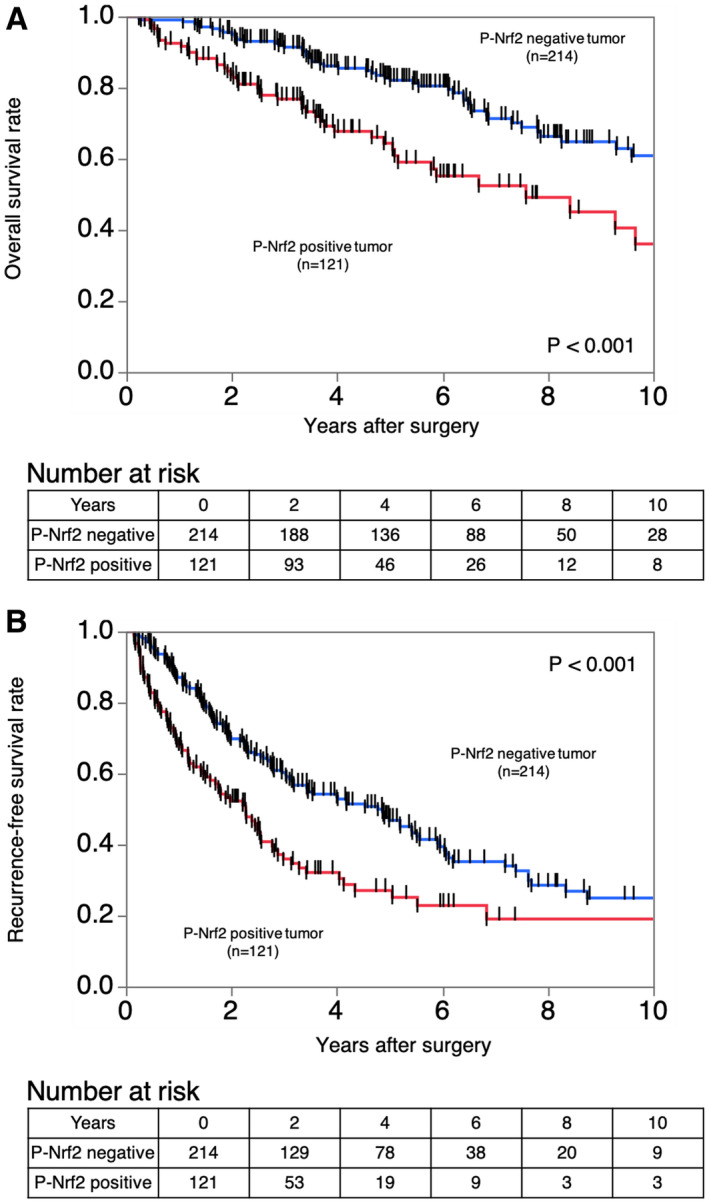
Kaplan‐Meier curves showing the survival of patients with HCC according to the expression of P‐NRF2. (A) RFS in all patients. (B) OS in all patients.
Univariate and Multivariate Analyses of Prognostic Factors for RFS and OS
Table 2 lists the univariate and multivariate analyses results associated with RFS and OS after hepatic resection in patients with HCC. Cox proportional hazards regression model with multivariate analysis showed that P‐NRF2‐positive expression in cancer cells was associated with significantly worse RFS and OS (hazard ratio [HR] 1.95, 95% confidence interval [CI] 1.43‐2.66, P < 0.0001 and HR 1.91, 95% CI 1.23–2.95, P = 0.0037, respectively).
TABLE 2.
Univariate and Multivariate Analyses of Factors Related to RFS and OS in Patients With HCC Who Had Undergone Hepatic Resection (Cox Proportional Hazards Analysis)
| Factor | RFS | OS | |||
|---|---|---|---|---|---|
| Univariate Analysis | Multivariate Analysis | Univariate Analysis | Multivariate Analysis | ||
| HR (95% CI) | HR (95% CI) | HR (95% CI) | HR (95% CI) | ||
| P Value | P Value | P Value | P Value | ||
| Age (years) | 1.008 (0.995‐1.022) | 1.025 (1.005‐1.048) | 1.030 (1.005‐1.057) | ||
| 0.2126 | 0.0161 | 0.0180 | |||
| Sex | Male | 1.351 (0.965‐1.892) | 0.858 (0.558‐1.320) | ||
| Female | 0.0796 | 0.4886 | |||
| Diabetes mellitus | Positive | 0.947 (0.698‐1.285) | 0.928 (0.594‐1.449) | ||
| Negative | 0.7273 | 0.7439 | |||
| HBsAg | Positive | 0.909 (0.628‐1.314) | 0.758 (0.442‐1.299) | ||
| Negative | 0.6130 | 0.3146 | |||
| HCV‐Ab | Positive | 1.115 (0.840‐1.479) | 1.593 (1.058‐2.398) | 1.760 (1.087‐2.850) | |
| Negative | 0.4489 | 0.0255 | 0.0214 | ||
| Albumin | 0.526 (0.379‐0.735) | 0.559 (0.398‐0.790) | 0.345 (0.219‐0.549) | 0.456 (0.268‐0.782) | |
| 0.0001 | 0.0009 | < 0.0001 | 0.0040 | ||
| Child‐Pugh classification | B | 1.227 (0.576‐2.614) | 2.122 (0.924‐4.872) | ||
| A | 0.5953 | 0.0757 | |||
| AFP | 1.000 (1.000‐1.000) | 1.000 (1.000‐1.000) | 1.000 (1.000‐1.000) | 0.999 (0.999‐1.000) | |
| < 0.0001 | 0.0079 | 0.0050 | 0.2074 | ||
| DCP | 1.000 (1.000‐1.000) | 0.999 (0.999‐1.000) | 1.000 (1.000‐1.000) | 0.999 (0.999‐1.000) | |
| 0.0063 | 0.6907 | 0.0392 | 0.2037 | ||
| Tumor size | 1.101 (1.048‐1.153) | 1.021 (0.947‐1.093) | 1.124 (1.055‐1.190) | 1.059 (0.945‐1.181) | |
| < 0.0001 | 0.5678 | 0.0001 | 0.3040 | ||
| Macroscopic tumor number | Multiple | 2.209 (1.560‐3.070) | 1.314 (0.775‐2.227) | 2.061 (1.313‐3.234) | 2.190 (0.975‐4.914) |
| Single | < 0.0001 | 0.3106 | 0.0017 | 0.0573 | |
| BCLC staging | B or C | 2.972 (2.091‐4.224) | 1.615 (0.890‐2.932) | 3.698 (2.399‐5.700) | 3.537 (1.591‐7.860) |
| 0 or A | < 0.0001 | 0.1148 | < 0.0001 | 0.0019 | |
| Poorly differentiated | Present | 1.565 (1.149‐2.131) | 0.961 (0.673‐1.372) | 1.859 (1.232‐2.804) | 1.004 (0.604‐1.669) |
| Absent | 0.0044 | 0.8286 | 0.0031 | 0.9854 | |
| Microscopic vascular invasion | Present | 1.447 (1.071‐1.955) | 1.294 (0.920‐1.818) | 2.016 (1.352‐3.004) | 1.498 (0.927‐2.423) |
| Absent | 0.0160 | 0.1378 | 0.0006 | 0.0986 | |
| Microscopic intrahepatic metastasis | Present | 3.379 (2.318‐4.924) | 2.144 (1.299‐3.538) | 3.379 (2.107‐5.416) | 2.592 (1.301‐5.163) |
| Absent | < 0.0001 | 0.0028 | < 0.0001 | 0.0067 | |
| Microscopic liver fibrosis | F3 or F4 | 1.292 (0.972‐1.716) | 1.519 (1.019‐2.263) | 1.891 (1.214‐2.946) | |
| F0, F1, or F2 | 0.0768 | 0.0399 | 0.0048 | ||
| P‐NRF2 | High | 1.787 (1.334‐2.395) | 1.952 (1.430‐2.664) | 2.270 (1.521‐3.388) | 1.910 (1.234‐2.955) |
| Low | < 0.0001 | < 0.0001 | < 0.0001 | 0.0037 | |
Abbreviations: BCLC, Barcelona Clinic Liver Cancer; DCP, des‐gamma carboxyprothrombin; HBsAg, hepatitis B surface antigen; and HCV‐Ab, hepatitis C virus antibody.
Association of NRF2 Expression and Cancer Metabolism
We investigated the association of NRF2 and metabolism in Hep3B and HuH7 HCC cell lines, because there is a clinical relationship between P‐NRF2 and metabolism. Messenger RNA (mRNA) expression in NRF2‐overexprssing Hep3B cell and control Hep3B cell was analyzed using RNA arrays. A heatmap showed distinct differences in mRNA expression in NRF2‐overexpressing cells compared with mRNA expression in control cells. Compared with control cells, glycolysis‐related mRNA was up‐regulated in NRF2‐overexpressing cells (Fig. 4A). GLUT1, HK2, PKLR, and PGK1 expression was next assessed using quantitative real‐time PCR in NRF2‐overexpressing cells and control cells. GLUT1, HK2, PKLR, and PGK1 expression was higher in NRF2‐overexpressing cells (Fig. 4B,C). We next investigated the proliferation of NRF2‐overexpressing cells using the CellTiterGlo luminescent cell viability assay kit (Promega). The results showed that NRF2‐overexpressing cells had a significantly higher proliferation rate compared with the control cells (Supporting Fig. S1A). Moreover, we performed Transwell assays to investigate the influence of NRF2 on migration and invasion. Compared with the control, migration and invasion was up‐regulated in NRF2‐overexpressing cells (Supporting Fig. S1B,C).
FIG. 4.
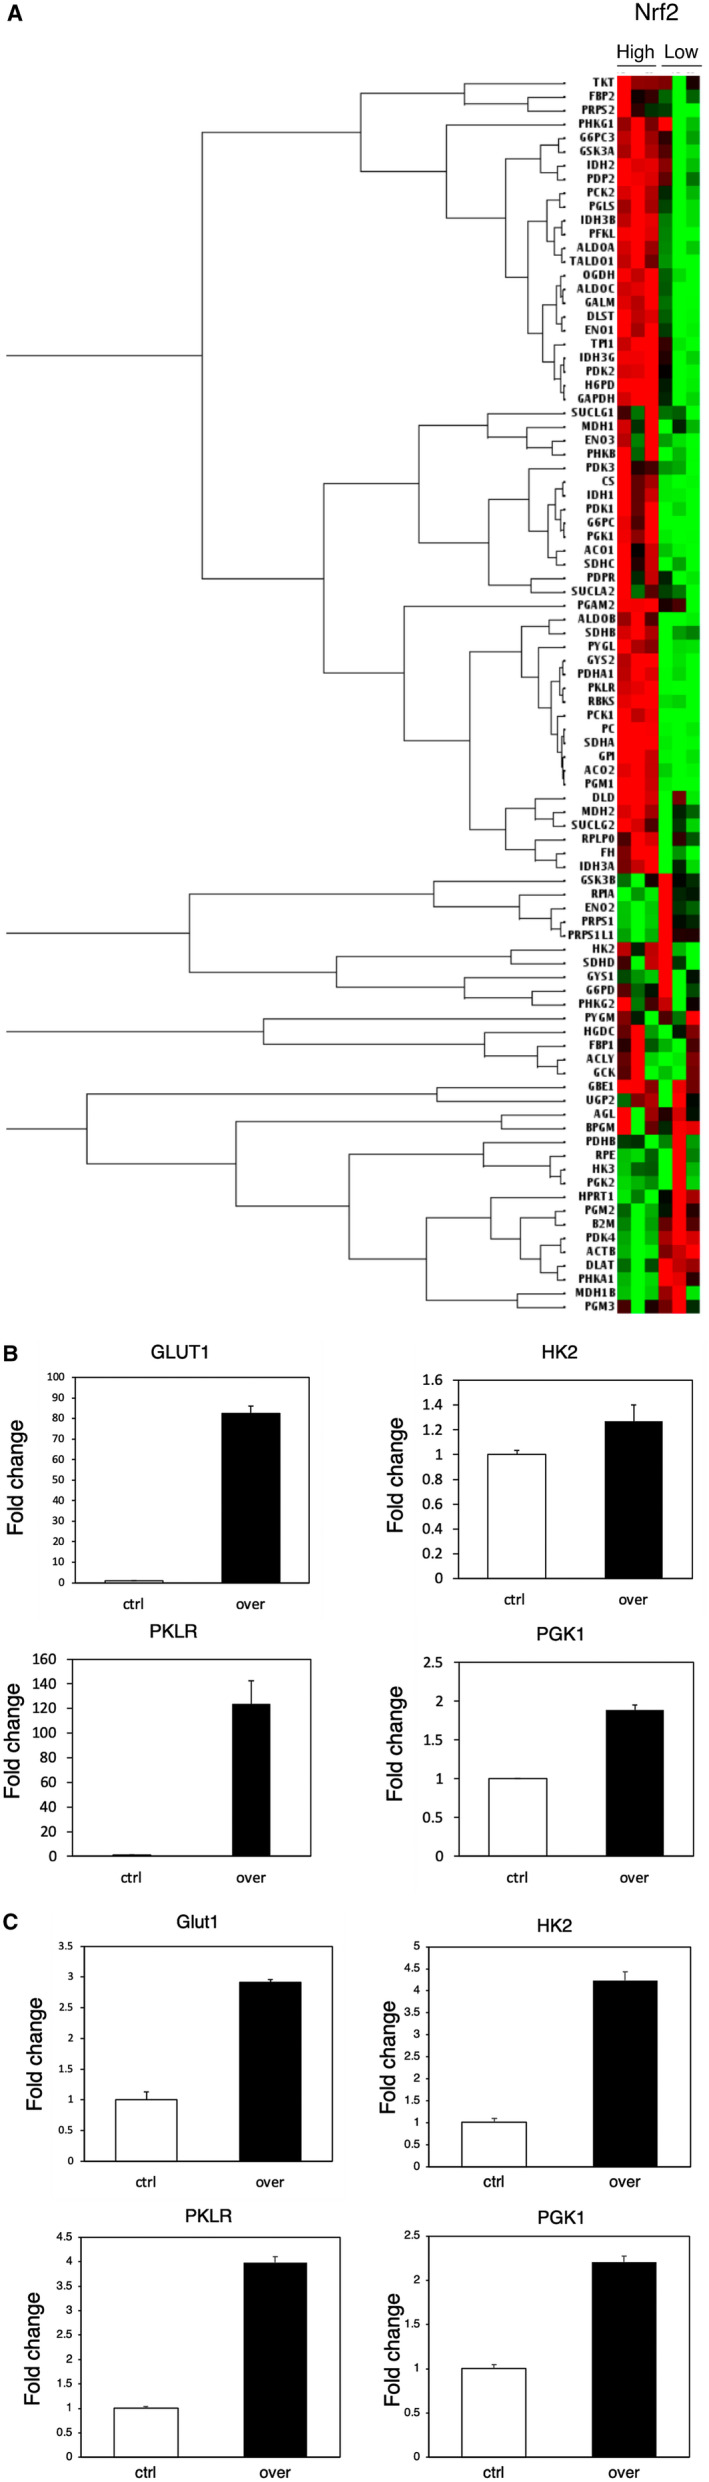
Relationship between NRF2 and metabolism in HCC. (A) Heatmap shows distinct differences in mRNA expression in NRF2‐high cells and NRF2‐low cells. (B,C) GLUT1, HK2, PKLR, and PGK1 expression were assessed using quantitative real‐time PCR in NRF2‐overexpressing cells and control cells. Abbreviations: ACLY, ATP Citrate Lyase; ACO1, Aconitase 1; ACO2, Aconitase 2; ACTB, Actin Beta; AGL, Amylo‐Alpha‐1, 6‐Glucosidase, 4‐Alpha‐Glucanotransferase; ALDOB, Aldolase, Fructose‐Bisphosphate B; ALDOC, Aldolase, Fructose‐Bisphosphate C; B2M, Beta‐2‐Microglobulin; BPGM, Bisphosphoglycerate Mutase; CS, Citrate Synthase; Ctrl, control; DLAT, Dihydrolipoamide S‐Acetyltransferase; DLD, Dihydrolipoamide Dehydrogenase; DLST, Dihydrolipoamide S‐Succinyltransferase; ENO1, Enolase 1; ENO1, Enolase 1; ENO3, Enolase 3; FBP1, Fructose‐Bisphosphatase 1; FBP2, Fructose‐Bisphosphatase 2; FH, Fumarate Hydratase; G6PC, Glucose‐6‐Phosphatase Catalytic Subunit ; G6PC3, Glucose‐6‐Phosphatase Catalytic Subunit 3; G6PD, Glucose‐6‐Phosphate Dehydrogenase; GALM, Galactose Mutarotase; GAPDH, Glyceraldehyde‐3‐Phosphate Dehydrogenase; GBE1, 1,4‐Alpha‐Glucan Branching Enzyme 1; GCK, Glucokinase; GPI, Glucose‐6‐Phosphate Isomerase; GSK3A, Glycogen Synthase Kinase 3 Alpha; GSK3B, Glycogen Synthase Kinase 3 Beta; GYS1, Glycogen Synthase 1; GYS2, Glycogen Synthase 2; H6PD, Hexose‐6‐Phosphate Dehydrogenase/Glucose 1‐Dehydrogenase; HK3, Hexokinase 3; HPRT1, Hypoxanthine Phosphoribosyltransferase 1; IDH1, Isocitrate Dehydrogenase (NADP(+)) 1; IDH2, Isocitrate Dehydrogenase (NADP(+)) 2; IDH3A, Isocitrate Dehydrogenase (NAD(+)) 3 Catalytic Subunit Alpha; IDH3B, Isocitrate Dehydrogenase (NAD(+)) 3 Non‐Catalytic Subunit Beta; IDH3G, Isocitrate Dehydrogenase (NAD(+)) 3 Non‐Catalytic Subunit Gamma; MDH1, Malate Dehydrogenase 1; MDH1B, Malate Dehydrogenase 1B; MDH2, Malate Dehydrogenase 2; PC, Pyruvate Carboxylase; PCK1,Phosphoenolpyruvate Carboxykinase 1; PCK2, Phosphoenolpyruvate Carboxykinase 2; PDHA1, Pyruvate Dehydrogenase E1 Subunit Alpha 1; PDHB, Pyruvate Dehydrogenase E1 Subunit Beta; PDK1, Pyruvate Dehydrogenase Kinase 1; PDK2, Pyruvate Dehydrogenase Kinase 2; PDK3, Pyruvate Dehydrogenase Kinase 3; PDK4, Pyruvate Dehydrogenase Kinase 4; PDP2, Pyruvate Dehyrogenase Phosphatase Catalytic Subunit 2; PDPR, Pyruvate Dehydrogenase Phosphatase Regulatory Subunit; PFKL, Phosphofructokinase, Liver Type; PGAM2, Phosphoglycerate Mutase 2; PGK2, Phosphoglycerate Kinase 2; PGLS, 6‐Phosphogluconolactonase; PGM1, Phosphoglucomutase 1; PGM2, Phosphoglucomutase 2; PGM3, Phosphoglucomutase 3; PHKA1, Phosphorylase Kinase Regulatory Subunit Alpha 1; PHKB, Phosphorylase Kinase Regulatory Subunit Beta; PHKG1, Phosphorylase Kinase Catalytic Subunit Gamma 1; PHKG2, Phosphorylase Kinase Catalytic Subunit Gamma 2; PRPS1, Phosphoribosyl Pyrophosphate Synthetase 1; PRPS1L1, Phosphoribosyl Pyrophosphate Synthetase 1 Like 1; PRPS2, Phosphoribosyl Pyrophosphate Synthetase 2; PYGL, Glycogen Phosphorylase L; PYGM, Glycogen Phosphorylase, Muscle Associated; RBKS, Ribokinase; RPE, Ribulose‐5‐Phosphate‐3‐Epimerase; RPIA, Ribose 5‐Phosphate Isomerase A; RPLP0, Ribosomal Protein Lateral Stalk Subunit P0; SDHA, Succinate Dehydrogenase Complex Flavoprotein Subunit A; SDHB, Succinate Dehydrogenase Complex Iron Sulfur Subunit B; SDHC, Succinate Dehydrogenase Complex Subunit C; SDHD, Succinate Dehydrogenase Complex Subunit D; SUCLA2, Succinate‐CoA Ligase ADP‐Forming Subunit Beta; SUCLG1, Succinate‐CoA Ligase GDP/ADP‐Forming Subunit Alpha; SUCLG1, Succinate‐CoA Ligase GDP/ADP‐Forming Subunit Alpha; TKT, Transketolase; TPI1, Triosephosphate Isomerase 1; UGP2, UDP‐Glucose Pyrophosphorylase 2.
P‐NRF2 Regulated PD‐L1 Expression Through HIF1α
Previously, we reported a relationship between metabolic activity and immune status and demonstrated that PD‐L1 expression in cancer cells was associated with clinical outcome in patients with HCC.( 10 , 11 ) Using these previous data of PD‐L1 expression, the relationship between P‐NRF2 and PD‐L1 expression was examined in 335 patients with HCC. Thirty‐seven of 121 (30.6%) cases with positive expression of P‐NRF2 showed positive expression of PD‐L1, and 34 of 214 (15.9%) cases with negative expression of P‐NRF2 showed negative expression of PD‐L1. This indicated that P‐NRF2 expression was significantly correlated with PD‐L1 protein levels in HCC (P = 0.0016).
NRF2 directly regulates the expression of HIF1α in various cancer types.( 17 ) Increased HIF1 levels were associated with increased PD‐L1 expression.( 18 ) To test whether NRF2 expression regulated PD‐L1 expression through HIF1α‐regulated PD‐L1 expression in HCC cell lines, we confirmed NRF2, HIF1α, and PD‐L1 protein levels in control and NRF2‐overexpressing HCC cell lines by western blot analysis. We found that HIF1α and PD‐L1 protein levels were increased in NRF2‐overexpressing cells with interferon gamma (IFN‐γ) (Fig. 5A). Next, we investigated whether NRF2 increased PD‐L1 expression via HIF1α. HIF1A expression was knocked down and PD‐L1 expression was examined in NRF2‐overexpressing cells. In HIF1A knockdown cells, PD‐L1 expression was reduced compared with the control with IFN‐γ (Fig. 5B). We also found that PD‐L1 protein expression was higher in NRF2 overexpression cells compared with control cells using immunofluorescent double staining (Supporting Fig. S2). Specifically, it was considered that NRF2 increased the expression of PD‐L1 through HIF1α.
FIG. 5.
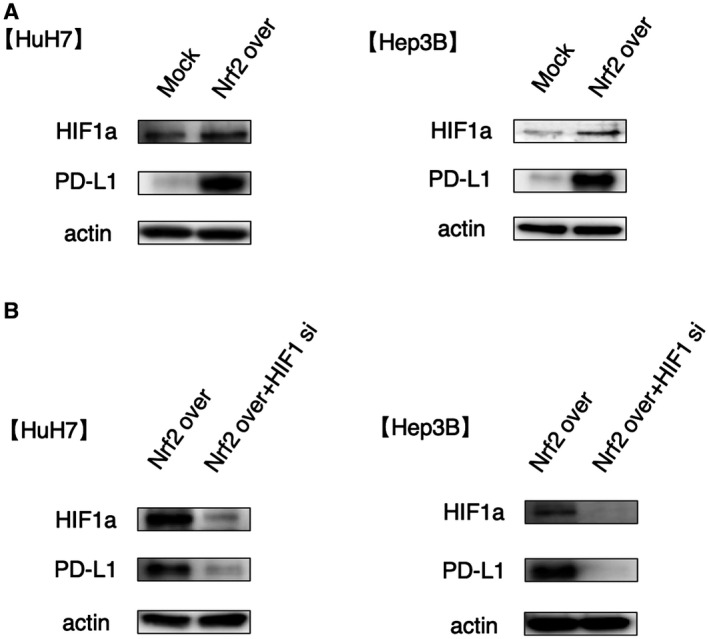
Overexpression of NRF2 increases PD‐L1 expression through HIF1α. (A) Control and NRF2‐overexpressing Hep3B and HuH7 cell lines were treated with IFN‐γ. (B) NRF2‐overexpressing cells with control and HIF1A knockdown were treated with IFN‐γ.
Discussion
In the present study, we analyzed P‐NRF2 expression in patients with HCC who had undergone hepatic resection. A high P‐NRF2 expression pattern was a significantly poor prognostic factor. NRF2 regulates glucose metabolism, and high NRF2 expression in cancer cells was associated with high SUVmax. Additionally, we showed that NRF2 expression in cancer cells regulated PD‐L1 expression through HIF1α.
Several recent reports have evaluated the prognostic impact of NRF2 protein expression in various cancers.( 19 , 20 ) Kitano et al. showed that high NRF2 expression was significantly associated with cell proliferation.( 21 ) High expression of NRF2 and its downstream effectors promoted migration and invasion of cancer cells.( 22 ) Furthermore, NRF2 could mediate chemoresistance and radioresistance in tumor therapy.( 23 , 24 ) In this study, we demonstrated that high P‐NRF2 expression was associated with high AFP, poor differentiation, and microscopic intrahepatic metastasis. Our findings are consistent with previous results. The present report used a large sample size to reveal the critical stratification of prognosis in patients with HCC on the basis of P‐NRF2 expression.
In the current study, we observed that GLUT1, HK2, PKLR, and PGK1 mRNA expression was higher in NRF2‐overexpressing cells, and NRF2 was related to glucose metabolism. Several recent studies suggested that NRF2 regulates cancer metabolism in various types of cancer.( 19 , 25 ) The phosphatidylinositol 3‐kinase‐protein kinase/AKT pathway augments the nuclear accumulation of NRF2 and enables NRF2 to promote glucose metabolic activities that support cell proliferation in addition to enhancing cytoprotection.( 8 ) HIF1α was also shown to have critical roles in the regulation of glycolysis metabolism, and up‐regulates the expression of GLUT1 and HK2.( 26 , 27 , 28 ) Collectively, NRF2 and HIF1α reinforce the malignant behavior of HCC by up‐regulating proliferation and glucose metabolism.
The molecular mechanisms involved in FDG imaging relate to its uptake by GLUT1 and metabolism by HK and glucose‐6‐phosphatase (G6Pase). FDG accumulates in malignant cells through GLUT1 transportation and HK phosphorylation.( 29 ) G6Pase, a gluconeogenesis enzyme strongly expressed in the liver,( 30 ) counteracts HK phosphorylation by converting glucose‐6‐phosphate to glucose. High G6Pase levels therefore reduce FDG accumulation by accelerating the conversion of FDG‐6‐phosphate to FDG‐6‐phosphate to FDG, leading to its release from cells.( 31 ) Low GLUT1 and high G6Pase expression contribute to low FDG uptake in HCC tumors, preventing efficient tumor detection. A pattern of high GLUT1 and low G6Pase expression in poorly differentiated HCC facilitates FDG uptake, similar to that of liver metastasis from colorectal cancer.( 31 , 32 ) Previously, we showed that 18F‐FDG PET/CT was correlated with clinical outcome and PD‐L1 expression in patients with HCC, and four subgroups were defined on the basis of the SUVmax of 18F‐FDG PET/CT and PD‐L1 expression, whereas vessels that encapsulate tumor clusters status were observed to have diverse prognostic features.( 10 ) In our current study, high NRF2 expression was significantly associated with high GLUT1 mRNA expression and high SUVmax. These findings indicated that in cancer cells with high NRF2 levels, NRF2 increased GLUT1 expression, increased FDG uptake, and promoted a high SUVmax.
Several studies have investigated the regulation of PD‐L1 expression in cancer cells. Mitogen‐activated protein kinase pathway, PI3K/AKT pathway, ARID1A, STAT3, CMTM6, HIF1, and NRF2 regulate PD‐L1 expression.( 13 , 14 , 33 , 34 , 35 , 36 , 37 ) Zhu et al. demonstrated that NRF2 protein binds the regulatory region of the PD‐L1 (CD274) gene.( 13 ) HIF1 regulates PD‐L1 through binding to the hypoxia response element of the CD274 promoter to activate CD274 transcription.( 38 ) NRF2 targets a functional antioxidant response element at the HIF1A locus, revealing a direct regulatory connection between two important oxygen‐responsive transcription factors.( 17 ) We demonstrated that NRF2 regulated the expression of PD‐L1 through HIF1α. In HCC, NRF2 might be involved in PD‐L1 expression through HIF1α rather than by directly regulating PD‐L1 expression.
The recent large phase 3 study IMbrave150 evaluated atezolizumab + bevacizumab versus sorafenib as the first treatment for patients with unresectable HCC. The study showed it to be statistically significant and clinically compared to sorafenib in patients with HCC.( 9 ) Sacher et al. showed that tumor PD‐L1 expression was associated with an increased likelihood of tumor response to PD‐L1 checkpoint inhibitors.( 39 ) We previously reported that PD‐L1‐positive expression in cancer cells was associated with a significantly higher SUVmax compared to PD‐L1‐negative expression.( 10 ) In the current study, we demonstrated that NRF2 was associated with SUVmax and PD‐L1 expression in cancer cells. We speculate that patients with HCC with SUVmax‐high may be more suitable for anti‐PD‐1/PD‐L1 therapy, because patients with HCC with SUVmax‐high reveal high PD‐L1 expression in cancer.
In summary, our large cohort study revealed that NRF2 expression in cancer cells was associated with clinical outcome. Additionally, we found that NRF2 was located upstream of cancer metabolism and tumor immunity.
Supporting information
Fig S1‐S2
Acknowledgment
The authors thank Ms. Saori Tsurumaru, Ms. Asuka Nakamura, Ms. Yuko Kubota, and Ms. Miki Nakashima for their technical support. We also thank H. Nikki March, Ph.D., Edanz Group (https://en‐author‐services.edanz.com/ac), for editing a draft of this manuscript.
Norifumi Iseda and Shinji Itoh contributed equally to this work.
Supported by the Japan Society for the Promotion of Science (19K09198 and JP‐16K10576).
Potential conflict of interest: Nothing to report.
References
Author names in bold designate shared co‐first authorship.
- 1. Villanueva A. Hepatocellular carcinoma. N Engl J Med 2019;380:1450‐1462. [DOI] [PubMed] [Google Scholar]
- 2. Itoh S, Morita K, Ueda S, Sugimachi K, Yamashita Y‐I, Gion T, et al. Long‐term results of hepatic resection combined with intraoperative local ablation therapy for patients with multinodular hepatocellular carcinomas. Ann Surg Oncol 2009;16:3299‐3307. [DOI] [PubMed] [Google Scholar]
- 3. Itoh S, Shirabe K, Taketomi A, Morita K, Harimoto N, Tsujita E, et al. Zero mortality in more than 300 hepatic resections: validity of preoperative volumetric analysis. Surg Today 2012;42:435‐440. [DOI] [PubMed] [Google Scholar]
- 4. DeNicola GM, Karreth FA, Humpton TJ, Gopinathan A, Wei C, Frese K, et al. Oncogene‐induced Nrf2 transcription promotes ROS detoxification and tumorigenesis. Nature 2011;475:106‐109. [DOI] [PMC free article] [PubMed] [Google Scholar]
- 5. Shimokawa M, Yoshizumi T, Itoh S, Iseda N, Sakata K, Yugawa K, et al. Modulation of Nqo1 activity intercepts anoikis resistance and reduces metastatic potential of hepatocellular carcinoma. Cancer Sci 2020;111:1228‐1240. [DOI] [PMC free article] [PubMed] [Google Scholar]
- 6. Sporn MB, Liby KT. NRF2 and cancer: the good, the bad and the importance of context. Nat Rev Cancer 2012;12:564‐571. [DOI] [PMC free article] [PubMed] [Google Scholar]
- 7. Zhang M, Zhang C, Zhang L, Yang Q, Zhou S, Wen Q, et al. Nrf2 is a potential prognostic marker and promotes proliferation and invasion in human hepatocellular carcinoma. BMC Cancer 2015;15:531. [DOI] [PMC free article] [PubMed] [Google Scholar]
- 8. Mitsuishi Y, Taguchi K, Kawatani Y, Shibata T, Nukiwa T, Aburatani H, et al. Nrf2 redirects glucose and glutamine into anabolic pathways in metabolic reprogramming. Cancer Cell 2012;22:66‐79. [DOI] [PubMed] [Google Scholar]
- 9. Finn RS, Qin S, Ikeda M, Galle PR, Ducreux M, Kim T‐Y, et al. Atezolizumab plus bevacizumab in unresectable hepatocellular carcinoma. N Engl J Med 2020;382:1894‐1905. [DOI] [PubMed] [Google Scholar]
- 10. Itoh S, Yoshizumi T, Kitamura Y, Yugawa K, Iseda N, Shimagaki T, Nagao Y, et al. Impact of metabolic activity in hepatocellular carcinoma: association with immune status and vascular formation. Hepatol Commun Mar 2021. 10.1002/hep4/1715. [Epub ahead of print] [DOI] [PMC free article] [PubMed] [Google Scholar]
- 11. Itoh S, Yoshizumi T, Yugawa K, Imai D, Yoshiya S, Takeishi K, et al. Impact of immune response on outcomes in hepatocellular carcinoma: association with vascular formation. Hepatology 2020;72:1987‐1999. [DOI] [PubMed] [Google Scholar]
- 12. Best SA, De Souza DP, Kersbergen A, Policheni AN, Dayalan S, Tull D, et al. Synergy between the KEAP1/NRF2 and PI3K pathways drives non‐small‐cell lung cancer with an altered immune microenvironment. Cell Metab 2018;27:935‐943.e934. [DOI] [PubMed] [Google Scholar]
- 13. Zhu BO, Tang L, Chen S, Yin C, Peng S, Li X, et al. Targeting the upstream transcriptional activator of PD‐L1 as an alternative strategy in melanoma therapy. Oncogene 2018;37:4941‐4954. [DOI] [PubMed] [Google Scholar]
- 14. Iseda N, Itoh S, Yoshizumi T, Yugawa K, Morinaga A, Tomiyama T, et al. ARID1A deficiency is associated with high programmed death ligand 1 expression in hepatocellular carcinoma. Hepatol Commun 2020. Dec 30. 10.1002/hep4.1659. [Epub ahead of print] [DOI] [PMC free article] [PubMed] [Google Scholar]
- 15. Itoh S, Shirabe K, Matsumoto Y, Yoshiya S, Muto J, Harimoto N, et al. Effect of body composition on outcomes after hepatic resection for hepatocellular carcinoma. Ann Surg Oncol 2014;21:3063‐3068. [DOI] [PubMed] [Google Scholar]
- 16. Chen J, Yu Y, Ji T, Ma R, Chen M, Li G, et al. Clinical implication of Keap1 and phosphorylated Nrf2 expression in hepatocellular carcinoma. Cancer Med 2016;5:2678‐2687. [DOI] [PMC free article] [PubMed] [Google Scholar]
- 17. Lacher SE, Levings DC, Freeman S, Slattery M. Identification of a functional antioxidant response element at the HIF1A locus. Redox Biol 2018;19:401‐411. [DOI] [PMC free article] [PubMed] [Google Scholar]
- 18. Barsoum IB, Koti M, Siemens DR, Graham CH. Mechanisms of hypoxia‐mediated immune escape in cancer. Cancer Res 2014;74:7185‐7190. [DOI] [PubMed] [Google Scholar]
- 19. DeNicola GM, Chen P‐H, Mullarky E, Sudderth JA, Hu Z, Wu D, et al. NRF2 regulates serine biosynthesis in non‐small cell lung cancer. Nat Genet 2015;47:1475‐1481. [DOI] [PMC free article] [PubMed] [Google Scholar]
- 20. Kitamura H, Motohashi H. NRF2 addiction in cancer cells. Cancer Sci 2018;109:900‐911. [DOI] [PMC free article] [PubMed] [Google Scholar]
- 21. Kitano Y, Baba Y, Nakagawa S, Miyake K, Iwatsuki M, Ishimoto T, et al. Nrf2 promotes oesophageal cancer cell proliferation via metabolic reprogramming and detoxification of reactive oxygen species. J Pathol 2018;244:346‐357. [DOI] [PubMed] [Google Scholar]
- 22. Lu Y, Shen T, Yang H, Gu W. Ruthenium complexes induce HepG2 human hepatocellular carcinoma cell apoptosis and inhibit cell migration and invasion through regulation of the Nrf2 pathway. Int J Mol Sci 2016;17:775. [DOI] [PMC free article] [PubMed] [Google Scholar]
- 23. Homma S, Ishii Y, Morishima Y, Yamadori T, Matsuno Y, Haraguchi N, et al. Nrf2 enhances cell proliferation and resistance to anticancer drugs in human lung cancer. Clin Cancer Res 2009;15:3423‐3432. [DOI] [PubMed] [Google Scholar]
- 24. Singh A, Boldin‐Adamsky S, Thimmulappa RK, Rath SK, Ashush H, Coulter J, et al. RNAi‐mediated silencing of nuclear factor erythroid‐2‐related factor 2 gene expression in non‐small cell lung cancer inhibits tumor growth and increases efficacy of chemotherapy. Cancer Res 2008;68:7975‐7984. [DOI] [PMC free article] [PubMed] [Google Scholar]
- 25. Ludtmann MH, Angelova PR, Zhang Y, Abramov AY, Dinkova‐Kostova AT. Nrf2 affects the efficiency of mitochondrial fatty acid oxidation. Biochem J 2014;457:415‐424. [DOI] [PMC free article] [PubMed] [Google Scholar]
- 26. Yuan P, Yang T, Mu J, Zhao J, Yang YI, Yan Z, et al. Circadian clock gene NPAS2 promotes reprogramming of glucose metabolism in hepatocellular carcinoma cells. Cancer Lett 2020;469:498‐509. [DOI] [PubMed] [Google Scholar]
- 27. Huang C, Li Y, Li Z, Xu Y, Li NA, Ge YI, et al. LIMS1 promotes pancreatic cancer cell survival under oxygen‐glucose deprivation conditions by enhancing HIF1A protein translation. Clin Cancer Res 2019;25:4091‐4103. [DOI] [PMC free article] [PubMed] [Google Scholar]
- 28. Yeung SJ, Pan J, Lee MH. Roles of p53, MYC and HIF‐1 in regulating glycolysis—the seventh hallmark of cancer. Cell Mol Life Sci 2008;65:3981‐3999. [DOI] [PMC free article] [PubMed] [Google Scholar]
- 29. Torizuka T, Tamaki N, Kasagi K, Misaki T, Kawamoto M, Tadamura E, et al. Myocardial oxidative metabolism in hyperthyroid patients assessed by PET with carbon‐11‐acetate. J Nucl Med 1995;36:1981‐1986. [PubMed] [Google Scholar]
- 30. Caracó C, Aloj L, Chen LY, Chou JY, Eckelman WC. Cellular release of [18F]2‐fluoro‐2‐deoxyglucose as a function of the glucose‐6‐phosphatase enzyme system. J Biol Chem 2000;275:18489‐18494. [DOI] [PubMed] [Google Scholar]
- 31. Izuishi K, Yamamoto Y, Mori H, Kameyama R, Fujihara S, Masaki T, et al. Molecular mechanisms of [18F]fluorodeoxyglucose accumulation in liver cancer. Oncol Rep 2014;31:701‐706. [DOI] [PubMed] [Google Scholar]
- 32. Paudyal B, Paudyal P, Oriuchi N, Tsushima Y, Nakajima T, Endo K. Clinical implication of glucose transport and metabolism evaluated by 18F‐FDG PET in hepatocellular carcinoma. Int J Oncol 2008;33:1047‐1054. [PubMed] [Google Scholar]
- 33. Gong W, Song Q, Lu X, Gong W, Zhao J, Min P, et al. Paclitaxel induced B7–H1 expression in cancer cells via the MAPK pathway. J Chemother 2011;23:295‐299. [DOI] [PubMed] [Google Scholar]
- 34. Jiang X, Zhou J, Giobbie‐Hurder A, Wargo J, Hodi FS. The activation of MAPK in melanoma cells resistant to BRAF inhibition promotes PD‐L1 expression that is reversible by MEK and PI3K inhibition. Clin Cancer Res 2013;19:598‐609. [DOI] [PubMed] [Google Scholar]
- 35. Marzec M, Zhang Q, Goradia A, Raghunath PN, Liu X, Paessler M, et al. Oncogenic kinase NPM/ALK induces through STAT3 expression of immunosuppressive protein CD274 (PD‐L1, B7–H1). Proc Natl Acad Sci U S A 2008;105:20852‐20857. [DOI] [PMC free article] [PubMed] [Google Scholar]
- 36. Yugawa K, Itoh S, Yoshizumi T, Iseda N, Tomiyama T, Morinaga A, et al. CMTM6 stabilizes PD‐L1 expression and is a new prognostic impact factor in hepatocellular carcinoma. Hepatol Commun 2021;5:334‐348. [DOI] [PMC free article] [PubMed] [Google Scholar]
- 37. Pollizzi KN, Powell JD. Integrating canonical and metabolic signalling programmes in the regulation of T cell responses. Nat Rev Immunol 2014;14:435‐446. [DOI] [PMC free article] [PubMed] [Google Scholar]
- 38. Noman MZ, Chouaib S. Targeting hypoxia at the forefront of anticancer immune responses. Oncoimmunology 2014;3:e954463. [DOI] [PMC free article] [PubMed] [Google Scholar]
- 39. Sacher AG, Gandhi L. Biomarkers for the clinical use of PD‐1/PD‐L1 inhibitors in non‐small‐cell lung cancer: a review. JAMA Oncol 2016;2:1217‐1222. [DOI] [PubMed] [Google Scholar]
Associated Data
This section collects any data citations, data availability statements, or supplementary materials included in this article.
Supplementary Materials
Fig S1‐S2