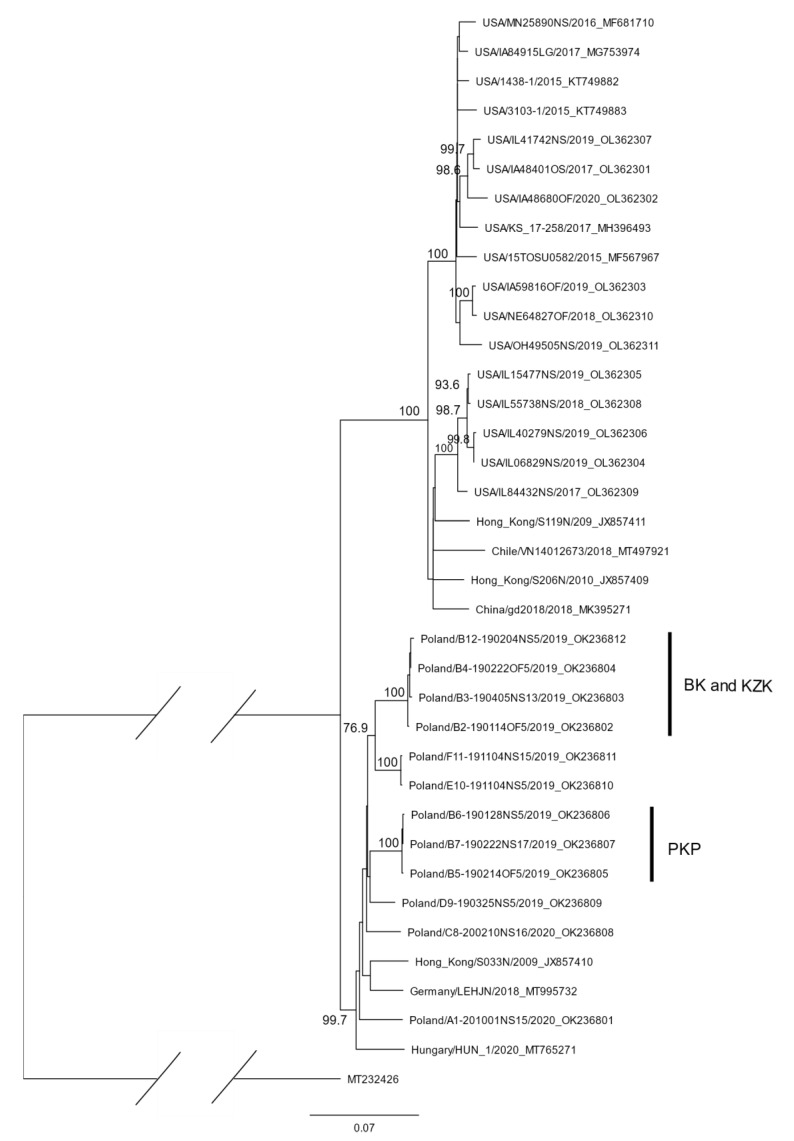
Figure 1.
Maximum-likelihood phylogenetic tree constructed from 36 nucleotide sequences of F gene of PPIV-1. The analysis was performed with the Geneious 10.2.6 computer program, using MUSCLE alignment and PhyML with Jukes–Cantor substitution model, and 1000 replicates. Only bootstrap values ≥75 are shown. HPIV-1 (GenBank acc.: MT232426) F-gene sequence was used as an outgroup. Vertical bars correspond to clusters of sequences obtained from herds belonging to three different pig flows (BK, KZK and PKP) within production company B.

