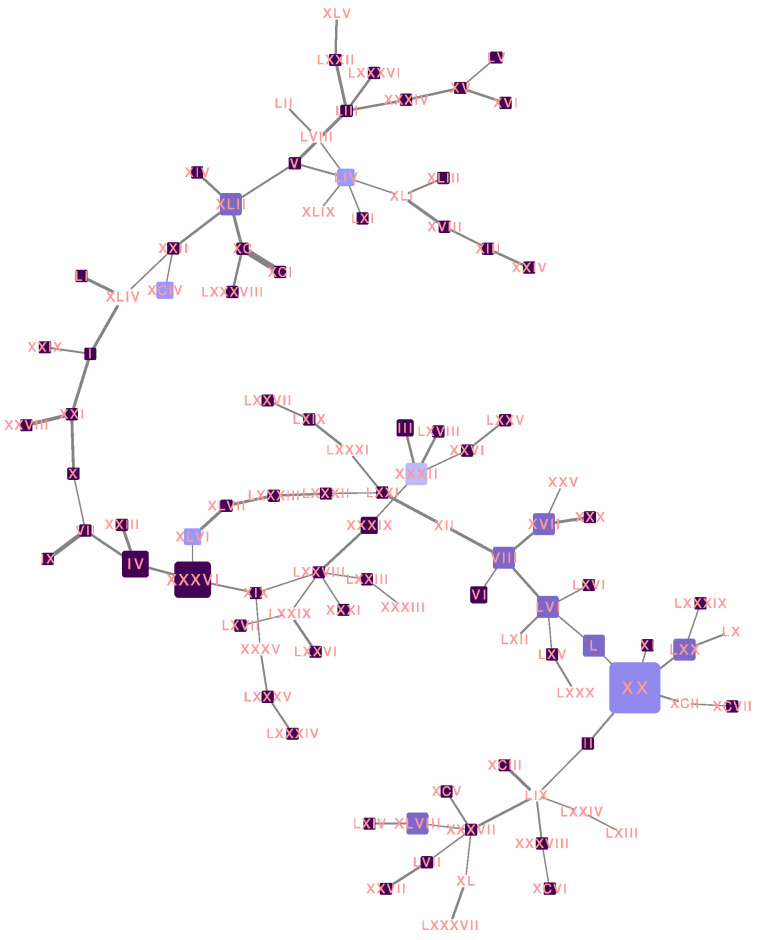
Figure 5.
Haplotype network for all Omicron SARS-CoV-2 sequences from Mexico City. The size of each node is proportional to the number of samples that belong to that haplotype. The color represents the fraction of patient samples that were fully vaccinated for each haplotype. The white nodes belong to haplotypes with 100% nonvaccinated patients, and dark purple nodes belong to haplotypes with 100% fully vaccinated patients. The width of the lines is proportional to the number of mutations between two haplotypes.

