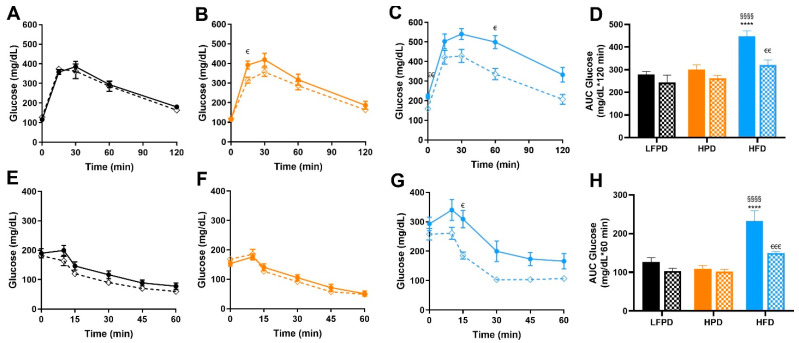
Figure 4.
Exercise improves whole-body glucose tolerance and insulin sensitivity in HFD mice. (A) Glucose tolerance test exclusion curve for LFPD mice, (B) Glucose tolerance test exclusion curve for HPD mice, (C) Glucose tolerance test exclusion curve for HFD mice, (D) Glucose tolerance area under the curve for all groups of mice (E) Insulin tolerance test exclusion curve for LFPD mice, (F) Insulin tolerance test exclusion curve for HPD mice, (G) Insulin tolerance test exclusion curve for HFD mice, and (H) Insulin tolerance area under the curve for all groups of mice after 6 weeks of exercise. N = 7–15 per group. One or two-way ANOVA were used with Tukey’s multiple comparison test (**** p < 0.0001 LFPD vs. HFD, §§§§ p < 0.0001 HPD vs. HFD, € p < 0.05, €€ p < 0.01, €€€ p < 0.001 Sedentary vs. Exercise). Data are expressed as the mean ± SEM.

