Figure 4.
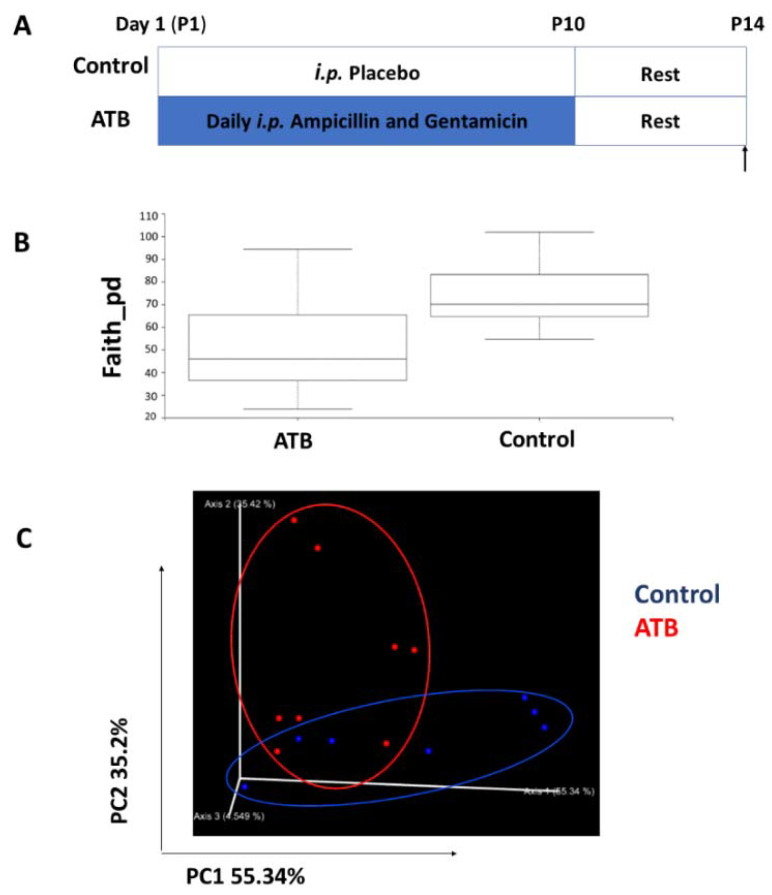
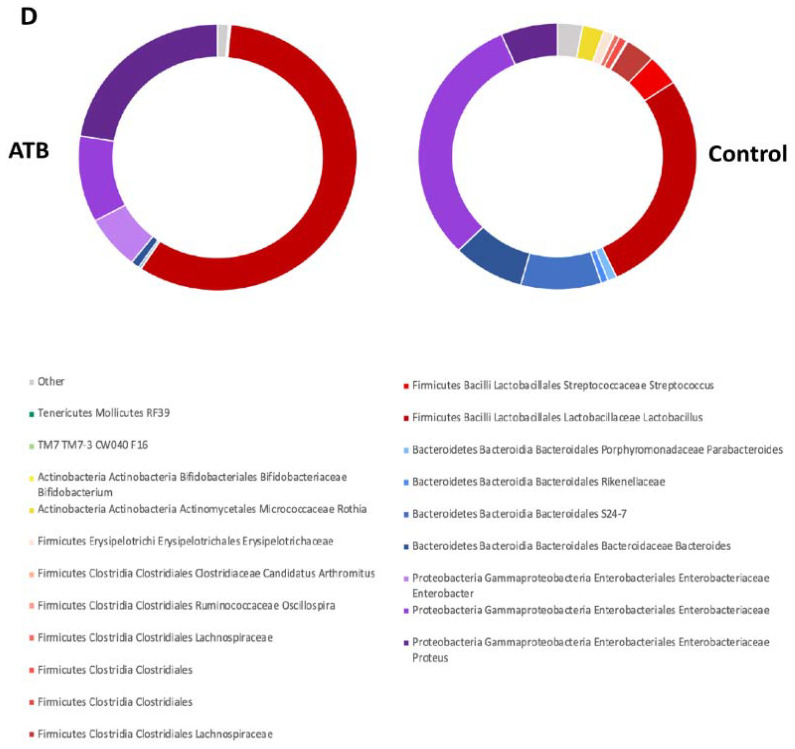
Analysis of cecal microbiota composition between groups. (A) Mouse pups were given ATB i.p. once daily for 10 days, and cecal contents were collected at P14, after a 4-day recovery. (B) Faith’s phylogenetic diversity metric displays species richness of mouse pups differentiated by treatment (Kruskal–Wallis p = 0.0491). (C) PCoA plot displaying Bray–Curtis beta diversity matrix (Control = blue; ATB = red). Percent confidence values for each distance matrix are displayed on the axes in two dimensions. PERMANOVA results: F = 3.10; p = 0.037. (D) Taxonomy plots were generated using a Naïve Bayes classifier trained on the most recent Greengenes 16S rRNA database. ASV reads were taxonomically classified and filtered for genera > 0.5% of total microbiome composition for any one sample. Genera falling below the 0.5% mark were placed in “other” (grey). ATB: antibiotics; PCoA: principal components analysis.


