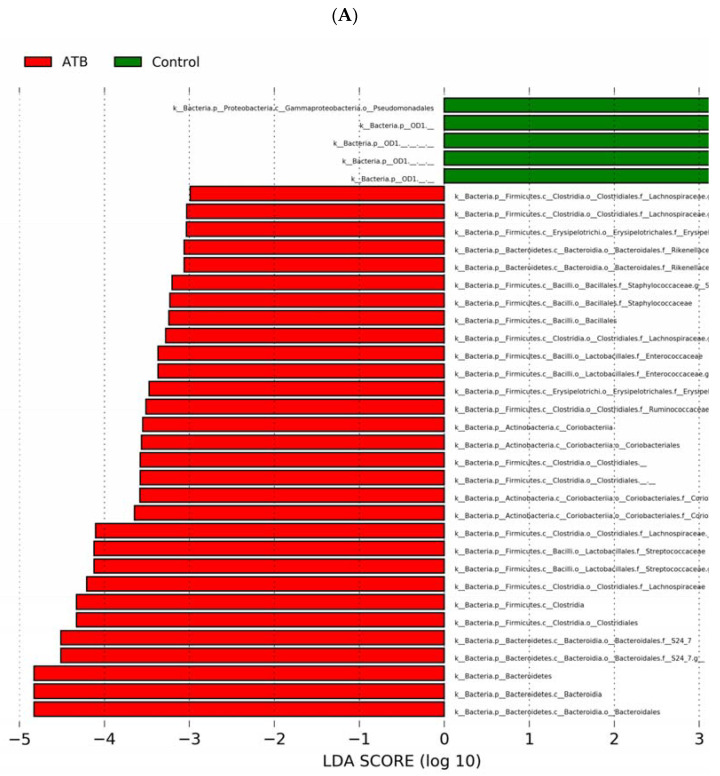
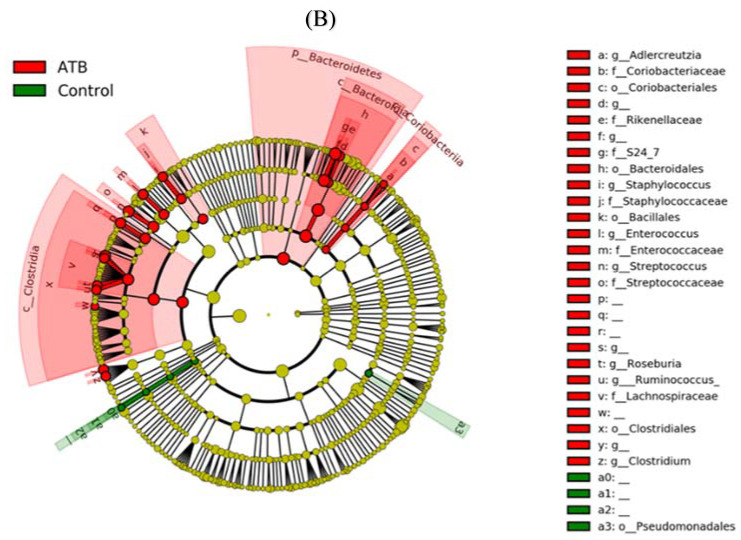
Figure 5.
LEfSe analysis of cecal microbiome from mouse pups in control and ATB groups. (A) LDA scores of significantly different bacteria between control (green) and ATB-treated (red) pups. (B) Cladogram utilizing LEfSe indicates the phylogenetic distribution of fecal microbes associated with the control (green) and ATB-treated (red) pups. ATB: antibiotics; LEfSe: linear discriminant analysis effect size; LDA: linear discriminant analysis.


