Figure 2.
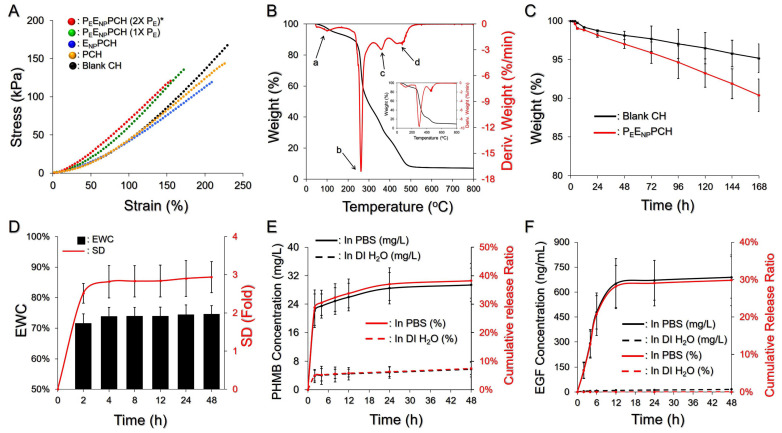
Assessment of the physicochemical properties of PEENPPCH. (A) Stress vs. strain curves of the four hydrogels indicated in the figure. The doses of EGF and PHMB in the three hetero-composite hydrogels were equally set to 60 μg/mL and 2000 ppm, respectively. * 2X PEs denotes that the dose of PE-trapped PFOB in the hydrogel was 50 mg/mL. (B) TGA and DTG curves of the PEENPPCH at temperatures ranging from 50–800 °C were obtained at a heating rate of 10 °C/min under a nitrogen atmosphere. The inset image represents the TGA and DTG curves of the blank CH. (C) Degradation profiles of the PEENPPCH (red) and the blank CH (black) in 37 °C PBS within 7 days. (D) The swelling profile (red) and the EWC (black) of the PEENPPCH in 37 °C PBS within 48 h. (E,F) In vitro kinetic drug release profiles of PHMB (E) and EGF (F) from the PEENPPCH incubated in PBS or DI water at 37 °C within 48 h. The cumulative released amount and ratio for each drug are presented in black and red curves, respectively, as indicated in the figure. Values in (C–F) are presented as mean ± s.d. (n = 3).

