Abstract
We present a novel fiber-based imaging platform that allows simultaneous fluorescence lifetime imaging (FLIm) and optical coherence tomography (OCT) using a double-clad fiber. This platform acquires co-registered images showing structural and compositional contrast in unlabeled biological samples by scanning the fiber tip across the sam ple surface. In this Letter, we report a characterization of each modality and show examples of co-registered FLIm and OCT images acquired from a lemon segment and a section of human coronary artery. The close comparison between the combined FLIm and OCT images and a co-registered histology section provides a qualitative validation of the technique and highlights its potential for minimally invasive, multimodal imaging of tissue structure and composition.
Keywords: (060.2350) Fiber optics imaging, (300.2530) Fluorescence, laser-induced, (110.4500) Optical coherence tomography
The complexity of the optical tissue response makes it challenging for a single imaging modality to accurately characterize tissue structure and function. Multimodal imaging platforms that combine two or more modalities in a single apparatus aim to leverage the strengths of complementary imaging techniques to sample a larger cross section of the optical tissue response [1–4].
Fluorescence lifetime imaging (FLIm) is a functional imaging technique that uses the temporal dynamics of fluorescence emission to delineate regions of biochemical contrast on the sample surface [5]. Optical coherence tomography (OCT) is an interferometric technique that acquires depth-resolved images of a sample microstructure [6]. A combined FLIm and OCT platform can be used to acquire an orthogonal dataset that reports both tissue structure and function. The benefits of combining FLIm and OCT in a single apparatus have been exploited by a few research groups, who realized multimodal imaging platforms that were based on a conventional microscope frame [7–9]. However, the use of free-space optics prevented these systems from being translated to applications where the imaging geometry is highly restricted such as the intravascular environment, airways, or inside a tissue bioreactor. Optical fibers are widely used in biophotonics as a narrow and flexible interface between a limited-access region of a sample and the imaging apparatus [10]. Previous efforts to combine fluorescence with OCT in single fiber imaging platforms relied on intensity-based fluorescence measurements [11–16]. In this Letter, we report what is, to the best of our knowledge, the first demonstration of a simultaneous FLIm and OCT imaging platform that uses a single fiber optic interface. FLIm is an inherently ratiometric technique that is robust against changes in fluorophore concentration and fluorescence excitation or collection efficiency that readily occur when imaging in non-ideal environments such as in vivo [17]. Such changes may result in imaging artifacts in intensity-based techniques. Furthermore, recording the fluorescence dynamics provides an alternative source of contrast that can be used to resolve fluorophores with overlapping spectra, a common feature of endogenous fluorescence. In addition, FLIm has been used to indirectly measure the metabolic state of cells seeded on tissue scaffolds [8]. Finally, time-resolved fluorescence imaging can allow background fluorescence from the apparatus to be temporally separated from sample autofluorescence, thus mitigating the effect that limited the detection sensitivity of other intensity-based fluorescence and OCT imaging systems [13,16]. In this Letter, we present a characterization of our fiber-based FLIm and OCT platform, and validate its ability to detect features exhibiting structural and compositional contrast in a human coronary artery section against a co-registered histology section.
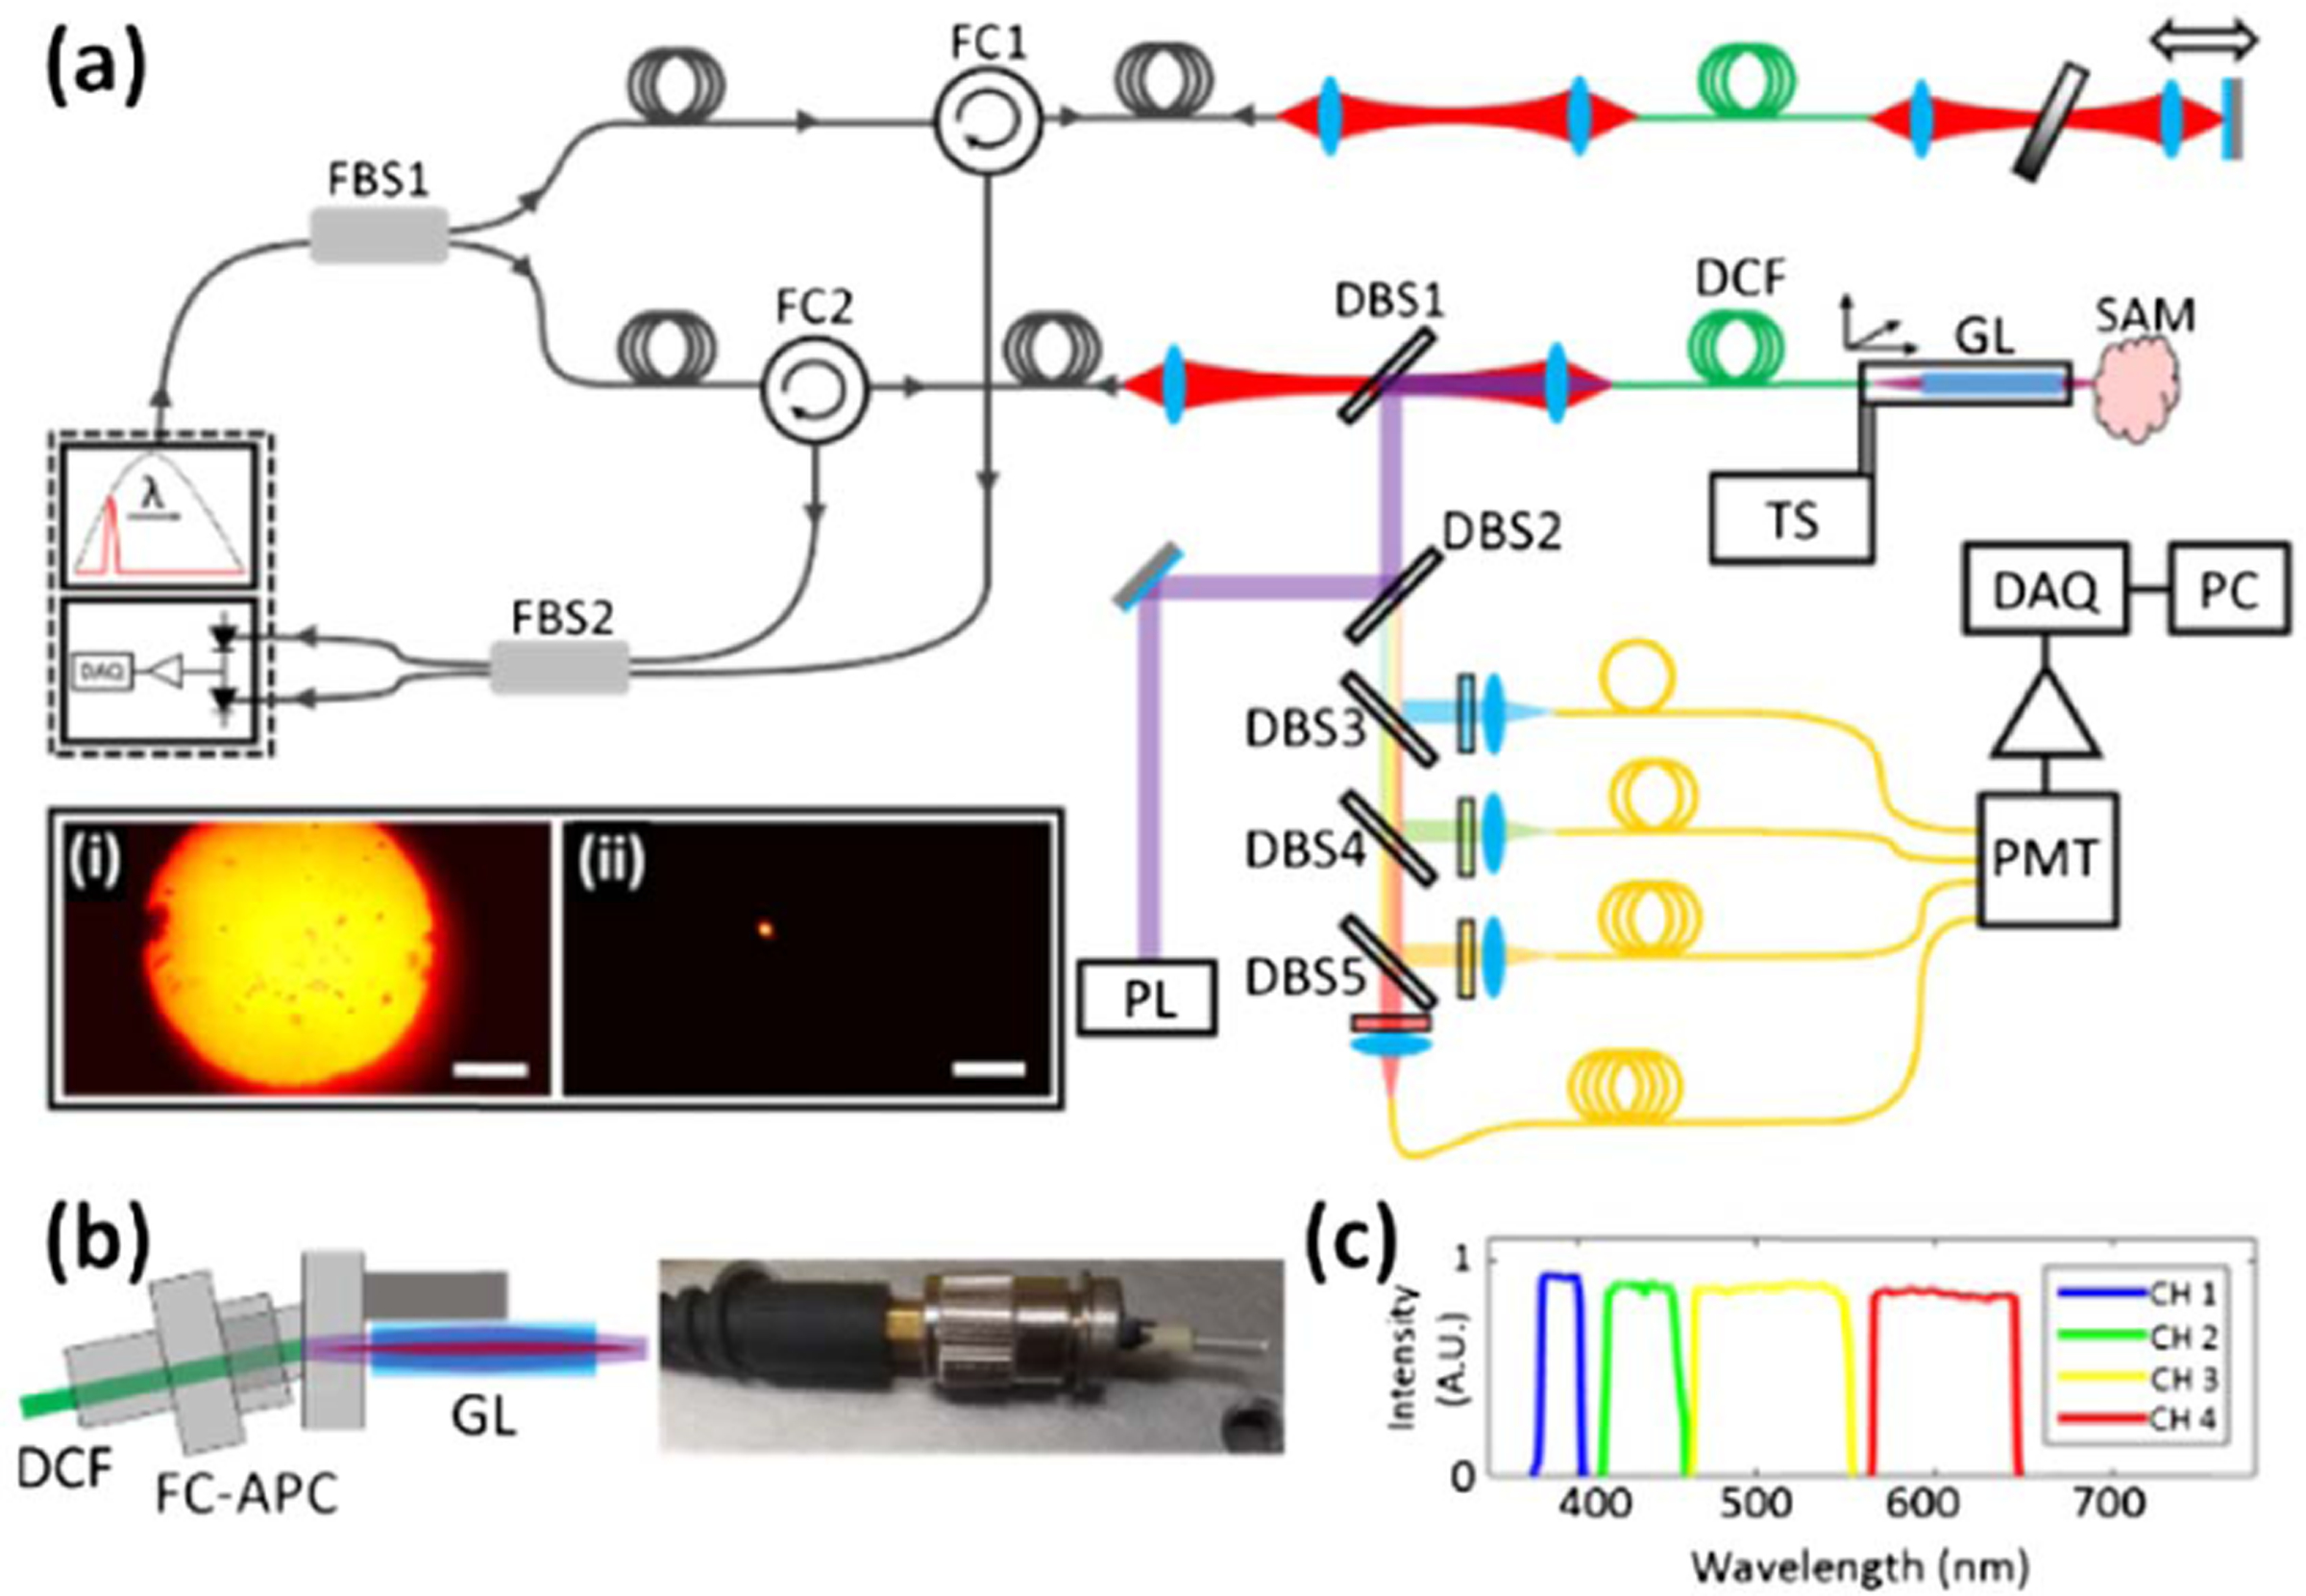
The combination of two modalities in a single optical fiber places stringent requirements on the fiber optic interface. OCT requires light to be guided in a single spatial mode, whereas FLIm benefits greatly from the increased fluorescence collection cross section given by multimode fibers. To accommodate these requirements, 2 m sections of a low-cost, commercially available double-clad fiber (DCF) were used. The fiber (Nufern, LMA-GDF-10/400) has a doped silica core and a pure silica inner cladding with diameters of 11.5 and 400 µm, respectively, the concentric nature of which give rise to the inherent co-registration of the FLIm and OCT datasets. The core and cladding numerical apertures (NAs) are 0.08 and 0.46, respectively. The large diameter and high NA of the DCF inner cladding increases the collection efficiency of the fiber, and the number of modes in the inner cladding that have a vanishing overlap with the core [18], thus reducing the background fluorescence of the fiber caused by 355 nm of light exciting visible transitions in the core dopants. The measured coupling efficiencies for the DCF over the relevant wavelengths for this Letter are reported in Table 1. The coupling efficiency for the 380–650 nm wavelength range was measured using an xenon flash lamp.
Table 1.
Nufern LMA-GDF-10/400 DCF Measured Coupling Efficiencies
| Fiber Region | Wavelength (nm) | Coupling Efficiency (%) |
|---|---|---|
| Core | 1310 ± 55 | 63.1 |
| Cladding | 355 | 76.1 |
| Cladding | 380–650 | 74.3 |
A simple fiber probe was realized by mounting a 1.8 mm diameter, 11 mm long, 0.25 pitch, lithium ion exchange gradient index (GRIN) lens (NA = 0.2) onto a fiber port, into which the DCF distal end was inserted [see Fig. 1(b)]. The transmission of the GRIN lens was measured at 78% at 355 nm and 97% at 1310 ± 55 nm, which resulted in average powers in the sample plane of 2.27 and 22.5 mW for the 355 and 1310 ± 55 nm light, respectively. The layout of the FLIm and OCT platform is shown in Fig. 1(a). A comprehensive description of the FLIm system has been reported previously [19]. Briefly, light from a 355 nm laser (4 kHz repetition rate, 7.89 mW average power output) is guided to the sample in the DCF inner cladding. The same region of the fiber is used to guide backscattered sample autofluorescence to a wavelength selection module that separates the light into four spectral bands [see Fig. 1(c)]. Fiber optic delay lines temporally multiplex the four spectral bands onto a single photomultiplier tube (PMT). Fluorescence decays are acquired using the pulse sampling technique [20], and lifetimes are extracted from the raw decays using a constrained least-squares deconvolution with Laguerre expansion [21]. The limited penetration depth of ultraviolet light in biological tissue (<250 µm) means that all FLIm datasets in this Letter were acquired at the sample surface.
Fig. 1.

(a) Schematic diagram of the simultaneous FLIm and OCT platform. DBS1-DBS5, dichroic beam splitters; DCF, double-clad fiber; DAQ, data acquisition card; FBS1-FBS2, fiber beam splitters; FC1-FC2, fiber circulators; GL, GRIN lens; PL, 355 nm pulsed laser; PMT, photomultiplier tube; TS, translation stage. Inset: image of the DCF distal tip with light propagating in (i) the inner cladding and (ii) the core. Scale bar 100 µm. (b) Schematic (left) and photograph (right) of the DCF probe tip, showing how the connectorized distal end of the DCF interfaces with the GRIN lens. (c) Spectral distribution of the wavelength selection module fluorescence collection bands.
The OCT system uses a 1310 ± 55 nm swept laser OCT engine from Axsun Technologies, with a native A-line rate of 50 kHz and an average output power of 50 mW. The OCT light source is fiber-coupled into a 90:10 fiber coupler that sends 10% of the output to the interferometer reference arm formed by a 2 m section of the DCF and a metallic mirror mounted on a translation stage used to approximately match the relative optical path length. The remaining 90% of the OCT light is coupled into the core of the 2 m section of the DCF used for FLIm. The core of this fiber realizes part of the OCT interferometer sample arm. The reflections in both the sample and reference arms are coupled back through the DCF core and are separated from the incoming light by three-port fiber circulators. Light from each arm is mixed using a 50:50 fiber coupler and detected using the OCT engine’s onboard dual-balanced photodiodes. The Axsun OCT engine includes a 12 bit, 500 MS/s FPGA DAQ board that processes data from the dual-balanced photodiodes and generates depth- resolved B-scans that are streamed to the experimental control computer.
Parallel FLIm and OCT images were acquired by scanning the fiber probe at a fixed height above the sample in an X-Y raster pattern, using a motorized three-axis translation stage. To improve the signal-to-noise ratio (SNR) of the FLIm images, lifetimes were extracted from waveforms that were the average of 16 fluorescent decays. On-the-fly pre-processing of the FLIm data further reduced the effective acquisition rate of the FLIm pixels to 78 Hz. To ensure a smooth FLIm image, the FLIm system sampled the surface at 40 µm intervals (well above the limit dictated by the Nyquist Shannon sampling theorem). In order to avoid overfilling the OCT DAQ buffer, the A-line rate of the OCT system was downsampled to 500 Hz. This resulted in image acquisition times of 52 and 29 min for the large field-of-view images shown in Figs. 3 and 4, respectively.
Fig. 3.

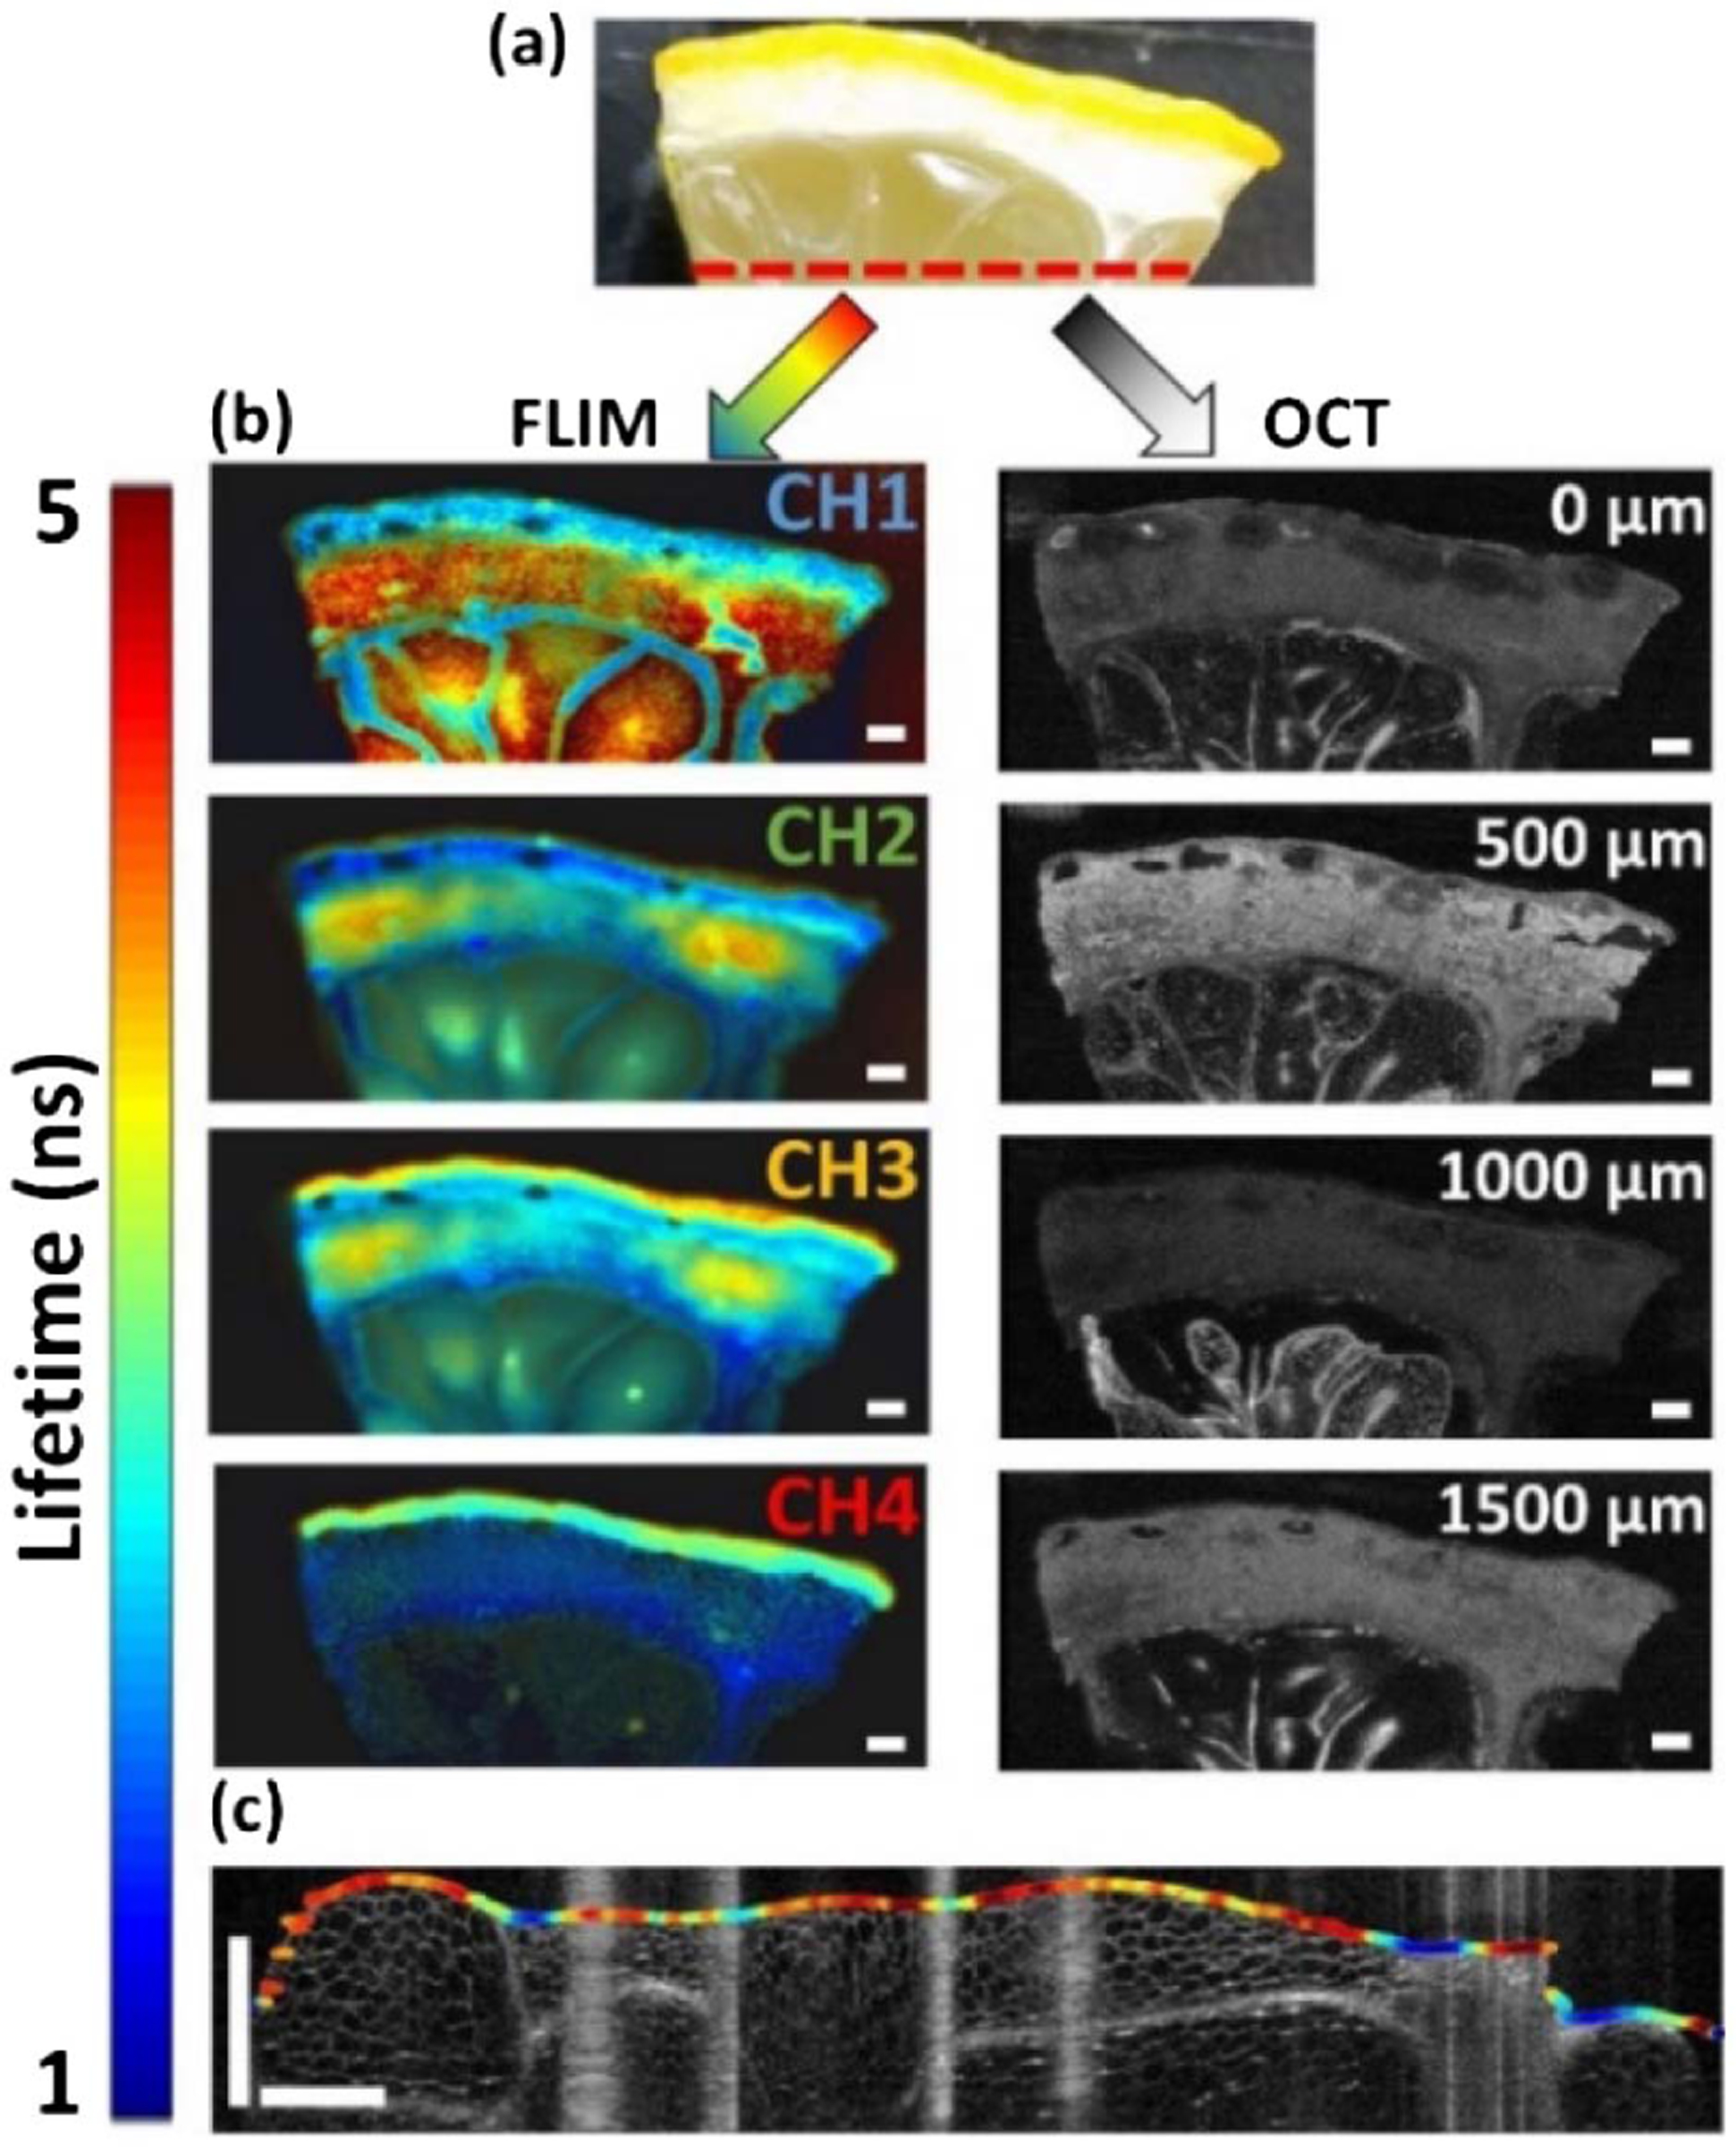
(a) White light image of a lemon segment. The red dashed line indicates the location on the sample where the data shown in (c) were acquired. (b) FLIm and OCT images of the lemon segment. The FLIm images show the fluorescence lifetime resolved in four spectral bands, while the OCT images show the lemon microstructure at different depths (see Visualization 1 for all XY OCT frames). The scale bar is 1 mm. (c) Single line scan acquired from the lemon showing CH1 fluorescence lifetime data overlaid on the surface segmented from the corresponding OCT B-scan (see Visualization 2 for all YZ OCT frames).
Fig. 4.

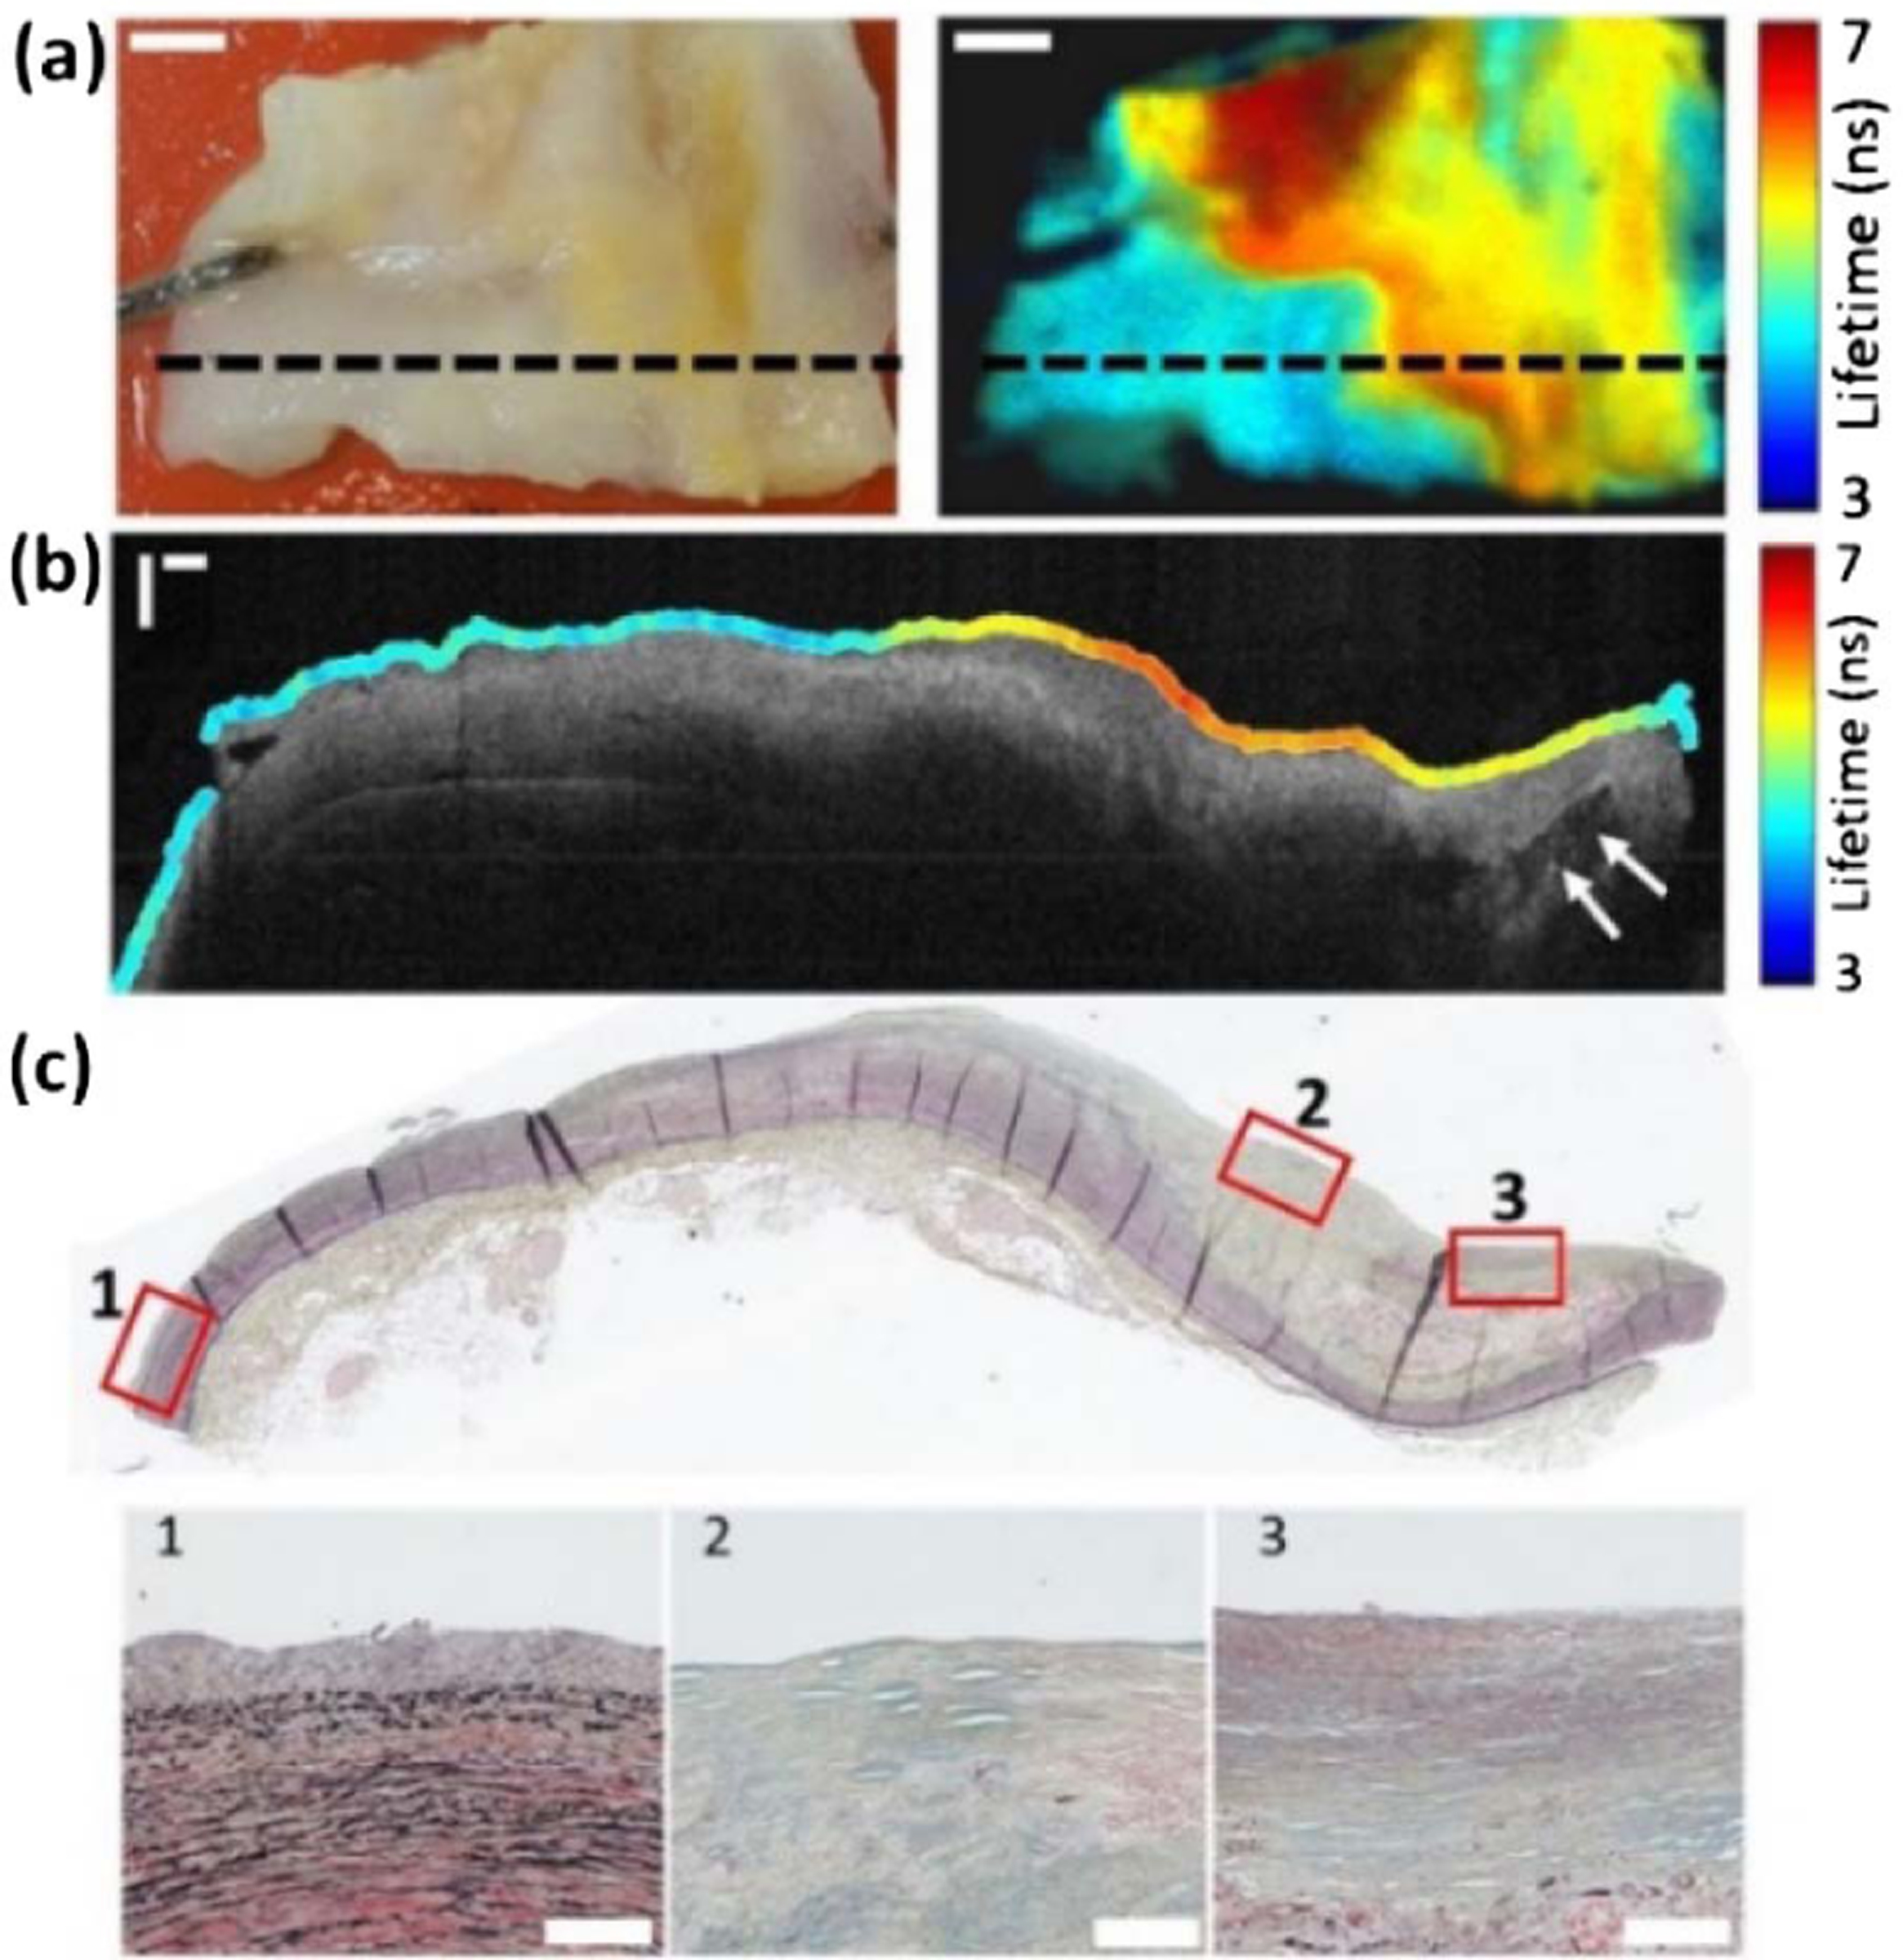
(a) White light image (left) and CH1 intensity weighted fluorescence lifetime image (right) of a coronary artery section. The FLIm image was acquired with a total of 400 × 215 pixels. The black dashed line indicates the location of data shown in (b) and (c). Scale bars 2 mm. (b) OCT B-scan with co-registered CH1 FLIm data overlaid on the sample surface. The arrows label a calcium deposit. Scale bar 500 µm. (c) Co-registered Movat’s pentachrome-stained histology section. The numbered insets contrast a non-atherosclerotic region of (1) adaptive intimal thickening with (2) acellular and (3) cellular fibrous tissue from an atherosclerotic fibrocalcific plaque. Scale bar 100 µm.
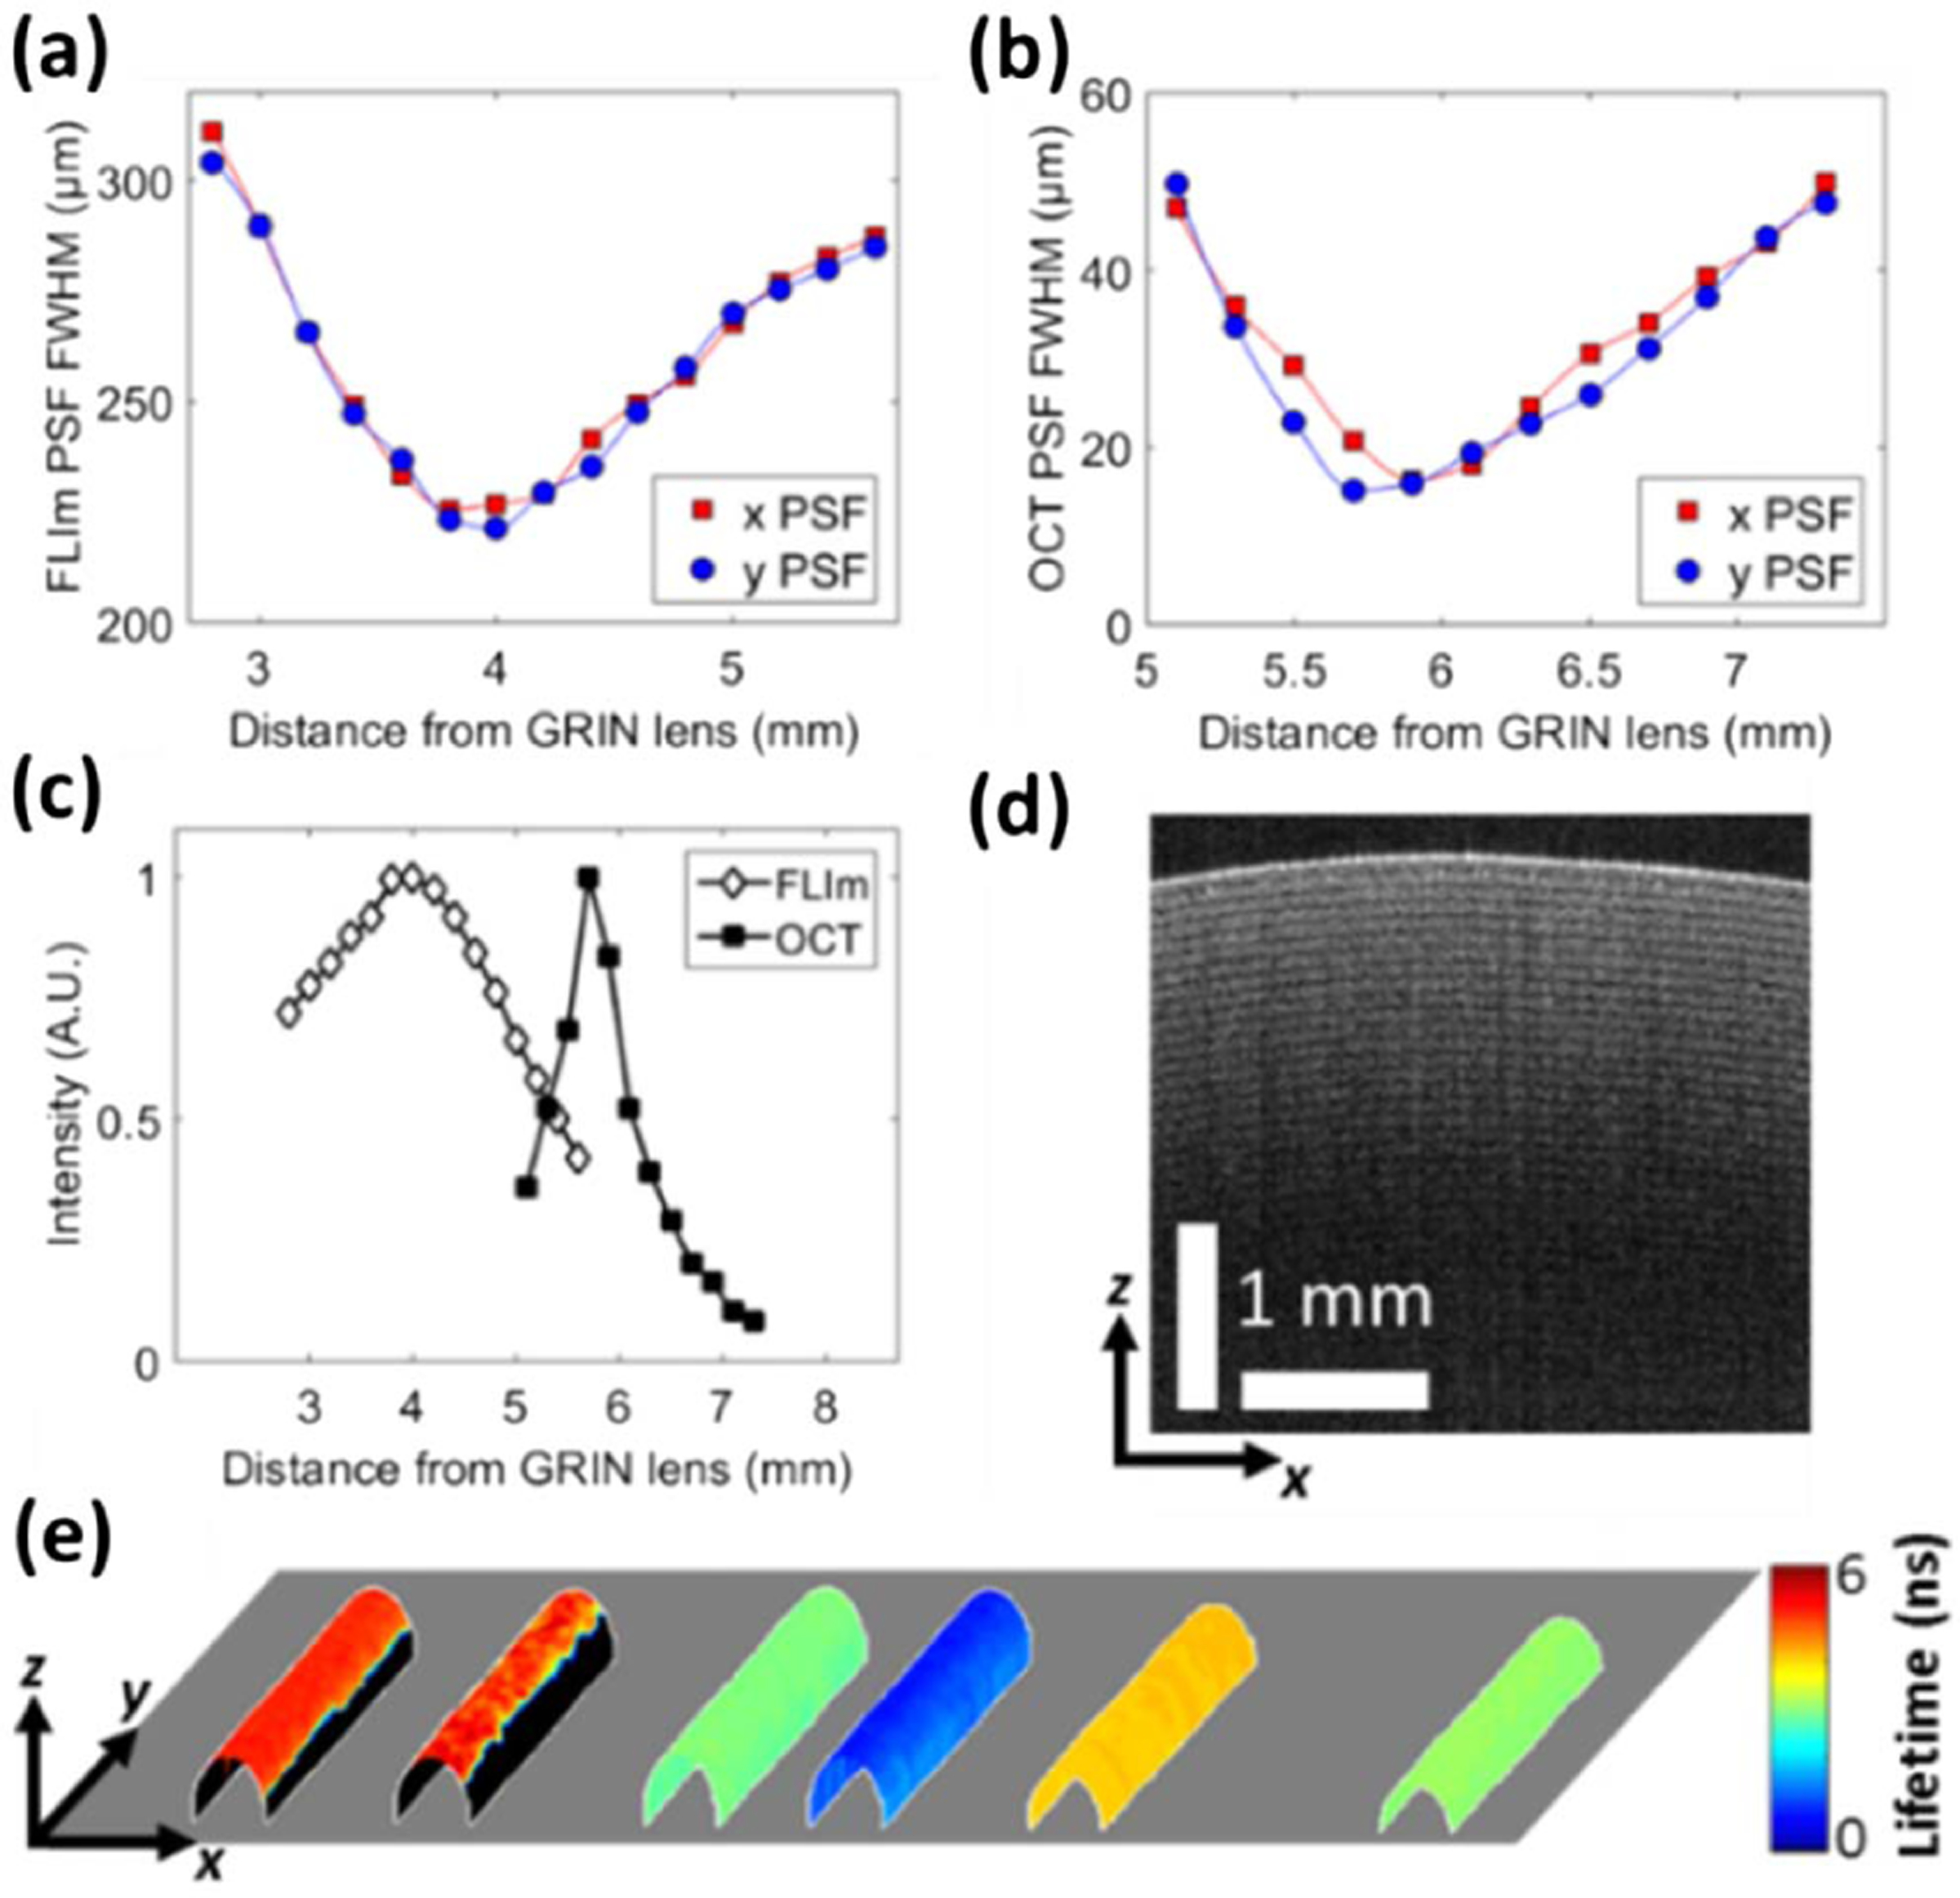
The working distance, axial collection efficiency, and lateral point spread functions (PSF) of both imaging systems were estimated from measurements taken in air, using a phantom fabricated from a 13 µm diameter tungsten wire coated with a thin layer of fluorescent dye [see Figs. 2(a)–2(c)]. In the focal plane, the OCT (FLIm) PSF full width at half-maximum (FWHM) in the orthogonal x and y directions was measured to be 16.0 (226.9) and 16.3 µm (221.3 µm), respectively.
Fig. 2.

(a) FLIm lateral PSF FWHM, (b) OCT lateral PSF FWHM, and (c) FLIm and OCT on-axis collection efficiency, all plotted as a function of distance from the GRIN lens. (d) OCT B-scan of a roll of Scotch tape. (e) Multispectral fluorescence lifetime image of six glass capillaries containing (left–right) elastin, bovine Achilles tendon type I collagen, FAD, unbound NADH, coumarin 120, and rhodamine B. The lifetime values are overlaid onto the surface of the capillaries that was segmented from the co-registered OCT dataset.
The lateral extent of the FLIm system PSF could be decreased to approximately that of the OCT system by the introduction of a DCF that was compatible with coupling 355 nm of light in its core. Longitudinal chromatic aberration in the GRIN lens resulted in a 1.7 mm offset between the axial locations of the FLIm and OCT focal planes. These aberrations can be cancelled using a diffractive optical element [22]. However, in this Letter, the impact of this offset is mitigated by the broad axial collection efficiency of the FLIm system, which results in approximately 50% reduction in the intensity of fluorescence emission when the OCT focal plane is located 500 µm below the sample surface [Fig. 2(c)].
The OCT axial PSF FWHM was measured from images of a microscope slide (data not shown) to be 10.2 µm, which presents good agreement with the theoretical value derived from the coherence length of the light source [23]. Using a Scotch tape phantom [Fig. 2(d)], it was observed that the OCT system was able to image features approximately 1.8 mm below the sample surface. Images of a protected silver mirror were used to calculate the sensitivity of the OCT system to be 92 dB (data not shown). A phantom consisting of six glass capillaries filled with fluorescent dyes or biologically relevant fluorophores was used to measure the accuracy of the lifetime measurements made by the FLIm system [Fig. 2(e)]. Low SNR pixels were thresholded out of the FLIm image. The mean fluorescence lifetimes for coumarin 120 in ethanol (EtOH) (3.67 ns in CH3), rhodamine B in EtOH (2.91 ns in CH4), and flavin adenine dinucleotide (FAD) (2.94 ns in CH3) agree with accepted literature values [24–26]. The free nicotinamide adenine dinucleotide (NADH) average lifetime (0.77 ns in CH2) is longer than the literature value of 0.44 ns. The difference is attributed to the lifetime estimation by the Laguerre expansion technique which has been shown under certain circumstances to fail to accurately recover lifetimes <0.5 ns [21]. Mean lifetimes of bovine achilles type I collagen (4.91 ns in CH1) and elastin (4.44 ns in CH2) were recorded; however, a comparison with literature values is challenging given the broad range of published lifetimes for these proteins.
The FLIm and OCT platform was first tested by imaging an 18 × 8 mm lemon segment (see Fig. 3). The fluorescence lifetime images show the same field of view, resolved into the four distinct spectral bands. Stark regions of contrast are observed in these images, such as in CH1 where the walls of the juice sacks and their contents show significantly different lifetimes. The OCT images depict the microstructure of the lemon segment at four different depths below the sample surface. The significantly higher spatial resolution of OCT allows this modality to resolve individual plant cells [Fig. 3(c)].
A further test of the FLIm and OCT platform was provided by an 16 × 9 mm section of human coronary artery. This sample was selected as it is a tissue type that has been imaged by several groups whose aim was to use either fiber-coupled FLIm [27] or OCT [28] to detect the presence of atherosclerotic lesions. The artery section was cut along the direction of blood flow and stapled to a silicone rubber sheet. Post-imaging the coronary artery section was fixed in formalin prior to histological processing. The results in Fig. 4 indicate that the combined FLIm and OCT images report features that manifest in both artery composition and structure. The origin of these features is confirmed using co-registered histology sections. Specifically, the changes in CH1 mean the lifetimes shown in Fig. 4(b) show a strong overlap with the changes to surface composition visualized in the histology section [Fig. 4(c)]. The region of adaptive intimal thickening on the left-hand side has a uniform, shorter lifetime that is characteristic of collagen and elastin fluorescence. The increase in lifetime towards the center of the figure corresponds with a region of acellular fibrosis, where collagen dominates the surface composition. On the right-hand side of Fig. 4(b), the cellularity of the fibrotic tissue increases, and the lifetime decreases, an effect which has been observed previously [29]. Furthermore, the OCT image depicts changes in intimal thickness and the morphology of sub-surface calcification.
In conclusion, the characterization and validation of our novel, multimodal imaging platform that combines FLIm and OCT in a DCF have been presented. A range of fiber-based multimodal imaging platforms have been realized previously [30,31]. Our platform simultaneously acquires co-registered images of tissue structure and composition from unlabeled samples, using a single narrow and flexible fiber optic interface. The image acquisition time of the current apparatus is limited by the 4 kHz repetition rate of the FLIm light source. Our group has previously shown that acquisition times can be significantly reduced by selecting a light source with a higher repetition rate [32]. At the current imaging speed, the platform reported here has applications in non-destructive in vitro imaging of engineered tissues, which have typical maturation times of several weeks, meaning that longer image acquisition times can be tolerated. In the future, we aim to combine faster image acquisition with a circumferential beam-scanning technique such that the capabilities of this multimodal imaging platform may be exploited for minimally invasive intravascular or airway imaging.
Acknowledgment.
The authors would like to acknowledge the assistance of Deborah Vela who performed the histological analysis.
Funding. California Institute for Regenerative Medicine (CIRM) (RT3–07879); National Institutes of Health (NIH) (1R01HL121068–01A1).
REFERENCES
- 1.Masters BR and So P, Opt. Express 8, 2 (2001).19417779 [Google Scholar]
- 2.Yoo H, Kim JW, Shishkov M, Namati E, Morse T, Shubochkin R, Mccarthy JR, Ntziachristos V, Bouma BE, Jaffer FA, and Tearney GJ, Nat. Med. 17, 1680 (2011). [DOI] [PMC free article] [PubMed] [Google Scholar]
- 3.Wong CSY, Robinson I, Ochsenk MA, Arlt J, Hossack WJ, and Crain J, Biomed. Opt. Express 2, 2504 (2011). [DOI] [PMC free article] [PubMed] [Google Scholar]
- 4.Shrestha S, Serafino MJ, Rico-Jimenez J, Park J, Chen X, Zhaorigetu S, Walton BL, Jo JA, and Applegate BE, Biomed. Opt. Express 7, 3184 (2016). [DOI] [PMC free article] [PubMed] [Google Scholar]
- 5.Becker W, J. Microsc 247, 119 (2012). [DOI] [PubMed] [Google Scholar]
- 6.Huang D, Swanson E, Lin C, Schuman J, Stinson W, Chang W, Hee M, Flotte T, Gregory K, Puliafito C, and Fujimoto JG, Science 254, 1178 (1991). [DOI] [PMC free article] [PubMed] [Google Scholar]
- 7.Park J, Jo JA, Shrestha S, Pande P, Wan Q, and Applegate BE, Biomed. Opt. Express 1, 186 (2010). [DOI] [PMC free article] [PubMed] [Google Scholar]
- 8.Zhao Y, Graf BW, Chaney EJ, Mahmassani Z, Antoniadou E, Devolder R, Kong H, Boppart MD, and Boppart SA, J. Biophotonics 5, 437 (2012). [DOI] [PMC free article] [PubMed] [Google Scholar]
- 9.Koenig K, IntraVital 1, 11 (2012). [Google Scholar]
- 10.Flusberg BA, Cocker ED, Piyawattanametha W, Jung JC, Cheung ELM, and Schnitzer MJ, Nat. Methods 2, 941 (2005). [DOI] [PMC free article] [PubMed] [Google Scholar]
- 11.Ryu SY, Choi HY, Na J, Choi ES, and Lee BH, Opt. Lett. 33, 2347 (2008). [DOI] [PubMed] [Google Scholar]
- 12.Mavadia J, Xi J, Chen Y, and Li X, Biomed. Opt. Express 3, 2851 (2012). [DOI] [PMC free article] [PubMed] [Google Scholar]
- 13.Pahlevaninezhad H, Lee AMD, Shaipanich T, Raizada R, Cahill L, Hohert G, Yang VXD, Lam S, MacAulay C, and Lane P, Biomed. Opt. Express 5, 2978 (2014). [DOI] [PMC free article] [PubMed] [Google Scholar]
- 14.Ughi GJ, Verjans J, Fard AM, Wang H, Osborn E, Hara T, Mauskapf A, Jaffer FA, and Tearney GJ, Int. J. Cardiovasc. Imaging 31, 259 (2015). [DOI] [PMC free article] [PubMed] [Google Scholar]
- 15.Pahlevaninezhad H, Lee AMD, Hohert G, Lam S, Shaipanich T, Beaudoin E-L, MacAulay C, Boudoux C, and Lane P, Opt. Lett. 41, 3209 (2016). [DOI] [PubMed] [Google Scholar]
- 16.Scolaro L, Lorenser D, Madore W, Kirk RW, Kramer AS, Yeoh GC, Godbout N, Sampson DD, Boudoux C, and Mclaughlin RA, Biomed. Opt. Express 6, 1767 (2015). [DOI] [PMC free article] [PubMed] [Google Scholar]
- 17.McGinty J, Taylor HB, Chen L, Bugeon L, Lamb JR, Dallman MJ, and French PM, Biomed. Opt. Express 2, 1340 (2011). [DOI] [PMC free article] [PubMed] [Google Scholar]
- 18.Koester CJ and Snitzer E, Appl. Opt. 3, 1182 (1964). [Google Scholar]
- 19.Sherlock BE, Zhou X, Bec J, and Marcu L, IEEE Photonics Conference (IEEE, 2016), pp. 1–2. [Google Scholar]
- 20.Fang Q, Papaioannou T, Jo JA, Vaitha R, Shastry K, and Marcu L, Rev. Sci. Instrum. 75, 151 (2004). [DOI] [PMC free article] [PubMed] [Google Scholar]
- 21.Liu J, Sun Y, Qi J, and Marcu L, Phys. Med. Biol. 57, 843 (2012). [DOI] [PMC free article] [PubMed] [Google Scholar]
- 22.Lukic A, Dochow S, Bae H, Matz G, Latka I, Messerschmidt B, Schmitt M, and Popp J, Optica 4, 496 (2017). [Google Scholar]
- 23.Izatt JA and Choma MA, Optical Coherence Tomography—Technology and Applications (Springer, 2008), pp. 47–72. [Google Scholar]
- 24.Magde D, Rojas GE, and Seybold PG, Photochem. Photobiol. 70, 737 (1999). [Google Scholar]
- 25.Islam MS, Honma M, Nakabayashi T, Kinjo M, and Ohta N, Int. J. Mol. Sci. 14, 1952 (2013). [DOI] [PMC free article] [PubMed] [Google Scholar]
- 26.Pal H, Nad S, and Kumbhakar M, J. Chem. Phys. 119, 443 (2003). [Google Scholar]
- 27.Fatakdawala H, Gorpas D, Bishop JW, Bec J, Ma D, Southard JA, Margulies KB, and Marcu L, J. Cardiovasc. Transl. Res. 8, 253 (2015). [DOI] [PMC free article] [PubMed] [Google Scholar]
- 28.Yabushita H, Bouma BE, Houser SL, Aretz HT, Jang IK, Schlendorf KH, Kauffman CR, Shishkov M, Kang DH, Halpern EF, and Tearney GJ, Circulation 106, 1640 (2002). [DOI] [PubMed] [Google Scholar]
- 29.Marcu L, Jo JA, Fang Q, Papaioannou T, Reil T, Qiao J, Baker JD, Freischlag JA, and Fishbein MC, Atherosclerosis 204, 156 (2009). [DOI] [PMC free article] [PubMed] [Google Scholar]
- 30.Hoffman A, Manner H, Rey JW, and Kiesslich R, Nat. Rev. Gastroenterol. Hepatol. 14, 421 (2017). [DOI] [PubMed] [Google Scholar]
- 31.Bourantas CV, Jaffer FA, Gijsen FJ, Van Soest G, Madden SP, Courtney BK, Fard AM, Tenekecioglu E, Zeng Y, Van Der Steen FW, Emelianov S, Muller J, Stone PH, Marcu L, Tearney GJ, and Serruys PW, Eur. Heart J. 38, 400 (2017). [DOI] [PMC free article] [PubMed] [Google Scholar]
- 32.Ma D, Bec J, Yankelevich DR, Gorpas D, Fatakdawala H, and Marcu L, J. Biomed. Opt. 19, 66004 (2014). [DOI] [PMC free article] [PubMed] [Google Scholar]


