Abstract
Non-invasive near-infrared spectral tomography (NIRST) can incorporate the structural information provided by simultaneous magnetic resonance imaging (MRI), and this has significantly improved the images obtained of tissue function. However, the process of MRI guidance in NIRST has been time consuming because of the needs for tissue-type segmentation and forward diffuse modeling of light propagation. To overcome these problems, a reconstruction algorithm for MRI-guided NIRST based on deep learning is proposed and validated by simulation and real patient imaging data for breast cancer characterization. In this approach, diffused optical signals and MRI images were both used as the input to the neural network, and simultaneously recovered the concentrations of oxy-hemoglobin, deoxy-hemoglobin, and water via end-to-end training by using 20,000 sets of computer-generated simulation phantoms. The simulation phantom studies showed that the quality of the reconstructed images was improved, compared to that obtained by other existing reconstruction methods. Reconstructed patient images show that the well-trained neural network with only simulation data sets can be directly used for differentiating malignant from benign breast tumors.
Near-infrared spectral tomography (NIRST) has been investigated as a non-invasive imaging tool to characterize soft tissue optical properties in the spectral range of 600–1000 nm for early detection of cancer [1,2]. NIRST image reconstruction is ill-posed due to strong photon diffuse scattering in biological tissue [3,4] and remains a significant challenge for the technique and its clinical adoption.
To date, studies have examined how to mitigate the ill-posedness of NIRST image reconstruction by employing regularization techniques. Optimal approaches utilize data fitting terms together with regularizers (L2, L1, total variation norm, etc.) to instablilize from measurement noise and modeling errors [5]. Within the cadre of approaches, Tikhonov regularization is a common and very effective method [6] that utilizes the L2 norm as the regularizer. However, it tends to over-smooth reconstructed images and reduces the contrast between tumor and surrounding tissue. To enhance the quality of reconstructed images, other imaging modalities can be used to provide structural information to guide the reconstruction [7].
Two major classes of constraint-based image guidance in NIRST reconstruction involve algorithms that introduce hard [7,8] or soft priors [9] or direct regularization imaging (DRI) [10,11]. Soft/hard priors can enhance accuracy significantly within localized regions by reducing the ill-posedness of NIRST image reconstruction, but they usually require manual segmentation to identify regions of interest. Indeed, manual segmentation can introduce errors into the reconstruction process, and the accuracy of estimated chromophores is then dependent on the accuracy of image segmentation. Additionally, the segmentation step can be time consuming and requires sufficient experience to avoid bias or error. In contrast, DRI does not need to segment anatomical images; however, it still needs to model light propagation in tissue, and model errors due to mesh discretization, imperfect boundary conditions, and approximate governing equations are inevitable in NIRST image reconstruction.
Deep learning (DL) has been investigated and shown to improve certain image reconstruction problems [12–19]. In particular, Lan et al. developed an image reconstruction algorithm for photoacoustic (PA) tomography to recover initial pressure distributions based on the Y-net architecture [14] in which network inputs were measured PA signals and poor quality images recovered by conventional reconstruction algorithms. Accordingly, the approach models PA propagation and requires mesh discretization. A multilayer perceptron based inverse problem method has been developed to improve the accuracy of source location in bioluminescence tomography [15]. More recently, several groups [16–19] have reported DL based approaches to estimate optical properties in diffuse optical tomography (DOT) [16–18] and validated these algorithms with phantoms [19]. The studies have focused on using DL with a single optical input, whereas the method decribed here incorporates network inputs from multiple imaging modalities to achieve image reconstruction.
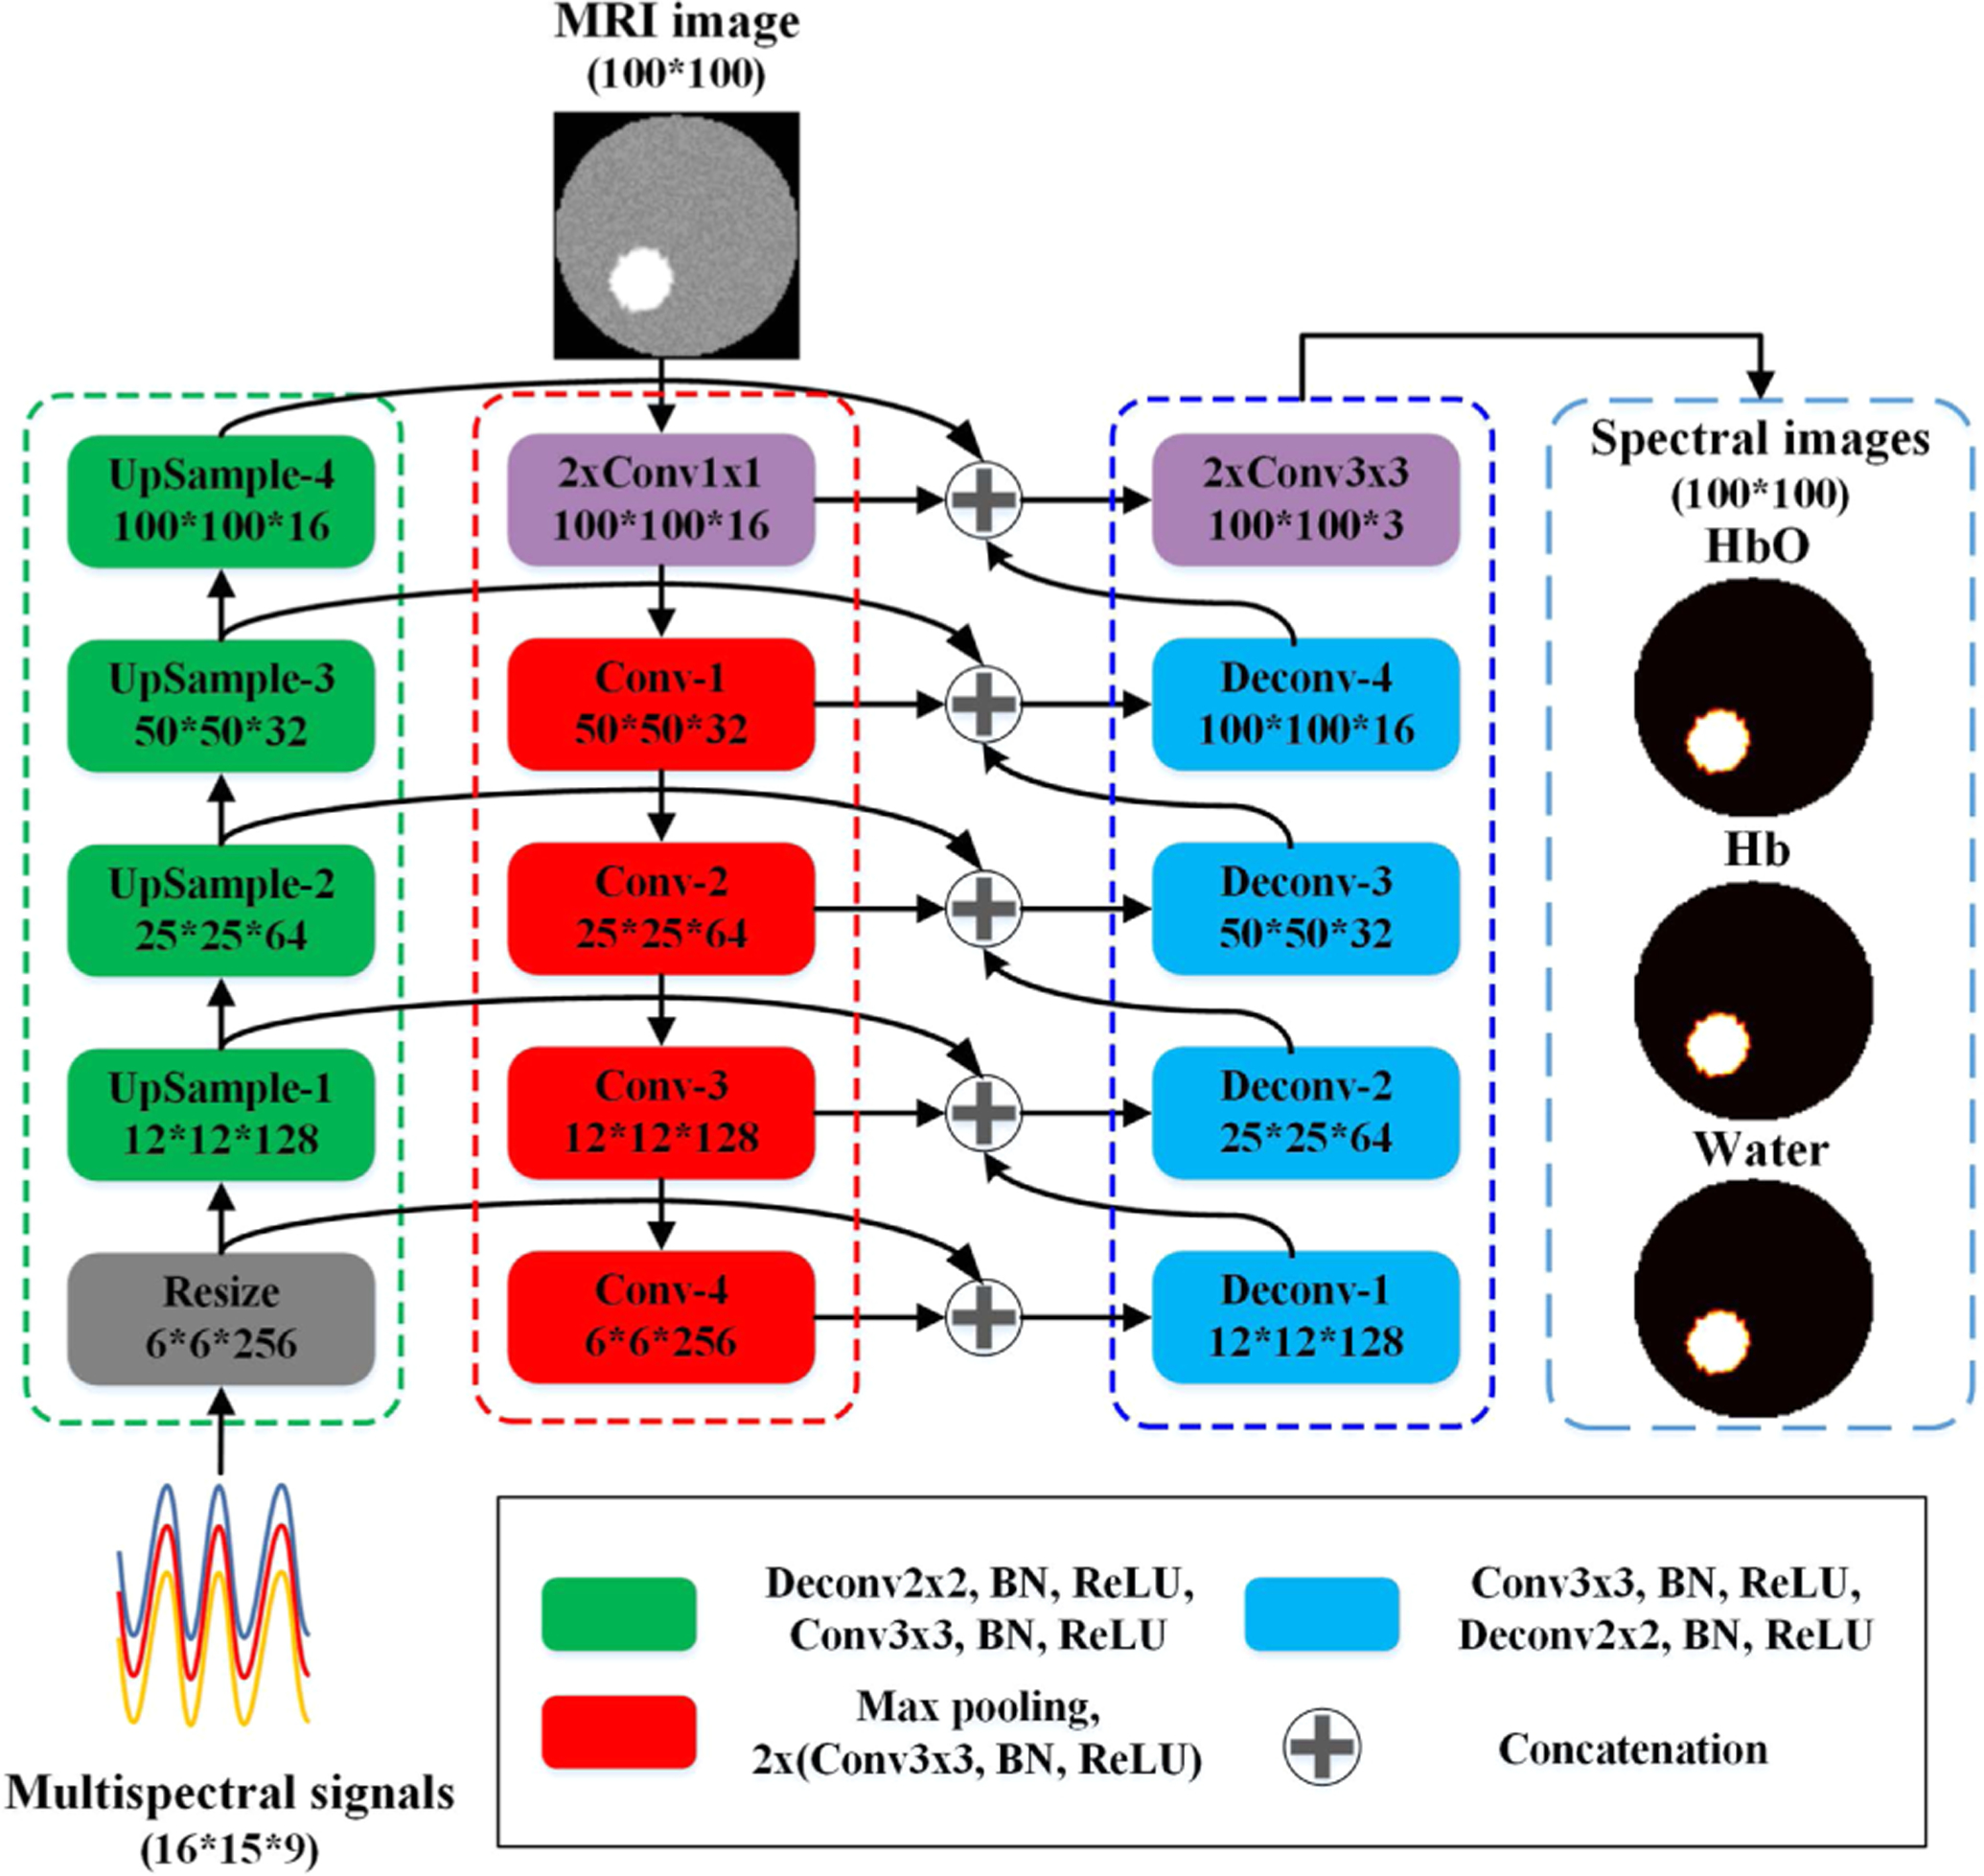
Inspired by these developments and with the unique opportunity to incorporate anatomical images into these networks that can further improve NIRST image quality, we developed a DL based algorithm (Z-Net) for MRI-guided NIRST image reconstruction. In our approach, segmentation of MRI images and modeling of light propagation are avoided, and the concentrations of chromophores of oxy-hemoglobin (HbO), deoxy-hemoglobin (Hb), and water are recovered from acquired NIRST signals guided by MRI images through end-to-end training with simulated datasets. Figure 1 shows the Z-Net architecture for 2D experiments. Optical signals at nine wavelengths (661, 735, 785, 808, 826, 852, 903, 912, and 948 nm) and MRI images provide the input to the network. The Z-Net based reconstruction algorithm is described in the following steps:
Fig. 1.

Architecture of the proposed Z-Net. All operations are accompanied by batch normalization (BN) and ReLU.
Step 1. Measured NIRST signals, , are input into the network and mapped into feature space, φ0, with size 6 * 6 * 256 through a resizing operation described as
| (1) |
where k3×3 is a convolution kernel, * represents the convolution operation, σ(·) denotes the batch normalization (BN) and rectified liner unit (ReLU) operation, p is the pooling operation, L denotes the double sampling linear interpolation operation, φ0 is the output of the resize operation, and Ns is the number of measurements.
Next, the optical features, φn(n = 1, 2, 3, 4), are obtained through four up-sampling layers, and the feature of the nth up-sampling layer is reformulated as
| (2) |
where ⊗ denotes the deconvolution operation, and k2×2 is a convolution kernel of size 2 × 2.
Step 2. MRI images, m, are the second Z-net input. They are mapped to feature space, ψ0, by down-sampling layers described by
| (3) |
where k1×1 is a convolution kernel, which is used to change the number of channels. Next, MRI image features, ψn, of the nth layer are obtained through four down-sampling layers:
| (4) |
where Pmax denotes the max pooling operation.
Step 3. The features obtained in steps 1 and 2 are input to the deconvolution layers after concatenation. Each deconvolution layer concatenates the features from both its previous layer and two other paths. The output of the first layer can be described as
| (5) |
where ⊕ denotes the concatenation operation. After concatenating features from the previous layer, features in the nth (n = 1, 2, 3, 4) concatenation layer are expressed as
| (6) |
Finally, images of chromophore concentrations, , are output through the fourth convolution layer:
| (7) |
A series of 2D circular phantoms with a diameter of 82 mm was used to create simulation datasets in which 16 light source and detector pairs were uniformly distributed around the circumference of each phantom. One or two circular inclusions with varied inclusion-to-background contrasts were placed randomly at locations inside the phantoms. Chromophore concentrations of HbO, Hb, and water used for training are listed in Supplement 1, Table S1. The diameter of the single inclusion was set to be 12, 16, or 20 mm. For phantoms with two inclusions, diameters were fixed at 16 mm, but with varied edge-to-edge distances (from 4 to 42 mm). Chromophore concentrations listed in Table S1 were assigned randomly to phantoms with one or two inclusions of different sizes. A total of 20,000 phantoms were created to generate the simulation data. When one detector position operates as the source, data were collected at the remaining 15 detector locations for each wavelength. Thus, a total of 2160 (16 * 15 * 9) data points were collected for each phantom. Open source software, Nirfast, was used to generate boundary measurements by solving the diffusion equation [20], and 2% Gaussian noise (twice the amplitude noise level of our existing NIRST system, which is <1% [21]) was added randomly to the measurements, to evaluate the performance of the proposed algorithm.
MRI images corresponding to each phantom were also generated. Specifically, gray values of inclusions in MRI images were set to 80, and gray values of background were assigned as 50, according to the dynamic contrast enhanced (DCE)-MRI contrast commonly observed. In addition, 4% Gaussian noise was added to the MRI images.
We used 70% of these datasets for training, 20% for validation, and 10% as testing. The Z-net algorithm was implemented in Python 3.7 with PyTorch [22] of Adam [23] with a learning rate of 0.005, batch size of 128, and mean square error (MSE) loss function for backpropagation, respectively. A workstation with an Intel Xeon CPU at 2.20 GHz and 2 NVIDIA GeForce RTX 2080 graphic cards with 8 GB memory was the computational system used for training and validating our network. Computations consumed 3.9 h for training with 200 epochs.
Table 1 shows the number of training parameters and training times for two DL based algorithms. Our Z-Net has only 3.48M parameters, and it took approximately 3.9 h for training from a 100 × 100-sized dataset. Relative to Y-Net, our method saved 43% in parameters and 46% in computation time without reducing reconstruction performance.
Table 1.
Number of Training Parameters and Training Time for Different Network Architectures
| Method | Y-Net | Z-Net |
|---|---|---|
| Number of parameter (M) | 6.09 | 3.48 |
| Training time (hours) | 7.2 | 3.9 |
Three evaluation metrics were used to validate Z-net performance: MSE [24], peak signal-to-noise ratio (PSNR) [25], and structural similarity index (SSIM) [26]. For performance assessment, we compared our algorithm against two reconstruction methods including DRI [10] and Y-Net (network architecture shown in Supplement 1, Fig. S1) [14].
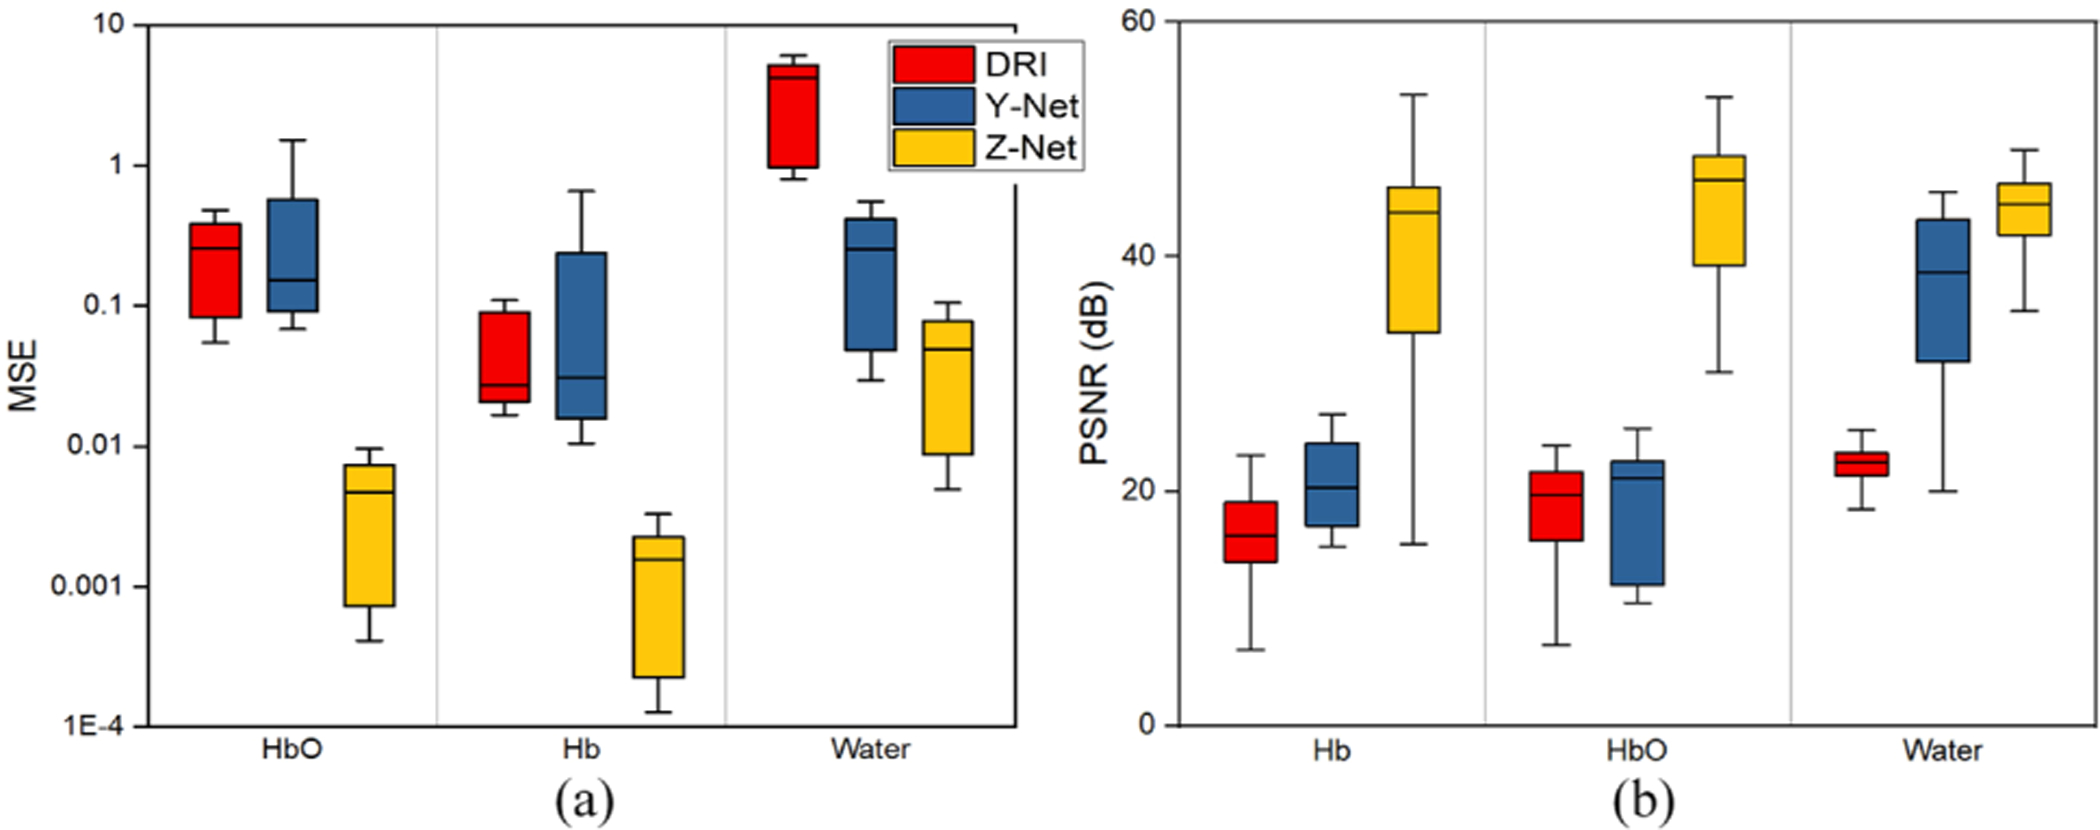
Figure 2 reports statistical results for MSE and PSNR for all phantoms in the testing dataset (SSIM shown in Supplement 1, Fig. S2). These phantoms were not used for training. Average MSE of water was reduced from 3.6 ± 2.1, 0.19 ± 0.09 (with DRI and Y-net, respectively) to 0.05 ± 0.04 (with Z-Net), and average PSNR was improved from 22.1 ± 1.7, 37.4 ± 5.7 (with DRI and Y-net) to 43.3 ± 3.8 dB with Z-net. In addition, average SSIM increased from 0.49,0.78 to 0.99, which is 102% and 27% higher than values yielded by DRI and Y-Net, respectively, indicating that the recovered images are very close to their ground truths.
Fig. 2.

Statistical results for three algorithms for (a) MSE and (b) PSNR.
Supplement 1, Fig. S3 shows representative recovered images of HbO, Hb, and water in the case of a phantom with three inclusions. Quantitative results are compiled in Supplement 1, Table S2. Compared to reconstructed images by DRI or Y-Net, images recovered with Z-net have values much closer to their ground truths with fewer artifacts. Table S2 indicates that the proposed Z-net method provided accurate recovery of HbO, Hb, and water concentrations compared to the other two algorithms. Errors in recovered values were less than 2% of known values. Compared with DRI or Y-net, MSE obtained with Z-Net was 92.6%, 85.7%, and 99.7%, and 99.2%, 91.7%, and 99.8% lower for HbO, Hb, and water, respectively.
To test further generalization of a well-trained Z-Net, the number of source–detector pairs in the testing phantom data was reduced from 16 to eight. The corresponding reconstructed images with different algorithms are shown in Supplement 1, Fig. S4. Compared to DRI or Y-net, images reconstructed by Z-net are higher in quality, and estimated chromophore values are closer to the ground truths.
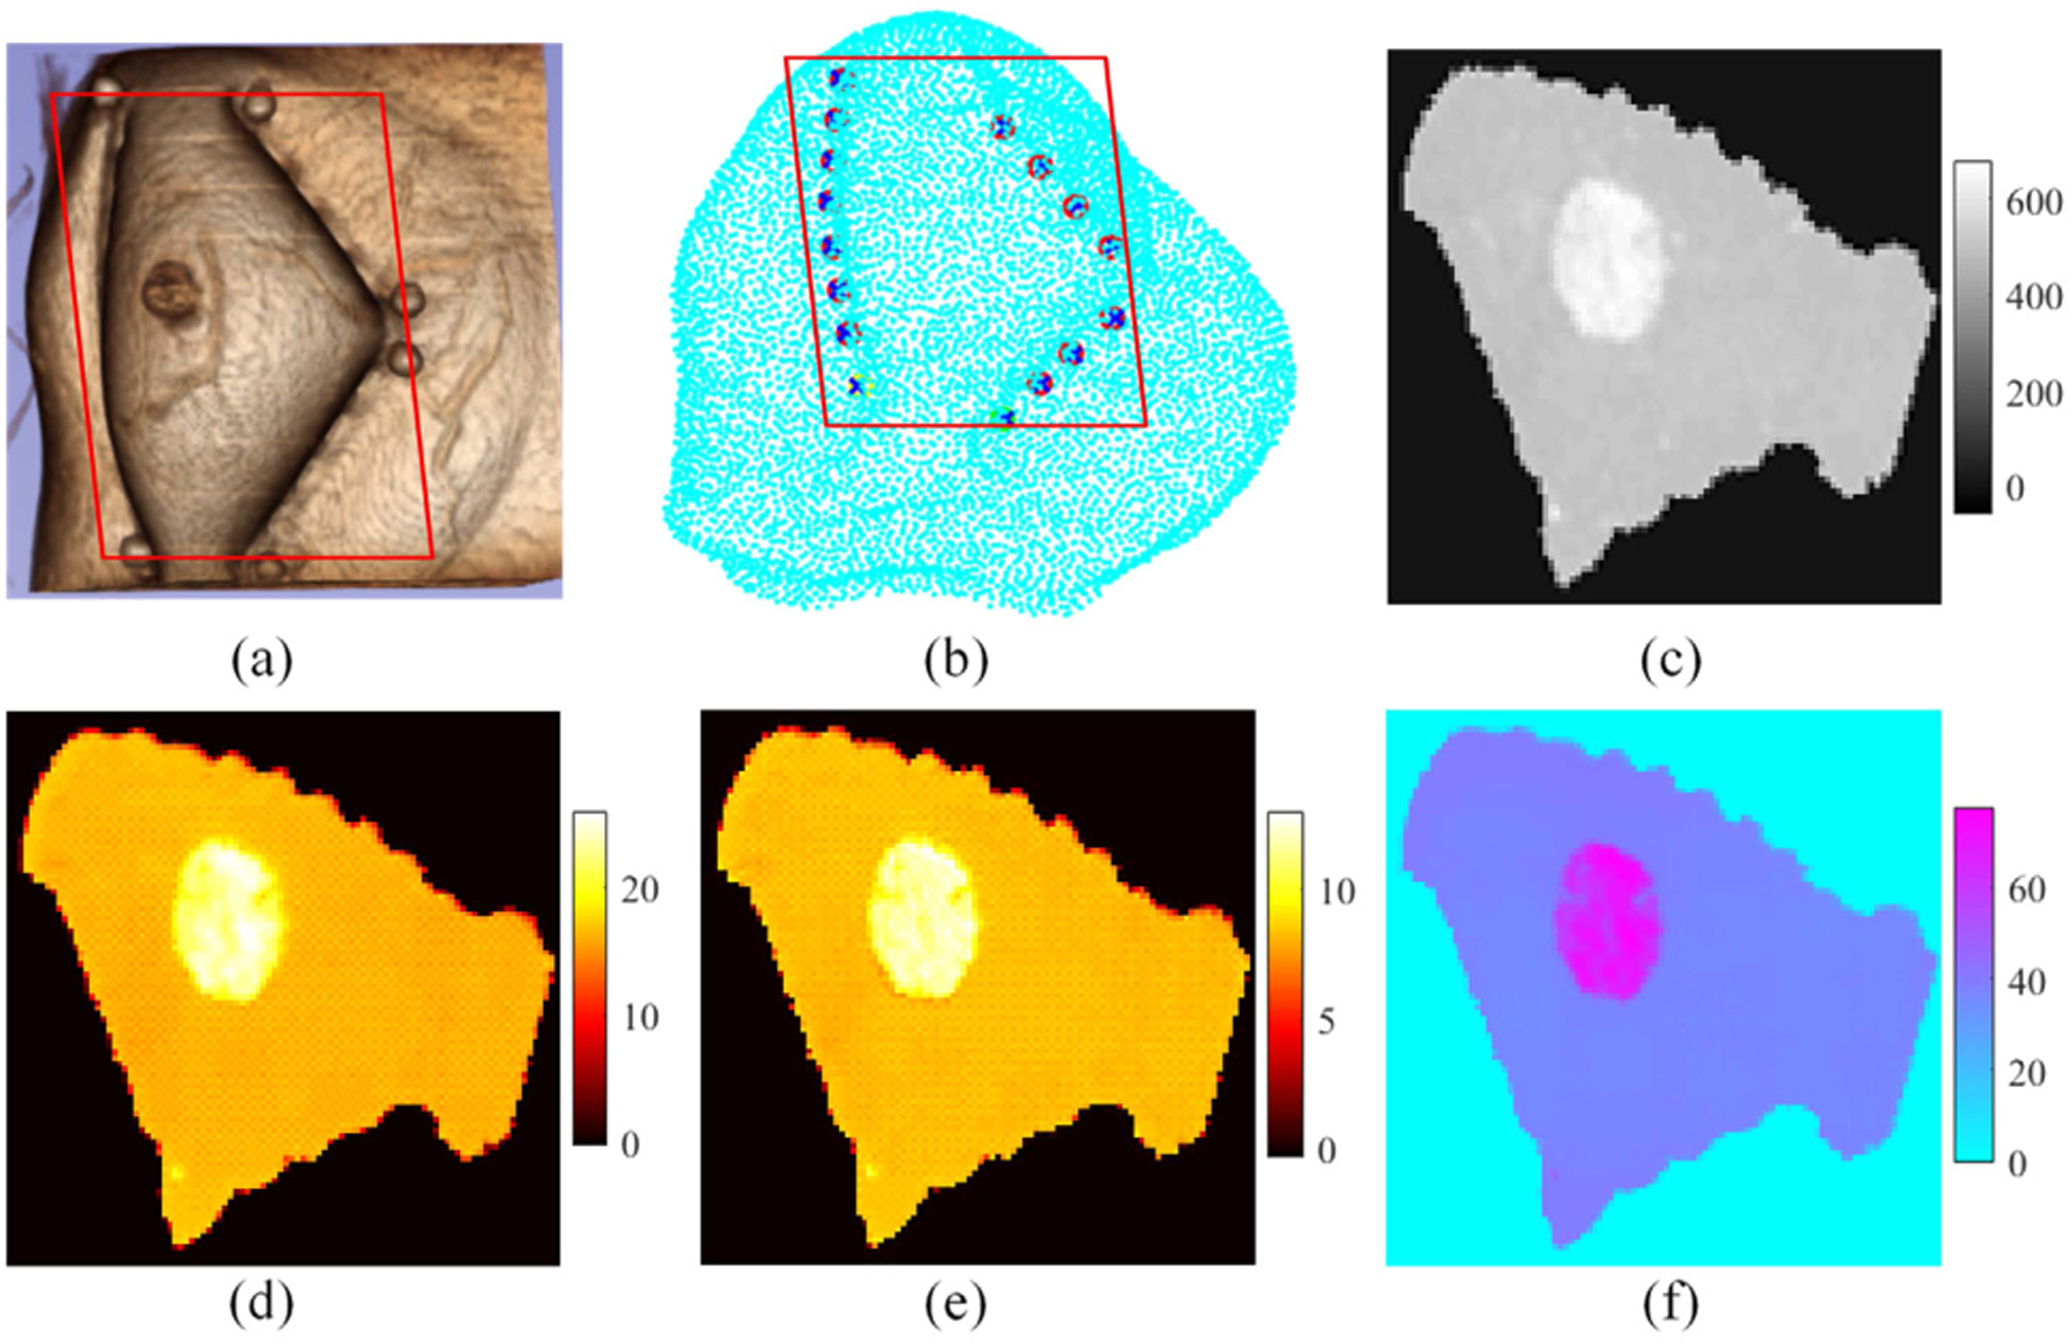
Finally, as an example of clinical relevance, we applied the Z-net approach to image reconstruction of patient data obtained by our MRI-guided NIRST system [10,11]. The MRI exam and NIRST data acquisition were carried out simultaneously for women with undiagnosed abnormalities at the time of the imaging exam. A triangular interface with 16 fiber bundles as sources–detectors was used to acquire NIRST data at each of nine wavelengths in the range of 660 nm to 1064 nm (which are the same as those used in the previous simulation experiments). MRI acquisition consisted of standard (T1, T2, diffusion weighted imaging) and DCE sequences. Amplitude data at each of nine wavelengths and MRI DCE images were input to the trained Z-net. Figure 3 illustrates results obtained from a 61-year-old woman with invasive ductal carcinoma in her right breast. Figure 3(a) shows a 3D image rendering from the T1-MRI data. The NIRST imaging plane is marked by the red rectangle in Fig. 3(b), and dynamic contrast MR images are shown in Fig. 3(c). Breast density was fatty, and the patient’s BIRADS score was 5. Figures 3(d)–3(f) present reconstructed HbO, Hb, and water images from acquired CW data, respectively. The tumor is located accurately, and HbT contrast between tumor and surrounding normal tissue was 1.47—high values indicate the abnormality was malignant, which was confirmed later by pathology.
Fig. 3.

Z-net results from a breast cancer patient with a malignant lesion. (a) 3D MRI, (b) measurement plane, (c) MRI DCE image, and (d)–(f) reconstructed images of HbO (μM), Hb (μM), and water (%), respectively. The red rectangle denotes the reconstruction plane.
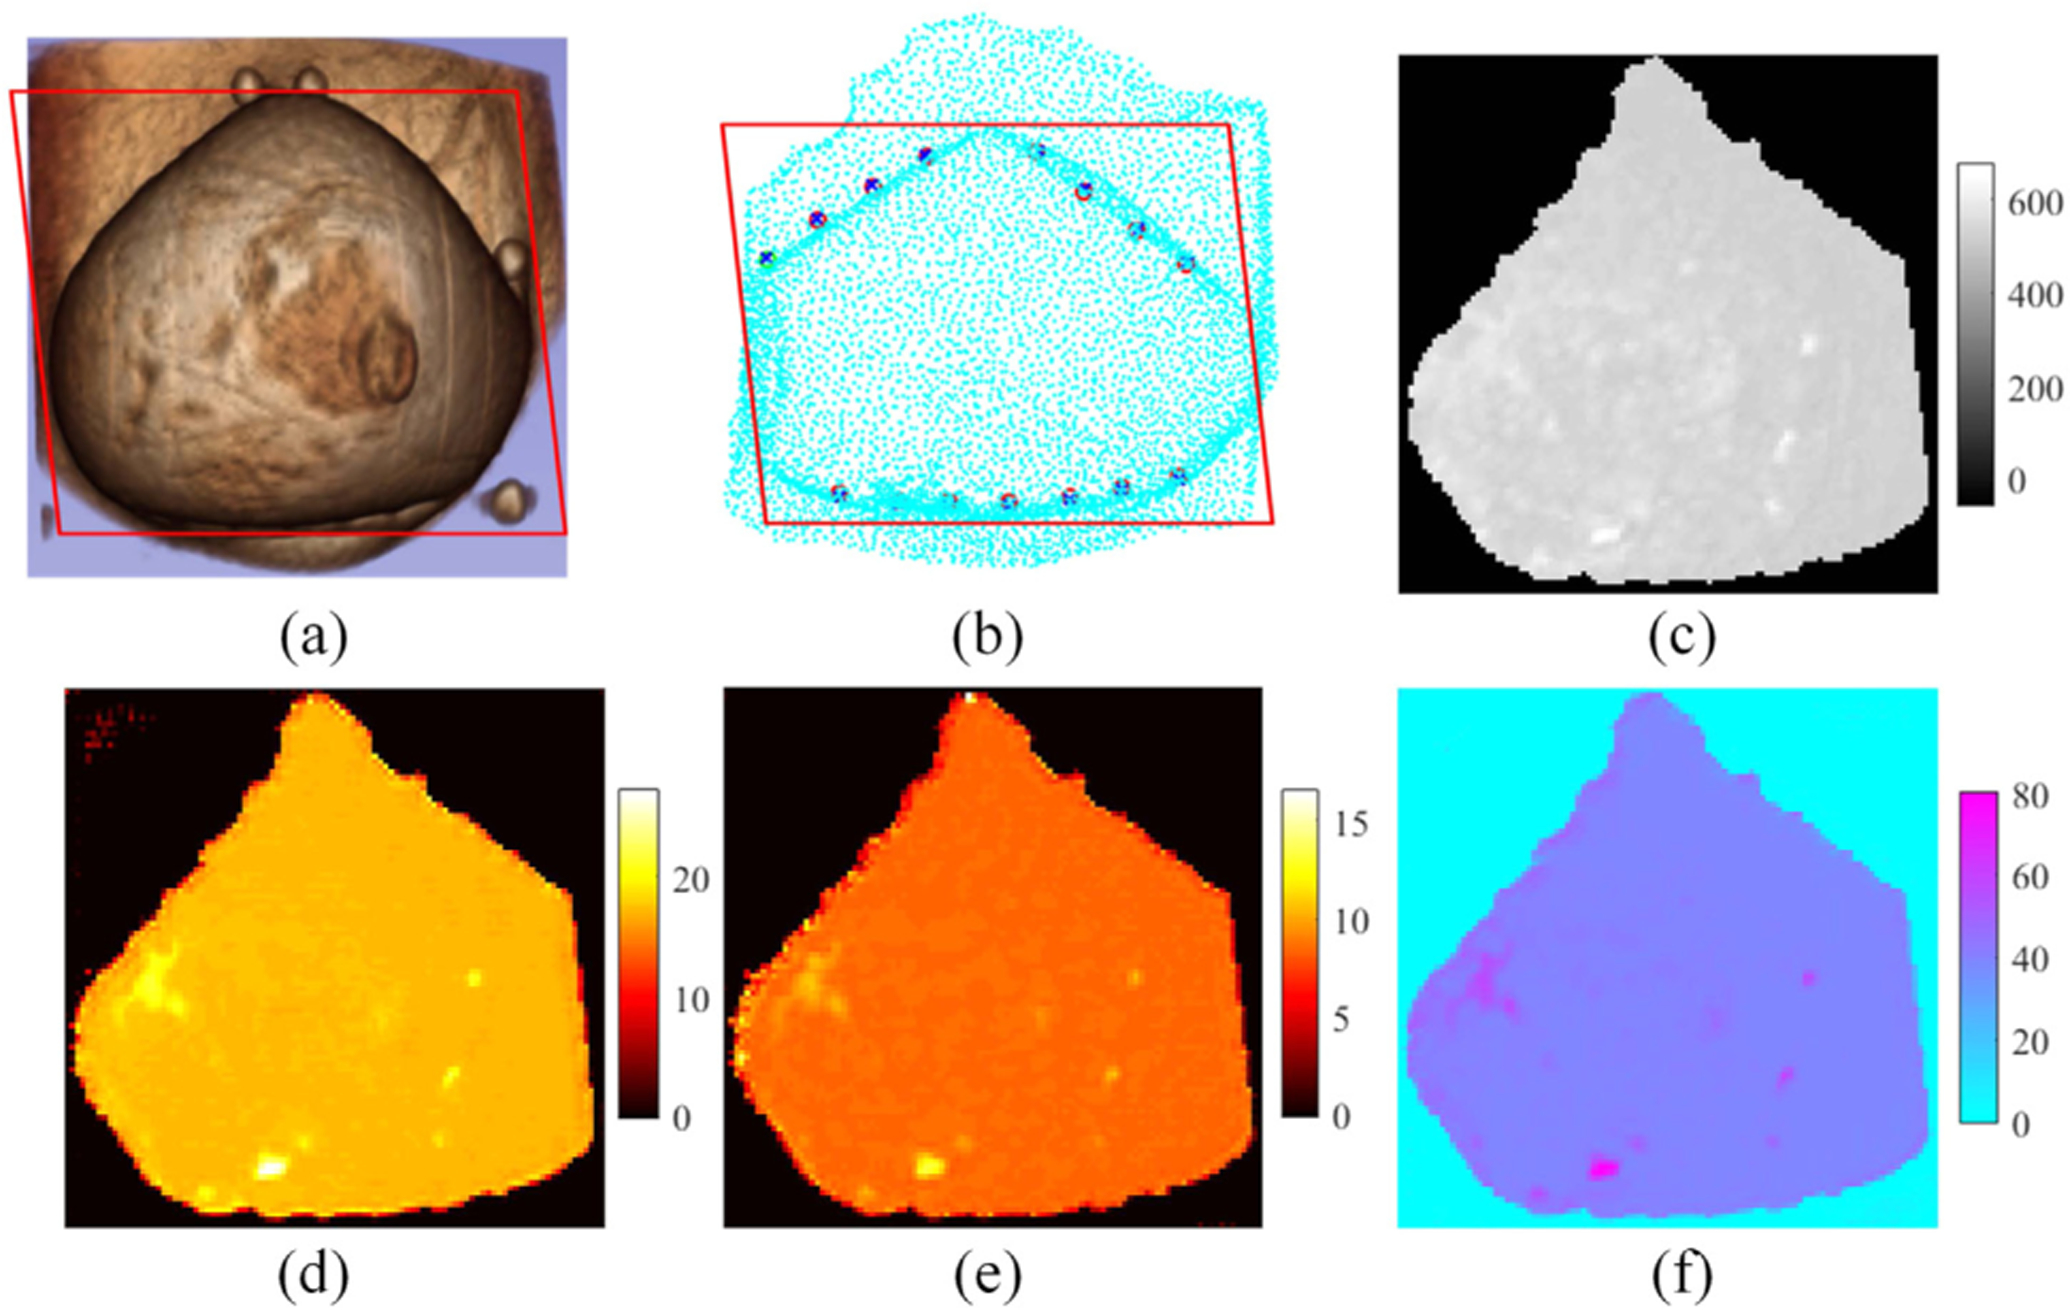
Figure 4 illustrates results obtained from a 28-year-old woman with a suspicious mass in her left breast. Images presented in the figure are the same as Fig. 3. Breast density was heterogeneous dense, and the BIRADS score was 3. In this case, HbT contrast between the suspicious mass and the surrounding normal tissue was 1.05, suggesting the lesion is benign. Pathological analysis confirmed later that the abnormality was a fibroadenoma.
Fig. 4.

Z-net results from a subject with a benign lesion. (a) 3D MRI, (b) measurement plane, (c) MRI DCE image, and (d)–(f) reconstructed images of HbO (μM), Hb (μM), and water (%), respectively. The red rectangle denotes the reconstruction plane.
Although DL has been adapted for optical image reconstruction [12–19], the algorithm developed here is the first to use DL for combined multimodality image reconstruction. The structural information obtained from DCE-MRI was combined with NIRST through DL without segmenting the MRI or modeling the NIRST light propagation in tissue. Simulation results show that the quantitative accuracy of NIRST is improved relative to DRI or other DL-based reconstruction algorithms. Patient results also suggest that Z-net, when trained with only computer generated simulation data from simple and regular-shaped phantoms, has potential to differentiate malignant from benign breast abnormalities. Since Z-net was trained successfully with simulated phantom data, unlimited training sets can be generated to enhance further the generalization of Z-net for MRI-guided NIRST image reconstruction. While the MRI images used in training had two regions, one of which mimicked fatty tissue (the background) and the other mimicked tumor, and gray-scale contrasts between tumor and surrounding background regions were assumed to be constant (at 1.5), patient images were generated with Z-net that had different chromophore contrasts in malignant and benign cases. These results indicate the robustness of the approach, and the possibility that it can be applied to other combined multimodality image reconstructions.
We found Z-net reconstructions generated images with better quantitative accuracy relative to Y-net results (Table S2). Z-net also reduced the number of trained parameters to about half those needed in Y-net (Table 1). Training time was also reduced with Z-net (from 7.2 h for Y-net to 3.9 h for Z-net). Finally, Z-net proved to offer an end-to-end reconstruction that takes only a few seconds after successful training and leads to near real-time image reconstruction that could be applied in clinical settings where more dynamic results are needed.
In this study, only tissue hemoglobin concentration (HbO and Hb) and water images were used in Z-net to differentiate malignant from benign breast abnormalities. Since Z-net can be expanded by adding other parameters, such as oxygen saturation, lipids, and scattering properties into the network, the diagnostic power for breast cancer detection may be increased even further as multi-spectral systems for tissue spectroscopy are advanced.
Supplement 1, Fig. S5 confirms the importance of using MRI images to guide NIRST reconstruction. The phantom used to generate the results in Fig. S5 is the same as the one used in Fig. S3. Figures S5(a) and S5(b) present images reconstructed with a traditional reconstruction algorithm [20] that uses only NIRST signals as network input. Image quality of the reconstructions in Fig. S5 is inferior to that with MRI guidance (in Fig. S3). Indeed, inclusion contrast relative to the surrounding background in Fig. S5(b) has nearly disappeared. This result demonstrates the value of combining MRI images with NIRST reconstruction, especially for DL based image recovery.
In summary, we developed a new tomographic reconstruction algorithm based on Z-Net that recovers concentrations of chromophores in NIRST guided by MRI without modeling light propagation in tissue or segmenting MRI. We demonstrated that the Z-Net algorithm yielded superior performance after being trained by a deep neural network with computer generated synthetic phantom data. Future work will expand Z-Net to incorporate 3D patient data and test its performance in a larger clinical trial.
Supplementary Material
Funding.
National Natural Science Foundation of China (82171992, 81871394); National Institute of Biomedical Imaging and Bioengineering (R01 EB027098).
Footnotes
Disclosures. The authors declare no conflicts of interest.
Supplemental document. See Supplement 1 for supporting content.
Data availability.
Data underlying the results presented in this paper are not publicly available at this time but may be obtained from the authors upon reasonable request.
REFERENCES
- 1.Boas DA, Brooks DH, Miller EL, DiMarzio CA, Kilmer M, Gaudette RJ, and Zhang Q, IEEE Signal Process. Mag 18(6), 57 (2001). [Google Scholar]
- 2.Flexman ML, Kim HK, Gunther JE, Lim E, Alvarez MC, Desperito E, Kalinsky K, Hershman DL, and Hielscher AH, J. Biomed. Opt 18, 096012 (2013). [DOI] [PubMed] [Google Scholar]
- 3.Arridge SR, Inverse Probl. 15, R41 (1999). [DOI] [PMC free article] [PubMed] [Google Scholar]
- 4.Arridge SR and Schotland JC, Inverse Probl. 25, 123010 (2009). [Google Scholar]
- 5.Lu W, Duan J, Orive-Miguel D, Herve L, and Styles IB, Biomed. Opt. Express 10, 2684 (2019). [DOI] [PMC free article] [PubMed] [Google Scholar]
- 6.Benfenati A, Causin P, Lupieri MG, and Naldi G, J. Phys. Conf. Ser 1476, 012007 (2020). [Google Scholar]
- 7.Fang Q, Moore RH, Kopans DB, and Boas DA, Biomed. Opt. Express 1, 223 (2010). [DOI] [PMC free article] [PubMed] [Google Scholar]
- 8.Ntziachristos V, Yodh AG, Schnall MD, and Chance B, Neoplasia 4, 347 (2002). [DOI] [PMC free article] [PubMed] [Google Scholar]
- 9.Yalavarthy PK, Pogue B, Dehghani H, Carpenter C, Jiang S, and Paulsen KD, Opt. Express 15, 8043 (2007). [DOI] [PubMed] [Google Scholar]
- 10.Zhang L, Zhao Y, Jiang S, Pogue BW, and Paulsen KD, Biomed. Opt. Express 6, 3618 (2015). [DOI] [PMC free article] [PubMed] [Google Scholar]
- 11.Feng J, Jiang S, Xu J, Zhao Y, Pogue BW, and Paulsen KD, J. Biomed. Opt 21, 090506 (2016). [DOI] [PMC free article] [PubMed] [Google Scholar]
- 12.Yang G, Yu S, Dong H, Slabaugh G, Dragotti PL, Ye X, Liu F, Arridge S, Keegan J, Guo Y, and Firmin D, IEEE Trans. Med. Imaging 37, 1310 (2018). [DOI] [PubMed] [Google Scholar]
- 13.Jin KH, McCann MT, Froustey E, and Unser M, IEEE Trans. Image Process 26, 4509 (2017). [DOI] [PubMed] [Google Scholar]
- 14.Lan H, Jiang D, Yang C, Gao F, and Gao F, Photoacoustics 20, 100197 (2020). [DOI] [PMC free article] [PubMed] [Google Scholar]
- 15.Gao Y, Wang K, An Y, Jiang S, Meng H, and Tian J, Optica 5, 1451 (2018). [Google Scholar]
- 16.Sabir S, Cho S, Kim Y, Pua R, Heo D, Kim KH, Choi Y, and Cho S, Appl. Opt 59, 1461 (2020). [DOI] [PubMed] [Google Scholar]
- 17.Yoo J, Sabir S, Heo D, Kim KH, Wahab A, Choi Y, Lee SI, Chae EY, Kim HH, Bae YM, Choi YW, Cho S, and Ye JC, IEEE Trans. Med. Imaging 39, 877 (2020). [DOI] [PubMed] [Google Scholar]
- 18.Takamizu Y, Umemura M, Yajima H, Abe M, and Hoshi Y, “Deep learning of diffuse optical tomography based on time-domain radiative transfer equation,” arXiv:2011. 12520 (2020).
- 19.Wang H, Wu N, Zhao Z, Han G, Zhang J, and Wang J, Biomed. Opt. Express 11, 2964 (2020). [DOI] [PMC free article] [PubMed] [Google Scholar]
- 20.Dehghani H, Eames ME, Yalavarthyetal PK, Davis SC, Srinivasan S, Carpenter CM, Pogue BW, and Paulsen KD, Commun. Num. Methods Eng 25, 711 (2009). [DOI] [PMC free article] [PubMed] [Google Scholar]
- 21.El-Ghussein F, Mastanduno MA, Jiang S, Pogue BW, and Paulsen KD, J. Biomed. Opt 19, 011010 (2013). [DOI] [PMC free article] [PubMed] [Google Scholar]
- 22.Paszke A, Gross S, Chintala S, Chanan G, Yang E, Devito Z, Lin Z, Desmaison A, Antiga L, and Lerer A, in NIPS 2017 Workshop Autodiff (2017).
- 23.Kingma DP and Ba J, “Adam: a method for stochastic optimization,” arXiv:1412.6980 [cs.LG] (2014).
- 24.Pogue BW, Song X, Tosteson TD, McBride TO, Jiang S, and Paulsen KD, IEEE Trans. Med. Imaging 21, 755 (2002). [DOI] [PubMed] [Google Scholar]
- 25.Cuadros AP and Arce GR, Opt. Express 25, 23833 (2017). [DOI] [PubMed] [Google Scholar]
- 26.Wang Z, Bovik AC, Sheikh HR, and Simoncelli EP, IEEE Trans. Image Process 13, 600 (2004). [DOI] [PubMed] [Google Scholar]
Associated Data
This section collects any data citations, data availability statements, or supplementary materials included in this article.
Supplementary Materials
Data Availability Statement
Data underlying the results presented in this paper are not publicly available at this time but may be obtained from the authors upon reasonable request.


