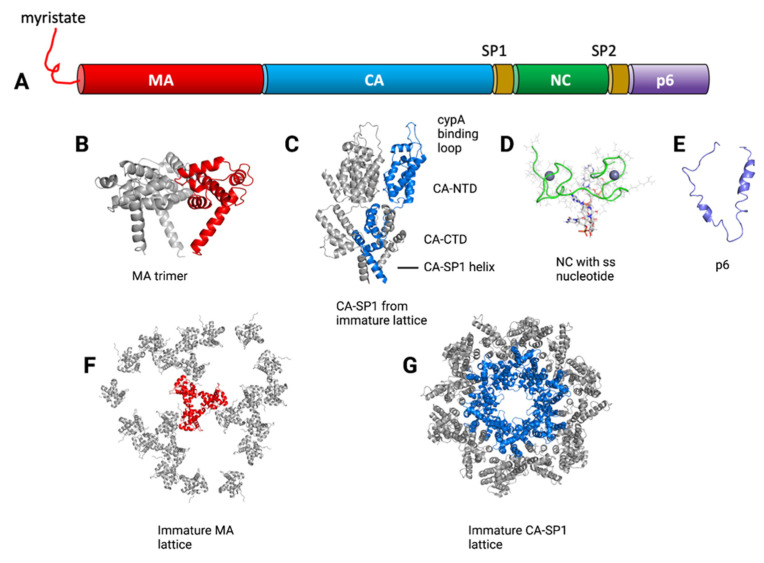
Figure 3.
Gag polyprotein with cleavage products. (A) Schematic diagram showing cleavage products/domains in different colors. (B) MA trimer structure from PDB 1HIW [39]. (C) CA-SP1 structure, side view, with one CANTD-CACTD-SP1 colored in blue, from PDB 5L93 [40]. Note cyclophilin A (cypA) binding loop, CANTD and CACTD connected by flexible loop, and CA-SP1 helix. (D) NC structure with single-stranded oligonucleotide (ss nucleotide), from PDB 1BJ6 [41]. Zinc ions shown as spheres. (E) p6 structure from PDB 2C55 [42]. (F) Immature MA lattice, top view, with single trimer in red; from PDB 7OVQ [43]. (G) Immature CA-SP1 lattice, top view, with single hexamer colored blue, from PDB 4USN [44]. Structures rendered by the PyMOL Molecular Graphics System, Shrodinger, LLC. The arrangement of this figure was adapted from [45]. Figure compiled using BioRender.com (2022).

