

Abstract
The molecular mechanisms underpinning prostate cancer (PCa) progression are incompletely understood, and precise stratification of aggressive primary PCa (pri-PCa) from indolent ones poses a major clinical challenge. Here, we comprehensively dissect, genomically and transcriptomically, the m6A (N6-methyladenosine) pathway as a whole in PCa. Expression, but not the genomic alteration, repertoire of the full set of 24 m6A regulators at the population level successfully stratifies pri-PCa into three m6A clusters with distinct molecular and clinical features. These three m6A modification patterns closely correlate with androgen receptor signaling, stemness, proliferation and tumor immunogenicity of cancer cells, and stroma activity and immune landscape of tumor microenvironment (TME). We observe a discrepancy between a potentially higher neoantigen production and a deficiency in antigen presentation processes in aggressive PCa, offering insights into the failure of immunotherapy. Identification of PCa-specific m6A phenotype-associated genes provides a basis for construction of m6Avalue to measure m6A methylation patterns in individual patients. Tumors with lower m6Avalue are relatively indolent with abundant immune cell infiltration and stroma activity. Interestingly, m6Avalue separates PCa TME into fibrotic and nonfibrotic phenotypes (instead of previously reported immune-proficient or -desert phenotypes in other cancer types). Significantly, m6Avalue can be used to predict drug response and clinical immunotherapy efficacy in both castration-resistant PCa and other cancer types. Therefore, our study establishes m6A methylation modification pattern as a determinant in PCa progression via impacting cancer cell aggressiveness and TME remodeling.
Graphical Abstract
Graphical Abstract.

A m6Avalue predictive of prostate cancer aggressiveness and immunity.
INTRODUCTION
Human prostate cancer (PCa) is the second most frequent diagnosed malignancy in men worldwide, counting 1 414 259 new cases and causing 375 304 deaths (3.8% of all deaths caused by cancer in men) in 2020 (1). For years, PCa has ranked the first and the second cancer type for incidence and mortality in the United States, respectively (2). The prostate is an exocrine gland containing androgen receptor negative (AR−) basal and androgen-sensitive AR+ luminal epithelial cells, together with rare neuroendocrine (NE) cells (3,4). PCa develops over a long period of time from normal prostate to prostatic intraepithelial neoplasia, then to early- and late-stage primary PCa (pri-PCa), and finally to metastatic PCa with or without treatment (5). Histologically, PCa presents as adenocarcinoma with a predominant luminal phenotype. Clinically, most pri-PCa are diagnosed as low to intermediate grade [i.e. Gleason grade (GS) ≤ 7], relatively indolent and treated by radical prostatectomy and/or radiation with a good prognosis (6). In contrast, locally advanced (GS ≥ 9) and metastatic PCa are mainly treated with androgen deprivation therapy (ADT, such as luteinizing hormone-releasing hormone agonists/antagonists) to block testicular androgen synthesis (7), but most cases will eventually fail ADT, recur and result in a lethal disease termed castration-resistant PCa (CRPC) (4,5). CRPCs are currently treated with anti-androgens such as enzalutamide (Enza) that interfere with AR functions, but unfortunately patients will succumb to recurrence in 4–5 months (6). Cancer stemness, manifested by stem cell (SC)-like properties of cancer cells, has been widely appreciated as a key determinant in tumor progression and therapy resistance (8). We have recently shown that CRPCs are relatively undifferentiated and, molecularly, basal/stem-like (3). In support, knockout of the full-length AR in androgen-sensitive LNCaP cells elicits an SC-like phenotype with enhanced proliferation and CRPC-regenerating ability under castration conditions (9).
The mechanisms underlying PCa progression, especially treatment resistance and subsequent maintenance of CRPC, are incompletely understood (10). In the past decade, owing to the global efforts of applying high-throughput next-generation sequencing technology in clinic [typified by The Cancer Genome Atlas (TCGA) program], we have now reached a consensus that genomic alteration, transcriptomic abnormality and epigenetic dysregulation all play pivotal roles in prostate tumorigenesis (3,6,9,11–17). We have recently shown that the copy number variations (CNVs) and mRNA expression disturbance of splicing regulatory genes (SRGs) jointly contribute to RNA splicing dysregulation seen in aggressive PCa, which offers a novel therapeutic vulnerability by targeting spliceosome (6). In another effort to dissect the AR heterogeneity and distinct treatment responses, we found that an SC transcriptional program driven by BCL-2 is operating in AR−/low CRPCs and our proof-of-concept studies have validated a combinatorial therapy (BCL-2 inhibitor plus Enza) as an efficient therapeutic regimen for both AR+ and AR−/low CRPCs (9). Moreover, in addition to CRPC emergence, distinguishing the many indolent pri-PCa from the minority of lethal ones (otherwise leading to overtreatment) represents another major clinical challenge (18). Based on gene expression profiles within low-GS prostate tumors, a 19-gene signature was previously identified to distinguish indolent versus aggressive subgroups (19). In light of splicing regulation and correlation with worse clinical outcome, we have recently developed a 13-SRG signature to separate aggressive pri-PCa from indolent ones (6). Notably, despite the research progress, PCa still causes a significant mortality. Together with the fact of interpatient heterogeneity of PCa at both molecular and clinical levels, more studies are needed to interrogate PCa evolution at distinct angles.
Despite the multilayers of regulatory mechanisms in PCa etiology, they all converge, eventually, on gene expression regulation at versatile levels, as gene expression is the fundamental determinant of cellular phenotypes (3). N6-Methyladenosine (m6A), the most abundant form of internal modifications in eukaryote RNA, post-transcriptionally modulates gene expression by impacting RNA biology [e.g. stability, subcellular localization, transportation, translation and alternative splicing (AS)], and thus functions in a spectrum of important bioprocesses (20). Expectedly, emerging evidence has implicated m6A modification in tumorigenesis of diverse organ systems (21). Analogous to epigenetic DNA methylation, m6A is a dynamic RNA modification and is controlled by the methyltransferase ‘writer’ complex, the demethylase ‘erasers’ and ‘reader’ proteins (22,23). In PCa, a few reports, on an individual gene basis, have highlighted the significance of m6A methylation in tumorigenesis. For example, METTL3 has been shown to be both highly expressed in PCa tissues and essential for proliferation and metastasis in multiple PCa cell lines (24–26). Knocking down of YTHDF2 suppresses proliferation and migration of PCa cells by globally elevating m6A levels (27). However, given that the cellular m6A homeostasis is established by an integrated network of m6A regulators (consisting of all writers/erasers/readers within a cell), a comprehensive study that considers the m6A pathway as a whole has not been performed in PCa. More interestingly, besides the roles of m6A in cancer cells per se, m6A has been recognized to regulate the fate of immune cells and thus reshape the immune landscape of tumor microenvironment (TME) (28–31). Evidence has unraveled several m6A regulators as key molecules modulating tumor immunity and responses to immunotherapies typified by immune checkpoint blockades (ICBs) (32–35). PCa is immunologically ‘cold’ due to immunosuppressive TME and poor immune infiltration (36), but clinical trials have observed, encouragingly, that a small proportion of patients did exhibit beneficial responses to ICB (such as anti-PD-1/PD-L1/CTLA-4) (37). Experimentally, studies have shown that PCa can be induced to be amenable for ICB by induction of an effective antitumor response via TME remodeling (38,39). In particular, a tight association between m6A modification patterns and TME diversity and complexity has been suggested in gastric (40) and colon (41) cancers, but whether the m6A pathway plays a role in PCa immunity remains elusive.
Here, we focus on the m6A pathway as a whole and provide a comprehensive characterization of different m6A methylation patterns during PCa evolution. We report that m6A dysregulation, caused by a global upregulation of many writer and reader genes and downregulation of eraser genes, plays an oncogenic role in PCa. The expression repertoire of m6A regulators clearly classifies PCa into three clusters with distinct molecular and clinical features. We also systematically correlate the m6A modification patterns with AR signaling, stemness, tumor immunogenicity and immune landscape in PCa. To facilitate our findings toward a potential clinical usage, we establish m6Avalue, a scoring signature based on m6A phenotype-associated genes, to quantify the m6A modification pattern in individual PCa patients. We demonstrate that m6Avalue associates positively with a nonfibrotic TME phenotype that augments aggressiveness and can be used to predict responses to both small-molecule inhibitors and immunotherapies in PCa and other cancer types.
MATERIALS AND METHODS
Data collection and bioinformatic preprocessing
In this study, we utilized a total of four large PCa cohorts, including two TCGA [both curated (11) and noncurated pan-cancer] and two Gene Expression Omnibus (GEO) validation cohorts [GSE21034 (42) and GSE116918 (43)]. For study of immunotherapy responses, four cohorts including a CRPC (44) and three melanoma [GSE78220 (45), GSE91061 (46) and GSE100797 (47)] cohorts were used. Public gene expression and clinical information was downloaded from TCGA and NCBI GEO database. For RNA sequencing (RNA-seq) data, gene expression matrixes (read counts or FPKM) were downloaded via the R package TCGAbiolinks (48) or GEO database. The original gene expression values were transformed into transcripts per kilobase million format. For microarray data, the R package GEOquery (49) was used to download the raw data and further extract gene expression based on the platform information. Somatic mutation data were obtained from TCGA by the R package TCGAmutations (50). Also, for visualization, we analyzed the landscape of genomic alternations of 24 m6A regulators, together with reference genes MYC and RB1, by cBioPortal (51).
Identification of DEGs and DSEs
For differentially expressed gene (DEG) analysis, the read count files of the curated (333 tumors) and noncurated pan-cancer TCGA-PRAD cohorts (n = 494) were used. First, genes with at least three reads in more than one-third of tumors were retained for further analysis. Then, the DESeq2 package (52) was applied to identified DEGs with cutoff of false discovery rate (FDR) <0.05 and fold change >2. For differentially spliced event (DSE) analysis, raw RNA-seq files were mapped to human reference genome (Homo_sapiens.GRCh38.dna.primary_assembly.fa) by STAR 2.7.3a (53), and then quantified with rMATS v4.0 (54) to identify distinct types of splicing events. DSEs with FDR < 0.1 and ΔPSI (percent of splicing inclusion) > 0.1 were considered significant events.
Association between DEGs and m6A targets
In order to verify that the DEGs identified from different m6A modification patterns were indeed targets of the m6A pathway, we overlapped them with two sets of m6A targets. First, we downloaded the potential target genes of m6A regulators (human) from m6A2Target (http://m6A2target.canceromics.org/#/download) (55). Particularly, m6A2Target recorded target genes derived from a spectrum of experimental and/or bioinformatic methods. To increase the confidence of our results, potential target genes that were predicted by at least two strategies were chosen. Then, these target genes were grouped by different m6A regulators and a hypergeometric test was applied to analyze the overlap between DEGs and m6A target genes. Second, we performed m6A-seq in three clinical PCa samples and identified a total of 14 354 genes bearing m6A peaks (Supplementary Table S1). Overlapping of DEGs with this set of experimentally validated m6A target genes further strengthened the clinical relevance of our results.
m6A-seq analysis
The m6A-seq analysis was performed in collaboration with LC Sciences, LLC. Briefly, total RNA was isolated from prostate tissues using TRIzol reagent (Invitrogen, Carlsbad, CA, USA), followed by two rounds of poly(A)+ RNA purification using Dynabeads Oligo (dT)25-61005 (Thermo Fisher, CA, USA). Then, the poly(A)+ RNA was sheared into 100–200-nt fragments using Magnesium RNA Fragmentation Module (NEB, USA, cat # e6150). A portion of the RNA fragments was directly used as input for regular RNA-seq, and another portion was incubated for 2 h at 4°C with anti-m6A antibody (No. 202003, Synaptic Systems, Germany) in IP buffer (50 mM Tris–HCl, 750 mM NaCl and 0.5% Igepal CA-630). The m6A–IP RNA mixture was then incubated with Dynabeads protein A/G for an additional 2 h at 4°C on a rotating wheel. After washing three times with IP buffer, the bound RNA was purified for downstream library preparation and sequencing on an illumina Novaseq™ 6000 (LC-Bio Technology Co., Ltd, Hangzhou, China). For data analysis, HISAT2 (http://daehwankimlab.github.io/hisat2) was used to map reads to the reference genome Homo sapiens GRCh38. The m6A peaks were then identified by HOMER (http://homer.ucsd.edu/homer) and macs2 (https://github.com/taoliu/MACS), and only peaks identified by two software were retained. We utilized HOMER (http://homer.ucsd.edu/homer/motif) for de novo and known motif finding followed by localization of the motif with respect to peak summit.
Gene set variation analysis and functional annotation
We utilized the ‘GSVA’ package (56) to conduct GSVA enrichment analysis. The gene-set libraries of ‘h.all.v7.4.symbols.gmt’ and ‘c2.all.v7.4.symbols.gmt’ were downloaded from MSigDB. In addition, we also curated a list of previously reported and biologically relevant gene signatures (Supplementary Table S2). For example, an AR signature was previously established by assessing the expression levels of 30 genes that were previously reported as defining the pathway (57). A 109-gene signature that excluded confounding immune genes and proliferation markers has been validated in multiple cancer types to faithfully recapitulate stemness (58). The comparative enrichment score was calculated for each gene signature and P-value <0.05 was considered statistically significant. In parallel, we also used gene set enrichment analysis (GSEA) (59), based on the pre-ranked expression list, to annotate transcriptomic profiles. We followed the standard procedure described by GSEA user guide. The FDR for GSEA is the estimated probability that a gene set with a given NES (normalized enrichment score) represents a false-positive finding and an FDR < 0.25 is considered to be statistically significant. The Metascape (http://metascape.org) was used to annotate DEGs. Terms with P < 0.05, minimum count 3 and enrichment factor >1.5 (enrichment factor is the ratio between observed count and the count expected by chance) were considered significant. The STRING database was used to construct protein–protein interaction network and disconnected nodes in the network were discarded.
Consensus clustering for 24 m6A regulators
We systematically investigated the full set of currently known 24 m6A regulators (23) and utilized unsupervised clustering to identified different m6A modification patterns based on their expression in a given PCa cohort. The number of clusters was determined by the consensus clustering algorithm in the ConsensusClusterPlus package (60) and a permutation of 1000 times was used to stringently increase our classification reliability.
Cancer immunity cycle analysis and quantification of TME cell infiltration
A previous study has conceptualized the anticancer immune response as seven sequential steps: (i) release of cancer cell antigens; (ii) cancer antigen presentation; (iii) priming and activation; (iv) trafficking of immune cells to tumors; (v) infiltration of immune cells into tumors; (vi) recognition of cancer cells by T cells; and (vii) killing of cancer cells. In aggregate, these seven steps were referred to as the cancer immunity cycle (61). Based on the gene markers specific to each step, we used GSVA to estimate the activation or activity of each step. For immune cell infiltration, a previously well-established compendium of gene signatures related to 28 specific immune cells (62) was used to quantify the relative abundance of each tumor-infiltrating lymphocyte (TIL) subpopulation by GSVA. We utilized R package ESTIMATE (63) to evaluate the ImmuneScore and StromaScore in PCa TME.
Construction of the weighted m6A gene signature and m6Avalue
Construction of the weighted m6A gene signature (reflecting the overall m6A activity or level) was calculated based on a linear Z-score combination of expression of 24 regulators. In particular, 4 genes (ALKBH5, FTO, ZC3H13 and IGF2BP2) downregulated in tumors versus normal tissue and other 20 genes with a trend of upregulation in tumors were considered negatively and positively weighted, respectively (Figure 2A, right).
Figure 2.
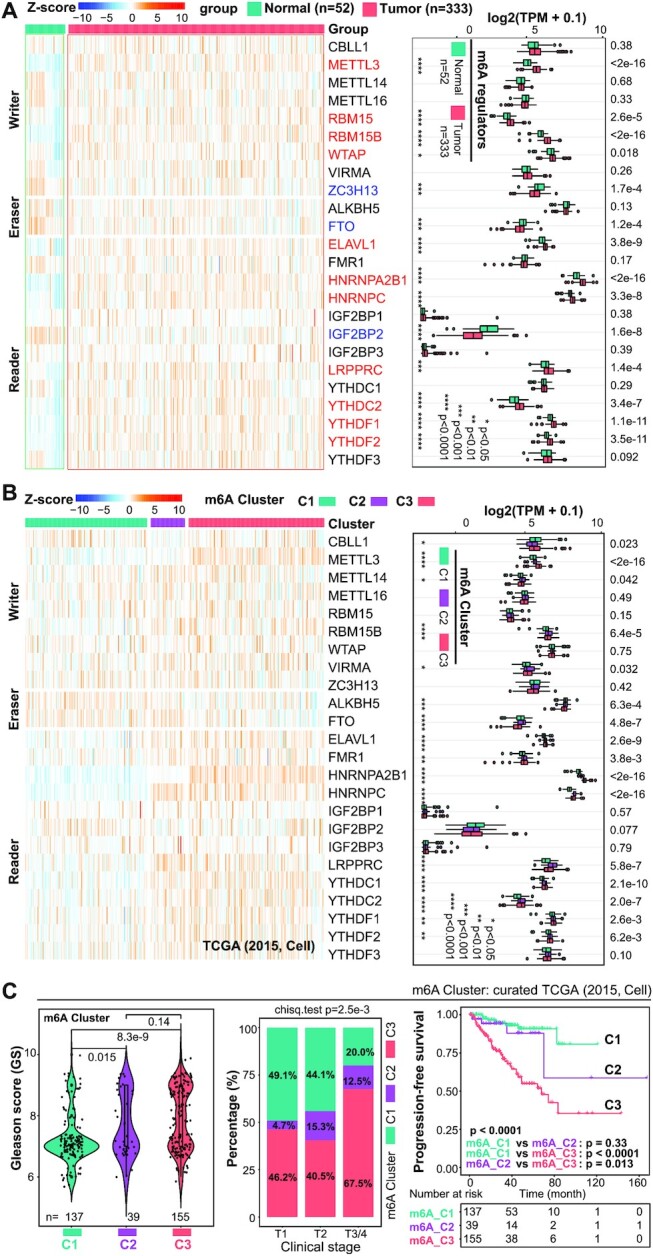
Distinct m6A modification patterns classify PCa into three clusters with distinct clinical features. (A) Heatmap presentation (left) and boxplot quantification (right) of the expression pattern of 24 m6A regulators between normal prostate (n = 52) and pri-PCa (n = 333) tissues. Gene expression is normalized by Z-score, with red and blue denoting a high and a low expression, respectively. Up- and downregulated genes are colored in red and blue, respectively (right). Within the plots, the center lines represent median values, box edges are 75th and 25th percentiles, and dots denote the outliers. Significance was calculated by the Wilcoxon test. (B) The expression repertoire of 24 m6A regulators classifies pri-PCa into three clusters (termed m6A_Cluster1/2/3) in the curated TCGA cohort (left), with an overall upregulation of many writer and reader genes and downregulation of eraser genes in C3 versus C1. Boxplot (right) showing difference in expression of 24 m6A regulators among three m6A_Clusters. Significance was calculated by the Kruskal–Wallis test. *P < 0.05, **P < 0.01, ***P < 0.001 and ****P < 0.0001. (C) Comparison of GS (left), tumor stage (middle) and patients’ survival (right) showing m6A clusters C1 and C3 as the least and most aggressive PCa subtypes, respectively. The proportion of patients clustered into m6A_C2/3 in advanced T3/4 stages (67.5% + 12.5% = 80%) is much higher than that in T1 (46.2% + 4.7% = 50.9%) and T2 (40.5% + 15.3% = 55.8%) stages (middle). Significance was calculated by the Kruskal–Wallis test (left), chi-square test (middle) and long-rank test (right), respectively. A ‘jittered’ function of ggplot2 was used for GS visualization.
 |
Construction of the m6Avalue was performed as follows. First, expression pattern of the 24 regulators well separated pri-PCa into three clusters (m6A_C1/2/3) at the population level, and 407 core DEGs were identified (via collecting the overlapping genes in comparisons of any two clusters) as m6A phenotype-associated genes (Supplementary Figure S3A). Then, we performed prognostic analysis for each core DEG by a univariate Cox model and 87 genes with significant prognosis (P < 0.05) were extracted for following analysis. Next, the m6Avalue was calculated based on a linear combination of expression values (Z-score) of the 87 genes, of which genes with hazard ratio (HR) >1 and <1 contributed positively and negatively to m6Avalue, respectively:
 |
where zscore1 refers to expression value of genes with HR > 1 and zscore2 refers to expression value of genes with HR < 1.
Association of m6Avalue with drug sensitivity
The transcriptomes of 469 cancer cell lines and the corresponding drug response information (i.e. IC50) of 24 anticancer drugs were downloaded from CCLE (Cancer Cell Line Encyclopedia) database (https://portals.broadinstitute.org/ccle). The m6Avalue for each cell line was calculated by the formula described earlier. Spearman correlation was performed to estimate the association between m6Avalue and drug response and a correlation with |r| > 0.1 and P-value <0.05 was considered significant.
Statistical analysis
All statistical analysis in our study were performed by R 4.1.0. Specifically, the m6A regulator co-expression analysis, association between m6Avalue and selected signatures, cancer immunity cycle and 28 TIL subpopulations were performed by Pearson analysis (Figure 6A; Supplementary Figures S2A and S6A). Quantitative data fitting normal distribution were compared by t-test; otherwise, the Wilcoxon (for two groups) or Kruskal–Wallis (for more than two groups) test was used. Chi-square or Fisher’s exact test was performed to compare differences between categorical variables. Kaplan–Meier survival analysis and Cox regression model were used to analyze the prognostic value of m6Avalue by the packages ‘survival’ and ‘survminer’, and the long-rank test was utilized to determine the significance. The ‘survcutpoint’ function was applied to determine the optimal cutoff for m6Avalue with maximum rank statistic. The pROC package was used to estimate the specificity and sensitivity of the m6Avalue model. Heatmaps showing gene expression (Figures 2A, left, and B, left, and 5A; Supplementary Figures S1D, S2E, left, and S5B) or signature activity (Figures 1C and 4A and C–F; Supplementary Figures S1E and G, S4C–E and S5D–G) were visualized based on normalized Z-score values. For clinical outcome analyses of the curated TCGA-PRAD cohort, two samples (TCGA-HC-7740 and TCGA-HC-8265) were excluded due to duplicate existing for each sample in the cohort (Figures 2C and 5B–E; Supplementary Figures S1C and S2C).
Figure 6.

m6Avalue separates TME into fibrotic and nonfibrotic phenotypes. (A) Pearson correlation of m6Avalue with indicated signatures. Positive and negative correlations are colored in red and blue, respectively. (B) Comparison of the eight prevalent PCa genomic subtypes reported by TCGA (11) showing similar patterns between the m6Avaluehigh and m6Avaluelow groups. Violin plot showing difference in m6Avalue of tumors classified in TCGA mRNA_cluster (C) and SCNA_cluster (D) (11), recently reported Immune_Subtype (E) (72) and TME subtype (F) (71). Significance was calculated by the Kruskal–Wallis test. (G) The Kaplan–Meier plot showing a worse survival outcome associated with the nonfibrotic phenotype. The P-value was calculated using the long-rank test. (H) Distribution of four previously reported TME subtypes in the m6Avaluehigh and m6Avaluelow groups with P-value (chi-square test) labeled on top. Prostate tumors with higher m6Avalues tend to exhibit nonfibrotic phenotype (79.0% versus 40.5%). IE/F: immune-enriched, fibrotic; IE: immune-enriched, nonfibrotic; F: fibrotic; D: immune-depleted. IE/F and F are fibrotic, while IE and D are nonfibrotic. All analyses were performed based on the curated TCGA cohort (n = 333).
Figure 5.

m6Avalue clearly stratifies PCa patients with distinct clinical outcomes. (A) The expression repertoire of 407 core DEGs classifies pri-PCa into three subgroups (m6A_S1/2/3). Comparison of GS (B), tumor stage (C) and patient’s survival outcome (D) showing S1 and S3 being the least and most aggressive PCa subgroups, respectively. The proportion of patients clustered into m6A_S2/3 in advanced T2 (52.3% + 18.0% = 70.3%) and T3/4 (47.5% + 22.5% = 70%) stages is much higher than that in T1 (32.1% + 16.0% = 48.1%) stage (C). Significance was calculated by the Kruskal–Wallis test (B), chi-square test (C) and long-rank test (D). (E) Comparison of GS (left), tumor stage (middle) and patient’s survival outcome (right) showing the m6Avaluehigh group being more aggressive. Significance was calculated by the Wilcoxon test (left), chi-square test (middle) and long-rank test (right). (F) Multivariate Cox regression analysis showing m6Avalue as an independent prognostic factor among other indicated clinical parameters. The length of the horizontal line represents the 95% confidence interval for each group. The vertical dotted line denotes the HR of all patients. (G) The predictive value of m6Avalue in the curated TCGA cohort measured by ROC curves. ROC, receiver operating characteristic; AUC, area under the curve. (H and I) Validation in an independent Taylor dataset. Comparison of GS (H, left, Wilcoxon test), tumor stage (H, middle, chi-square test) and patients’ survival outcome (H, right, long-rank test) showing the m6Avaluehigh group being more aggressive. Notably, 10 patients without full information of GS, clinical stage and survival time were omitted. Multivariate Cox regression analysis showing m6Avalue as an independent prognostic factor among other indicated clinical parameters (I).
Figure 1.

Mutational landscape of m6A regulators in human pri-PCa. (A) List of the full set of currently known 24 m6A regulators (left) and functional network of the top 7 biological categories enriched in these regulators by Metascape analysis (right). (B) A comprehensive survey of genomic alterations in 24 m6A regulators in the curated TCGA clinical cohort in cBioPortal. Frequently amplified MYC (colored in red) is included as a reference gene. Each bar represents the alteration status of an individual gene for a single patient and the percentage of alterations for each gene in the cohort is provided. Heatmap presentation (C) and boxplot quantification (D) of enrichment of the representative cancer hallmarks from Molecular Signatures Database (MSigDB) by gene set variation analysis (GSVA) in pri-PCa with (mutant group) or without [wild-type (WT) group] genomic alternations in m6A regulators. Within the plots, the center lines represent median values, box edges are 75th and 25th percentiles, and dots denote the outliers. Significance was calculated by the Wilcoxon test.
Figure 4.

Different m6A modification patterns characterized by cancer hallmarks and TME. (A) Heatmap showing enrichment of the representative cancer hallmarks from MSigDB by GSVA in three m6A clusters in the curated TCGA cohort, with P-values labeled on the left. (B) Comparative GSEA of transcriptomes in C3 versus C1 showing C3 as a more proliferative and stem-like cluster and C1 as a more differentiated, less migrative and stroma-enriched cluster. The FDR for GSEA is the estimated probability that a gene set with a given NES represents a false-positive finding and an FDR < 0.25 is considered to be statistically significant. (C) Pathway analysis of different m6A modification patterns. Heatmap presentation (left) and boxplot quantification (right, upper) of the enrichment of indicated signatures among three m6A clusters. The expression dynamics of two known AR target genes (KLK3 and FKBP5) are also shown (right, bottom). (D) Cancer immunity cycle analysis by GSVA showing C1 and C3 as the clusters with the highest and the lowest anticancer immunity, respectively. (E) Heatmap showing enrichment of the 28 TIL subpopulations calculated by GSVA in three m6A clusters, with P-values labeled on the left. Red and blue in scale bar denote relatively high and low abundances of subpopulations, respectively. (F) Heatmap presentation (upper) and boxplot quantification (bottom) of the enrichment of indicated signatures among three m6A clusters. Within the plots, the center lines represent median values, box edges are 75th and 25th percentiles, and dots denote the outliers. (G) Distribution of four previously reported TME subtypes in three m6A lusters, with P-value (chi-square test) labeled on top. IE/F: immune-enriched, fibrotic; IE: immune-enriched, nonfibrotic; F: fibrotic; D: immune-depleted. IE/F and F are fibrotic, while IE and D are nonfibrotic. All analyses were based on the curated TCGA cohort (n = 333), and significance was all calculated by the Kruskal–Wallis test (A, C–F).
RESULTS
Genomic alternations of m6A regulators unclearly classify PCa
A total of currently known 24 m6A regulators (9 writers, 2 erasers and 13 readers) (23) were investigated (Figure 1A). Functional annotation of these 24 genes showed that, expectedly, they exclusively regulated cellular processes concentrating on RNA biology (e.g. RNA modification, stability and translation) (Figure 1A). To explore the molecular mechanisms underpinning the m6A signaling dysregulation in PCa, we first examined genetic alterations in these regulators in pri-PCa. We mainly utilized the previously published TCGA-PRAD cohort (11) throughout the study, as it was curated. Among the 333 patients in this largest curated pri-PCa cohort (11), CNV represented the main alteration form (Figure 1B), with ZC3H13, YTHDC2 and FTO being the most deleted genes and VIRMA and YTHDF3 being the most amplified genes. Interestingly, the top deleted and amplified genes often co-occurred with the deletion of tumor suppressor genes and amplification of oncogenes, respectively. For example, ZC3H13 and RB1 were colocalized and codeleted on Chr13q (P < 0.001, one-sided Fisher’s exact test) (Supplementary Figure S1A). On the other hand, VIRMA and YTHDF3 were co-amplified with MYC on 8q (P < 0.001) (Figure 1B). Globally, we observed a weak mutational co-occurrence relationship among 24 regulators (Supplementary Figure S1B). Importantly, interrogation of the TCGA pan-cancer cohort (n = 494) generated a similar mutational landscape (Supplementary Figure S1A). In aggregate, our data indicate that, albeit a low alteration frequency at individual gene level (≤3 genes mutated at a rate of >5% in indicated cohorts), m6A signaling, collectively, represents a frequently mutated pathway in pri-PCa, as 40% and 33% of patients recorded in the curated TCGA cohort (11) and TCGA pan-cancer cohort, respectively, harbor at least one mutation of one m6A regulator (Figure 1B; Supplementary Figure S1A).
Somatic alternations are major drivers of cancer development (64). Classification of patients with or without mutations in these m6A regulators showed that the mutant group displayed a nonsignificant trend of worse survival outcome, but significantly higher GS, over the WT group (Supplementary Figure S1C), suggesting a potential pro-oncogenic role for the deregulated m6A pathway. Further, GSVA unraveled that many cancer hallmarks were dysregulated between these two groups (Figure 1C), with a noticeable pattern of an enrichment of proliferation pathways (e.g. E2F targets, G2M checkpoint and MYC targets) in the mutant group. However, pathways of TGFβ, p53 and apoptosis were more activated in the WT group (Figure 1D), again indicating that tumors with aberrant m6A signaling might be more aggressive. To further characterize the molecular difference between mutant versus WT groups, we identified a total of 132 DEGs (37 upregulated and 95 downregulated) (Supplementary Figure S1D). Gene Ontology (GO) analysis revealed that male reproduction-related pathways were enriched in mutant tumors, whereas WT tumors were more enriched for differentiation and TME-associated pathways such as cancer-associated fibroblasts (CAFs) and myofibroblasts (empowering muscle-like contractions), extracellular matrix (ECM) and immune cells (Supplementary Figure S1D). Together with the GSVA results that multiple stroma-regulatory pathways (e.g. TGFβ, myogenesis, IL-6 and IL-2) were upregulated in WT tumors (Figure 1C), our data implied that m6A signaling disturbance caused by genomic alterations may impact PCa progression via, at least partially, reshaping the TME.
Given the determinant role of TILs in both tumorigenesis and anticancer immunity elicited by immunotherapy, we next dissected the tumor immune landscape between the mutant and WT groups by GSVA of a well-established compendium of gene signatures related to specific immune cells (62). Globally, the immune landscape was similar in two groups (Supplementary Figure S1E), with only a limited number of TIL subpopulations being different in abundance (Supplementary Figure S1F). Consistently, calculation of the cancer immunity cycle via a web tool called TIP (see the ‘Materials and Methods’ section) (61) indicated that WT tumors exhibited only a slightly higher activity in step 7 of ‘killing cancer cells’ compared to mutant ones (Supplementary Figure S1G), again indicative of a subtle difference in TIL composition between these two groups.
Transcriptomic alternations and prognostic values of m6A regulators
The CNVs ultimately affect gene expression (6). We next compared the mRNA levels of all m6A regulators between normal prostate and pri-PCa tissues in the curated TCGA cohort (11). Among the 24 genes, 11 (including enzymatic writer METTL3) were found upregulated and 3 (including eraser FTO) downregulated in pri-PCa (Figure 2A), in line with the CNV results that many of them were top deleted or amplified (Figure 1B). Moreover, pairwise correlation analysis highlighted a significant, but non-category-specific (i.e. writer, eraser or reader) co-expression pattern among the majority of m6A regulators (Supplementary Figure S2A), except that METTL3 negatively correlated with ZC3H13 and erasers (FTO and ALKBH5) due to their downregulation in PCa (Figure 2A). Together, these results indicated, potentially, an overactivation of the m6A pathway in PCa. To further explore the clinical relevance of m6A regulators, we assessed their prognostic values in patient’s outcome. At individual gene level, univariate Cox regression analysis showed that METTL3, YTHDF1, HNRNPA2B1 and HNRNPC were risk factors, whereas ZC3H13 and FTO were protective factors, of PCa (Supplementary Figure S2B). Survival analysis identified 13 out of 24 as prognostic predictors, with 8 and 5 being classified as unfavorable and favorable genes, respectively (Supplementary Figure S2C). Unfavorable and favorable genes denoted a gene whose higher expression correlated with poor and better patient survival, respectively (6). Unsurprisingly, many of these unfavorable or favorable genes were either up- or downregulated in PCa (Figure 2A). Collectively, these findings implicated a pro-oncogenic role of the aberrant m6A pathway in PCa.
Distinct m6A modification patterns classify PCa into three clusters with distinct clinical features
The m6A modification pattern (i.e. m6A homeostasis) is governed by the expression repertoire of m6A regulators (23). Recent studies have reported significant differences between m6A modification patterns in different cancer types, where they contributed to tumorigenesis (40,41,65). To further dissect the potential functions played by the m6A pathway in PCa, we utilized consensus clustering (based on expression of the 24 regulators) to stratify the curated TCGA cohort (11) into different clusters, with each representing qualitatively a different m6A modification status. By trying different k-means (Supplementary Figure S2D), three clusters were identified (with a clear trend that many writer and reader genes were upregulated in C3), including 139 patients in cluster 1 (m6A_C1), 39 patients in cluster 2 (m6A_C2) and 155 patients in cluster 3 (m6A_C3) (Figure 2B, left; Supplementary Table S3). Association of clinical features revealed that tumor aggressiveness gradually increased from cluster C1 to cluster C3, in that tumors in C1 and C3 had the lower and higher scores of GS, proportion of advanced tumor stage T3/4, and a better or a worse survival outcome (Figure 2C), respectively. C2 represented a medium cluster with multiple aspects similar to C1, and contained relatively fewer patients; we thus subsequently mainly focused on C1 and C3 for comparisons. As expected, 16 out of 24 m6A regulators were found differentially expressed among these three clusters (Figure 2B, right). Notably, and consistent with the prognostic values of m6A clusters, two regulators (CBLL1 and FTO) upregulated in C1 had favorable effects, whereas the other eight regulators (METTL3, RBM15B, ELAVL1, FMR1, HNRNPA2B1, HNRNPC, YTHDC1 and YTHDF1) upregulated in C2 or C3 (versus C1) had unfavorable effects, on patient’s survival (Supplementary Figure S2C). Collectively, these results established clinically C3 as the most aggressive, and C1 as the indolent, pri-PCa cluster.
To solidify our findings, we also interrogated the uncurated TCGA pan-cancer PCa cohort (n = 494) and observed almost the same results (Supplementary Figure S2E and F). Expression of the 24 regulators well separated patients into three clusters (Supplementary Figure S2E), with C1 and C3 being the least and most aggressive clusters, respectively, in terms of GS, tumor stage and overall survival (Supplementary Figure S2F). Unsurprisingly, 18 out of 24 m6A regulators were differentially expressed among these clusters (Supplementary Figure S2E, right). Importantly, 98.7% of samples clustered in C3 in the curated TCGA cohort were also classified in C3 in the uncreated TCGA pan-cancer cohort (Supplementary Figure S2G), validating our strategy of focusing on the curated cohort (11). Moreover, we further extended our analysis to other two PCa datasets (GSE21034 and GSE116918), which had gene expression and clinical information available. For example, in the GSE116918 cohort (n = 248), three m6A modification patterns were identified (Supplementary Figure S2H) and, again, tumors clustered in C1 and C3 represented the least and worst aggressive ones, respectively (Supplementary Figure S2I). Similar result was also obtained with the Taylor (GSE21034) cohort (Supplementary Figure S2J).
Molecular pathway characterization of m6A clusters
We next sought to illustrate the transcriptomic differences among the three m6A_Clusters (i.e. three different m6A modification patterns). By performing the paired DEG analysis, we identified 1082 DEGs in total between any two of these clusters (termed as all DEGs) (Figure 3A; Supplementary Table S4). Among them, 407 genes were commonly dysregulated in at least two comparisons (core DEGs) (Supplementary Figure S3A), and we thus reasoned these 407 genes as m6A phenotype-associated genes. Protein–protein interaction analysis indicated that these core DEGs formed an integrated network centered at ACTN2, MYH6, CDK1, TOP2A, ORM1, UTS2B and other genes (Supplementary Figure S3B). GO annotation revealed that this network primarily regulated biological processes linked to TME, metabolism, SC and development, stress response and signal transduction (Supplementary Figure S3C), highlighting a broad impact of m6A phenotype-associated genes. Recently, a m6A2Target database was built to report potential targets of 20 m6A regulators derived from high-throughput studies (55). Overlapping of DEGs derived from m6A_Clusters with genes deposited in the m6A2Target database showed that 47% of all DEGs and 45% of core DEGs were significantly regulated by m6A regulators (hypergeometric test, Supplementary Figure S3D). Focusing on the two extreme clusters, pair comparison of C1 and C3 identified 460 DEGs (Supplementary Table S4). Interestingly, overlapping of them with the potential targets of individual m6A regulators indicated that 240 upregulated genes in C3 were more likely regulated by m6A regulators compared with the 220 downregulated genes (Figure 3B; Supplementary Table S5). This was consistent with the fact that the m6A pathway was more activated in C3, reflected by the higher signature score of weighted expression of 24 m6A regulators (Figure 3C). Moreover, functional annotation showed that the upregulated genes in C3 were mainly enriched in tumor-promoting pathways, such as cell cycle progression and proliferation, multiple known oncogenic pathways and cell migration (Figure 3D), consistent with a more aggressive phenotype of C3 over C1. Interestingly, the relatively indolent C1 tumors were primarily driven by pathways associated with TME, metabolism, differentiation and cell adhesion (Supplementary Figure S3E). Particularly, TME was the most enriched category in low-m6A-activity C1, again suggesting a pro-oncogenic role for m6A signaling via negatively shaping TME (also see later). Notably, C2 was nonsignificantly different from C1 in both survival and tumor stage analysis (Figure 2C); we thus observed subtle difference between up- and downregulated DEGs being identified as potential targets of m6A regulators (Supplementary Figure S3F and Supplementary Table S5). Currently, there is little study examining the global m6A modification landscape in clinical PCa specimens; hence, m6A2Target contained none PCa-relevant data. To further strengthen our findings with m6A2Target analysis, we performed, preliminarily, m6A-seq in three PCa tissues and identified a total of 14 354 genes bearing m6A peaks. Overlapping of DEGs between C3 and C1 with this clinically relevant m6A targets showed a 34.13% overlap (Supplementary Figure S3G), a percentage close to an estimated ∼40% of human genes that can be m6A modified (55).
Figure 3.

Molecular and immunogenic properties of distinct m6A clusters. (A) Heatmap of DEGs identified among the three m6A clusters in the curated TCGA cohort. (B) Overlapping of DEGs identified in C3 versus C1 and potential target genes of distinct m6A regulators reported in the m6A2Target database. The P-values were calculated using a hypergeometric test. (C) Comparison of the scores of a weighted m6A gene signature in tumors among the three m6A clusters. (D) GO analysis of upregulated genes in C3 versus C1 by Metascape. Top enriched GO terms were displayed and grouped into four functional categories (cell cycle, proliferation, oncogenic pathways and mobility). The P-values were calculated based on the cumulative hypergeometric distribution. (E) Five main types of AS patterns analyzed in the present study. A3, alternative 3′ splice sites; A5, alternative 5′ splice sites; MX, mutually exclusive exons; SE, exon skipping; IR, intron retention. (F) Alterations in AS landscape among three m6A clusters. Shown are splicing patterns and the number of DSEs decoded by rMATS. (G) Number of potential neoantigens generated per tumor in different m6A clusters. (H) Number of CDR3s (upper) and CDR1/2s (bottom) defined by the TRUST4 algorithm in RNA-seq data. All analyses were based on the curated TCGA cohort. Significance was calculated by the Kruskal–Wallis test (C, G, H).
Splicing and immunogenic properties of distinct m6A modification patterns
Splicing dysregulation is a hallmark of cancer (6,66). We have recently demonstrated that the severity of splicing abnormalities correlates with disease progression, and established intron retention (IR) as a hallmark of PCa stemness and aggressiveness (6). We next performed AS analysis between any two of the three m6A clusters (Figure 3E), and defined a total of 261, 215 and 55 DSEs in comparisons of C3 versus C1, C3 versus C2 and C2 versus C1, respectively (Figure 3F). Particularly, more AS events (especially the IR and skipping exon) were found in C3 relative to C1 or C2 (Figure 3F; Supplementary Figure S3H), potentially leading to generation of neoantigens. Using a recently published cancer antigenome across TCGA solid cancers including PCa (62), we found a trend, although not significant (P = 0.06), that the number of neoantigens increased along with tumor progression from C1 to C3 (Figure 3G). Neoantigens are attractive candidates for developing cancer vaccines, but their recognition by the immune system depends on efficient presentation. Due to a lack of global characterization of neoepitopes in TCGA-PRAD samples, we took another computational approach to infer neoantigen load in m6A_Clusters by reconstituting both the B- and T-cell receptor repertoires via a newly developed TRUST4 algorithm (67). To our surprise, the number of complementary-determining region 3 (CDR3) clones decreased from C1 to C3, so as the CDR1 and CDR2 on the V sequence (Figure 3H). This discrepancy between a higher number of potential neoantigens and a lower number of immune receptor repertoires highlighted a defect in the antigen presentation process in C3 tumors. In support, GSVA of four extracted signatures of antigen presentation indicated that they were all gradually decreased from C1 to C3 (Supplementary Figure S3I), in line with the TME analysis presented later.
Different m6A modification patterns characterized by cancer hallmarks and TME
Next, GSVA enrichment analysis was performed against the hallmark gene set in MSigDB to comprehensively dissect the biological properties associated with the three m6A_Clusters. A number of protumorigenic signatures (e.g. MYC targets, DNA repair, E2F targets and G2M checkpoint) were significantly enriched in C2 and C3 (Figure 4A); however, paradoxically, some antitumor pathways (e.g. p53 pathway, apoptosis and reactive oxygen species pathway) were overrepresented in C1, consistent with the overmentioned results that C1 and C3 were the least and most aggressive clusters, respectively. Interestingly, multiple immune-related (e.g. IFNγ response, IL-6, IL-2 and TNF-α signaling) and differentiation/metabolism-related (e.g. estrogen/androgen response, protein secretion and myogenesis) signatures were exclusively enriched in C1 (Figure 4A). To further confirm these findings, we extended our analysis to GSEA of 6290 curated gene sets in MSigDB against comparative transcriptomes of C3 versus C1, and found that pathways related to proliferation, cancer promotion, SCs and RNA metabolism were significantly enriched in C3, whereas pathways related to adhesion, cancer inhibition, differentiation and TME were overrepresented in C1 (Figure 4B). Notably, these results were generally in line with GO analysis of the limited number of DEGs (Figure 3D; Supplementary Figure S3E). AR is obligatory for pri-PCa growth and continues to be expressed and functionally important in CRPC (68). ADT promotes stemness (69) and CRPCs are generally stem-like regardless of AR expression status (3). Also, canonical AR transcriptional activity decreases along with tumor progression (6,9). We next performed a focused GSVA on relevant pathways. As expected, compared to C1, clusters C2 and C3 were more stem-like [evidenced by enrichment of three (2-4) stemness signatures] and proliferative [evidenced by enrichment of four (5-8) proliferation signatures] (Figure 4C). Of note, examination of an AR signature (a panel of 30 genes that were previously reported as defining the pathway) (57) and two well-known AR target genes (KLK3 and FKBP5) clearly demonstrated that AR activity was gradually decreased from C1 to C3 (Figure 4C). Collectively, these data defined C1 as ARhigh and relatively indolent cluster and C2/C3 as ARlow stem-like and highly proliferative clusters.
Due to our frequent observation that the deregulated m6A modification patterns impacted TME (especially the immune category) the most (Figure 4B; Supplementary Figures S1D and S3E), we next focused on the immune landscape. Globally, multiple immune-activating processes (e.g. inflammatory response, IFNγ response, allograft rejection and TNF-α signaling) were exclusively enriched in C1 (Figure 4A and B). Consistently, cancer immunity cycle analysis revealed that C1 displayed prominently higher activity over C2 and C3 in five out of seven immune steps, including infiltration of immune cells into PCa, cancer antigen presentation, trafficking of immune cells and killing of cancer cells (Figure 4D). In support, ESTIMATE quantification of the overall TILs showed that C1 had the highest ImmuneScore (Supplementary Figure S4A). To gain details in cellular composition of TME, we quantified the abundance of 28 TIL subpopulations based on previously established cell type-specific signatures (62). As showed in Figure 4E, 24 out of 28 immune subsets were significantly different in abundance among the three m6A_Clusters. In particular, C1 and C3 had the highest and lowest abundances in 16 and 23 immune subsets, respectively (Figure 4E). For example, C1 and C2 exhibited higher scores for antitumor subsets compared to C3, including activated B and dendritic cells, central memory CD4 T cells, effector memory CD8 T cells, natural killer (NK) cells and NK T cells (Figure 4E). Notably, some immunosuppressive subsets also appeared in high abundance in C1 and C2 (e.g. immature dendritic cells, monocytes, neutrophils, regulatory T cells and type 2 T helper cells), which could be explained by a global increase in TILs in these clusters.
Besides cancer and immune cells, TME also contains surrounding blood vessels, fibroblasts and the ECM (70). We noticed that tumors in C3 cluster had the highest tumor purity followed by C2 and C1 clusters (Figure 4F), implying an opposite proportion of stroma in these clusters. In support, the StromaScore (63) gradually decreased from C1 to C3 (Supplementary Figure S4B), and the stroma activity was high in C1 (followed by C2 and C3), evidenced by elevated enrichment of stroma-related pathways such as epithelial–mesenchymal transition, pan-fibroblast TGFβ response signature, angiogenesis, CAFs and matrix (Figure 4F). We thus defined C1 as a high-fibrotic cluster, whereas the other two as low-fibrotic clusters. Recently, a pan-cancer analysis has categorized >10 000 tumors in TCGA into four TME subtypes (based on a set of 29 knowledge-based functional gene expression signatures): immune-enriched and fibrotic (IE/F), immune-enriched but nonfibrotic (IE), fibrotic (F) and immune-depleted (D) (71). Accordingly, distribution of our m6A_Clusters indicated that the fibrotic (IE/F and F) proportion of tumors classified in C1 (60.8%) was approximately twice as much as that in C2 (31.6%) or C3 (28.4%) (Figure 4G), supporting our GSVA results (Figure 4F). It was worth noting that the DNA repair activity was significantly high in C2 and C3 compared with C1 (Figure 4F), indicative of proliferation and consistent with cancer hallmark analysis (Figure 4A). Importantly, and expectedly, a detailed interrogation of the uncurated TCGA pan-cancer cohort generated similar results. For instance, 19 out of 28 immune subsets were different in their abundance among m6A_Clusters, with a clear decreasing trend from C1 to C3 (Supplementary Figure S4C). Consistently, five out of seven anticancer immune steps were low in activity in C3 relative to C1 (Supplementary Figure S4D). Pathway analysis indicated a more stem-like and proliferative phenotype for C2 and C3 (Supplementary Figure S4E), whereas C1 was more fibrotic (Supplementary Figure S4F).
Construction of m6Avalue based on m6A phenotype-associated genes
Considering the intratumoral heterogeneity in PCa and the conservation of m6A-mediated biology in a given tumor type, and to further dissect the m6A-associated phenotypes, we performed consensus clustering analysis on 407 core DEGs (Supplementary Figure S5A) to optimally classify tumors into three distinct subgroups (Figure 5A), namely m6A_S1 (124 patients), m6A_S2 (148 patients) and m6A_S3 (61 patients), respectively. In line with the m6A_Clusters (Figure 2C), the aggressiveness of m6A_Subgroups increased from S1 to S3, evidenced by gradually elevated GS (Figure 5B), advanced tumor stage (Figure 5C) and worse survival outcome (Figure 5D). Expectedly, most of the m6A regulators were dysregulated among these subgroups (Supplementary Figure S5B), and the patient distribution in m6A_Subgroups was in high concordance with that in m6A_Clusters (especially the S1 and S3 to C1 and C3, correspondingly) (Supplementary Figure S5C). Molecular interrogation of m6A_Subgroups revealed, generally, similar results with what was observed in m6A_Clusters (Figure 4), in terms of cancer hallmarks (Supplementary Figure S5D), stemness/proliferation/stroma-related signatures (Supplementary Figure S5E), cancer immune cycle analysis (Supplementary Figure S5F) and the 28 immune subpopulations (Supplementary Figure S5G). Briefly, compared to S2 and S3, the S1 subgroup was relatively indolent with obvious enrichment of stroma- and immune-related pathways, 22 of 28 TIL subpopulations, higher AR activity and anticancer immunity.
Population-based classifiers cannot directly apply to individual patients for predicting a pattern of m6A methylation landscape. To facilitate a potential clinical use of our PCa classifications, we constructed m6Avalue, a scoring system collectively quantifying the m6A modification patterns based on a weighted 87-gene signature shrank down from the 407 m6A-associated genes. These 87 genes were selected due to their association with clinical patient survival (see the ‘Materials and Methods’ section). Calculation of m6Avalue in m6A_Clusters and m6A_Subgroups showed that it increased along with tumor aggressiveness from C1 to C3 or S1 to S3 (Supplementary Figure S5H), validating our algorithm. Unsurprisingly, m6Avalue separated pri-PCa into two groups, with the m6Avaluehigh (relative to m6Avaluelow) group being more aggressive (Figure 5E). Multivariate Cox regression analysis confirmed that m6Avalue could serve as an independent prognostic biomarker for patient outcomes, among other clinical parameters (Figure 5F). In support, ROC curve further demonstrated the predictive accuracy of m6Avalue (Figure 5G). Besides the curated TCGA cohort, we also validated our m6Avalue model in other two independent datasets, GSE21034 (Figure 5H and I) and GSE116918 (Supplementary Figure S5I and J). In both datasets, m6Avalue could function as an independent prognostic factor, and the m6Avaluehigh (relative to m6Avaluelow) group was correlated with adverse tumor grade and worse prognosis, suggesting the robustness of our m6Avalue model. Importantly, albeit our findings were made on pri-PCa due to the intrinsic data properties, paired comparison indicated that the m6Avalues in CRPC samples (12) were significantly higher than those in pri-PCa samples (Supplementary Figure S5K), further strengthening the idea that m6Avaluehigh tumors are more aggressive (and perhaps treatment resistant).
m6Avalue stratifies PCa with distinct molecular and phenotypic characteristics
To better illustrate the characteristics of m6Avalue, we first performed a global correlation analysis between m6Avalue and a selected set of key signatures/pathways. As shown in Figure 6A, m6Avalue was positively correlated with the activity of stemness, proliferation and DNA repair, while negatively correlated with AR and stroma-centered signatures. Notably, m6Avalue was also negatively correlated with the anticancer immunity and abundance of the majority of 28 immune subpopulations in pri-PCa (Supplementary Figure S6A), establishing again m6Avalue as a predictor of low immunity in TME. Previously, the TCGA landmark paper (11) has categorized pri-PCa into three clusters based on tumor transcriptomes (mRNA clusters 1–3), and reported that, genomically, 74% of pri-PCa belonged to either one of seven subtypes defined by gene fusions (ERG, ETV1/4 and FLI1) or mutations (SPOP, FOXA1 and IDH1). In our analysis, we found that the distribution of these genomic subtypes was similar in the m6Avaluehigh and m6Avaluelow groups (Figure 6B), except that the m6Avaluehigh group contained a bit higher fraction of tumors bearing ETV1 fusion and SPOP mutation. Furthermore, the TCGA mRNA cluster 3 had the lowest m6Avalue (Figure 6C), and consistently had a better prognosis (Supplementary Figure S6B). The somatic CNV (SCNV) is associated with PCa recurrence and metastasis, and pri-PCa have been clustered previously into three clusters (Quiet, Some and More) based on the SCNV burden (11). Interestingly, we found that m6Avalue was positively correlated with SCNV burden (Figure 6D), in line with enhanced genome instability and, simultaneously, DNA repair activity in advanced PCa.
In a recent pan-cancer study (72), all human tumors regardless of origin can be categorized into six immune subtypes (IS1–IS6), and PCa mainly fall into IS1, IS3 and IS4. Notably, the IS1 was characterized by elevated expression of angiogenic genes and high proliferation rate; IS3 by low proliferation and SCNV burden but with high Th17 and Th1 activity; and IS4 by a prominent macrophage signature and a repressed Th1 activity (72). Particularly, IS3 correlated with longer survival time in multiple cancer types, including PCa (72). When we compared the m6Avalue in these immune subtypes, we found that IS3 and IS4 had the lowest and highest m6Avalues (Figure 6E) and, consistently, a better and a worse prognosis, respectively (Supplementary Figure S6C). Interestingly, the difference in m6Avalue among pri-PCa specimens was fibrotic phenotype specific (similar m6Avalue for IE/F and F) rather than immune-enriched phenotype specific (unsimilar m6Avalue for IE/F and IE), with nonfibrotic phenotypes possessing higher m6Avalues (Figure 6F). Accordingly, when we regrouped the pri-PCa into fibrotic (F and IE/F) and nonfibrotic (IE and D) subgroups, we found that the nonfibrotic subgroup was more aggressive, evidenced by the higher GS and tumor stage (Supplementary Figure S6D) and a worse survival outcome (Figure 6G). In support, the m6Avaluehigh group had a high proportion of tumors with nonfibrotic phenotype (79% versus 40.5%; Figure 6H), indicative of fibrotic phenotype as a marker for indolent PCa.
The m6Avalue correlates with therapeutic effects of small-molecule inhibitors
Inspired by the crosstalk between m6Avalue and many vital cancer-related pathways, together with an aim to extend the potential usage of m6Avalue in therapeutic settings, we next explored whether the intrinsic m6Avalue of cancer cells predicts drug response. Utilizing the pan-cancer CCLE database (73), we calculated the m6Avalue for each cell line and identified 12 significant correlations (Figure 7A). Specifically, the IC50 values of six drugs targeting EGFR, ABL, RAF and MEK were positively correlated with m6Avalue (indicating drug resistance), whereas the IC50 values of another six drugs targeting TOP1, HDAC, GS, ALK and CDK4 were negatively correlated with m6Avalue (indicating drug sensitivity) (Figure 7A), pointing potential therapeutic strategies that aggressive PCa might be more sensitive to these drugs. Although the upregulation of EGFR has been observed in, and causally associated with, many cancers (74,75), our data showed that m6Avalue negatively correlated with EGFR expression in pri-PCa (Figure 7B) and, consistently, patient’s tumor with higher expression of EGFR had lower GS and tumor stage (Supplementary Figure S7A) and ultimately a better prognosis (Figure 7C). These results urged a cancer type-specific effect of EGFR expression and thus EGFR inhibitors on tumorigenesis. CDK4 plays an essential role in cell cycle progression and inhibitors of CDK4/6 have been broadly used as an antitumor strategy (76). In pri-PCa, the m6Avalue was significantly and positively correlated with CDK4 expression (Figure 7D). As expected, CDK4 played an oncogenic role in PCa as its higher expression predicted higher GS and tumor stage (Supplementary Figure S7B), and a worse outcome (Figure 7E). To provide proof-of-principle evidence, we experimentally tested the cell growth inhibitory effect of ALK (TAE684) and CDK4 (PD-0332991) inhibitors in well-known indolent LNCaP and aggressive PC3 lines (6), finding that PC3 (versus LNCaP) cells were more sensitive to these targeted therapies (Figure 7F). Interestingly, we observed that TAE684 induced cell aggregation in LNCaP, while cell death in PC3, cells (Figure 7G).
Figure 7.

The m6Avalue predicts responses to both small-molecule inhibitors and immunotherapies. (A) Spearman correlation of m6Avalue with IC50 of different compounds reported in the CCLE database. Pairwise results were filtered by correlation >0.1 or <−0.1 with P < 0.05. Compounds showing positive and negative correlations with m6Avalue were considered as resistant (red) and sensitive (blue) drugs. Pearson correlation of expression of EGFR (B) or CDK4 (D) with m6Avalue in the curated TCGA cohort. The upper and right margins denote the distribution of gene expression and m6Avalue, respectively. Kaplan–Meier analysis showing high levels of EGFR (C) and CDK4 (E) being correlated with a better and a worse patient survival, respectively. (F) Cell viability (MTT) assay in indicated cells treated with TAE684 (top) or PD-0332991 (bottom) for 4 days. Data represent mean ± SD from a representative experiment with four technical repeats and the experiment was replicated two times with similar results. (G) Morphological changes of indicated cells treated with TAE684 for 4 days. Scale bar, 100 μm. The low m6Avalue is associated with a better response to immunotherapies in an anti-CTLA-4 CRPC cohort (H) and three independent melanoma cohorts [GSE78220 (anti-PD-1, I), GSE91061 (anti-PD-L1, J) and GSE100797 (adoptive T-cell therapy, K)]. Shown are survival analysis (left) and the fraction of patients with clinical responses to treatment (right) in low or high m6Avalue groups for each cohort. CR, complete response; PR, partial response; SD, stable disease; PD, progressive disease. Significance for survival analysis and patient fraction distribution were calculated by the long-rank test and chi-square test, respectively.
The m6Avalue predicts immunotherapeutic efficacy
Having established a direct link between the global m6A modification pattern and immune landscape in PCa in our multilayer analyses, we next sought to define whether m6Avalue could predict patients’ responses to immunotherapy. In PCa, datasets with available information of both clinical responses to immunotherapies and survival/gene expression data were scanty. Recently, a clinical trial with anti-CTLA-4 (i.e. ipilimumab) in 30 patients with metastatic CRPC was conducted, with stable disease and progressive disease being defined as beneficial and nonbeneficial responses, respectively (44). When we stratified the small cohort based on m6Avalue, we found that the m6Avaluelow group survived better and had a higher proportion of patients with stable disease (Figure 7H). To further validate our results, we utilized another three melanoma cohorts treated with different ICBs. In two anti-PD-1 datasets (GSE78220 and GSE91061), m6Avalue well separated the cohort into two groups (Supplementary Figure S7C) and patients with lower m6Avalues responded better to immunotherapy and thus survived longer (Figure 7I and J). Comparison of the well-known immunotherapeutic targets (i.e. PD-1, PD-L1 and CTLA-4) showed similar expression patterns, with PD-L1 tending to upregulate in the m6Avaluelow versus m6Avaluehigh group (Supplementary Figure S7D). Examination of another adoptive T-cell therapy cohort (GSE100797) generated similar results (Figure 7K; Supplementary Figure S7E), except that both PD-L1 and CTLA-4 were significantly overexpressed in the m6Avaluelow group (Supplementary Figure S7F). Collectively, our data strongly established m6Avalue as a reliable biomarker predicting immunotherapy response in multiple cancer types.
DISCUSSION
As the most abundant chemical modification present in multiple RNA species (especially mRNA), m6A plays key roles in almost every aspect of RNA metabolism, as well as in a variety of physiological and pathological processes (22). Although there is limited evidence (based on individual gene studies) implicating m6A regulators in PCa biology, study of the m6A pathway in PCa generally lags when compared to other cancer types (e.g. leukemia and breast) (77). Currently, a comprehensive analysis that integrates the full set of recognized m6A regulators that better reflects the m6A methylation patterns in PCa is lacking. In this study, by comprehensively annotating the genomic and transcriptomic alterations of 24 m6A regulators and the repertoire of m6A phenotype-associated genes in pri-PCa, we have made several significant (and PCa-specific) findings (also see discussion in the Supplementary Data). First, m6A regulators constitute a frequently mutated pathway (albeit a very low alteration frequency at individual gene level) at the population level, indicating an involvement of m6A in PCa. Notably, the mutational landscape of m6A regulators fails to stratify PCa dramatically, suggesting mutation in m6A regulators as a nonsignificant mechanism (versus gene expression regulation) driving tumorigenesis. Second, we unveil that many m6A regulators are not only differentially expressed in PCa (versus normal tissues) but also prognostic, highlighting a utility of m6A regulators as prognostic biomarkers. Strikingly, the expression repertoire of 24 regulators elegantly classifies TCGA-PRAD and other three independent cohorts into three clusters with distinct molecular and clinical features. In particular, m6A_C1 and m6A_C3 are, comparatively, the indolent and progressive clusters, respectively. We also demonstrate the superior design of our classification by cross-comparison with previously reported classifications [such as TCGA (11)]. Third, molecular characterization of m6A_Clusters reveals that m6A methylation modification patterns predominantly impact TME, especially the immune landscape. Both the anticancer immunity and abundance of 28 TIL subsets are significantly higher in C1 than in C3, indicating an inflamed TME for C1 tumors. Interestingly, unlike studies in colon cancer showing that previously well-recognized three immune profiles (i.e. immune-inflamed, immune-excluded and immune-desert) distinguish TME (41), our results indicate that fibrotic and nonfibrotic phenotypes, instead, better depict PCa TME. In support, colon tumors with activation of stroma-related signatures were classified as immune-excluded and linked to poor prognosis. However, we find that prostate tumors in m6A_C1 with significant enrichment of these signatures conversely have a better outcome. Fourth, and for the first time, our splicing and immunogenicity analyses of different m6A methylation modification patterns highlight a defect in the antigen presentation process in aggressive PCa, which accounts for the discrepancy between a higher number of potential neoantigens and a lower level of immune recognition in C3 versus C1 clusters. These data imply a therapeutic use of splicing inhibitors and ICB for treating aggressive C3 tumors. This concept has been recently validated in murine cancer models (78). Fifth, a negative correlation of AR activity with m6A activity is noticed, and together with a recent report that AR is not a direct target of METTL3 (79), we propose AR and m6A axis as independent contributors in driving PCa progression. Sixth, m6Avalue, a weighted score established from 87 key m6A-associated genes, well separates indolent pri-PCa from aggressive ones, with the m6Avaluehigh group being more stem-like, proliferative and nonfibrotic. Seventh, the distorted m6A signaling likely contributes to anti-androgen treatment failure and PCa progression via TME reshaping, as CRPCs exhibit globally higher m6Avalues than pri-PCa and, relatively, m6Avaluelow CPRC patients respond better to ICB. These results establish m6Avalue as a valuable guide for decision-making on usage of immunotherapy (especially considering that there are currently no established biomarkers for immunotherapeutic efficacy). Finally, a pan-cancer analysis indicates that m6Avalue can be used to predict sensitivity of small-molecule-based targeted therapy. Accordingly, we hypothesize that aggressive PCa with high m6Avalue might be more vulnerable to inhibitors of CDK4, ALK, TOP1 and others, directing novel therapeutic strategies that warrant further exploration. Future in-depth characterizations of individual m6A regulators, together with the kinetics of cellular m6A levels, in PCa etiology and progression, could enhance our understanding of disease pathogenesis and aid innovative drug development.
DATA AVAILABILITY
As detailed in the ‘Materials and Methods’ section, all data used for main bioinformatic analysis are publicly available.
Supplementary Material
ACKNOWLEDGEMENTS
Authors’ contributions: C.Z. and D.Z. conceived and designed the study, interpreted data and finalized the manuscript. C.Z., M.C. and D.Z. conducted the most bioinformatic analysis. Y.F. and Q.H. provided assistance in cell line drug experiments. All authors read and approved the manuscript.
Contributor Information
Cheng Zou, School of Biomedical Sciences, Hunan University, Changsha 410082, China; College of Animal Science and Veterinary Medicine, Huazhong Agricultural University, Wuhan 430070, China.
Qinju He, School of Biomedical Sciences, Hunan University, Changsha 410082, China.
Yuqing Feng, School of Biomedical Sciences, Hunan University, Changsha 410082, China.
Mengjie Chen, School of Biomedical Sciences, Hunan University, Changsha 410082, China.
Dingxiao Zhang, School of Biomedical Sciences, Hunan University, Changsha 410082, China.
SUPPLEMENTARY DATA
Supplementary Data are available at NAR Cancer Online.
FUNDING
National Natural Science Foundation of China [81972418 to D.Z.]; Wuhan Frontier Science and Technology Program [2019020701011490 to D.Z.]; Excellent Youth Foundation of Hunan Province [2021JJ10028 to D.Z.]; Fundamental Research Funds for the Central Universities [531119200130 to D.Z.].
Conflict of interest statement. None declared.
REFERENCES
- 1. Sung H., Ferlay J., Siegel R.L., Laversanne M., Soerjomataram I., Jemal A., Bray F. Global cancer statistics 2020: GLOBOCAN estimates of incidence and mortality worldwide for 36 cancers in 185 countries. CA Cancer J. Clin. 2021; 71:209–249. [DOI] [PubMed] [Google Scholar]
- 2. Siegel R.L., Miller K.D., Jemal A. Cancer statistics, 2020. CA Cancer J. Clin. 2020; 70:7–30. [DOI] [PubMed] [Google Scholar]
- 3. Zhang D., Park D., Zhong Y., Lu Y., Rycaj K., Gong S., Chen X., Liu X., Chao H.P., Whitney P. et al. Stem cell and neurogenic gene-expression profiles link prostate basal cells to aggressive prostate cancer. Nat. Commun. 2016; 7:10798. [DOI] [PMC free article] [PubMed] [Google Scholar]
- 4. Zhang D., Zhao S., Li X., Kirk J.S., Tang D.G. Prostate luminal progenitor cells in development and cancer. Trends Cancer. 2018; 4:769–783. [DOI] [PMC free article] [PubMed] [Google Scholar]
- 5. Chen X., Rycaj K., Liu X., Tang D.G. New insights into prostate cancer stem cells. Cell Cycle. 2013; 12:579–586. [DOI] [PMC free article] [PubMed] [Google Scholar]
- 6. Zhang D., Hu Q., Liu X., Ji Y., Chao H.P., Liu Y., Tracz A., Kirk J., Buonamici S., Zhu P. et al. Intron retention is a hallmark and spliceosome represents a therapeutic vulnerability in aggressive prostate cancer. Nat. Commun. 2020; 11:2089. [DOI] [PMC free article] [PubMed] [Google Scholar]
- 7. Karantanos T., Corn P.G., Thompson T.C. Prostate cancer progression after androgen deprivation therapy: mechanisms of castrate resistance and novel therapeutic approaches. Oncogene. 2013; 32:5501–5511. [DOI] [PMC free article] [PubMed] [Google Scholar]
- 8. Zhang D., Tang D.G., Rycaj K. Cancer stem cells: regulation programs, immunological properties and immunotherapy. Semin. Cancer Biol. 2018; 52:94–106. [DOI] [PMC free article] [PubMed] [Google Scholar]
- 9. Li Q., Deng Q., Chao H.P., Liu X., Lu Y., Lin K., Liu B., Tang G.W., Zhang D., Tracz A. et al. Linking prostate cancer cell AR heterogeneity to distinct castration and enzalutamide responses. Nat. Commun. 2018; 9:3600. [DOI] [PMC free article] [PubMed] [Google Scholar]
- 10. Watson P.A., Arora V.K., Sawyers C.L. Emerging mechanisms of resistance to androgen receptor inhibitors in prostate cancer. Nat. Rev. Cancer. 2015; 15:701–711. [DOI] [PMC free article] [PubMed] [Google Scholar]
- 11. Cancer Genome Atlas Research Network The molecular taxonomy of primary prostate cancer. Cell. 2015; 163:1011–1025. [DOI] [PMC free article] [PubMed] [Google Scholar]
- 12. Robinson D., Van Allen E.M., Wu Y.M., Schultz N., Lonigro R.J., Mosquera J.M., Montgomery B., Taplin M.E., Pritchard C.C., Attard G. et al. Integrative clinical genomics of advanced prostate cancer. Cell. 2015; 161:1215–1228. [DOI] [PMC free article] [PubMed] [Google Scholar]
- 13. Liu C., Liu R., Zhang D., Deng Q., Liu B., Chao H.P., Rycaj K., Takata Y., Lin K., Lu Y. et al. MicroRNA-141 suppresses prostate cancer stem cells and metastasis by targeting a cohort of pro-metastasis genes. Nat. Commun. 2017; 8:14270. [DOI] [PMC free article] [PubMed] [Google Scholar]
- 14. Wedge D.C., Gundem G., Mitchell T., Woodcock D.J., Martincorena I., Ghori M., Zamora J., Butler A., Whitaker H., Kote-Jarai Z. et al. Sequencing of prostate cancers identifies new cancer genes, routes of progression and drug targets. Nat. Genet. 2018; 50:682–692. [DOI] [PMC free article] [PubMed] [Google Scholar]
- 15. Zhang Y., Pitchiaya S., Cieslik M., Niknafs Y.S., Tien J.C., Hosono Y., Iyer M.K., Yazdani S., Subramaniam S., Shukla S.K. et al. Analysis of the androgen receptor-regulated lncRNA landscape identifies a role for ARLNC1 in prostate cancer progression. Nat. Genet. 2018; 50:814–824. [DOI] [PMC free article] [PubMed] [Google Scholar]
- 16. Abida W., Cyrta J., Heller G., Prandi D., Armenia J., Coleman I., Cieslik M., Benelli M., Robinson D., Van Allen E.M. et al. Genomic correlates of clinical outcome in advanced prostate cancer. Proc. Natl Acad. Sci. U.S.A. 2019; 116:11428–11436. [DOI] [PMC free article] [PubMed] [Google Scholar]
- 17. Zhao S.G., Chen W.S., Li H., Foye A., Zhang M., Sjostrom M., Aggarwal R., Playdle D., Liao A., Alumkal J.J. et al. The DNA methylation landscape of advanced prostate cancer. Nat. Genet. 2020; 52:778–789. [DOI] [PMC free article] [PubMed] [Google Scholar]
- 18. Litwin M.S., Tan H.J. The diagnosis and treatment of prostate cancer: a review. JAMA. 2017; 317:2532–2542. [DOI] [PubMed] [Google Scholar]
- 19. Irshad S., Bansal M., Castillo-Martin M., Zheng T., Aytes A., Wenske S., Le Magnen C., Guarnieri P., Sumazin P., Benson M.C. et al. A molecular signature predictive of indolent prostate cancer. Sci. Transl. Med. 2013; 5:202ra122. [DOI] [PMC free article] [PubMed] [Google Scholar]
- 20. Zhao B.S., Roundtree I.A., He C. Post-transcriptional gene regulation by mRNA modifications. Nat. Rev. Mol. Cell Biol. 2017; 18:31–42. [DOI] [PMC free article] [PubMed] [Google Scholar]
- 21. Chen X.Y., Zhang J., Zhu J.S. The role of m6A RNA methylation in human cancer. Mol. Cancer. 2019; 18:103. [DOI] [PMC free article] [PubMed] [Google Scholar]
- 22. Yang Y., Hsu P.J., Chen Y.S., Yang Y.G. Dynamic transcriptomic m6A decoration: writers, erasers, readers and functions in RNA metabolism. Cell Res. 2018; 28:616–624. [DOI] [PMC free article] [PubMed] [Google Scholar]
- 23. Shi H., Wei J., He C. Where, when, and how: context-dependent functions of RNA methylation writers, readers, and erasers. Mol. Cell. 2019; 74:640–650. [DOI] [PMC free article] [PubMed] [Google Scholar]
- 24. Cai J., Yang F., Zhan H., Situ J., Li W., Mao Y., Luo Y. RNA m6A methyltransferase METTL3 promotes the growth of prostate cancer by regulating hedgehog pathways. Onco Targets Ther. 2019; 12:9143–9152. [DOI] [PMC free article] [PubMed] [Google Scholar]
- 25. Yuan Y., Du Y., Wang L., Liu X. The M6A methyltransferase METTL3 promotes the development and progression of prostate carcinoma via mediating MYC methylation. J. Cancer. 2020; 11:3588–3595. [DOI] [PMC free article] [PubMed] [Google Scholar]
- 26. Chen Y., Pan C., Wang X., Xu D., Ma Y., Hu J., Chen P., Xiang Z., Rao Q., Han X. Silencing of METTL3 effectively hinders invasion and metastasis of prostate cancer cells. Theranostics. 2021; 11:7640–7657. [DOI] [PMC free article] [PubMed] [Google Scholar]
- 27. Li J., Xie H., Ying Y., Chen H., Yan H., He L., Xu M., Xu X., Liang Z., Liu B. et al. YTHDF2 mediates the mRNA degradation of the tumor suppressors to induce AKT phosphorylation in N6-methyladenosine-dependent way in prostate cancer. Mol. Cancer. 2020; 19:152. [DOI] [PMC free article] [PubMed] [Google Scholar]
- 28. Gao Y., Vasic R., Song Y., Teng R., Liu C., Gbyli R., Biancon G., Nelakanti R., Lobben K., Kudo E. et al. m6A modification prevents formation of endogenous double-stranded RNAs and deleterious innate immune responses during hematopoietic development. Immunity. 2020; 52:1007–1021. [DOI] [PMC free article] [PubMed] [Google Scholar]
- 29. Han X., Wang M., Zhao Y.L., Yang Y., Yang Y.G. RNA methylations in human cancers. Semin. Cancer Biol. 2021; 75:97–115. [DOI] [PubMed] [Google Scholar]
- 30. Shulman Z., Stern-Ginossar N. The RNA modification N6-methyladenosine as a novel regulator of the immune system. Nat. Immunol. 2020; 21:501–512. [DOI] [PubMed] [Google Scholar]
- 31. Chen H., Yao J., Bao R., Dong Y., Zhang T., Du Y., Wang G., Ni D., Xun Z., Niu X. et al. Cross-talk of four types of RNA modification writers defines tumor microenvironment and pharmacogenomic landscape in colorectal cancer. Mol. Cancer. 2021; 20:29. [DOI] [PMC free article] [PubMed] [Google Scholar]
- 32. Han D., Liu J., Chen C., Dong L., Liu Y., Chang R., Huang X., Liu Y., Wang J., Dougherty U. et al. Anti-tumour immunity controlled through mRNA m6A methylation and YTHDF1 in dendritic cells. Nature. 2019; 566:270–274. [DOI] [PMC free article] [PubMed] [Google Scholar]
- 33. Yang S., Wei J., Cui Y.H., Park G., Shah P., Deng Y., Aplin A.E., Lu Z., Hwang S., He C. et al. m6A mRNA demethylase FTO regulates melanoma tumorigenicity and response to anti-PD-1 blockade. Nat. Commun. 2019; 10:2782. [DOI] [PMC free article] [PubMed] [Google Scholar]
- 34. Wang L., Hui H., Agrawal K., Kang Y., Li N., Tang R., Yuan J., Rana T.M. m6A RNA methyltransferases METTL3/14 regulate immune responses to anti-PD-1 therapy. EMBO J. 2020; 39:e104514. [DOI] [PMC free article] [PubMed] [Google Scholar]
- 35. Yin H., Zhang X., Yang P., Zhang X., Peng Y., Li D., Yu Y., Wu Y., Wang Y., Zhang J. et al. RNA m6A methylation orchestrates cancer growth and metastasis via macrophage reprogramming. Nat. Commun. 2021; 12:1394. [DOI] [PMC free article] [PubMed] [Google Scholar]
- 36. Bilusic M., Madan R.A., Gulley J.L. Immunotherapy of prostate cancer: facts and hopes. Clin. Cancer Res. 2017; 23:6764–6770. [DOI] [PMC free article] [PubMed] [Google Scholar]
- 37. Claps M., Mennitto A., Guadalupi V., Sepe P., Stellato M., Zattarin E., Gillessen S.S., Sternberg C.N., Berruti A., De Braud F.G.M. et al. Immune-checkpoint inhibitors and metastatic prostate cancer therapy: learning by making mistakes. Cancer Treat. Rev. 2020; 88:102057. [DOI] [PubMed] [Google Scholar]
- 38. Lu X., Horner J.W., Paul E., Shang X., Troncoso P., Deng P., Jiang S., Chang Q., Spring D.J., Sharma P. et al. Effective combinatorial immunotherapy for castration-resistant prostate cancer. Nature. 2017; 543:728–732. [DOI] [PMC free article] [PubMed] [Google Scholar]
- 39. Morel K.L., Sheahan A.V., Burkhart D.L., Baca S.C., Boufaied N., Liu Y., Qiu X., Canadas I., Roehle K., Heckler M. et al. EZH2 inhibition activates a dsRNA–STING–interferon stress axis that potentiates response to PD-1 checkpoint blockade in prostate cancer. Nat. Cancer. 2021; 2:444–456. [DOI] [PMC free article] [PubMed] [Google Scholar]
- 40. Zhang B., Wu Q., Li B., Wang D., Wang L., Zhou Y.L. m6A regulator-mediated methylation modification patterns and tumor microenvironment infiltration characterization in gastric cancer. Mol. Cancer. 2020; 19:53. [DOI] [PMC free article] [PubMed] [Google Scholar]
- 41. Chong W., Shang L., Liu J., Fang Z., Du F., Wu H., Liu Y., Wang Z., Chen Y., Jia S. et al. m6A regulator-based methylation modification patterns characterized by distinct tumor microenvironment immune profiles in colon cancer. Theranostics. 2021; 11:2201–2217. [DOI] [PMC free article] [PubMed] [Google Scholar]
- 42. Taylor B.S., Schultz N., Hieronymus H., Gopalan A., Xiao Y., Carver B.S., Arora V.K., Kaushik P., Cerami E., Reva B. et al. Integrative genomic profiling of human prostate cancer. Cancer Cell. 2010; 18:11–22. [DOI] [PMC free article] [PubMed] [Google Scholar]
- 43. Jain S., Lyons C.A., Walker S.M., McQuaid S., Hynes S.O., Mitchell D.M., Pang B., Logan G.E., McCavigan A.M., O’Rourke D. et al. Validation of a metastatic assay using biopsies to improve risk stratification in patients with prostate cancer treated with radical radiation therapy. Ann. Oncol. 2018; 29:215–222. [DOI] [PMC free article] [PubMed] [Google Scholar]
- 44. Subudhi S.K., Vence L., Zhao H., Blando J., Yadav S.S., Xiong Q., Reuben A., Aparicio A., Corn P.G., Chapin B.F. et al. Neoantigen responses, immune correlates, and favorable outcomes after ipilimumab treatment of patients with prostate cancer. Sci. Transl. Med. 2020; 12:eaaz3577. [DOI] [PubMed] [Google Scholar]
- 45. Hugo W., Zaretsky J.M., Sun L., Song C., Moreno B.H., Hu-Lieskovan S., Berent-Maoz B., Pang J., Chmielowski B., Cherry G. et al. Genomic and transcriptomic features of response to anti-PD-1 therapy in metastatic melanoma. Cell. 2016; 165:35–44. [DOI] [PMC free article] [PubMed] [Google Scholar]
- 46. Riaz N., Havel J.J., Makarov V., Desrichard A., Urba W.J., Sims J.S., Hodi F.S., Martin-Algarra S., Mandal R., Sharfman W.H. et al. Tumor and microenvironment evolution during immunotherapy with nivolumab. Cell. 2017; 171:934–949. [DOI] [PMC free article] [PubMed] [Google Scholar]
- 47. Lauss M., Donia M., Harbst K., Andersen R., Mitra S., Rosengren F., Salim M., Vallon-Christersson J., Torngren T., Kvist A. et al. Mutational and putative neoantigen load predict clinical benefit of adoptive T cell therapy in melanoma. Nat. Commun. 2017; 8:1738. [DOI] [PMC free article] [PubMed] [Google Scholar]
- 48. Colaprico A., Silva T.C., Olsen C., Garofano L., Cava C., Garolini D., Sabedot T.S., Malta T.M., Pagnotta S.M., Castiglioni I. et al. TCGAbiolinks: an R/Bioconductor package for integrative analysis of TCGA data. Nucleic Acids Res. 2016; 44:e71. [DOI] [PMC free article] [PubMed] [Google Scholar]
- 49. Davis S., Meltzer P.S. GEOquery: a bridge between the Gene Expression Omnibus (GEO) and BioConductor. Bioinformatics. 2007; 23:1846–1847. [DOI] [PubMed] [Google Scholar]
- 50. Ellrott K., Bailey M.H., Saksena G., Covington K.R., Kandoth C., Stewart C., Hess J., Ma S., Chiotti K.E., McLellan M. et al. Scalable open science approach for mutation calling of tumor exomes using multiple genomic pipelines. Cell Syst. 2018; 6:271–281. [DOI] [PMC free article] [PubMed] [Google Scholar]
- 51. Gao J., Aksoy B.A., Dogrusoz U., Dresdner G., Gross B., Sumer S.O., Sun Y., Jacobsen A., Sinha R., Larsson E. et al. Integrative analysis of complex cancer genomics and clinical profiles using the cBioPortal. Sci. Signal. 2013; 6:pl1. [DOI] [PMC free article] [PubMed] [Google Scholar]
- 52. Love M.I., Huber W., Anders S. Moderated estimation of fold change and dispersion for RNA-seq data with DESeq2. Genome Biol. 2014; 15:550. [DOI] [PMC free article] [PubMed] [Google Scholar]
- 53. Dobin A., Davis C.A., Schlesinger F., Drenkow J., Zaleski C., Jha S., Batut P., Chaisson M., Gingeras T.R. STAR: ultrafast universal RNA-seq aligner. Bioinformatics. 2013; 29:15–21. [DOI] [PMC free article] [PubMed] [Google Scholar]
- 54. Shen S., Park J.W., Lu Z.X., Lin L., Henry M.D., Wu Y.N., Zhou Q., Xing Y. rMATS: robust and flexible detection of differential alternative splicing from replicate RNA-seq data. Proc. Natl Acad. Sci. U.S.A. 2014; 111:E5593–E5601. [DOI] [PMC free article] [PubMed] [Google Scholar]
- 55. Deng S., Zhang H., Zhu K., Li X., Ye Y., Li R., Liu X., Lin D., Zuo Z., Zheng J. M6A2Target: a comprehensive database for targets of m6A writers, erasers and readers. Brief. Bioinform. 2021; 22:bbaa055. [DOI] [PubMed] [Google Scholar]
- 56. Hanzelmann S., Castelo R., Guinney J. GSVA: gene set variation analysis for microarray and RNA-seq data. BMC Bioinformatics. 2013; 14:7. [DOI] [PMC free article] [PubMed] [Google Scholar]
- 57. Beltran H., Prandi D., Mosquera J.M., Benelli M., Puca L., Cyrta J., Marotz C., Giannopoulou E., Chakravarthi B.V., Varambally S. et al. Divergent clonal evolution of castration-resistant neuroendocrine prostate cancer. Nat. Med. 2016; 22:298–305. [DOI] [PMC free article] [PubMed] [Google Scholar]
- 58. Miranda A., Hamilton P.T., Zhang A.W., Pattnaik S., Becht E., Mezheyeuski A., Bruun J., Micke P., de Reynies A., Nelson B.H. Cancer stemness, intratumoral heterogeneity, and immune response across cancers. Proc. Natl Acad. Sci. U.S.A. 2019; 116:9020–9029. [DOI] [PMC free article] [PubMed] [Google Scholar]
- 59. Subramanian A., Tamayo P., Mootha V.K., Mukherjee S., Ebert B.L., Gillette M.A., Paulovich A., Pomeroy S.L., Golub T.R., Lander E.S. et al. Gene set enrichment analysis: a knowledge-based approach for interpreting genome-wide expression profiles. Proc. Natl Acad. Sci. U.S.A. 2005; 102:15545–15550. [DOI] [PMC free article] [PubMed] [Google Scholar]
- 60. Wilkerson M.D., Hayes D.N. ConsensusClusterPlus: a class discovery tool with confidence assessments and item tracking. Bioinformatics. 2010; 26:1572–1573. [DOI] [PMC free article] [PubMed] [Google Scholar]
- 61. Xu L., Deng C., Pang B., Zhang X., Liu W., Liao G., Yuan H., Cheng P., Li F., Long Z. et al. TIP: a web server for resolving tumor immunophenotype profiling. Cancer Res. 2018; 78:6575–6580. [DOI] [PubMed] [Google Scholar]
- 62. Charoentong P., Finotello F., Angelova M., Mayer C., Efremova M., Rieder D., Hackl H., Trajanoski Z. Pan-cancer immunogenomic analyses reveal genotype–immunophenotype relationships and predictors of response to checkpoint blockade. Cell Rep. 2017; 18:248–262. [DOI] [PubMed] [Google Scholar]
- 63. Yoshihara K., Shahmoradgoli M., Martinez E., Vegesna R., Kim H., Torres-Garcia W., Trevino V., Shen H., Laird P.W., Levine D.A. et al. Inferring tumour purity and stromal and immune cell admixture from expression data. Nat. Commun. 2013; 4:2612. [DOI] [PMC free article] [PubMed] [Google Scholar]
- 64. Group P.T.C., Calabrese C., Davidson N.R., Demircioglu D., Fonseca N.A., He Y., Kahles A., Lehmann K.V., Liu F., Shiraishi Y. et al. Genomic basis for RNA alterations in cancer. Nature. 2020; 578:129–136. [DOI] [PMC free article] [PubMed] [Google Scholar]
- 65. Li H., Hu J., Yu A., Othmane B., Guo T., Liu J., Cheng C., Chen J., Zu X. RNA modification of N6-methyladenosine predicts immune phenotypes and therapeutic opportunities in kidney renal clear cell carcinoma. Front. Oncol. 2021; 11:642159. [DOI] [PMC free article] [PubMed] [Google Scholar]
- 66. Kahles A., Lehmann K.V., Toussaint N.C., Huser M., Stark S.G., Sachsenberg T., Stegle O., Kohlbacher O., Sander C.Cancer Genome Atlas Research Network et al. Comprehensive analysis of alternative splicing across tumors from 8,705 patients. Cancer Cell. 2018; 34:211–224. [DOI] [PMC free article] [PubMed] [Google Scholar]
- 67. Song L., Cohen D., Ouyang Z., Cao Y., Hu X., Liu X.S. TRUST4: immune repertoire reconstruction from bulk and single-cell RNA-seq data. Nat. Methods. 2021; 18:627–630. [DOI] [PMC free article] [PubMed] [Google Scholar]
- 68. Kumar A., Coleman I., Morrissey C., Zhang X., True L.D., Gulati R., Etzioni R., Bolouri H., Montgomery B., White T. et al. Substantial interindividual and limited intraindividual genomic diversity among tumors from men with metastatic prostate cancer. Nat. Med. 2016; 22:369–378. [DOI] [PMC free article] [PubMed] [Google Scholar]
- 69. Schroeder A., Herrmann A., Cherryholmes G., Kowolik C., Buettner R., Pal S., Yu H., Muller-Newen G., Jove R. Loss of androgen receptor expression promotes a stem-like cell phenotype in prostate cancer through STAT3 signaling. Cancer Res. 2014; 74:1227–1237. [DOI] [PMC free article] [PubMed] [Google Scholar]
- 70. Hinshaw D.C., Shevde L.A. The tumor microenvironment innately modulates cancer progression. Cancer Res. 2019; 79:4557–4566. [DOI] [PMC free article] [PubMed] [Google Scholar]
- 71. Bagaev A., Kotlov N., Nomie K., Svekolkin V., Gafurov A., Isaeva O., Osokin N., Kozlov I., Frenkel F., Gancharova O. et al. Conserved pan-cancer microenvironment subtypes predict response to immunotherapy. Cancer Cell. 2021; 39:845–865. [DOI] [PubMed] [Google Scholar]
- 72. Thorsson V., Gibbs D.L., Brown S.D., Wolf D., Bortone D.S., Ou Yang T.H., Porta-Pardo E., Gao G.F., Plaisier C.L., Eddy J.A. et al. The immune landscape of cancer. Immunity. 2018; 48:812–830. [DOI] [PMC free article] [PubMed] [Google Scholar]
- 73. Barretina J., Caponigro G., Stransky N., Venkatesan K., Margolin A.A., Kim S., Wilson C.J., Lehar J., Kryukov G.V., Sonkin D. et al. The Cancer Cell Line Encyclopedia enables predictive modelling of anticancer drug sensitivity. Nature. 2012; 483:603–607. [DOI] [PMC free article] [PubMed] [Google Scholar]
- 74. Lin S.R., Wen Y.C., Yeh H.L., Jiang K.C., Chen W.H., Mokgautsi N., Huang J., Chen W.Y., Liu Y.N. EGFR-upregulated LIFR promotes SUCLG2-dependent castration resistance and neuroendocrine differentiation of prostate cancer. Oncogene. 2020; 39:6757–6775. [DOI] [PubMed] [Google Scholar]
- 75. Sun T., Aceto N., Meerbrey K.L., Kessler J.D., Zhou C., Migliaccio I., Nguyen D.X., Pavlova N.N., Botero M., Huang J. et al. Activation of multiple proto-oncogenic tyrosine kinases in breast cancer via loss of the PTPN12 phosphatase. Cell. 2011; 144:703–718. [DOI] [PMC free article] [PubMed] [Google Scholar]
- 76. Suski J.M., Braun M., Strmiska V., Sicinski P. Targeting cell-cycle machinery in cancer. Cancer Cell. 2021; 39:759–778. [DOI] [PMC free article] [PubMed] [Google Scholar]
- 77. He L., Li H., Wu A., Peng Y., Shu G., Yin G. Functions of N6-methyladenosine and its role in cancer. Mol. Cancer. 2019; 18:176. [DOI] [PMC free article] [PubMed] [Google Scholar]
- 78. Lu S.X., De Neef E., Thomas J.D., Sabio E., Rousseau B., Gigoux M., Knorr D.A., Greenbaum B., Elhanati Y., Hogg S.J. et al. Pharmacologic modulation of RNA splicing enhances anti-tumor immunity. Cell. 2021; 184:4032–4047. [DOI] [PMC free article] [PubMed] [Google Scholar]
- 79. Cotter K.A., Gallon J., Uebersax N., Rubin P., Meyer K.D., Piscuoglio S., Jaffrey S.R., Rubin M.A. Mapping of m6A and its regulatory targets in prostate cancer reveals a METTL3-low induction of therapy resistance. Mol. Cancer Res. 2021; 19:1398–1411. [DOI] [PMC free article] [PubMed] [Google Scholar]
Associated Data
This section collects any data citations, data availability statements, or supplementary materials included in this article.
Supplementary Materials
Data Availability Statement
As detailed in the ‘Materials and Methods’ section, all data used for main bioinformatic analysis are publicly available.