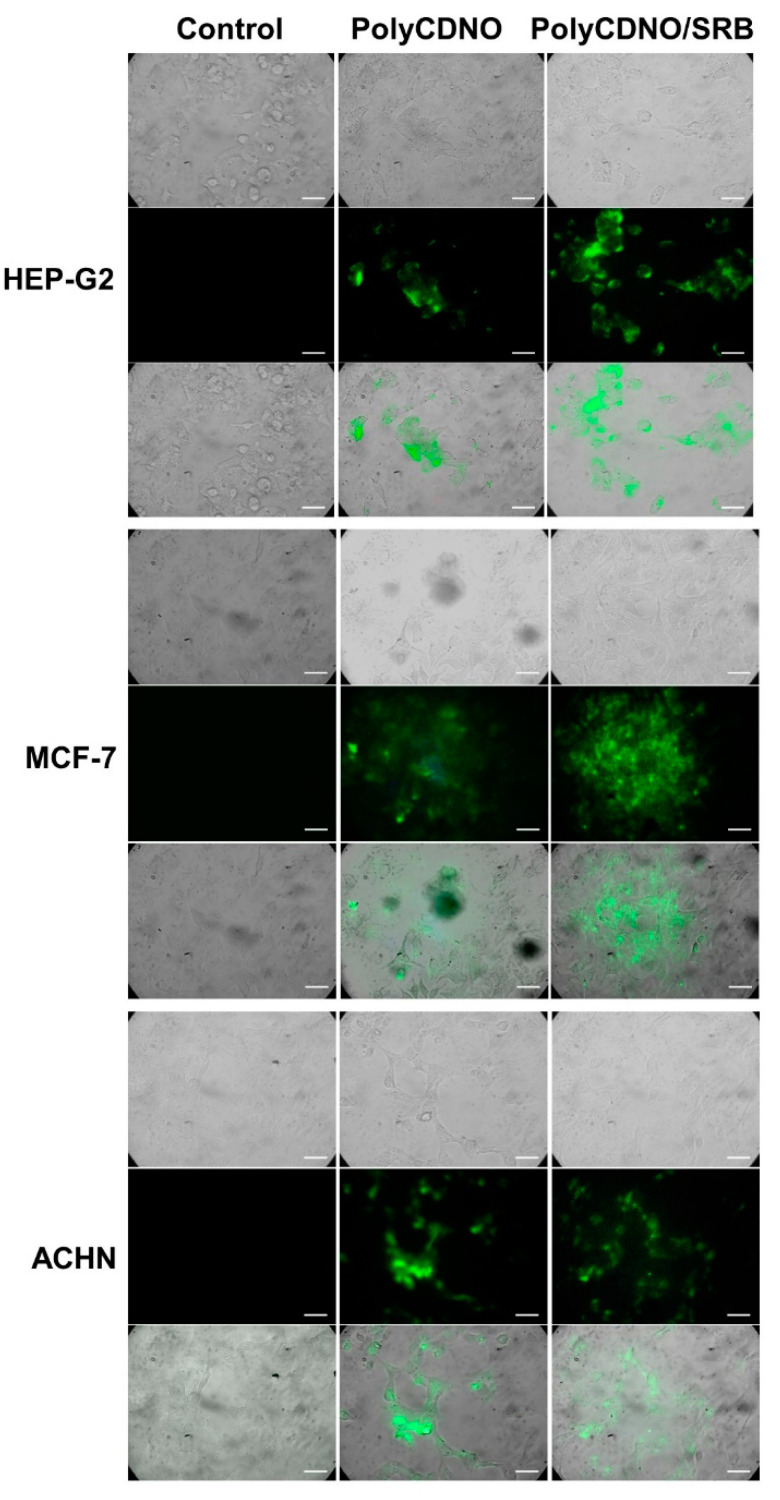
Figure 5.
Representative transmission microscopy images (upper panels), fluorescence microscopy images collected in the range 500–580 nm and observed upon excitation at λexc = 488 nm (central panels) and merged images (lower panels) of different cancer cells incubated for 4 h under different conditions. PolyCDNO (1 mg mL−1 SRB (1.5 µg mL−1). Scale bar = 50 µm.

