Abstract
Muscle stem cells (MuSCs) experience age-associated declines in number and function, accompanied by mitochondrial electron transport chain (ETC) dysfunction and increased reactive oxygen species (ROS). The source of these changes, and how MuSCs respond to mitochondrial dysfunction, is unknown. We report here that in response to mitochondrial ROS, murine MuSCs directly fuse with neighboring myofibers; this phenomenon removes ETC-dysfunctional MuSCs from the stem cell compartment. MuSC-myofiber fusion is dependent on the induction of Scinderin, which promotes formation of actin-dependent protrusions required for membrane fusion. During aging, we find that the declining MuSC population accumulates mutations in the mitochondrial genome, but selects against dysfunctional variants. In the absence of clearance by Scinderin, the decline in MuSC numbers during aging is repressed; however, ETC-dysfunctional MuSCs are retained and can regenerate dysfunctional myofibers. We propose a model in which ETC-dysfunctional MuSCs are removed from the stem cell compartment by fusing with differentiated tissue.
Introduction
Mitochondrial electron transport chain (ETC) dysfunction impacts the human population in multiple manners: Germline mutations in the mitochondrial and nuclear genome are estimated to affect as many as 1:5000 individuals1, and accumulating ETC dysfunction is also observed as a secondary component of many common diseases, including aging itself2-4. Examining the mechanistic consequences of ETC dysfunction in various differentiated tissues has therefore been important to understanding disease physiology and progression. In contrast, our current knowledge of the consequences of ETC dysfunction in stem cell compartments has been understudied, despite the regenerative potential of these cells. In hematopoietic stem cells, depletion of complex III or mitochondrial DNA (mtDNA) results in impaired differentiation and anemia, as well as stem cell exhaustion5,6. However, despite numerous studies of metabolic changes in various stem cell types, a direct analysis of the consequences of ETC dysfunction is largely missing, including in muscle stem cells (MuSCs). MuSCs are largely quiescent and nonproliferative during adult life. In response to injury, quiescent MuSCs undergo rapid activation and proliferation, followed by cell fusion to regenerate new myofibers. Activated MuSCs exhibit altered metabolism to drive differentiation and have an high capacity to expand their mitochondrial population during formation of a new myofiber7,8. Whether there are unique mechanisms to maintain ETC functionality in MuSCs is currently unclear.
We report here that MuSCs are sensitive to ETC dysfunction associated with oxidative stress. We propose a model in which in response to elevated superoxide levels, MuSCs undergo a unique fate to be rapidly removed from muscular tissue, which is mediated by direct fusion of quiescent stem cells with pre-existing myofibers. In this manner, ETC-dysfunctional MuSCs are deleted from the stem cell population, and are thereby precluded from regenerating dysfunctional tissue. We identify that the MuSC-myofiber fusion event is downstream of reactive oxygen species generation, and is dependent on the induced expression of an actin-network reorganizing protein, Scinderin. In the absence of Scinderin-mediated fusion, ETC-dysfunctional MuSCs remain and are competent to regenerate dysfunctional tissue. Thus, muscle stem cells retain a unique mechanism governing their response to ETC-deficiency.
Results
Complex IV inhibition depletes MuSCs by MuSC-myofiber fusion
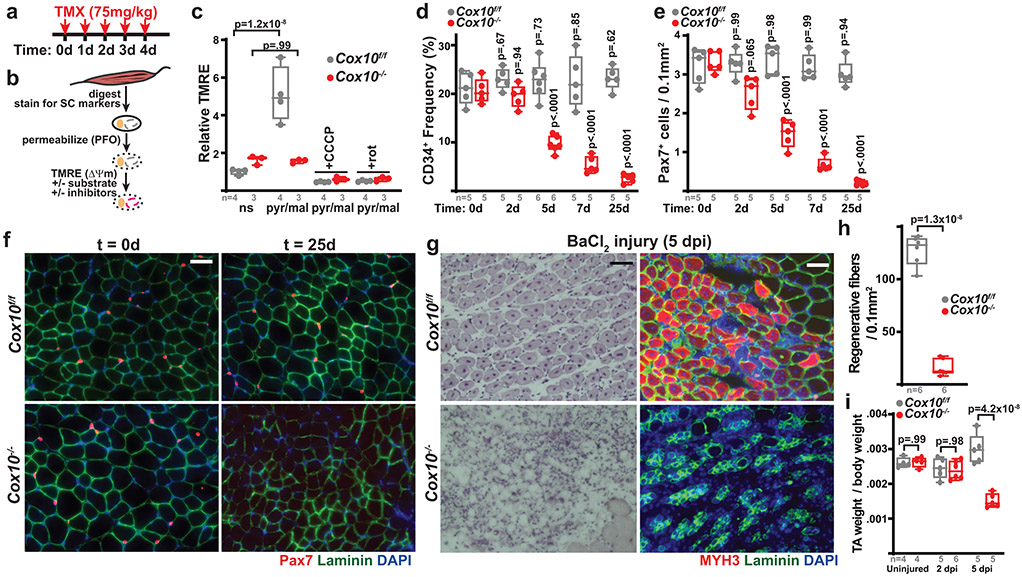
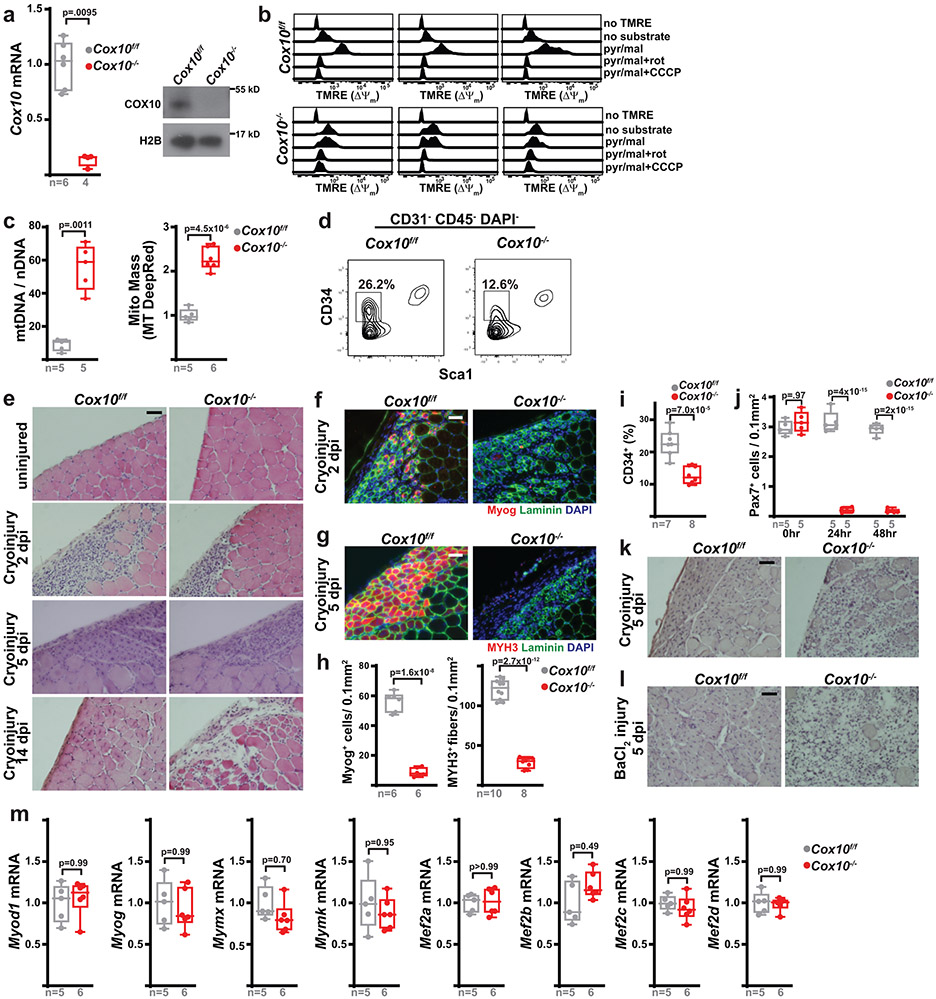
We examined the consequences of ETC dysfunction using genetic models in which complex IV activity was conditionally depleted in adult murine MuSCs. Using the Pax7-CreERT2(FAN) driver (which induces tamoxifen-dependent recombination in satellite cells, a subset of MuSCs critical for muscle regeneration9-11) and a floxed Cox10 (an accessory subunit of mitochondrial complex IV) allele (cox10f) 12,13, we depleted Cox10 transcript and protein levels in adult MuSCs using a 5-day tamoxifen administration (Fig. 1a, Extended Data Fig. 1a). To assess if ETC function was impaired in our experimental model, we implemented an in vitro FACS-based assay amenable to rare cell populations (Fig. 1b): Acutely isolated MuSCs were permeabilized and incubated with or without mitochondrial substrates in the presence of TMRE (Tetramethylrhodamine ethyl ester; whose fluorescence is a measure of mitochondrial membrane potential (ΔΨm)). In MuSCs from tamoxifen-treated control mice (Cox10f/f; no Pax7-Cre driver; hereafter, ‘Cox10f/f’), mitochondrial substrates stimulated TMRE fluorescence, which was blocked by ETC inhibitors (e.g., rotenone) or uncouplers (CCCP), indicating the presence of a functional ETC (Fig. 1c, Extended Data Fig. 1b). In contrast, Cox10−/− MuSCs (from tamoxifen-treated Pax7-CreERT2(FAN); Cox10f/f mice; hereafter, ‘Cox10−/−’) exhibited impaired stimulation of mitochondrial membrane potential, indicating significant ETC dysfunction in this stem cell compartment (Fig. 1c, Extended Data Fig. 1b). In addition, Cox10−/− MuSCs exhibited significant increases in mitochondrial mass, consistent with ETC dysfunction (Extended Data Fig. 1c).
Fig. 1: Complex IV dysfunction induces rapid MuSC depletion in vivo.
a, Schematic for tamoxifen (TMX) administration protocol to induce recombination in adult MuSCs. b, FACS-based assay for ETC function: Isolated MuSCs are permeabilized with perfringolysin O (PFO), followed by TMRE staining in the presence or absence of mitochondrial substrates and inhibitors. c, Mean TMRE fluorescence of wild-type (Cox10f/f) and Cox10−/− MuSCs, in response to indicated substrates and inhibitors. ns, no substrate; pyr/mal, pyruvate/malate; rot, rotenone. d, MuSC frequency at indicated timepoints after the 1st dose of tamoxifen in mice with Cox10f/f or Cox10−/− MuSCs. p-values reflect comparisons with t=0 day data for each genotype. e, Pax7+ cell numbers (normalized to muscle area) at different times post the 1st dose of tamoxifen. p-values reflect comparisons with t=0 day data for each genotype. f, Representative images of endogenous Pax7+ cells (red), Laminin (green) and DAPI (blue) from tibialis anterior (TA) cross-sections of indicated mice at different times post-tamoxifen administration. Scale bar, 50 μm. g, Histology (H&E staining) and immunofluorescence images of TA cross-sections at 5 days post-BaCl2 injury (dpi). Regenerative myofibers can be identified by their centrally localized nuclei and MYH3-positive staining at this timepoint. Scale bar, 50 μm. h, Quantitation of regenerative (central nuclei) myofibers (normalized to muscle area) in TA muscles at 5 days post-BaCl2 injury. i, TA weight (normalized to body weight) at various time points after BaCl2 injury. dpi, days post-injury. Statistical significance was assessed using two-way ANOVA (c,d,e,i), or two-tailed t-test (h), tests with adjustments for multiple comparisons. Box plots indicate median values and interquartile ranges; whiskers are plotted using the Tukey method. The number of biological replicates in each group and p-values are indicated in the figure. Experiments were repeated 5 times in panel f, and 6 times in panel g; both with similar results.
Deletion of Cox10 by tamoxifen administration induced a progressive decrease in MuSC numbers, based on the frequency of CD34+CD31−CD45−Sca1− cells by flow cytometry, or staining of endogenous Pax7 in tissue sections (Fig. 1d-f; Extended Data Fig. 1d). As expected, the dramatic loss of MuSCs was associated with a severe regeneration defect in response to muscle cryoinjury (Extended Data Fig. 1e-h) or chemically-induced muscular injury (Fig. 1g-i), as evidenced by a lack of activated (Myogenin, Myog+) MuSCs and regenerative (Myosin Heavy Chain 3, MYH3+ myofibers, and impaired recovery of muscle mass. These results were confirmed using a second independent Pax7-CreERT2(KARDON) allele11, which also resulted in the loss of Pax7+ MuSCs cells upon tamoxifen-induced deletion of Cox10 (Extended Data Fig. 1i,j), accompanied by regenerative defects in response to injury (Extended Data Fig. 1k,l).
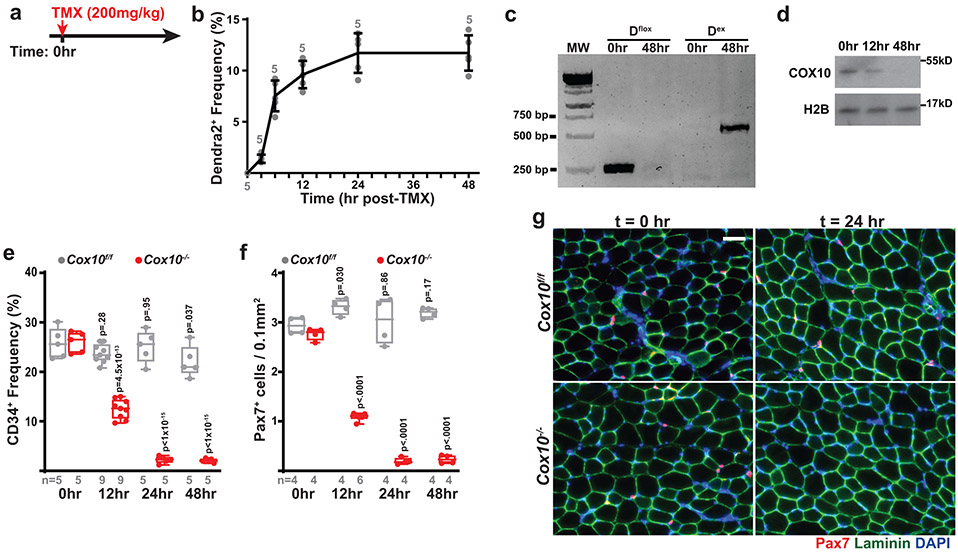
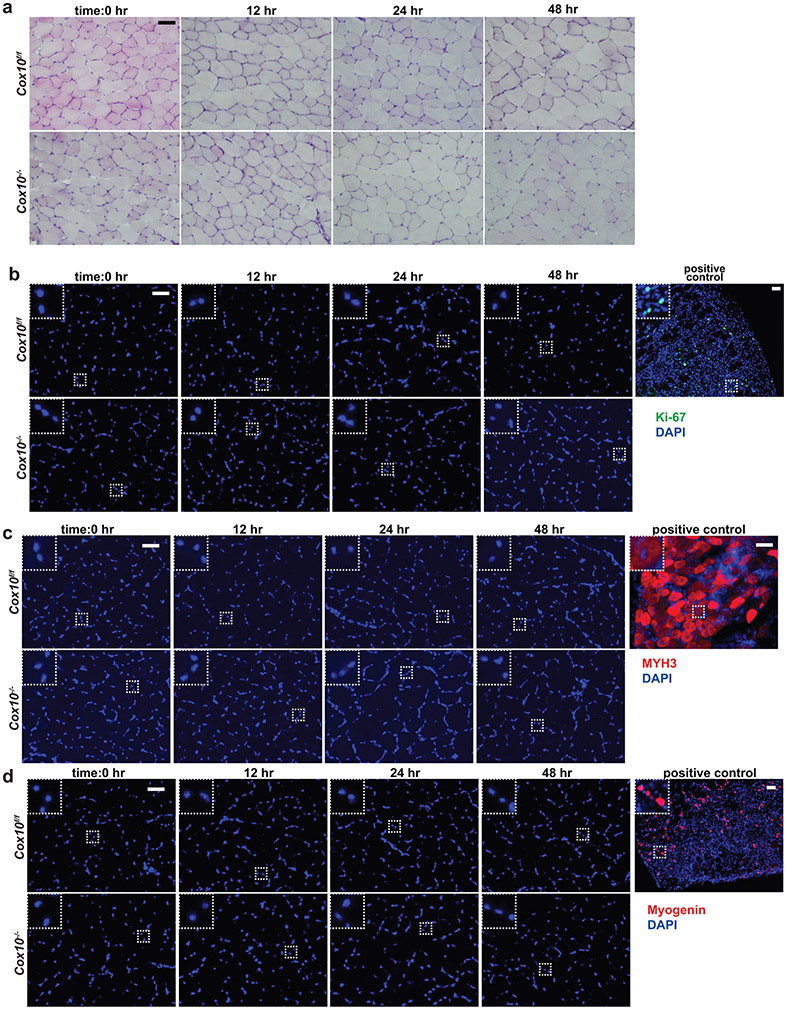
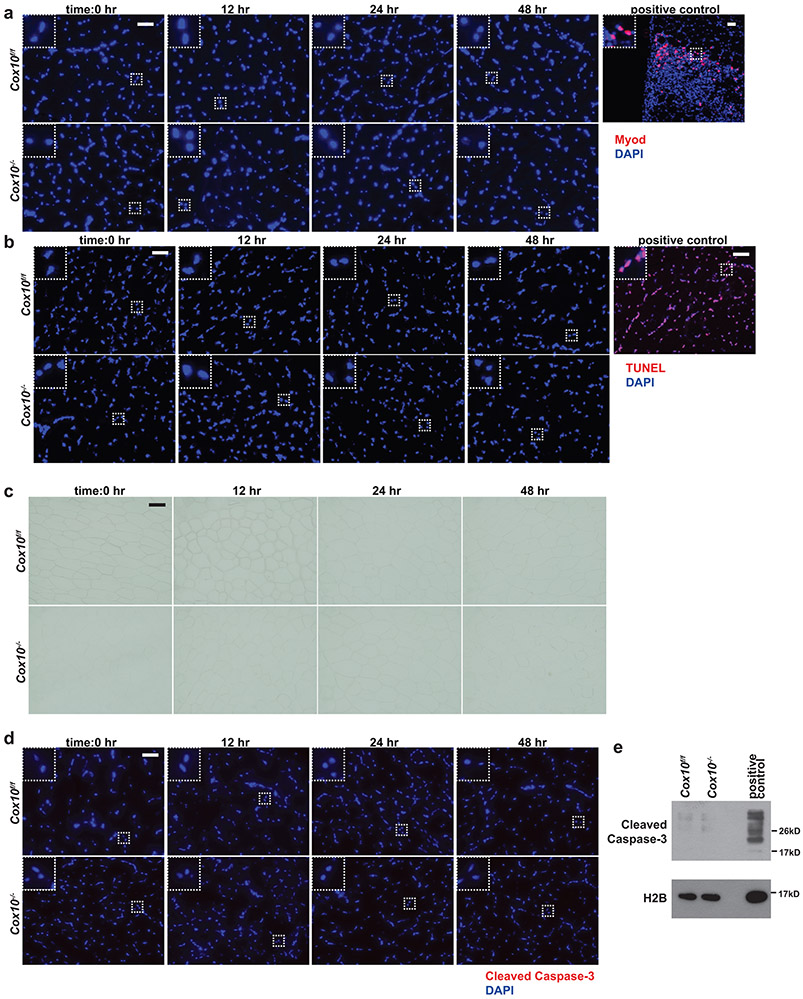
Cellular stress in MuSCs has been previously associated with pre-mature activation or differentiation14; however, we did not observe indicators of myogenic activation in Cox10−/− MuSCs (Extended Data Fig. 1m). To more directly assess the fate of Cox10-deleted MuSCs, we attempted to synchronize Cre-mediated recombination with a single high dose of tamoxifen15 which was sufficient to rapidly induce near complete recombination, as well as loss of Cox10 protein (Extended Data Fig. 2a-d). This alternate protocol significantly increases the kinetics of MuSC depletion, as detected by the CD34+ population (via FACS) or the Pax7+ population (via immunodetection of endogenous Pax7) (Extended Data Fig. 2e-g). Assessment of tissues at different timepoints following tamoxifen revealed that the rapid depletion of MuSCs in this protocol was not associated with stem cell activation, apoptosis, or senescence, as revealed by examination of myogenic regulatory factors (Myod, Myogenin, MYH3), TUNEL or β–galactosidase staining (Extended Data Fig. 3a-d, Extended Data Fig. 4a-c). Although mitochondrial ETC impairment can be associated with apoptotic cell death in vitro16,17, Cox10-deficiency has not been typically associated with acute cell death in vivo13,18-21, and correspondingly, we do not observe indications of apoptosis in Cox10−/− MuSCs based on TUNEL staining and assessment of cleaved Caspase-3 levels (Extended Data Fig. 4d,e).
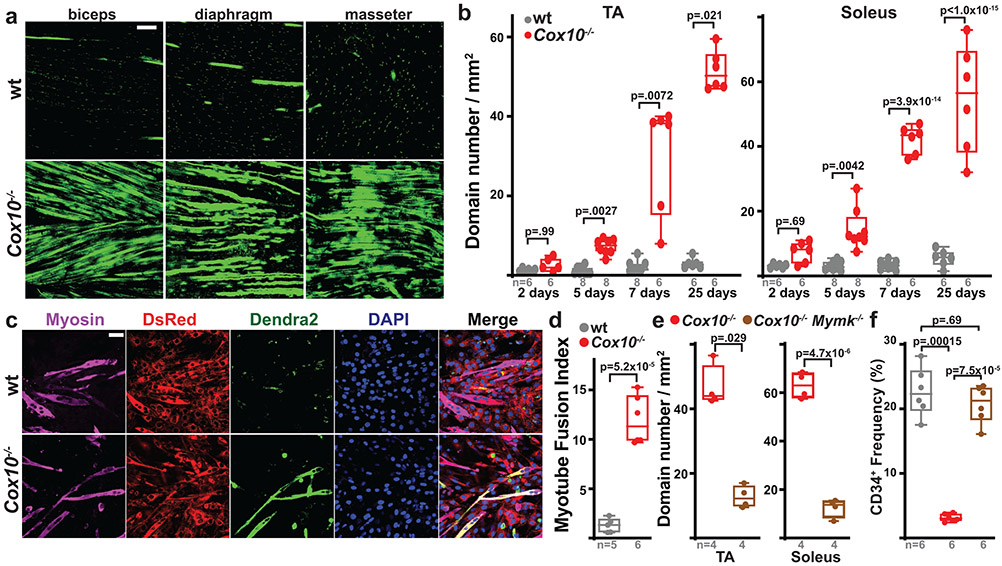
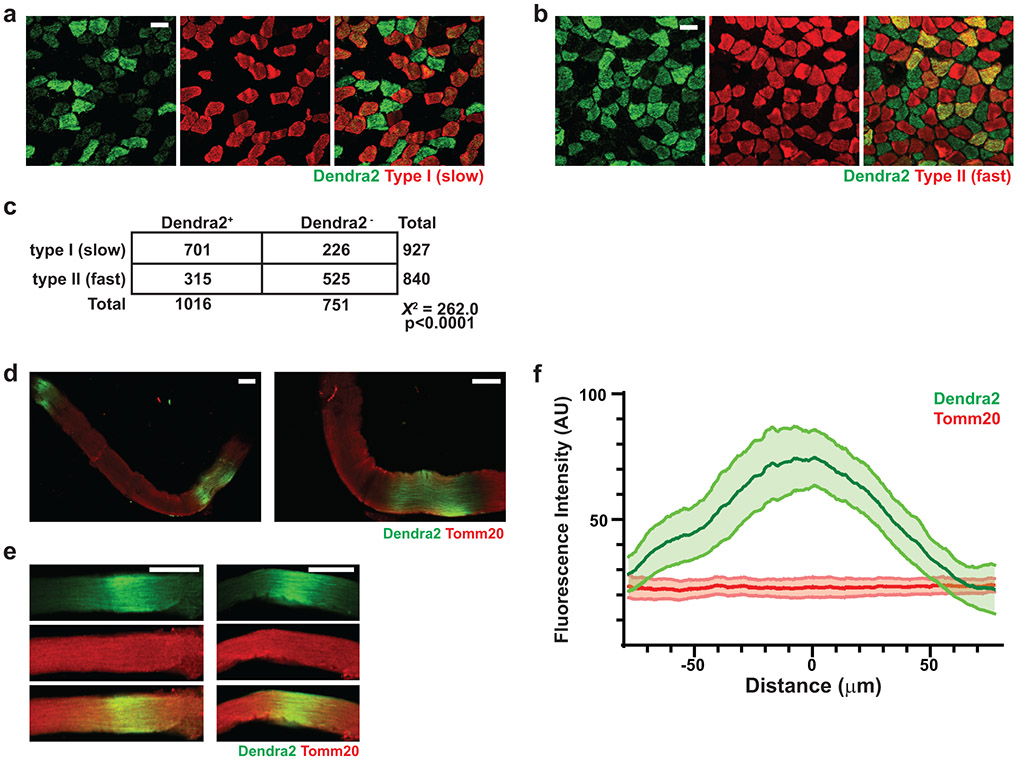
To directly determine the fate of Cox10−/− MuSCs, we performed lineage tracing using a conditional (Cre-dependent) mito-Dendra2 expression allele (Df)22, which encodes a fluorescent protein (Dendra2) targeted to mitochondria. In control mice (Pax7-CreERT2(KARDON); Df/f; Cox10+/+; hereafter, ‘wt’), mito-Dendra2 signal mainly labeled mononuclear cells throughout skeletal muscle tissue (Fig. 2a), with occasional labeling of mitochondria within myofibers. Since MuSCs are known to occasionally fuse with neighboring myofibers in wild-type animals23-25, these MuSC-myofiber fusion events can be marked by segments or ‘domains’ of mito-Dendra2 signal within myofibers and typically represent fusion of a single MuSC cell25. Cox10 deletion in MuSCs (“Cox10−/−“: Pax7-CreERT2(KARDON); Df/f; Cox10f/f) dramatically increased the frequency of mito-Dendra2 domains within myofibers (Fig. 2a), corresponding to an elevated rate of MuSC fusion into myofibers. The contribution of MuSCs to neighboring myofibers accumulated with time following tamoxifen administration, occurred in multiple muscles throughout the body, and was randomly distributed through muscle tissue as revealed by deep imaging of cleared tissue (Fig. 2a,b, Supplementary Movie 1-3). Fiber type analysis reveals that MuSCs readily fused to both slow (type I) and fast (type II)-twitch fibers, with a statistical preference for slow-twitch fibers (Extended Data Fig. 5a-c). Single fiber analysis indicated that mitochondrial content was not significantly increased in myofiber segments where a fusion event had occurred (Extended Data Fig. 5d-f).
Fig. 2: Complex IV dysfunction induces MuSC-myofiber fusion in vivo and in vitro.
a, Longitudinal imaging of mito-Dendra2 signal in various muscles at 21 days post the 1st dose of tamoxifen. Scale bar, 200 μm. b, mito-Dendra2 domain number (normalized to muscle area) in myofibers of TA and soleus muscles at different times post the 1st dose of tamoxifen. c, In vitro MuSC-myotube fusion assay: Dendra2+ (green) freshly-isolated MuSCs of the indicated genotype were overlaid on DsRed+ (red) C2C12 myotubes and assessed for fusion with Myosin+ (magenta) myotubes after 4 days. Cells were stained with Myosin (magenta) and DAPI (blue). Scale bar, 50 μm. d, Quantitated myotube fusion indices for MuSCs of the indicated genotype. e, mito-Dendra2 domain numbers in TA and soleus muscles at 21 days post the 1st dose of tamoxifen in mice of the indicated genotype. Mymk, Myomaker. f, MuSC (CD34+) frequency of the indicated genotypes at 21 days post the 1st dose of tamoxifen. Same color scheme as d,e. Statistical significance was assessed using two-way ANOVA (b), two-tailed t-test (d,e), Kruskal-Wallis (b), two-tailed Mann-Whitney (e), or one-way ANOVA (f) tests with adjustments for multiple comparisons. Box plots indicate median values and interquartile ranges; whiskers are plotted using the Tukey method. The number of biological replicates in each group and p-values are indicated in the figure. Experiments were repeated 3 times in panel a, and 5-6 times in panel c; both with similar results.
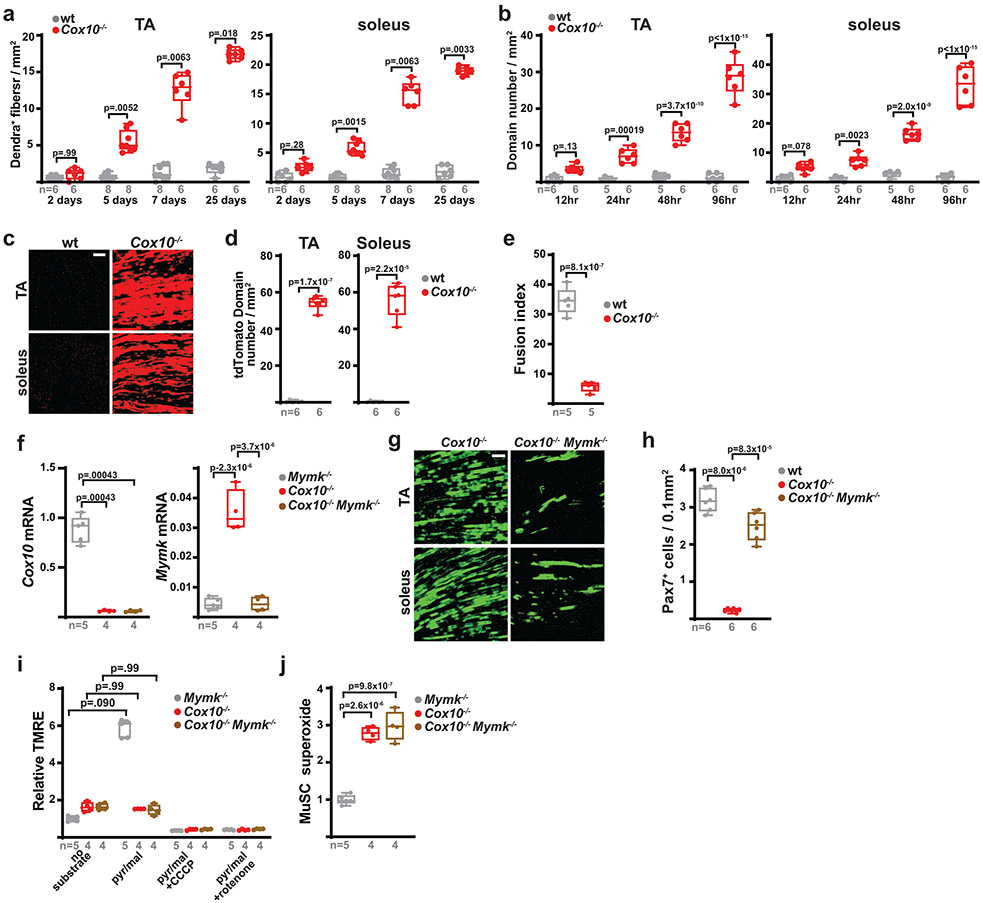
Quantitating the number of spatially distinct domains (Fig. 2b), or the number of fibers receiving a labeled MuSC (Extended Data Fig. 6a), revealed a time-dependent increase in MuSC-myofiber fusion following tamoxifen administration, which corresponds with the slower kinetics of MuSC depletion in this protocol (Fig. 1d,e). This result was replicated in the single high dose tamoxifen protocol (Extended Data Fig. 2a), where the more rapid depletion of MuSCs (Extended Data Fig. 2e,f) was accompanied by a corresponding rapid appearance of mito-Dendra2 domains within myofibers (Extended Data Fig. 6b). Thus, in two tamoxifen administration protocols with distinct kinetics, the appearance of mito-Dendra2 domains correlates in time with the depletion of MuSCs. In addition, experiments with an alternative reporter allele (tdTomatof/f) replicated the induction of MuSC-myofiber fusion upon ETC dysfunction (Extended Data Fig. 6c,d).
As Cox10 deletion is restricted to MuSCs in the above experiments, the induction of MuSC-myofiber fusion is likely due to cell-autonomous properties of these mutant MuSCs. Indeed, freshly isolated Cox10−/− MuSCs fused at increased frequencies with pre-formed C2C12 myotubes in vitro (Fig. 2c,d), despite defects in in vitro differentiation (Extended Data Fig. 6e). In addition, conditional genetic removal of the fusion machinery (myomaker; Mymk)26 was sufficient to block fusion of Cox10−/− MuSCs in vivo (Fig. 2e, Extended Data Fig. 6f,g), and rescue the loss of MuSCs (Fig. 2f, Extended Data Fig. 6h), despite continued loss of ETC function (Extended Data Fig. 6i,j). Together, these results indicate that loss of Cox10 in adult Pax7+ MuSCs triggers their depletion by inducing MuSC fusion into existing myofibers.
MuSC-myofiber fusion is induced by reactive oxygen species
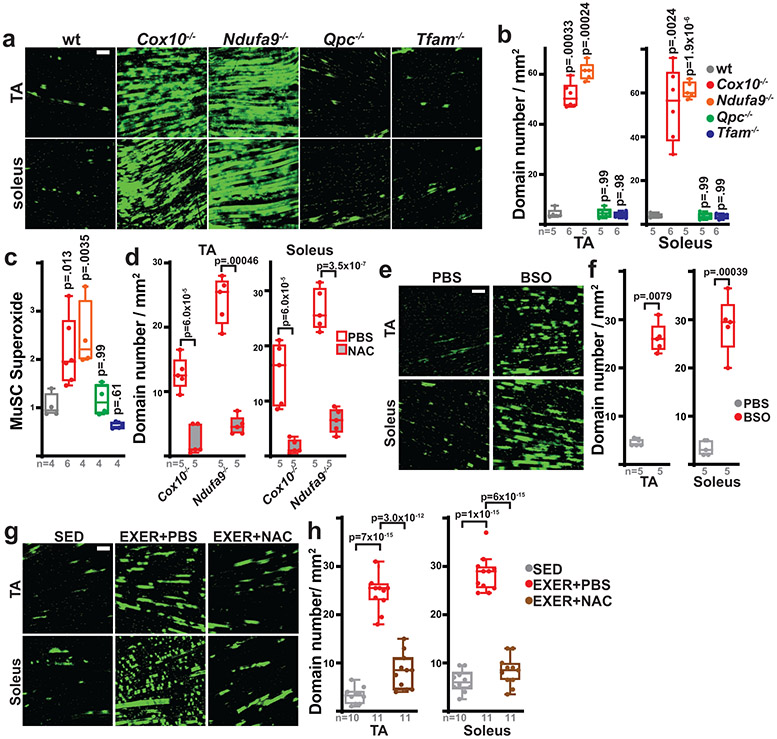
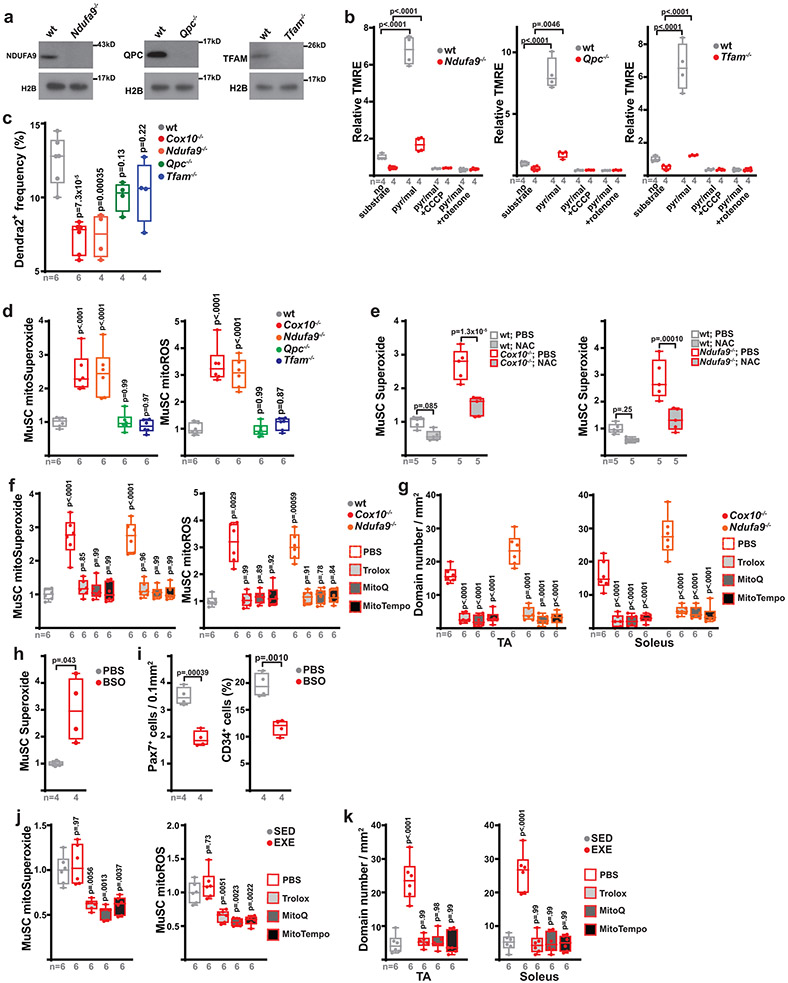
While subsets of quiescent MuSCs are known to occasionally fuse with myofibers in wild-type adult animals27-29, the underlying mechanisms which induce these events are unknown. Our results thus far position ETC dysfunction as a critical trigger of MuSC-myofiber fusion. To test whether MuSC-myofiber fusion is a general consequence of ETC dysfunction, we next examined MuSC fates after loss of complex I function (Ndufa9−/−), loss of complex III function (Qpc−/−), or loss of mitochondrial DNA (complex I, III, IV and V; Tfam−/−), using conditional alleles of these genes crossed with the Pax7-CreERT2(Kardon) driver and Df lineage tracer. Tamoxifen-induced recombination of these alleles was sufficient to deplete target proteins and reduce ETC function in adult MuSCs (Extended Data Fig. 7a,b). Like Cox10−/− MuSCs, Ndufa9−/− MuSCs also acutely fused with existing myofibers, as indicated by the presence of Dendra2 domains within myofibers after tamoxifen administration (Fig. 3a,b). However, Qpc−/− or Tfam−/− MuSCs did not fuse with myofibers (Fig. 3a,b), indicating that not all modes of ETC dysfunction trigger MuSC-myofiber fusion. Correspondingly, deletion of Ndufa9 (but not Qpc or Tfam) also resulted in acute depletion of MuSCs, similar to Cox10 deletion (Extended Data Fig. 7c).
Fig. 3: MuSC-myofiber fusion is regulated by reactive oxygen species.
a, Representative longitudinal images of mito-Dendra2 domains in TA and soleus muscles of mice of the indicated genotype (21 days post the 1st dose of tamoxifen). Scale bar, 200 μm. b, Quantitation of mito-Dendra2 domain numbers (normalized to muscle area) at 21 days post the 1st dose of tamoxifen. p-values reflect comparisons with the wt group. c, Relative superoxide levels in MuSCs of the indicated genotype at 5 days post the 1st dose of tamoxifen. Same color scheme as b. p-values reflect comparisons with the wt group. d, mito-Dendra2 domain numbers (normalized to muscle area) in mice of the indicated genotype pre-treated with vehicle (PBS) or N-acetylcysteine (NAC) at 5 days post the 1st dose of tamoxifen. e, Representative longitudinal images of mito-Dendra2 domains in TA and soleus muscles of mice treated with vehicle (PBS) or BSO for 21 days. Scale bar, 200 μm. f, mito-Dendra2 domain numbers (normalized to muscle area) in mice treated with PBS or BSO for 21 days. g, Representative longitudinal images of mito-Dendra2 domains in TA and soleus muscles of sedentary (SED) mice, exercised mice treated with PBS (EXER+PBS), or exercised mice treated with NAC (EXER+NAC). Scale bar, 200 μm. h, mito-Dendra2 domain numbers (normalized to muscle area) in mice of the indicated groups. Statistical significance was assessed using one-way ANOVA (b,c,h), two-way ANOVA (d), two-tailed t-test (f), and two-tailed Mann-Whitney (f) tests with adjustments for multiple comparisons. Box plots indicate median values and interquartile ranges; whiskers are plotted using the Tukey method. The number of biological replicates in each group and p-values are indicated in the figure. Experiments were repeated 5-6 times in panel a, 5 times in panel e, and 10-11 times in panel g; all with similar results.
Different mechanisms of ETC dysfunction are associated with variable inductions in oxidative stress, due to a differential ability to impact the redox-active prosthetic groups required for superoxide generation30. We observed elevated levels of cellular superoxide, as well as elevated mitochondrial superoxide and total reactive oxygen species (ROS), in the Ndufa9−/− and Cox10−/− MuSCs, but not Qpc−/− or Tfam−/− MuSCs (Fig. 3c, Extended Data Fig. 7d). The lack of increased ROS in Qpc−/− and Tfam−/− MuSCs is consistent with previous experiments in other cellular systems31,32. The correlation between increased ROS levels (Fig. 3c) and induced MuSC-myofiber fusion (Fig. 3a,b) suggests that elevated ROS may be a critical signal which initiates the fusion event. To test this, we treated mice with the antioxidant N-acetylcysteine (NAC) prior to and during tamoxifen-induced conditional deletion of Cox10 or Ndufa9. NAC pretreatment lowered MuSC superoxide and mitoROS levels (Extended Data Fig. 7e) and inhibited MuSC-myofiber fusion in both genotypes (Fig. 3d), indicating that mitoROS elevation is associated with the induction of MuSC-myofiber fusion. Treatments with an alternative antioxidant (Trolox), as well as the mitochondrial targeted antioxidants, MitoTempo and MitoQ, were also sufficient to lower mitoROS levels in Cox10−/− and Ndufa9−/− MuSCs and block MuSC-myofiber fusion (Extended Data Fig. 7f,g). Thus, antioxidant treatment blocks the fusion of ETC-dysfunctional MuSCs with neighboring myofibers. Conversely, we induced elevated ROS in MuSCs of wild-type animals by systemic treatment with the pro-oxidant, glutathione synthesis inhibitor (buthionine sulfoximine, BSO) (Extended Data Fig. 7h). Daily BSO treatment (for 21 days) was sufficient to stimulate MuSC fusion to neighboring myofibers (Fig. 3e,f) and deplete MuSC levels (Extended Data Fig. 7i). Thus, induced pharmacologic elevations in systemic ROS correlate with enhanced MuSC-myofiber fusion.
While the above genetic manipulations and pharmacologic (BSO) treatment results in substantial ETC dysfunction and/or oxidative stress, the physiological stresses experienced by MuSCs in wild-type conditions are likely less severe. We examined the effects of physiologic elevations in ROS, making use of a daily treadmill exercise regimen. Exercise regimens are known to be associated with transient oxidative stress in skeletal muscle tissue33-37, although other pleiotropic effects are also present. Four weeks of daily treadmill running was sufficient to induce MuSC-myofiber fusion in hindlimb muscles of wild-type mice (Fig. 3g,h). Interestingly, this effect was blocked by daily treatment with N-acetylcysteine or other antioxidants (Fig. 3g,h, Extended Data Fig. 7j,k), indicating that the induced fusion was ROS-dependent. Thus, physiologic elevations in ROS experienced by wild-type animals is associated with induction of MuSC-myofiber fusion.
Induction of Scinderin is required for MuSC-myofiber fusion
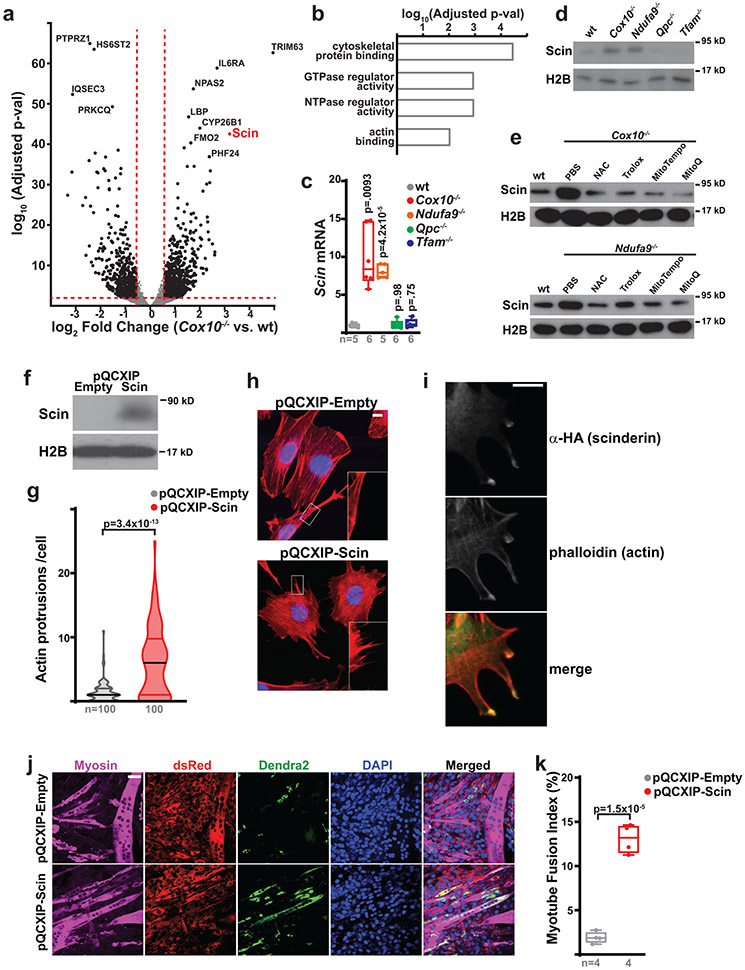
To identify mechanisms underlying the fusion of MuSCs with myofibers, we performed RNA-seq analysis comparing wild-type and Cox10−/− MuSCs. We did not observe upregulation of Pax3 or other myogenic regulatory factors associated with MuSC activation in Cox10−/− MuSCs (Supplementary Table 1). Gene ontology analysis indicated that upregulated transcripts in Cox10−/− MuSCs were enriched for actin network binding and regulatory proteins (Supplementary Table 1, Fig. 4a,b). Actin-dependent protrusions of the plasma membrane have been previously implicated in myoblast fusion38,39, and analysis of the highest upregulated genes identified Scinderin (Scin), a member of the gelsolin family with actin network reorganization activity40. Scinderin mRNA and protein was upregulated in both Cox10−/− and Ndufa9−/− MuSCs, but not Qpc−/− or Tfam−/− MuSCs, (Fig. 4c,d). Antioxidant treatment was sufficient to block Scinderin induction in Cox10−/− and Ndufa9−/− MuSCs (Fig. 4e).
Fig. 4: Scinderin induces actin network changes and MuSC-myotube fusion.
a, Volcano plot of gene expression changes in Cox10−/− vs. wt MuSCs. Log2(Fold Change) is plotted against the log10(adjusted p-value) for each gene. b, Gene ontology analysis of upregulated genes in Cox10−/− MuSCs. c, Normalized Scinderin transcript levels in isolated MuSCs of the indicated genotype at 5 days post the 1st dose of tamoxifen. p-values reflect comparisons with the wt group. d, Scinderin protein levels in isolated MuSCs of the indicated genotype at 5 days after the 1st dose of tamoxifen. Histone 2B (H2B) levels are shown as a loading control. e, Scinderin protein levels in isolated MuSCs of the indicated genotype and treatment at 5 days post the 1st dose of tamoxifen. H2B levels are shown as a loading control. f, Scinderin protein levels in C2C12 cells infected with empty or Scinderin overexpressing virus. H2B levels are shown as a loading control. g, Violin plots of actin protrusion numbers (per cell) for control and Scinderin-overexpressing C2C12 cells. h, Representative images of actin networks (stained by Acti-stain555 phalloidin (red)) and nuclei (DAPI, blue) in control and Scinderin-overexpressing C2C12 cells. Scale bar, 10 μm. i, Scinderin (α-HA; green) and actin (phalloidin; red) localization in cells overexpressing Scinderin. Scale bar, 10 μm. j, Representative images from an in vitro MuSC-myotube fusion assay: 10,000 Dendra2+ (green) freshly-isolated control or Scin-overexpressing MuSCs were overlaid on DsRed+ (red) C2C12 myotubes and assessed for fusion with Myosin+ myotubes after 4 days. Cells were stained with Myosin (magenta) and DAPI (blue). Scale bar, 50 μm. k, Quantitated myotube fusion indices for MuSCs of the indicated genotype. Statistical significance was assessed using one-way ANOVA (c), two-tailed Mann-Whitney test (g) or two-tailed t-test (k). Box and violin plots indicate median values and interquartile ranges; whiskers are plotted using the Tukey method. The number of biological replicates per group and p-values are indicated in the figure. Experiments were repeated 3 times in panels h,i, and 4 times in panel j; all with similar results.
In vitro, overexpression of Scinderin stimulated actin rich protrusions of the plasma membrane in C2C12 myoblasts (Fig. 4f-h). Scinderin protein accumulated at sites of actin protrusion, and co-localized with actin accumulation (Fig. 4i), suggesting a model whereby Scinderin induces actin cap formation at the plasma membrane to induce cellular protrusions and invasion into neighboring myofibers. We therefore infected primary wild-type MuSCs with Scin-expressing (or control) retrovirus, and then overlaid them with pre-formed C2C12 myotubes. While control MuSCs rarely fused with C2C12 myotubes, Scin-expressing cells often fused with preformed myotubes (Fig. 4j,k). The data implicate a model whereby Scinderin induces fusion of primary MuSCs via local activation of actin polymerization at the plasma membrane, and subsequent membrane protrusion.
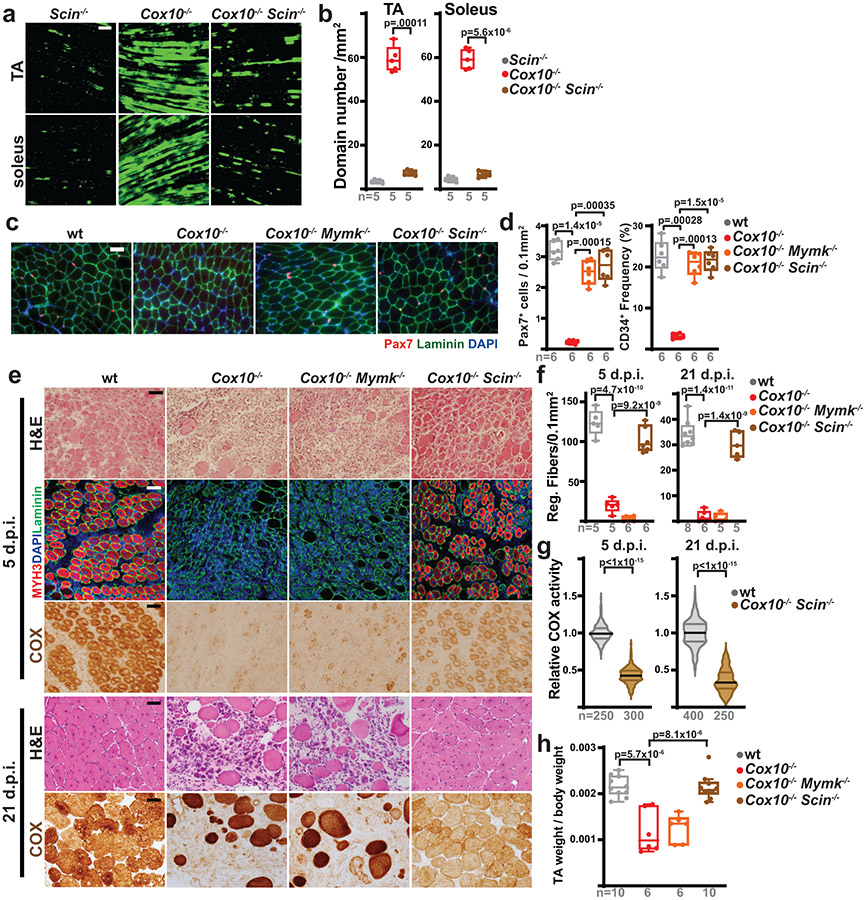
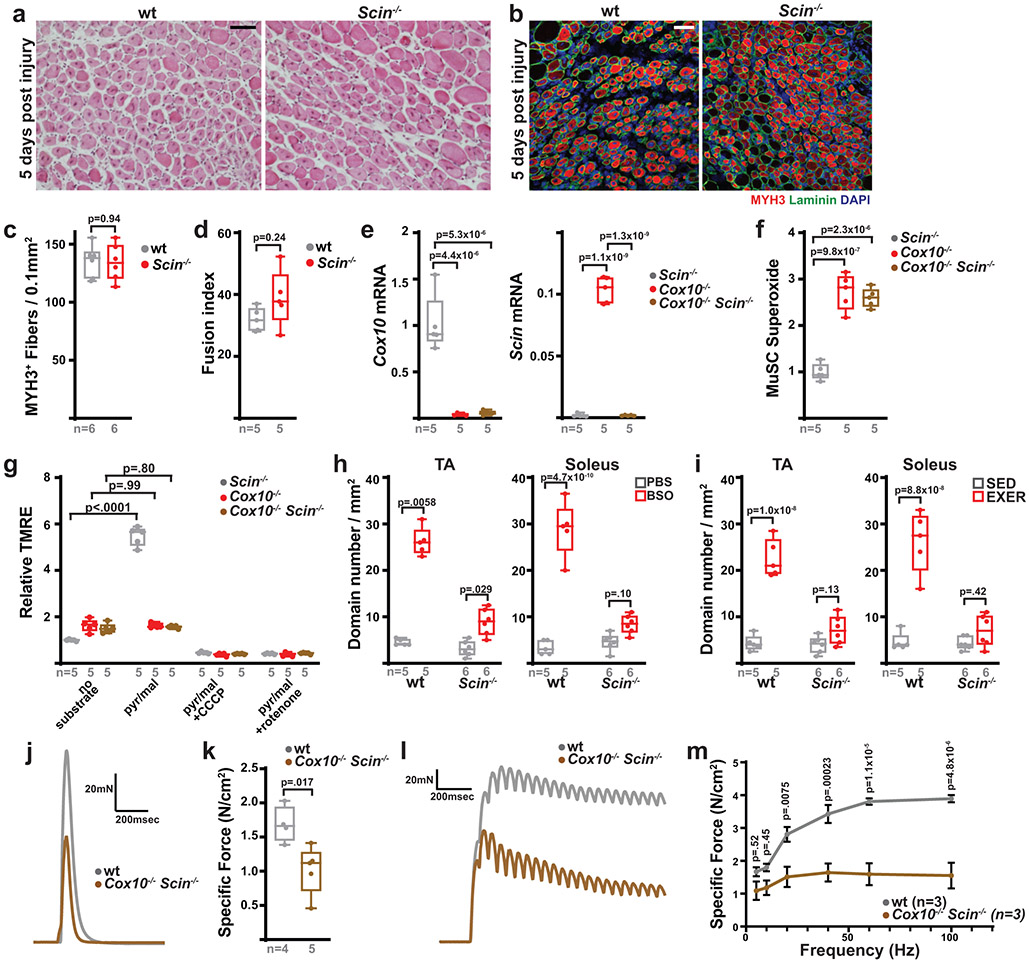
We next used a conditional knockout allele of Scinderin41 to examine its in vivo role in MuSC fate and function. Deletion of Scinderin in Pax7+ MuSCs did not impair myofiber regeneration in response to injury (Extended Data Fig. 8a-c) or impair in vitro differentiation into myotubes (Extended Data Fig. 8d), indicating that Scinderin is not required for MuSC-MuSC fusion events necessary for new fiber formation. However, quiescent Cox10−/−Scin−/− MuSCs no longer fused with existing myofibers at elevated rates in vivo (Fig. 5a,b), despite continued ETC dysfunction and elevated superoxide (Extended Data Fig. 8e-g), indicating that Scinderin is required for MuSC-myofiber fusion events induced by ETC dysfunction. Correspondingly, removal of Scinderin rescued the depletion of MuSCs mediated by loss of Cox10 (Fig. 5c,d). In addition, Scinderin was required for MuSC-myofiber fusion induced by systemic elevations in oxidative stress (BSO treatment or treadmill running) in wild-type animals (Extended Data Fig. 8h,i). Together, these data indicate a requirement for Scinderin in MuSC-myofiber fusion in response to multiple forms of oxidative stress.
Fig. 5: Scinderin is required for MuSC-myofiber fusion.
a, Representative longitudinal images of mito-Dendra2 domains in TA and soleus muscles of mice of the indicated genotype, 21 days post the 1st dose of tamoxifen. Scale bar, 200 μm. b, mito-Dendra2 domain numbers (normalized to muscle area) at 21 days post the 1st dose of tamoxifen. c, Representative images of endogenous Pax7+ cells (red), laminin (green) and DAPI (blue) from tibialis anterior (TA) cross-sections from mice of the indicated genotype at 21 days post the 1st dose of tamoxifen. Scale bar, 50 μm. d, MuSC (CD34+) and Pax7+ frequency in mice of the indicated genotype at 21 days post the 1st dose of tamoxifen. e, Representative images of histology (H&E), MYH3+ fibers (red) and complex IV activity (COX) in cross-sections of TA muscles from mice of the indicated genotypes. Muscles were harvested and assessed 5 days or 21 days post-BaCl2 injury. For immunofluorescent staining, sections were stained with α-laminin (green), α-MYH3 (red), and DAPI (blue). Scale bar: 50 μm. d.p.i, days post-injury. f, Quantitation of regenerative fiber numbers (normalized to muscle area) in TA muscles at 5 days and 21 days post-BaCl2 injury. g, Normalized COX activity from regenerative myofibers at 5 days and 21 days post-BaCl2 injury. The number of analyzed fibers per group is indicated. h, TA weight (normalized to body weight) at 21 days after BaCl2 injury. Statistical significance was assessed using one-way ANOVA (b,d,f,h) or two-tailed Mann-Whitney (g) tests, with adjustments for multiple comparisons. Box and violin plots indicate median values and interquartile ranges; whiskers are plotted using the Tukey method. The number of biological replicates in each group and p-values are indicated in the figure. Experiments were repeated 5 times for panel a, 6 times for panel c, and 5-8 times for panel e; all with similar results.
MuSC-myofiber fusion prevents regeneration of damaged tissue
As described above (Fig. 1,2), Cox10 deletion in MuSCs induces stem cell depletion, resulting in impaired myofiber regeneration. We therefore re-tested regenerative capacity in mice with Cox10−/−Scin−/− mice, which retain MuSCs (Fig. 5c,d). In contrast to Cox10−/− animals, co-deletion of Scinderin was sufficient to rescue regeneration from Cox10−/− MuSCs, resulting in the formation of de novo MYH3+ myofibers (Fig. 5e,f), as well as recovery of muscle mass at 3 weeks post-injury (Fig. 5h). As expected, deletion of Myomaker did not rescue regeneration from Cox10−/− MuSCs, as Myomaker is required for MuSC-MuSC fusion26,42 (Fig. 5e,f). Thus, the induction of MuSC-myofiber fusion and resulting depletion of MuSCs is responsible for the decline in regenerative capacity observed in mice with Cox10−/− MuSCs. However, de novo fibers formed from Cox10−/−Scin−/− MuSCs exhibited significant mitochondrial impairment, as indicated by their depleted mitochondrial complex IV activity (Fig. 5e,g). Consistent with this, functional analysis performed 21 days after injury revealed significant defects in twitch and tetanic force generation (Extended Data Fig. 8j-m). Thus, in the absence of Scinderin-mediated MuSC-myofiber fusion, ETC-dysfunctional stem cells are retained in this experimental model and available to regenerate dysfunctional tissue.
Scinderin regulates MuSC functionality during aging
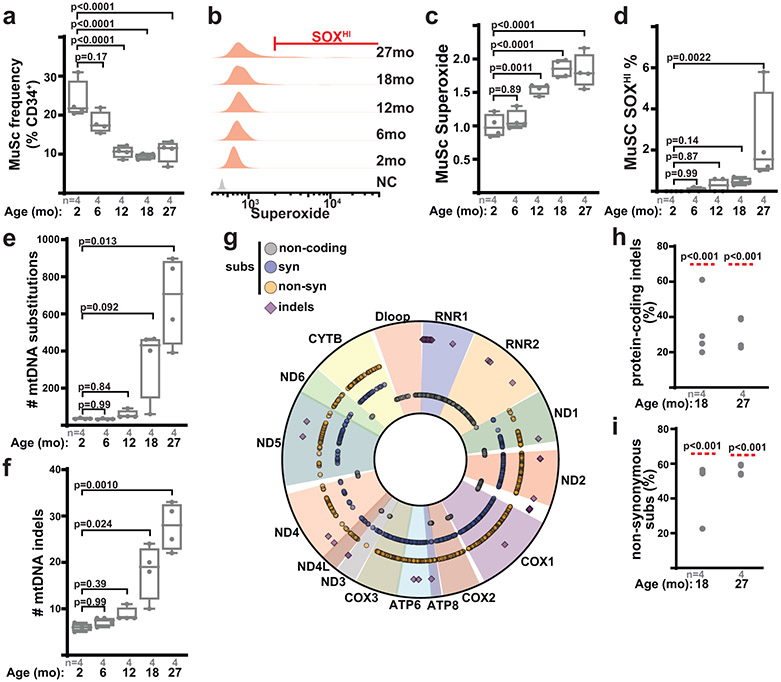
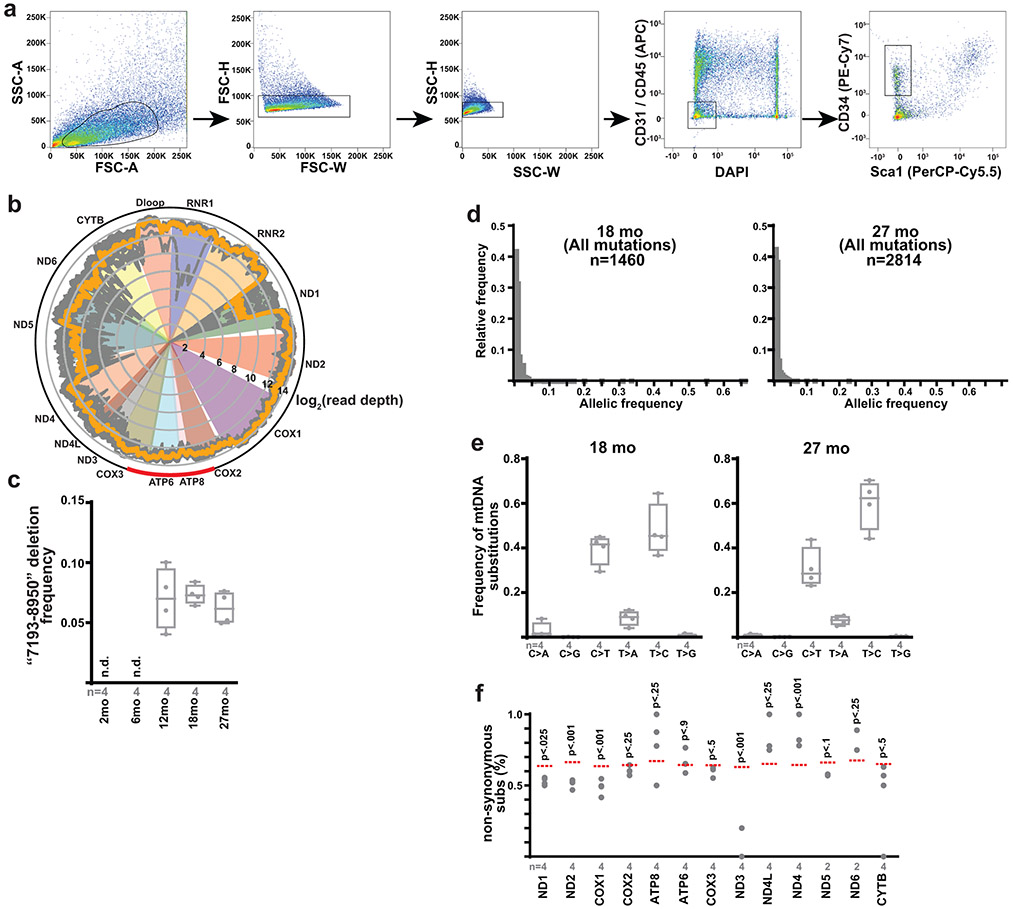
During aging, MuSCs are known to rapidly deplete, accompanied by elevations in reactive oxygen species and metabolic signatures of ETC-dysfunction15,43. Consistent with this literature, we assessed MuSC properties in a cohort of wild-type mice from 2 to 27 months of age, which revealed significant declines in MuSC numbers in early adulthood, as well as increased mitochondrial reactive oxygen species in late adulthood (Fig. 6a-d). As mtDNA mutations have been observed to accumulate with age in various tissues, we purified MuSCs from wild-type mice of varying ages, and performed deep sequencing of mtDNA genomes at high coverage (Extended Data Fig. 9a,b, Supplementary Table 2). Deep sequencing of MuSC mtDNA genomes revealed an age-dependent increase in the abundance of mtDNA mutations, including both substitutions and indels (Fig. 6e,f, Extended Data Fig. 9c). Age-accumulating mutations occurred randomly throughout the mitochondrial genome, were predominantly of low allelic frequency, and displayed mutational signatures consistent with mtDNA replicative errors44,45 (Fig. 6g, Extended Data Fig. 9d,e). Thus, the murine MuSC population accumulates random mtDNA errors in late adulthood, correlated with the overall observed increases in superoxide levels. However, our pooled sequencing analysis cannot distinguish allelic frequencies within individual cells, and thus we cannot directly associate the presence of mtDNA mutations with elevated superoxide levels at the single cell level. We noted that the observed frequencies of protein-coding indels, as well as non-synonymous substitutions, were significantly lower than expected by random chance (Fig. 6h,i, Extended Data Fig. 9f), indicating that MuSCs select against dysfunctional mtDNA mutations during aging.
Fig. 6: Muscle stem cells accumulate mtDNA mutations with age.
a, Quantitation of MuSC number (frequency of CD34+ cells) from wild-type mice of the indicated ages. b, Representative superoxide FACS profiles of MuSCs from mice of the indicated age. NC: unstained negative control. Gating for the SOXHI (SuperoxideHI) population is indicated. c, Quantitation of mean superoxide levels in MuSCs of mice of the indicated age. d, Quantitation of SOXHI population frequency from MuSCs of mice of the indicated age. e, Number of identified mtDNA substitutions from deep mtDNA sequencing of isolated MuSCs from mice of the indicated age. f, Number of identified mtDNA indels (insertions/deletions) from isolated MuSCs of mice of the indicated age. g, Mapped positions of identified somatic mtDNA mutations (indels, non-coding, synonymous and non-synonymous substitutions) in MuSCs from 27 month old mice. h, Abundance of mtDNA protein-coding indels (as a percentage of total indels) observed in isolated MuSCs from mice of the indicated age. The expected frequency is indicated by the red line. i, Abundance of mtDNA non-synonymous substitutions (as a percentage of total protein-coding substitutions) observed in isolated MuSCs from mice of the indicated age. The expected frequency is indicated by the red line. Statistical significance was assessed using one-way ANOVA (a,c), Kruskal-Wallis (d,e,f), and chi-squared (h,i) tests with adjustments for multiple comparisons. Box plots indicate median values and interquartile ranges; whiskers are plotted using the Tukey method. The number of biological replicates per group and p-values are indicated in the figure.
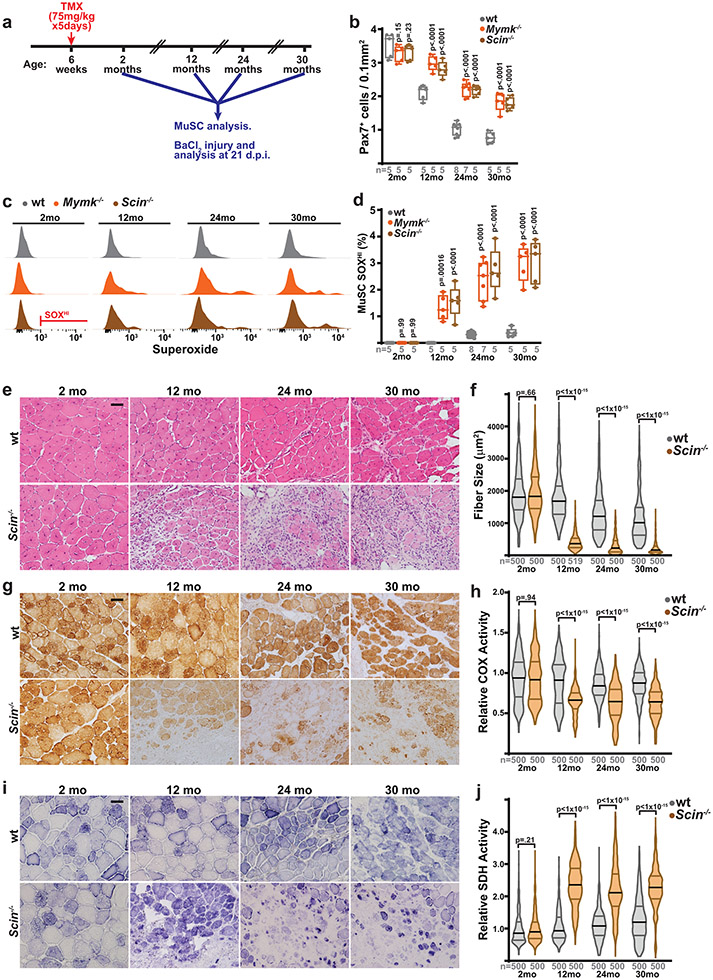
We therefore tested the role of MuSC-myofiber fusion in regulating MuSC properties during aging, making use of mice with conditional removal of Scin or Mymk in MuSCs starting at 6 weeks of age (Fig. 7a). As compared with wild-type animals, animals with Scin−/− MuSCs or Mymk−/− MuSCs exhibit increased muscle stem cell numbers at multiple ages (12 – 30 months old) (Fig. 7b, Extended Data Fig. 10a), indicating that the ongoing MuSC-myofiber fusion in wild-type animals significantly contributes to the depletion of MuSCs during physiologic aging. Assessment of mitochondrial reactive oxygen species in 12 month, 24 month and 30 month old MuSCs revealed that loss of Scinderin or Myomaker results in a significant accumulation of stem cells with elevated superoxide levels (Fig. 7c,d). Thus, in the absence of MuSC-myofiber fusion, MuSCs deplete more slowly with age, and accumulate stem cells with elevated mitochondrial ROS.
Fig. 7: Scinderin is required for regenerating healthy tissue in aged animals.
a, Schematic of aging experiments in wild-type, Mymk−/− and Scin−/− mice. Recombination is induced in MuSCs of animals at 6 weeks of age via tamoxifen (TMX) administration, followed by aging and the indicated analysis at various timepoints (2, 12, 24 and 30 months of age). At each timepoint, MuSCs are analyzed in situ and by FACS; in addition, tibialis anterior (TA) muscles are injured by BaCl2 and assess for regeneration at 21 days post-injury (d.p.i.). b, Pax7+ cell numbers (normalized to muscle area) in animals of the indicated genotype and age. p-values represent comparison with wt for each age group. c, Representative FACS profiles of Superoxide (SOX) levels in MuSCs isolated from animals of the indicated genotype and age. Gating for SOXHI population is indicated. d, Quantitation of SOXHI population frequency from MuSCs of mice of the indicated age and genotype. p-values represent comparison with wt for each age group. e, Representative images of histology (H&E) in cross-sections of TA muscles from mice of the indicated genotypes and ages. Muscles were harvested and assessed 21 days post-BaCl2 injury. Scale bar: 50 μm. f, Quantitation of fiber size from regenerative fibers (21 days post-injury) in TA muscles of mice of the indicated genotypes and ages. g, Representative images of COX activity in cross-sections of TA muscles from mice of the indicated genotypes and ages, at 21 days post-BaCl2 injury. h, Quantitation of relative COX activity in regenerative fibers (21 days post-injury) from TA muscles of mice of the indicated genotypes and ages. i, Representative images of SDH activity in cross-sections of TA muscles from mice of the indicated genotypes and ages, at 21 days post-BaCl2 injury. j, Quantitation of relative SDH activity in regenerative fibers (21 days post-injury) from TA muscles of mice of the indicated genotype and ages. Statistical significance was assessed using two-way ANOVA (b,d) or two-tailed Mann-Whitney (f,h,j) tests, with adjustments for multiple comparisons. Box and violin plots indicate median values and interquartile ranges; whiskers are plotted using the Tukey method. The number of biological replicates in each group and p-values are indicated in the figure. Experiments were repeated 5-8 times in in panels e,g,I; all with similar results.
Retention of dysfunctional MuSCs during aging potentially has consequences for the regeneration of healthy tissue. We inhibited MuSC-myofiber fusion via conditional deletion of Scinderin in MuSCs at 6 weeks of age, and tested regeneration in young (2 month old), middle-aged (12 month old), elderly (24 month old) and geriatric (30 month old) animals. Loss of Scinderin had no functional consequences on regeneration in 2 month old animals (Fig. 7e,f, Extended Data Fig. 8a-c). At 12 months of age, animals with Scin−/− MuSCs displayed intact regenerative capacity (Fig. 7e,f, Extended Data Fig. 10b), based on their ability to form new fibers. However, the regenerated tissue exhibited substantial defects, including reduced fiber size (Fig. 7f) and reduced complex IV activity, evident of mitochondrial dysfunction (Fig. 7g,h). Concomitant with this, regenerative fibers displayed significant increases in SDH activity (Fig. 7i,j), indicative of mitochondrial proliferation and accumulation commonly observed in the settings of muscular ETC dysfunction. These defects were retained in elderly (24 month old) and geriatric (30 month old) animals, but were not observed in young (2 month old animals) (Fig. 7e-j). Thus, deletion of Scinderin in MuSCs results in an age-dependent regenerative defect, likely due to the retention of MuSCs with elevated mitoROS which are unable to regenerate healthy tissue. In particular, the accumulating mitochondrial ETC dysfunction in aged MuSCs can be propagated to new myofibers if these cells are not removed by Scinderin-mediated MuSC-myofiber fusion.
Discussion
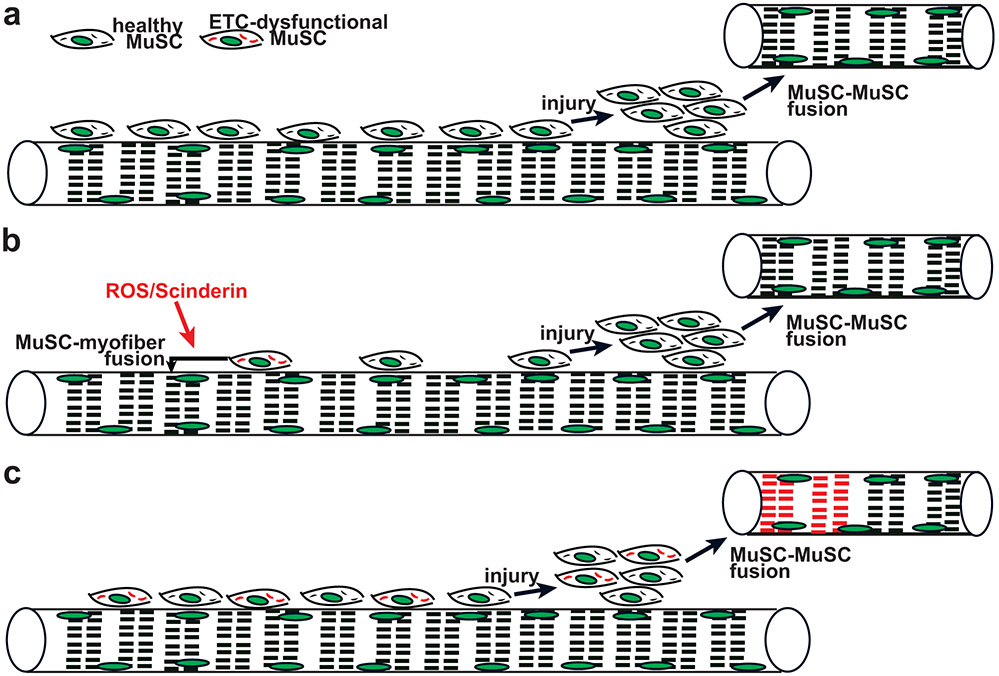
Our results indicate the consequences of mitochondrial damage in MuSCs: ETC dysfunction associated with elevated reactive oxygen species triggers compromised MuSCs to directly fuse with existing myofibers. This mechanism is cell-autonomous as ETC-dysfunctional MuSCs are able to fuse to otherwise healthy myofibers; however, we cannot rule out potential contributions from signaling events within the receiving myofiber or the extracellular matrix, and this constitutes a limitation of our study. This self-removal of ETC-dysfunctional stem cells by MuSC-myofiber fusion contributes to the striking decline in MuSC numbers observed during aging (Fig. 8a,b), and limits the appearance of ETC-dysfunctional MuSCs in aged animals. Thus, our findings provide insight into mechanisms to attenuate loss and regulate MuSC health in aged individuals.
Fig. 8: Proposed model: MuSC-myofiber fusion regulates removal of ETC-dysfunctional MuSCs during aging.
a, In young wild-type animals, healthy MuSCs predominate and are competent to regenerate healthy myofibers in response to injury. b, In aged, wild-type animals, ETC-dysfunctional MuSCs (depicted with red mitochondria) are sensitive to elevated ROS and Scinderin levels, and thereby induced to fuse into neighboring myofibers. In this manner, the remaining MuSC population contains healthy mitochondria, and generates healthy myofibers in response to injury. c, In the absence of Scinderin during aging, MuSC-myofiber fusion is not available to remove ETC-dysfunctional MuSCs. In this setting, injury can trigger the activation, proliferation and fusion of damaged MuSCs, resulting in de novo myofibers with mitochondrial dysfunction.
MuSC-myofiber fusion has been previously observed in wild-type mice. During early post-natal growth (up to p21), MuSCs significantly contribute to existing myofibers resulting in a ~5-fold increase in myonuclear numbers, and a ~7-fold increase in cross-sectional area46. After this initial period, MuSC contribution to myofibers is slow in sedentary animals, but can be readily observed with lineage tracing studies23,25. In our experimental models of induced MuSC-myofiber fusion in adult animals, we do not observe significant changes in cross-sectional area or myonuclear number, consistent with the low number of MuSCs (~2-3% of total nuclei) present in adult tissue. Our results instead suggest that MuSC-myofiber fusion in adult muscle is typically reserved for stem cells accumulating high levels of oxidative stress. Our data do not indicate evidence of premature activation or differentiation in response to oxidative stress; however, it is possible that myogenic activation occurs very close in time to MuSC-myofiber fusion such that the induction of myogenic regulatory factors is difficult to detect, and this represents a limitation of our study.
We observe that although aged MuSCs accumulate mtDNA mutations, these cells display signatures of selection against dysfunctional mtDNA variants. Thus, in the absence of MuSC-myofiber fusion, ETC-dysfunctional MuSCs are retained and available to regenerate de novo tissue embodied by mitochondrial dysfunction (Fig. 8c). Thus, MuSC-myofiber fusion appears to be largely aimed towards preservation of a functional stem cell population, primed to regenerate healthy tissue, despite the decline in overall stem cell numbers. We speculate that the loss of stem cells does not substantially impact an organism’s fitness until it is past reproductive age, and suggest that this mechanism is optimized to promote healthy regeneration in response to injury in younger animals. However, future work will be needed to assess the consequences of contribution of ETC-damaged MuSCs into existing myofibers over long periods of time, which may directly impact the aging process.
In addition, we observe that exercise (running) is sufficient to induce MuSC-myofiber fusion in wild-type mice, and this process can be regulated by systemic anti-oxidant treatment. Reactive oxygen species (induced by exercise) regulate the activation of a number of signaling pathways associated with improved insulin sensitivity and aerobic capacity, as well as muscle hypertrophy47. Indeed, a number of studies have suggested that antioxidant treatment can sometimes inhibit the beneficial effects of exercise training48-53. Our findings suggest that induction of MuSC-myofiber fusion may constitute part of the redox-dependent adaptation to exercise training, and future work will address the role of this phenomenon in contributing to muscle hypertrophy and activation of exercise-associated signaling pathways.
Our findings add to the accumulating literature on the relevance of mitochondrial dysfunction in stem cells. Maintenance of quiescence is well-known to prevent stem cell exhaustion in numerous tissue systems; and quiescent stem cells typically require protective mechanisms to protect them from damage as they age. In response to nuclear DNA damage, stem cells are dependent on DNA repair pathways to maintain functionality54,55. In contrast, mitochondrial DNA damage is not associated with a robust repair mechanism. We find that MuSCs retain a unique mechanism to cope with ETC-deficiency, and it will be intriguing to investigate whether other stem cell compartments respond to mtDNA damage in distinctive manners, and how this mechanism interplays with other quality control organelle mechanisms (e.g., mitophagy). A recent report from in vitro cultured mammary stem cells suggests that young mitochondria are preferentially sequestered into daughter cells to promote stemness, while retention of old mitochondria promotes differentiation56, and our findings add to the general model that damaged mitochondria hamper maintenance of a quiescent stem cell population.
The identification of Scinderin as a specific regulator of MuSC-myofiber fusion allows the dissection of MuSC-myofiber fusion separately from MuSC-MuSC fusion events (associated with injury-induced regeneration). Indeed, our results suggest that MuSC-myofiber fusion requires the low levels of Myomaker found in quiescent MuSCs, although it is possible that Myomaker expression is induced immediately prior to fusion. Our data thereby indicate that there are mechanistic differences between these two modes of cell fusion, and it will be important in the future to evaluate the biophysical differences in membrane dynamics therein. More generally, the observation that dysfunctional stem cells are induced to fuse with existing tissue suggests opportunities to target age-associated pathology via regulation of stem cell-tissue fusion events.
Methods
Mice
Throughout this study, all genotypes refer to animals with conditional (floxed, ‘f’) alleles, targeted to the muscle stem cell (MuSC) population. Cox10f/f (strain 024697), Pax7-CreERT2(FAN) (strain 012476), Pax7-CreERT2(KARDON) (strain 017763), C57BL/6 (strain 000664), tdTomatof/f (strain 007914) and mito-Dendra2f/f (strain 018385) were purchased from The Jackson Laboratory. For lineage tracing experiments, we exclusively used the Pax7-CreERT2(Kardon) allele, as the Pax7-CreERT2(Fan) displayed leaky recombination in the absence of tamoxifen. The generation of Qpcf/f, Tfamf/f, Mymkf/f and Scinf/f conditional knockout mice are described here31,41,42,57.
The Ndufa9f/f conditional knockout mouse was generated at the Children’s Research Institute Mouse Genome Engineering Core utilizing the Easi-CRISPR workflow58. sgRNAs surrounding exon 4 of Ndufa9 were selected by cross-referencing CHOPCHOP, the MIT CRISPR Design Website, and the CRISPR/Cas9 guide checker tool (Integrated DNA Technologies) (Supplementary Figure 1a). CRISPR/Cas9 crRNAs and the Megamer® ssDNA fragment homology-directed repair template were purchased from Integrated DNA Technologies. Animals were screened for insertion of the conditional allele by PCR and correct targeting was confirmed by Sanger sequencing. Genotyping primers for Ndufa9f/f mice are provided in Supplementary Table 3.
All mice were maintained on C57BL6 backgrounds, except Ndufa9f/f which was on a mixed background. Both male and female mice were used in all experiments; sex specific differences were not present, and male and female mice were analyzed together. 6-8 week old mice were used for all experiments, except figures 6 and 7, where ages are indicated. All mice were housed in the Animal Resource Center at the University of Texas Southwestern Medical Center under a 12 hr light-dark cycle and were fed ad libitum. All animal protocols were approved by the University of Texas Southwestern Institutional Animal Care and Use Committee (protocol 101323), and all relevant guidelines were adhered to while carrying out this study.
Generation and characterization of Ndufa9f/f mouse embryonic fibroblasts
E13.5 embryos were collected from Ndufa9f/f or wild-type pregnant females following carbon dioxide asphyxiation and cervical dislocation. Embryos were dissected to remove the head and red organs, minced with a sterile scalpel, and digested with trypsin for 45 min at 37°C. Digested embryos were subsequently collected in DMEM (Sigma-Aldrich, #D6429) with 10% FBS, 2 mM L-glutamine, and 1% penicillin/streptomycin and plated to tissue culture flasks that were pre-treated with gelatin (10 ml 0.1% gelatin/H2O solution/75 cm2 surface area for 1 hour at 37°C). Ndufa9+/+ or Ndufa9f/f MEFs were immortalized by transduction with lentiCRISPRv2 expressing an sgRNA targeting Trp53 at a MOI of ~0.5 (visual estimation) and subsequently selected with 5 μg/mL puromycin for 4 days. Approximately 5 x 10⁶ immortalized MEFs were incubated in 1 ml media with 25 μl Ad5-CMV-EGFP or Ad5-CMV-CreEGFP adenovirus (University of Iowa Viral Vector Core; VVC-U of Iowa-4 and VVC-U of Iowa-1174, respectively) for 10min at room temperature before being plated to tissue culture dishes. After transduction with EGFP or CreEGFP adenovirus, MEFs were continuously cultured in media containing 1mM sodium pyruvate and 100 μg/mL uridine. 48 hours later, transduced MEFs were sorted at the UT Southwestern Children’s Research Institute Moody Foundation Flow Cytometry Facility and GFP-positive cells were selected. Transduced cells were verified for genotype by PCR analysis (Supplementary Figure 1b) and Western blot (Supplementary Figure 1c).
An Agilent Seahorse XFe96 Analyzer was used for cellular oxygen consumption measurements of Ndufa9+/+ and Ndufa9f/f MEFs (Supplementary Figure 1d). MEFs were plated at 10,000 cells per well in 80 μL media and allowed to adhere overnight. The following day, cells were washed twice with 200 μl/well assay medium (DMEM (Sigma-Aldrich, #D5030) with 10 mM glucose, 2 mM L-glutamine, 1 mM sodium pyruvate, and 1% penicillin/streptomycin) and 150 μl assay medium was added to each well after the second wash. Cells were transferred to a 37°C, CO2-free incubator for 1 hour. Standard calibration and baseline oxygen consumption measurements were performed using a 3 min ‘mix’/3 min ‘measure’ cycle with 3 measurements recorded at baseline and following injection of each compound. The following inhibitors were used: 2 μM oligomycin, 3 μM CCCP and 3 μM antimycinA. Data collection was performed with WAVE (v.2.4.1.1) software.
MuSCs isolation via Fluorescence-activated cell sorting (FACS)
Murine MuSCs isolation was adapted from a published protocol59. Following carbon dioxide asphyxiation and cervical dislocation, skeletal muscle was rapidly dissected and sequential digested with Collagenase II (1 hr) and Dispase (30 minutes) at 37°C. Mononucleated cells were collected through a 70 μm cell strainer, and suspended in HBSS with 2% horse serum (GIBCO, #16050114). Cells were then incubated with the following antibodies on a rotator at 4°C for 30 min: APC-conjugated anti-mouse CD31 (BioLegend, clone MEC13.3, #102510, 1:100), APC-conjugated anti-mouse CD45 (BioLegend, clone 30-F11, #103112, 1:100), PerCP-Cy5.5-conjugated anti-mouse Sca-1 (Invitrogen, Clone D7, #45598182, 1:100), Biotin-conjugated anti-mouse CD34 (Invitrogen, clone RAM34, #13034181, 1:100). After incubation, cells were washed twice, and then incubated with PE/Cy7-conjugated streptavidin (BioLegend, 1:100, #405206) on a rotator at 4 °C for 20 min. Cells were washed twice, and then suspended with 2% horse serum in HBSS with DAPI. Quiescent MuSCs ( Extended Data Fig. 9a ) were identified as the CD34+, CD31−, CD45−, DAPI− and Sca-1−. For isolation of mito-Dendra2-positive cells, mononucleated cells were resuspended with 2% horse serum in HBSS with DAPI, and GFP+, DAPI− cells were isolated. Purity was confirmed by immunofluorescence staining for Pax7. All sorting was performed at the Moody Foundation Flow Cytometry Facility on a FACS Aria flow cytometer (BD Biosciences). Data was collected by FACSDiva (v.8.0.2, BD Biosciences) software, and analyzed using FlowJo (Version10.6.1) software.
ROS and mitochondrial membrane potential (ΔΨm) analysis
For ROS analysis, MuSCs were resuspended in HBSS with 5 μM final concentration Superoxide Detection reagent (total superoxide levels, Enzo Life Sciences, #51010), 5 μM final concentration mitoSOX (mitochondrial superoxide levels, Thermo Fisher, #M36008), or 1 μM final concentration mitoROS (mitochondrial total ROS levels, Cayman Chemical, #701600) and then incubated at 37°C for 30 min. After incubation, cells were washed and resuspended in HBSS with DAPI, followed by immediate FACS analysis.
For mitochondrial membrane potential analysis, MuSCs were isolated at 5 days post the 1st dose of tamoxifen, and resuspended in mitochondrial assay buffer with the indicated mitochondrial substrates and inhibitors (see below for recipes). Cell suspensions were incubated at 37°C for 30 min. After incubation, cells were washed, and then suspended in HBSS with DAPI.
Mitochondrial assay buffer:
220 mM mannitol, 70 mM sucrose, 10 mM KH2PO4, 5 mM MgCl2, 2 mM HEPES, 1 mM EGTA, pH 7.4; supplemented with fresh TMRE (Invitrogen, #T669; final concentration 150 nM) and fresh PMP reagent (Agilent 102504-100; final concentration 3nM).
Pyruvate/malate buffer:
Mitochondrial assay buffer supplemented with 10mM pyruvate and 5mM malate, pH 7.4.
Inhibitor concentrations:
5 μM CCCP, 5 μM rotenone.
RNA isolation and sequencing
Total RNA was purified from FACS-isolated MuSCs using the RNeasy Micro Kit (QIAGEN # 74004) according to manufacturer’s instructions. Library preparation was performed using the SMARTer stranded pico input total RNA-seq kit (Takara, #634411) following manufacturer instructions. Next generation sequencing was performed using an Illumina NextSeq 500 by the Children’s Research Institute’s Sequencing Facility at UT Southwestern Medical Center. RNA-seq analysis was performed on BICF RNASeq Analysis Workflow (ssh://git@git.biohpc.swmed.edu/BICF/Astrocyte/rnaseq.git) provided by the UTSouthwestern Bioinformatics Core Facility. Gene ontology analysis was performed using DAVID (https://david-d.ncifcrf.gov/home.jsp). Summary statistics are provided in Supplementary Table 1 and raw RNA-seq data is available at the NCBI GEO website under accession GSE180867.
mtDNA sequencing and analysis
Total DNA was purified from FACS-isolated MuSCs using the QIAamp DNA Micro kit (Qiagen 56304). mtDNA sequences were enrich by rolling circle amplification using the Repli-G Mitochondrial DNA kit (Qiagen 151023), following manufacturer protocols60. Library preparation was performed using the Nextera XT DNA Library Preparation Kit (Illumina FC-131-1096) following manufacturer instructions. Paired-end sequencing (2x150bp) was performed using an Illumina NextSeq 500 by the Children’s Research Institute’s Sequencing Facility at UT Southwestern Medical Center. Sequencing analysis was performed using an in-house pipeline: Briefly, sequencing reads were checked and trimmed for quality control using FastQC 0.11.8 and TrimGalore 0.6.4. Trimmed reads were mapped to the Mus musculus mitochondrial genome GRCm38 using MapSplice2 2.2.1, then paired-end reads were de-duplicated (Picard 2.23.1) and quality-filtered (SAMtools 1.9.0) to include high-confidence mappings. Per-base sequencing depth and point mutations were assessed using bam-readcount 0.8.0 for the quality-filtered mapped reads. Mean coverage was 7676x (range = 5088x-9601x) (Extended Data Fig. 9b, Supplementary Table 2). To avoid false positives and mtDNA-derived nuclear psueodgenes, variants (substitutions, insertions, deletions) were called when detected on both heavy and light strands with greater than 50 supporting reads and greater than 0.5% allelic frequency. Substitutions displayed a significant bias towards C>T and T>C transitions (Extended Data Fig. 9e), consistent with previous mtDNA mutational signatures observed in human populations 44,61, and were predominantly of low allelic frequency (Extended Data Fig. 9d). Large deletions were determined using the non-canonical junction detection mode of MapSplice2. The deletion frequency was calculated as:
Here, Supports is the number of read pairs supporting a large deletion, and MeanCoverage_by_FullAlignments is the average read depth using all reads that mapped to the region with no detected deletion. Junction coordinates for the deletion were extracted by regtools 0.5.1, and bedtools 2.29.2 was used to calculate MeanCoverage_by_FullAlignments from the non-junction reads. A single large scale deletion was noted (‘7193-8150’, encompassing parts of the Cox2, ATP8, ATP6 and Cox3 genes) in MuSCs from older animals. (Extended Data Fig. 9b (red arc), c).
Statistical analysis of indel and non-synonymous substitutions frequency was performed based on a published method62. Briefly, expected frequencies of indels were calculated based on the relative size of protein-coding (69.88%) and non-protein coding (30.12%) regions in the mouse mitochondrial genome. For expected frequencies of non-synonymous substitutions, we took into account the observed mutational signatures at 18 months and 27 months of age:
| Age | A>C | A>G | A>T | C>A | C>G | C>T | G>A | G>C | G>T | T>A | T>C | T>G |
|---|---|---|---|---|---|---|---|---|---|---|---|---|
| 18mo | .0058 | .18 | .072 | .011. | .00072 | .28 | .097 | .00 | .0058 | .014 | .33 | .00 |
| 27mo | .0044 | .23 | .063 | .0056 | .0015 | .22 | .071 | .00037 | .0030 | .012 | .38 | .00 |
For each of the 13 protein-coding genes, we simulated 300,000 substitutions of the wild-type mouse sequence (extracted from the mouse reference mitochondrial genome: NC_005089) based on the above mutational signature. For each simulation, we calculated the frequency of non-synonymous and synonymous substitutions. Statistical significance of the observed number of protein-coding indels and non-synonymous substitutions was then calculated using a chi-squared test (Fig. 6h,i, Extended Data Fig. 9f). Summary statistics are provided in Supplementary Table 2 and raw mtDNA-seq data is available at the NCBI GEO website under accession GSE180953.
Quantitative real-time PCR
Total RNA was extracted from sorted MuSCs using the RNeasy Micro Kit (QIAGEN #74004) following the manufacturer’s instructions. After RNA isolation, real-time RT-PCR were performed with Luna Universal One-Step RT-qPCR Kit (New England Biolabs, #E3005) following the manufacturer’s protocol, on a CFX384 Real-Time System (SN027118, BioRad). Transcript levels were normalized to Beta-2 microglobulin (B2M) using the 2−ΔΔCT method63. For genomic PCR reactions, genomic DNA was purified from isolated MuSCs using phenol-choloroform extraction. Oligonucleotide sequences are provided in Supplementary Table 3.
Western blot analysis
For C2C12 myoblasts and MEFS, trypsinized cells were spun down, washed with PBS, and resuspended in RIPA buffer (Thermo Scientific, #89900) supplemented with protease inhibitor cocktail (Roche, #11873580001), and put on ice for 30 min. Lysates were spun down at 12,000g at 4°C for 10 min. Protein concentrations were quantitated with the DC protein assay (Bio-Rad, #5000112). For MuSCs, 50,000 FACS-isolated cells were collected in PBS, spun down and resuspended in 50μL RIPA buffer, and processed as above. The following antibodies were used: Cox10 (Abcam, #ab84053, 1:1000), Qpc (Proteintech, #14975-1-AP, 1:1000), TFAM (Santa Cruz Biotechnology, #sc-166965, 1:1000), Scin (Santa Cruz Biotechnology, #sc-376136, 1:1000), Ndufa9 (Thermo Fisher, #459100, 1:2000), cleaved Caspase-3 (Cell Signaling Technology, #9664, 1:1000), β-actin (Cell Signaling, #4970, 1:5000) and Histone H2B (Santa Cruz Biotechnology, #sc-515808, 1:1000). Uncropped western blot images are provided in Supplementary Figures 2,3.
Mouse injections
Tamoxifen (TMX, Cayman Chemical, #132585) was dissolved in corn oil (Sigma-Aldrich, #C8267). For most experiments, 75mg/kg body mass was administered by intraperitoneal injection to 6-8-week-old mice, once per day for 5 consecutive days. For experiments in Extended Data Fig. 2, a single dose of 200mg/kg body mass of tamoxifen was administered by intraperitoneal injection to 6-8-week-old mice. Mice were euthanized and tissue harvested at various timepoints after tamoxifen administration (3 hr to 9 months) as indicated.
For buthionine sulfoximine (BSO, Cayman Chemical, #14484500) administration experiments, mice were first treated with tamoxifen for 5 days (as above). Starting the day after the 5th tamoxifen administration, BSO was administered at 4 mmol/kg body mass, once per day by intraperitoneal injection for 21 days. Mice were then euthanized and tissue harvested for analysis.
Antioxidants were administered as follows:
N-acetylcysteine (NAC, Sigma-Aldrich, # A7250, 200mg/kg/day), Trolox (Sigma-Aldrich, #238813, 50mg/kg/day), mitoquinone (MitoQ, Biovision, #B1309, 10mg/kg/day), or mitoTEMPO (Cayman Chemical, #1662125, 1mg/kg/day). Mice were treated with antioxidants once per day by intraperitoneal injection, for 7 days. On days 3-7, TMX (75mg/kg) was administered by intraperitoneal injection, once per day. Mice were euthanized and tissue harvested 1 day after the 5th dose of tamoxifen (7th dose of antioxidant).
Muscle injury experiments
For cryoinjury experiments, 6-8 week old mice were pretreated with tamoxifen (75mg/kg IP injection, once per day, 5 days) as above. 2 days following the last tamoxifen injection, a cryoinjury protocol was performed: Mice were anesthetized with isoflurane. A single incision was made in the skin overlying the tibialis anterior (TA), and a metal probe (0.5mm diameter) was cooled in liquid nitrogen, and then applied directly onto the exposed TA for 10 sec. Following the cryoinjury, the wound was closed with size 7-0 polyamide threads (Ethicon, #1647G). Postoperative analgesia (meloxicam, Sigma-Aldrich, # M3935, 2 mg/kg/24 h,) was administered subcutaneously once per day for two days. Mice were euthanized and tissue harvested between 2 and 14 days post injury as indicated.
For barium chloride (BaCl2, Alfa Aesar, #0361-37-2) injury experiments, 6-8 week old mice were pretreated with tamoxifen (75mg/kg IP injection, once per day, 5 days) as above. 2 days following the last tamoxifen injection, a muscular BaCl2 injury was administered: Mice were anesthetized with isoflurane. TA muscles were directly injected with 50 μl of 1.2 % BaCl2 (in sterile saline) using a sterile 29-gauge needle. Postoperative analgesia (meloxicam, 2 mg/kg/24 h, Sigma-Aldrich) was administered subcutaneously once per day for two days. Mice were euthanized and tissue harvested between 2 and 21 days post injury as indicated.
Treadmill running experiments
For long distance running experiments, mice were randomized to different treatment groups (sedentary, exercise + PBS, exercise + antioxidant). Mice were first administered tamoxifen for 5 days (as described above). On the day after the 5th tamoxifen administration, mice were acclimated to the treadmill (Columbus Instruments) by running 30 min/day for 3 days at slow speeds (up to 10m/min). After the acclimation period, mice were run daily on a treadmill with mild electrical stimulus and 0° inclination. The treadmill speed was set at 15 m/min, and the running was conducted 30 min/day for 6 days/week for 4 weeks. Exercised mice were treated with subcutaneous injection of NAC (200 mg/kg/day), Trolox (50mg/kg/day), mitoquinone (10mg/kg/day), mitoTEMPO (1mg/kg/day) or PBS, 6 hours prior to each treadmill run.
TA muscle force measurement in situ
TA muscle force was measured using the following protocol (http://www.treat-nmd.eu/downloads/file/sops/dmd/MDX/DMD_M.2.2.005.pdf) in animals at 21 days post-BaCl2 injury. Briefly, mice were anesthetized with isoflurane, and the hindlimb was secured. The sciatic nerve was exposed in the posterolateral thigh and clamped to a custom electrode. The TA muscle was exposed, and the distal tendon was severed and attached to a force transducer via a suture (Grass Instruments, #FT03-E). During measurement, the TA muscle and nerve were kept moist with 37°C saline. The TA muscle was stimulated via the sciatic nerve using a pulse generator (Siglent Technologies, #SDG2042X), and the resulting force output from the force transducer was recorded via a digital acquisition board (Dataq Instruments, #DI-1110) using WinDaq software (v.3.0.7). The stretched muscle length was optimized to achieve maximal force, followed by optimization of supramaximal stimulation voltage (typically 3-4V) and pulse duration (typically 0.3-0.4 msec). Maximal twitch force was collected for 8-10 trials, and was normalized by muscle cross-sectional area. Following measurement of twitch force, the force-frequency relationship was measured over stimulation frequencies from 5-125 Hz, at supramaximal stimulation. Data was analyzed and plotted in MATLAB (Mathworks, Inc.).
Skeletal muscle clearing and deep tissue imaging
The PEGASOS tissue clearing method64 was used for whole mount muscle clearing prior to deep tissue imaging. Mice were anesthetized, transcardially perfused with 50 ml ice-cold heparin PBS and then 50 ml 4% PFA. Muscles were dissected, immersed in 4% PFA at room temperature for 24hr. Subsequently, samples were incubated with decolorization solution (25% (v/v in H2O) Quadrol (Sigma–Aldrich; #122262) for two days at 37°C with gentle shaking. Next, delipidation was performed at 37°C with gentle shaking using a gradient of tert-Butanol solutions over 2 days:
30% tert–Butanol (tB, Sigma–Aldrich, #471712) solution (70% v/v H2O, 27% v/v tB, 3% w/v Quadrol)
50% tB solution (50% v/v H2O, 47% v/v tB, 3% w/v Quadrol)
70% tB solution (30% v/v H2O, 67% v/v tB, 3% w/v Quadrol).
Next, samples were immersed into dehydration solution consisting of 70% tB, 27% (v/v) poly(ethylene glycol) methyl ether methacrylate average Mn500 (PEG MMA500) (Sigma–Aldrich, #447943) and 3% (w/v) Quadrol at 37°C for 2 days. Samples were then incubated in clearing medium (75% (v/v) benzyl benzoate (BB, Sigma–Aldrich; B6630), 22% (v/v) PEG MMA500 and 3% (w/v) Quadrol) at 37°C with gentle shaking until they achieved fully transparency. Muscles were imaged on a Zeiss LSM780 Inverted confocal microscope, and data was collected with Zeiss Zen (v.14.0.0.201) software. Imaris software (Bitplane) was used to create Supplementary Movies 1-3.
Mito-Dendra2 and tdTomato myofiber domain imaging
Myofiber domains were imaged and quantitated similar to previous studies25. Briefly, acutely dissected skeletal muscle was immediately fixed in formalin for 3-4 hours at room temperature, followed by overnight at 4°C. Muscles were rinsed with PBS and then mounted in a glass bottom dish (MatTek, # P35G-1.5-14-C). Muscles were imaged using a Zeiss LSM780 Inverted confocal microscope and analyzed with ImageJ software.
Histology analysis of skeletal muscle
Following carbon dioxide asphyxiation and cervical dislocation, the indicated skeletal muscles were rapidly dissected, and then freshly frozen in liquid nitrogen cooled 2-methylbutane, before embedding in O.C.T compound (Fisher Scientific, # 23-730-571). 10 μM sections were cut on a cryostat (Leica CM3050S). For H&E staining, slides were prepared following the protocol from the TREAT-NMD website (http://www.treat-nmd.eu/downloads/file/sops/cmd/MDC1A_M.1.2.004.pdf). For COX/SDH staining, slides were stained for COX activity and SDH activity based on standard operating protocols (https://neuromuscular.wustl.edu/pathol/histol/cox.htm; https://neuromuscular.wustl.edu/pathol/histol/SDH.pdf). β-Galactosidase staining was performed using a β-Galactosidase staining kit (Cell Signaling Technology, #9860), following manufacturer’s instructions. Sections were imaged using an Olympus IX83 microscope and analyzed with Image J software (NIH) to calculating myofiber numbers, and COX/SDH intensity.
Immunofluorescence protocols
For muscle sections, freshly frozen 10 μm sections (prepared as above) were fixed in formalin at room temperature for 5 min and then blocked with blocking buffer (0.25% Triton X-100(Sigma-Aldrich, #X100) and 10% goat serum (GIBCO, # 16210064) in PBS at room temperature for 1 hour. Sections were incubated with primary antibodies diluted in blocking buffer at 4°C overnight. On the second day, sections were washed with PBS and then incubated with secondary antibodies diluted in blocking buffer at room temperature for 1 hour. Sections were stained with DAPI diluted in PBS, and then washed with PBS and mounted with fluoro-gel mounting medium (Electron Microscopy Sciences, #1798510).
For C2C12 staining, cells were fixed in formalin at room temperature for 5 min and then blocked with blocking buffer at room temperature for 1 hour. Cells were incubated with primary antibodies diluted in blocking buffer at 4°C overnight. On the second day, cells were washed with PBS and then incubated with secondary antibodies diluted in blocking buffer at room temperature for 1 hour. Cells were stained with DAPI diluted in PBS, and then washed with PBS and mounted with fluoro-gel mounting medium.
Single myofiber isolation was performed based on a published protocol65. Briefly, EDL or soleus muscles were digested with 2mL Collagenase I solution (2 mg/ml of Collagenase type I (Worthington, #CLS-1) in F-10 medium) for 1 hr at 37°C, and then triturated by hand with a wide-bore pipette to release single fibers. Fibers were fixed with formalin for 10 minutes at room temperature, followed by blocking buffer (PBS, 10% goat serum, 0.25% Triton X-100) for 1 hr at room temperature, and primary antibody (diluted in blocking buffer) overnight at 4°C. On the second day, fibers were washed with PBS, incubated with secondary antibodies (diluted in blocking buffer) for 1 hr at room temperature, and mounted with fluoro-gel mounting medium on glass slides.
Muscle sections, single myofibers and C212 cells were imaged using a Zeiss LSM780 Inverted confocal microscope and analyzed using ImageJ software. For single myofiber analysis, longitudinal mito-Dendra2 profiles were calculated in ImageJ and aligned in MatLab (Mathworks, Inc.). The following antibodies were used: Pax7 (AB528428, 2μg/mL), MYH3 (BF-45, 2μg/mL), Myogenin (F5D, 2μg/mL), MYH (MF20, 2μg/mL) (all from Developmental Studies Hybridoma Bank), MyoD (Santa Cruz Biotechnology, #sc-377460, 1:500), Laminin (Sigma-Aldrich, #L9393, 1:500), Ki67 (Abcam, #ab15580, 1:500), Tomm20 (Proteintech, #11802-1-AP, 1:500), Myosin Heavy Chain type I (Sigma, #M8421, 1:500), Myosin Heavy Chain type II (Sigma, #M4276, 1:500), Cleaved Caspase 3 (Cell Signaling Technology, #9664, 1:500), HA (Abcam, #ab9110, 1:500), Alexa Fluor 594 goat anti-mouse IgG2b (#A21145, 1:500), Alexa Fluor 594 goat anti-mouse IgG1 (#A21125, 1:500), Alexa Fluor 488 goat anti-rabbit IgG(H+L) (#A11034, 1:500), Alexa Fluor 594 goat anti-rabbit IgG(H+L) (#A11012, 1:500) and Alexa Fluor 647 goat anti-mouse IgG2b (#A21242, 1:500) (all from Invitrogen). TUNEL staining was performed using the Click-iT™ Plus TUNEL Assay kit (Invitrogen, #C10618).
Retroviruses generation and infection
Mouse Scin cDNA (obtained from transOMIC technologies) or Cox4-DsRed (Addgene, # 23215) were cloned into the retroviral vector pQCXIP (Clontech, #631516). 3μg pQCXIP-empty vector or pQCXIP-Scin-HA or pQCXIP-Cox4-DsRed plasmids with 1 μg pCL-Eco (Addgene, # 12371) plasmids were transfected using PEI (Polysciences, #24765-1) into HEK293T (ATCC, #CRL-11268) at 80% confluence in a 6-well plate. 48 hours post- transfection, viral medium was collected and filtered through a 0.45 μm filter.
For C2C12 myoblasts, cells were plated the day prior to infection at 30% confluence, and infected with viral mixture containing polybrene (Sigma-Aldrich, #H9268, 6 μg/ml) for 24 hours. Infected cells were selected with 2 μg/ml puromycin. After C2C12 cell line infection with Cox4-DsRed, DsRed-positive cells were sorted using FACS Aria flow cytometer (BD Biosciences).
For primary MuSCs infection, 10,000 freshly isolated MuSCs were plated in 96-well plate with growth medium (Ham’s F-10 (HyClone, #SH30025.01) with 10% horse serum, 1% penicillin-streptomycin and 2.5 ng/ml bFGF (PEPROTECH, # 100–18B) overnight. MuSCs were overlaid with viral supernatant for 24h, and then transferred to wells containing 4-day C2C12 myotubes (see in vitro fusion assay below).
In vitro MuSC fusion assay
For the MuSC-myotube fusion assay, DsRed-positive C2C12 myoblasts were first cultured in growth medium (DMEM with 10% fetal bovine serum and 1% penicillin-streptomycin) in an 8-well chamber slide (Thermo Scientific, #177445). When the confluence reached 90%, the culture medium was replaced with differentiation medium (DMEM with 2% horse serum and 1% penicillin-streptomycin) for 4 days to induce myotube formation. 10,000 Dendra+ MuSCs (isolated at t=5 days post the 1st dose of tamoxifen) were then overlaid on myotube-containing wells. After incubation for an additional 4 days, cells were fixed and stained for Myosin and DAPI, and the myotube fusion index was calculated as the fraction of myotube (Myosin+) nuclei which also contain Dendra2 signal.
For the in vitro differentiation (MuSC-MuSC fusion) assay, 100,000 freshly isolated MuSCs were plated in an 8-well chamber slide (Thermo Scientific, #177445) with growth medium (Ham’s F-10 (HyClone, #SH30025.01) with 10% horse serum, 1% penicillin-streptomycin and 2.5 ng/ml bFGF (PEPROTECH, # 100-18B) for 24 hours. The media was then switched to differentiation medium (DMEM with 2% horse serum, 1% penicillin-streptomycin) for 4 days. Cells were fixed and stained for Myosin and DAPI, and the fusion index was calculated as the fraction of total nuclei in Myosin+ myotubes, based on published methods26.
Statistical Analysis
All data are represented as median and interquartile range box plots; whiskers are plotted using the Tukey method. All data are from biological replicates. No statistical tests were used to predetermine sample size. Data sets for each group of measurement was tested for normality using the Shapiro-Wilk test. If the data was not normally distributed, the data was log-transformed and retested for normality. For normally-distributed data, groups were compared using the two-tailed Student’s t-test (for 2 groups), or one-way ANOVA or two-way ANOVA (> 2 groups), followed by Sidak’s, Tukey’s or Dunnett’s test for multiple comparisons. For data that was not normally distributed, we used non-parametric testing (Mann-Whitney or Kolmogorov-Smirnov tests for two groups and Kruskal-Wallis test for multiple groups), followed by Dunn’s multiple comparisons adjustment. For analyzing observed frequencies of protein-coding indels and non-synonymous substitutions and fiber type specific analysis, a chi-squared test was used. Multiple independent experiments with biological replicates were performed for all reported data, and the number of biological replicates are indicated in the figures.
Extended Data
Extended Data Figure 1: Cox10 deletion in MuSCs results in defective muscle regeneration.
a, Cox10 transcript and protein in MuSCs 5 days post 1st dose of tamoxifen. H2B: Histone2B. b, MuSC TMRE profiles in the indicated buffers. Each column represents MuSCs from an individual animal. pyr/mal, pyruvate/malate. rot, rotenone. c, Mitochondrial genome content (mtDNA/nDNA) and mass (Mitotracker (MT) DeepRed) in MuSCs at 5 days post 1st dose of tamoxifen. nDNA: nuclear DNA. d, Representative MuSC FACS profiles at 5 days post 1st tamoxifen dose. The CD34+ frequency is reported as a percentage of CD31−CD45−DAPI− cells. e, Histology (H&E) of TA muscle cross-sections subject to cryoinjury. dpi, days post injury. f, Immunofluorescence of Myog (red), Laminin (green), and DAPI (blue) from TA muscle cross-sections 2 days post-cryoinjury. g, Immunofluorescence of MYH3 (red), laminin (green), and DAPI (blue) from TA muscle cross-sections 5 days post-cryoinjury. h, Quantitation of Myog+ cells (2 days post cryoinjury) and MYH3+ fibers (5 days post cryoinjury), normalized to muscle area. i, CD34+ MuSC (as a percentage of CD31−CD45−DAPI− cells assessed at 5 days post 1st tamoxifen dose. j, Pax7+ MuSC numbers (normalized to muscle area) from TA muscle cross-sections at timepoints after a single tamoxifen dose. p-values reflect comparisons with 0hr data for each genotype. k, Histology (H&E) of TA muscle cross-sections at 5 days post cryo-injury. l, Histology (H&E) of TA muscle cross-sections at 5 days post-BaCl2 injury. m, mRNA transcripts at 5 days post 1st tamoxifen dose. Statistical significance was assessed using two-tailed Mann-Whitney (a), two-tailed t-test (c,h,i), or two-way ANOVA (j,m) tests, with adjustments for multiple comparisons. Box plots indicate median values and interquartile ranges; whiskers are plotted using the Tukey method. The number of biological replicates per group is indicated. All scale bars are 50μm. Experiments were repeated 3x (panel e), 6x (panel f), 8-10x (panel g), and 3x (panels k,l); all with similar results.
Extended Data Figure 2: Cox10−/− MuSCs rapidly deplete following a single dose of tamoxifen.
a, Schematic of tamoxifen administration protocol used in this figure: A single, high-dose tamoxifen (TMX) administration to induce recombination and Cox10 deletion. b, Quantitation of Dendra2+ mononuclear cells at the indicated timepoints post-tamoxifen administration, in wild-type reporter mice (Pax7-CreERT2(KARDON); Df/f;). Mean and standard deviation (error bars) are indicated. c, PCR-based genotyping of unrecombined mito-Dendra2 allele (Dflox; expected size 265bp) and recombined mito-Dendra2 allele (Dex; expected size 645bp) in isolated MuSCs at the indicated timepoints post-tamoxifen administration. d, Cox10 levels in isolated MuSCs from Cox10−/− mice, at the indicated timepoints post tamoxifen administration. Histone 2B (H2B) are shown as a loading control. e, MuSC frequency at indicated timepoints post-tamoxifen administration in mice with Cox10f/f or Cox10−/− MuSCs. p-values reflect comparisons with t=0 hr data for each genotype. f, Pax7+ cell numbers (normalized to muscle area) at different times post-tamoxifen administration. p-values reflect comparisons with t=0 hr data for each genotype. g, Representative images of endogenous Pax7+ cells (red), laminin (green) and DAPI (blue) from tibialis anterior (TA) cross-sections of indicated mice at indicated timepoints post-tamoxifen administration. Scale bar, 50 μm. Statistical significance was assessed using two-way ANOVA (e,f) tests, with adjustments for multiple comparisons. Box plots indicate median values and interquartile ranges; whiskers are plotted using the Tukey method. The number of biological replicates per group is indicated in the figure. Experiments were repeated 4 times for panel g, with similar results.
Extended Data Figure 3: Cox10−/− MuSCs do not display features of activation or premature differentiation.
a, Histology (H&E) of TA muscle cross-sections from animals of the indicated genotype, at different timepoints following a single dose of tamoxifen. b, Ki-67 (green) and DAPI (blue) staining of TA muscle cross-sections from animals, as described in (a). The positive control is from a wild-type animal at 2 days post cryoinjury. c, Same as b, but MYH3 (red) and DAPI (blue) staining. The positive control is from a wild-type animal at 5 days post cryoinjury. d, Same as b, but Myogenin (red) and DAPI (blue) staining. The positive control is from a wild-type animal at 2 days post cryoinjury. All scale bars are 50 μm; insets are magnified 3x. Experiments were repeated 3 times for panel a-d, with similar results.
Extended Data Figure 4: Cox10−/− MuSCs do not display features of senescence or apoptosis.
a, MyoD (red) and DAPI (blue) immunofluorescent staining of TA muscle cross-sections from animals of the indicated genotype, at different timepoints following a single dose of tamoxifen. The positive control is from a wild-type animal at 2 days post cryoinjury. b, Same as a, but TUNEL (red) and DAPI (blue) staining. For the positive control, a wild-type TA muscle cross-section was treated with DNase. c, Same as a, but β-galactosidase staining. d, Same as a, but Cleaved Caspase-3 staining (red) and DAPI (blue) staining. e, Cleaved Caspase-3 levels in MuSCs of the indicated genotype at 48hr post-tamoxifen, assessed by western blot. Histone 2B (H2B) is shown as a loading control. The positive control is protein extract from Cox10f/f MuSCs treated with cytochrome c (0.25mg/mL for 1hr at room temperature) to induce Caspase-3 cleavage. All scale bars are 50 μm; insets are magnified 3x. Experiments were repeated 3 times for panel a-d, with similar results.
Extended Data Figure 5: Cox10−/− MuSCs fuse into neighboring myofibers.
a, Representative immunofluorescence images from soleus muscles of Cox10−/− animals at 7 days post-the 1st dose of tamoxifen. mito-Dendra2+ fibers are labeled in green; type I (slow) fibers are labeled in red based on myosin heavy chain staining. Scale bar, 50 μm. b, Same as (a), but instead type II (fast) fibers are labeled in red based on myosin heavy chain staining. Scale bar, 50 μm. c, Quantitation of MuSC-myofiber fusion into type I and type II fibers from n=4 Cox10−/− animals. Each fiber was classified based on fiber type (type I vs. type II) and Dendra2 positivity, and the number of fibers in each category are indicated. The chi-squared statistic and p-value are indicated. d, Representative immunofluorescent images of isolated single myofibers from Cox10−/− animals. Mito-Dendra2 domains are colored green; total mitochondrial content is imaged based on Tomm20 staining (red). Scale bar, 50 μm. e, Representative images of myofiber segments containing mito-Dendra2 domains (green). Tomm20 staining for mitochondrial content is shown in red. Scale bar, 50 μm. f, Mean fluorescent profiles and standard error envelopes for aligned mito-Dendra2 domains (green), and mitochondrial content in these regions (based on Tomm20 staining, red), for n=15 fibers. AU, arbitrary units. Experiments were repeated 4 times for panel a,b, and 15 times for panels d,e; with similar results.
Extended Data Figure 6: Myomaker is required for MuSC-myofiber fusion.
a, Dendra2+ fiber numbers (normalized to muscle area) in TA and soleus muscles of the indicated genotypes at different times post the 1st dose of tamoxifen. b, mito-Dendra2+ domain number (normalized to muscle area) in TA and soleus muscles of the indicate genotype at different post a single-high dose of tamoxifen, based on protocol in EDF 2a. c, Longitudinal imaging of tdTomato signal in TA and soleus muscles of the indicated genotype at 21 days post the 1st dose of tamoxifen administration. Scale bar, 200 μm. d, tdTomato domain number (normalized to muscle area) in myofibers of TA and soleus muscles at 21 days post the 1st dose of tamoxifen. e, Fusion indices in wt and Cox10−/− MuSCs subjected to in vitro differentiation. f, Cox10 and Myomaker (Mymk) transcript levels (normalized to β2-microglobulin) in isolated MuSCs of the indicated genotype at 5 days after the 1st dose of tamoxifen. g, Longitudinal images of mito-Dendra2 signal in TA and soleus muscles of mice of the indicated genotype, 21 days after the 1st dose of tamoxifen. Scale bar, 200 μm. h, Pax7+ cell numbers (normalized to muscle area) in TA muscle cross-sections of mice of the indicated genotype at 21 days after the 1st dose of tamoxifen. i, Relative mean TMRE fluorescence in isolated MuSCs of the indicated genotype, incubated with the indicated substrates and inhibitors. pyr/mal, pyruvate/malate. j, Relative mean superoxide levels in isolated MuSCs of the indicated genotype. Statistical significance was assessed using two-way ANOVA (b), Kruskal-Wallis (a,i), two-tailed t-test (d,e), or one-way ANOVA (f,h,j) tests, with adjustments for multiple comparisons. Box plots indicate median values and interquartile ranges; whiskers are plotted using the Tukey method. The number of biological replicates per group is indicated in the figure. Experiments were repeated 6 times for panels c,g, with similar results.
Extended Data Figure 7: Reactive oxygen species regulate MuSC-myofiber fusion.
a, Ndufa9, Qpc and Tfam levels in MuSCs at 5 days post 1st tamoxifen dose. H2B: Histone2B. b, Mean MuSC TMRE levels in the indicated buffers. pyr/mal, pyruvate/malate. c, MuSC frequency (mito-Dendra2+ cells as a percentage of DAPI− mononuclear cells) at 5 days post 1st tamoxifen dose. p-values reflect comparisons with wt. d, Mean MuSC mitochondrial superoxide and mitochondrial total ROS (mitoROS) levels at 5 days post 1st tamoxifen dose. p-values reflect comparisons with wt. e, Mean MuSC superoxide levels from mice treated with vehicle (PBS) or N-acetylcysteine (NAC) at 5 days post 1st tamoxifen dose. f, Mean MuSC mitochondrial superoxide and mitoROS levels at 5 days post 1st tamoxifen dose, from mice treated with PBS or the indicated antioxidant. p-values reflect comparisons with wt. g, mito-Dendra2 domain numbers (normalized to muscle area) in muscle at 5 days post 1st tamoxifen dose from mice treated with the indicated antioxidants (or PBS). p-values reflect comparisons with ‘PBS’. h, Mean MuSC superoxide levels from wild-type mice treated with vehicle (PBS) or BSO for 21 days. i, MuSC frequency (Pax7+ cell number or CD34+ frequency) in wild-type mice treated with vehicle (PBS) or BSO for 21 days. j, Mean MuSC mitochondrial superoxide and mito ROS levels from sedentary (SED) or exercised (EXE) wild-type animals treated with PBS or the indicated antioxidant. p-values reflect comparisons with ‘SED’. k, mito-Dendra2 domain numbers (normalized to muscle area) in muscle of sedentary (SED) or exercised (EXE) mice treated with the indicated antioxidants (or PBS). p-values reflect comparisons with ‘SED’. Statistical significance was assessed using one-way ANOVA (c,d,f,j,k), two-way ANOVA (b,e,g), or two-tailed t-tests (h,i), with adjustments for multiple comparisons. Box plots indicate median values and interquartile ranges; whiskers are plotted using the Tukey method. The number of biological replicates per group is indicated in the figure.
Extended Data Figure 8: Scinderin is required for MuSC-myofiber fusion.
a, Histology (H&E) from TA cross-sections at 5 days post BaCl2 injury. b, Immunofluorescence of TA cross-sections, 5 days post BaCl2 injury, stained for MYH3 (red), Laminin (green), and DAPI (blue). c, MYH3+ regenerative myofibers (normalized to muscle area) at 5 days post BaCl2 injury. d, Fusion indices in MuSCs subjected to in vitro differentiation. e, Cox10 and Scin transcript levels (normalized to β2-microglobulin) in MuSCs at 5 days post 1st tamoxifen dose. f, MuSC superoxide levels at 5 days post 1st tamoxifen dose. g, Mean MuSC TMRE fluorescence in the indicated conditions. pyr/mal, pyruvate/malate. h, mito-Dendra2 domain numbers (normalized to muscle area) in muscle of PBS or BSO-treated mice (for 21 days). i, mito-Dendra2 domain numbers (normalized to muscle area) in muscle of sedentary (SED) or exercised (EXE) mice. j, Representative traces of maximal twitch force from TA muscle at 21 days post-BaCl2 injury. k, Specific force for maximal twitch from TA muscles at 21 days post-BaCl2 injury. l, Representative traces of tetanic force generation from TA muscles (at 21 days post-BaCl2 injury) subjected to a 20Hz stimulus. m, Force-frequency relationship from TA muscles at 21 days post-BaCl2 injury. Statistical significance was assessed using two-tailed t-test (c,d,k), Kruskal-Wallis (h), one-way ANOVA (e,f), or two-way ANOVA (g,h,i,m) tests, with adjustments for multiple comparisons. Box plots indicate median values and interquartile ranges; whiskers are plotted using the Tukey method. The number of biological replicates per group is indicated. All scale bars are 50 μm. Experiments were repeated 3x (panel a), 6x (panel b); all with similar results.
Extended Data Figure 9: Aging MuSCs accumulate mtDNA mutations.
a, Representative images for FACS isolation of murine MuSCs. Cells were first gated by forward scatter (FSC) and side scatter (SSC) to remove doublets. MuSCs were identified by negative gating for DAPI, CD31, CD45, Sca1, and positive gating for CD34. b, Read depth across the mitochondrial genome for all samples (gray traces), displayed using a log2 scale. Average read depth for all samples shown in orange. The red arc indicates the position of the common “7193-8950” deletion. c, Deletion frequency of the “7193-8950” deletion detected in MuSCs from mice of the indicated age. n.d, not detected. d, Histogram of allelic frequencies for all detected mtDNA mutations in MuSCs from 18 month old and 27 month old mice. The number of identified mutations is indicated. e, Mutational signature of mtDNA substitutions in MuSCs from 18 month old and 27 month old mice. f, The observed frequencies of non-synonymous substitutions in each mtDNA gene from isolated MuSCs of 27 month old mice. The expected frequency is indicated as the dashed red line. p-values are calculated from chi-squared test. Box plots indicate median values and interquartile ranges; whiskers are plotted using the Tukey method. The number of biological replicates per group is indicated in the figure.
Extended Data Figure 10: MuSC-myofiber fusion regulates MuSC numbers during aging.
a, Quantitation of MuSC frequency (CD34+ %) in mice of the indicated genotypes and ages. b, Normalized TA muscle weight at 21 days post-BaCl2 injury in mice of the indicated genotypes and ages. Statistical significance was assessed using two-way ANOVA (a,b) tests, with adjustments for multiple comparisons. Box plots indicate median values and interquartile ranges; whiskers are plotted using the Tukey method. The number of biological replicates per group is indicated in the figure.
Supplementary Material
Supplementary movie 1: Three-dimensional imaging of mito-Dendra2 signal from a wild-type (wt) mouse after tissue clearing.
Supplementary movie 2: Three-dimensional imaging of mito-Dendra2 signal from a Cox10−/− mouse after tissue clearing.
Supplementary movie 3: Three-dimensional imaging of mito-Dendra2 signal from a Ndufa9−/− mouse after tissue clearing.
ACKNOWLEDGEMENTS
We thank the Moody Foundation Flow Cytometry Facility for assistance with FACS experiments, the Children’s Research Institute Next Generation Sequencing Facility for assistance with RNA-seq experiments, the Children’s Research Institute Mouse Genome Engineering Core, the UTSouthwestern Live Cell Imaging Facility, the BioHPC supercomputing facility, and Eric Olson for providing Mymkf/f mice. We thank Rhonda Bassel-Duby, Ralph DeBerardinis, Sean Morrison, Eric Olson, Hao Zhu and members of the Mishra laboratory for helpful discussions and suggestions during this project. This work was supported by funding from the United Mitochondrial Disease Foundation (Research Grant to P.M.), the National Institutes of Health (1DP2ES030449-01 from NIEHS, 1R01AR073217-01 from NIAMS to P.M., T32-GM007062 to A.F., 1F31-DK122676 from NIDDK to N.P.L.), the Moody Medical Research Institute (Research Grant to P.M.), the Cancer Prevention & Research Institute of Texas (Scholar Award RR140084 to D.G.M), the Damon Runyon Cancer Research Foundation (Clinical Investigator Award 102-19 to D.G.M.), the National Science Foundation (GRFP award 2019281210 to S.D.S.) and UT Southwestern Medical Center (DOCS Award to D.G.M.). The funders had no role in study design, data collection and analysis, decision to publish or preparation of the manuscript.
Footnotes
CODE AVAILABILITY
Custom code used for analysis of mtDNA sequencing is available at https://git.biohpc.swmed.edu/CRI/mtDNASeq. RNAseq analysis workflow is available at https://git.biohpc.swmed.edu/BICF/Astrocyte/rnaseq.git.
COMPETING INTERESTS
The authors declare no competing interests.
DATA AVAILABILITY
RNA sequencing and mtDNA sequencing data are available at the NCBI GEO website (GSE180953, GSE180867). mtDNA sequencing mapping used GRCm38 (Mus musculus genome; https://www.ncbi.nlm.nih.gov/assembly/GCF_000001635.20). Other data are provided within the manuscript, source data and supplementary materials, or available upon reasonable request.
References
- 1.Ng YS & Turnbull DM Mitochondrial disease: genetics and management. Journal of neurology 263, 179–191, doi: 10.1007/s00415-015-7884-3 (2016). [DOI] [PMC free article] [PubMed] [Google Scholar]
- 2.Murphy E et al. Mitochondrial Function, Biology, and Role in Disease: A Scientific Statement From the American Heart Association. Circulation research 118, 1960–1991, doi: 10.1161/RES.0000000000000104 (2016). [DOI] [PMC free article] [PubMed] [Google Scholar]
- 3.Granatiero V & Manfredi G Mitochondrial Transport and Turnover in the Pathogenesis of Amyotrophic Lateral Sclerosis. Biology 8, doi: 10.3390/biology8020036 (2019). [DOI] [PMC free article] [PubMed] [Google Scholar]
- 4.Chen C, Turnbull DM & Reeve AK Mitochondrial Dysfunction in Parkinson's Disease-Cause or Consequence? Biology 8, doi: 10.3390/biology8020038 (2019). [DOI] [PMC free article] [PubMed] [Google Scholar]
- 5.Liu X et al. Regulation of mitochondrial biogenesis in erythropoiesis by mTORC1-mediated protein translation. Nature cell biology 19, 626–638, doi: 10.1038/ncb3527 (2017). [DOI] [PMC free article] [PubMed] [Google Scholar]
- 6.Anso E et al. The mitochondrial respiratory chain is essential for haematopoietic stem cell function. Nature cell biology 19, 614–625, doi: 10.1038/ncb3529 (2017). [DOI] [PMC free article] [PubMed] [Google Scholar]
- 7.Ryall JG et al. The NAD(+)-dependent SIRT1 deacetylase translates a metabolic switch into regulatory epigenetics in skeletal muscle stem cells. Cell stem cell 16, 171–183, doi: 10.1016/j.stem.2014.12.004 (2015). [DOI] [PMC free article] [PubMed] [Google Scholar]
- 8.Yucel N et al. Glucose Metabolism Drives Histone Acetylation Landscape Transitions that Dictate Muscle Stem Cell Function. Cell reports 27, 3939–3955 e3936, doi: 10.1016/j.celrep.2019.05.092 (2019). [DOI] [PMC free article] [PubMed] [Google Scholar]
- 9.Lepper C, Partridge TA & Fan CM An absolute requirement for Pax7-positive satellite cells in acute injury-induced skeletal muscle regeneration. Development 138, 3639–3646, doi: 10.1242/dev.067595 (2011). [DOI] [PMC free article] [PubMed] [Google Scholar]
- 10.Sambasivan R et al. Pax7-expressing satellite cells are indispensable for adult skeletal muscle regeneration. Development 138, 3647–3656, doi: 10.1242/dev.067587 (2011). [DOI] [PubMed] [Google Scholar]
- 11.Murphy MM, Lawson JA, Mathew SJ, Hutcheson DA & Kardon G Satellite cells, connective tissue fibroblasts and their interactions are crucial for muscle regeneration. Development 138, 3625–3637, doi: 10.1242/dev.064162 (2011). [DOI] [PMC free article] [PubMed] [Google Scholar]
- 12.Lepper C, Conway SJ & Fan CM Adult satellite cells and embryonic muscle progenitors have distinct genetic requirements. Nature 460, 627–631, doi: 10.1038/nature08209 (2009). [DOI] [PMC free article] [PubMed] [Google Scholar]
- 13.Diaz F, Thomas CK, Garcia S, Hernandez D & Moraes CT Mice lacking COX10 in skeletal muscle recapitulate the phenotype of progressive mitochondrial myopathies associated with cytochrome c oxidase deficiency. Human molecular genetics 14, 2737–2748, doi: 10.1093/hmg/ddi307 (2005). [DOI] [PMC free article] [PubMed] [Google Scholar]
- 14.L'Honore A et al. The role of Pitx2 and Pitx3 in muscle stem cells gives new insights into P38alpha MAP kinase and redox regulation of muscle regeneration. eLife 7, doi: 10.7554/eLife.32991 (2018). [DOI] [PMC free article] [PubMed] [Google Scholar]
- 15.Garcia-Prat L et al. Autophagy maintains stemness by preventing senescence. Nature 529, 37–42, doi: 10.1038/nature16187 (2016). [DOI] [PubMed] [Google Scholar]
- 16.Li N et al. Mitochondrial complex I inhibitor rotenone induces apoptosis through enhancing mitochondrial reactive oxygen species production. The Journal of biological chemistry 278, 8516–8525, doi: 10.1074/jbc.M210432200 (2003). [DOI] [PubMed] [Google Scholar]
- 17.Ghelli A et al. Leber's hereditary optic neuropathy (LHON) pathogenic mutations induce mitochondrial-dependent apoptotic death in transmitochondrial cells incubated with galactose medium. The Journal of biological chemistry 278, 4145–4150, doi: 10.1074/jbc.M210285200 (2003). [DOI] [PubMed] [Google Scholar]
- 18.Diaz F et al. Pathophysiology and fate of hepatocytes in a mouse model of mitochondrial hepatopathies. Gut 57, 232–242, doi: 10.1136/gut.2006.119180 (2008). [DOI] [PMC free article] [PubMed] [Google Scholar]
- 19.Mah-Som AY et al. Reliance on Cox10 and oxidative metabolism for antigen-specific NK cell expansion. Cell reports 35, 109209, doi: 10.1016/j.celrep.2021.109209 (2021). [DOI] [PMC free article] [PubMed] [Google Scholar]
- 20.Chen D et al. Coupled analysis of transcriptome and BCR mutations reveals role of OXPHOS in affinity maturation. Nature immunology 22, 904–913, doi: 10.1038/s41590-021-00936-y (2021). [DOI] [PubMed] [Google Scholar]
- 21.Saravia J et al. Homeostasis and transitional activation of regulatory T cells require c-Myc. Science advances 6, eaaw6443, doi: 10.1126/sciadv.aaw6443 (2020). [DOI] [PMC free article] [PubMed] [Google Scholar]
- 22.Pham AH, McCaffery JM & Chan DC Mouse lines with photo-activatable mitochondria to study mitochondrial dynamics. Genesis 50, 833–843, doi: 10.1002/dvg.22050 (2012). [DOI] [PMC free article] [PubMed] [Google Scholar]
- 23.Keefe AC et al. Muscle stem cells contribute to myofibres in sedentary adult mice. Nature communications 6, 7087, doi: 10.1038/ncomms8087 (2015). [DOI] [PMC free article] [PubMed] [Google Scholar]
- 24.Pawlikowski B, Pulliam C, Betta ND, Kardon G & Olwin BB Pervasive satellite cell contribution to uninjured adult muscle fibers. Skeletal muscle 5, 42, doi: 10.1186/s13395-015-0067-1 (2015). [DOI] [PMC free article] [PubMed] [Google Scholar]
- 25.Mishra P, Varuzhanyan G, Pham AH & Chan DC Mitochondrial Dynamics is a Distinguishing Feature of Skeletal Muscle Fiber Types and Regulates Organellar Compartmentalization. Cell metabolism 22, 1033–1044, doi: 10.1016/j.cmet.2015.09.027 (2015). [DOI] [PMC free article] [PubMed] [Google Scholar]
- 26.Millay DP et al. Myomaker is a membrane activator of myoblast fusion and muscle formation. Nature 499, 301–305, doi: 10.1038/nature12343 (2013). [DOI] [PMC free article] [PubMed] [Google Scholar]
- 27.Liu N et al. A Twist2-dependent progenitor cell contributes to adult skeletal muscle. Nature cell biology 19, 202–213, doi: 10.1038/ncb3477 (2017). [DOI] [PMC free article] [PubMed] [Google Scholar]
- 28.de Morree A et al. Alternative polyadenylation of Pax3 controls muscle stem cell fate and muscle function. Science 366, 734–738, doi: 10.1126/science.aax1694 (2019). [DOI] [PMC free article] [PubMed] [Google Scholar]
- 29.Der Vartanian A et al. PAX3 Confers Functional Heterogeneity in Skeletal Muscle Stem Cell Responses to Environmental Stress. Cell stem cell 24, 958–973 e959, doi: 10.1016/j.stem.2019.03.019 (2019). [DOI] [PMC free article] [PubMed] [Google Scholar]
- 30.Murphy MP How mitochondria produce reactive oxygen species. The Biochemical journal 417, 1–13, doi: 10.1042/BJ20081386 (2009). [DOI] [PMC free article] [PubMed] [Google Scholar]
- 31.Hamanaka RB et al. Mitochondrial reactive oxygen species promote epidermal differentiation and hair follicle development. Science signaling 6, ra8, doi: 10.1126/scisignal.2003638 (2013). [DOI] [PMC free article] [PubMed] [Google Scholar]
- 32.Tormos KV et al. Mitochondrial complex III ROS regulate adipocyte differentiation. Cell metabolism 14, 537–544, doi: 10.1016/j.cmet.2011.08.007 (2011). [DOI] [PMC free article] [PubMed] [Google Scholar]
- 33.He F et al. Redox Mechanism of Reactive Oxygen Species in Exercise. Frontiers in physiology 7, 486, doi: 10.3389/fphys.2016.00486 (2016). [DOI] [PMC free article] [PubMed] [Google Scholar]
- 34.Zuo L, Nogueira L & Hogan MC Reactive oxygen species formation during tetanic contractions in single isolated Xenopus myofibers. Journal of applied physiology 111, 898–904, doi: 10.1152/japplphysiol.00398.2011 (2011). [DOI] [PMC free article] [PubMed] [Google Scholar]
- 35.Parker L, McGuckin TA & Leicht AS Influence of exercise intensity on systemic oxidative stress and antioxidant capacity. Clinical physiology and functional imaging 34, 377–383, doi: 10.1111/cpf.12108 (2014). [DOI] [PubMed] [Google Scholar]
- 36.Dillard CJ, Litov RE, Savin WM, Dumelin EE & Tappel AL Effects of exercise, vitamin E, and ozone on pulmonary function and lipid peroxidation. Journal of applied physiology: respiratory, environmental and exercise physiology 45, 927–932, doi: 10.1152/jappl.1978.45.6.927 (1978). [DOI] [PubMed] [Google Scholar]
- 37.Powers SK, Nelson WB & Hudson MB Exercise-induced oxidative stress in humans: cause and consequences. Free radical biology & medicine 51, 942–950, doi: 10.1016/j.freeradbiomed.2010.12.009 (2011). [DOI] [PubMed] [Google Scholar]
- 38.Sens KL et al. An invasive podosome-like structure promotes fusion pore formation during myoblast fusion. The Journal of cell biology 191, 1013–1027, doi: 10.1083/jcb.201006006 (2010). [DOI] [PMC free article] [PubMed] [Google Scholar]
- 39.Shilagardi K et al. Actin-propelled invasive membrane protrusions promote fusogenic protein engagement during cell-cell fusion. Science 340, 359–363, doi: 10.1126/science.1234781 (2013). [DOI] [PMC free article] [PubMed] [Google Scholar]
- 40.Hartwig JH & Kwiatkowski DJ Actin-binding proteins. Current opinion in cell biology 3, 87–97, doi: 10.1016/0955-0674(91)90170-4 (1991). [DOI] [PubMed] [Google Scholar]
- 41.Jiang H et al. Adseverin plays a role in osteoclast differentiation and periodontal disease-mediated bone loss. FASEB journal : official publication of the Federation of American Societies for Experimental Biology 29, 2281–2291, doi: 10.1096/fj.14-265744 (2015). [DOI] [PubMed] [Google Scholar]
- 42.Millay DP, Sutherland LB, Bassel-Duby R & Olson EN Myomaker is essential for muscle regeneration. Genes & development 28, 1641–1646, doi: 10.1101/gad.247205.114 (2014). [DOI] [PMC free article] [PubMed] [Google Scholar]
- 43.Zhang H et al. NAD(+) repletion improves mitochondrial and stem cell function and enhances life span in mice. Science 352, 1436–1443, doi: 10.1126/science.aaf2693 (2016). [DOI] [PubMed] [Google Scholar]
- 44.Wei W et al. Germline selection shapes human mitochondrial DNA diversity. Science 364, doi: 10.1126/science.aau6520 (2019). [DOI] [PubMed] [Google Scholar]
- 45.Ju YS et al. Origins and functional consequences of somatic mitochondrial DNA mutations in human cancer. eLife 3, doi: 10.7554/eLife.02935 (2014). [DOI] [PMC free article] [PubMed] [Google Scholar]
- 46.White RB, Bierinx AS, Gnocchi VF & Zammit PS Dynamics of muscle fibre growth during postnatal mouse development. BMC developmental biology 10, 21, doi: 10.1186/1471-213X-10-21 (2010). [DOI] [PMC free article] [PubMed] [Google Scholar]
- 47.Bouviere J et al. Exercise-Stimulated ROS Sensitive Signaling Pathways in Skeletal Muscle. Antioxidants 10, doi: 10.3390/antiox10040537 (2021). [DOI] [PMC free article] [PubMed] [Google Scholar]
- 48.Morrison D et al. Vitamin C and E supplementation prevents some of the cellular adaptations to endurance-training in humans. Free radical biology & medicine 89, 852–862, doi: 10.1016/j.freeradbiomed.2015.10.412 (2015). [DOI] [PubMed] [Google Scholar]
- 49.Bjornsen T et al. Vitamin C and E supplementation blunts increases in total lean body mass in elderly men after strength training. Scandinavian journal of medicine & science in sports 26, 755–763, doi: 10.1111/sms.12506 (2016). [DOI] [PubMed] [Google Scholar]
- 50.Ristow M et al. Antioxidants prevent health-promoting effects of physical exercise in humans. Proceedings of the National Academy of Sciences of the United States of America 106, 8665–8670, doi: 10.1073/pnas.0903485106 (2009). [DOI] [PMC free article] [PubMed] [Google Scholar]
- 51.Clifford T, Jeffries O, Stevenson EJ & Davies KAB The effects of vitamin C and E on exercise-induced physiological adaptations: a systematic review and Meta-analysis of randomized controlled trials. Critical reviews in food science and nutrition 60, 3669–3679, doi: 10.1080/10408398.2019.1703642 (2020). [DOI] [PubMed] [Google Scholar]
- 52.Gomez-Cabrera MC et al. Oral administration of vitamin C decreases muscle mitochondrial biogenesis and hampers training-induced adaptations in endurance performance. The American journal of clinical nutrition 87, 142–149, doi: 10.1093/ajcn/87.1.142 (2008). [DOI] [PubMed] [Google Scholar]
- 53.Paulsen G et al. Vitamin C and E supplementation hampers cellular adaptation to endurance training in humans: a double-blind, randomised, controlled trial. The Journal of physiology 592, 1887–1901, doi: 10.1113/jphysiol.2013.267419 (2014). [DOI] [PMC free article] [PubMed] [Google Scholar]
- 54.Rossi DJ et al. Deficiencies in DNA damage repair limit the function of haematopoietic stem cells with age. Nature 447, 725–729, doi: 10.1038/nature05862 (2007). [DOI] [PubMed] [Google Scholar]
- 55.Nijnik A et al. DNA repair is limiting for haematopoietic stem cells during ageing. Nature 447, 686–690, doi: 10.1038/nature05875 (2007). [DOI] [PubMed] [Google Scholar]
- 56.Katajisto P et al. Stem cells. Asymmetric apportioning of aged mitochondria between daughter cells is required for stemness. Science 348, 340–343, doi: 10.1126/science.1260384 (2015). [DOI] [PMC free article] [PubMed] [Google Scholar]
- 57.Weinberg SE et al. Mitochondrial complex III is essential for suppressive function of regulatory T cells. Nature 565, 495–499, doi: 10.1038/s41586-018-0846-z (2019). [DOI] [PMC free article] [PubMed] [Google Scholar]
- 58.Miura H, Quadros RM, Gurumurthy CB & Ohtsuka M Easi-CRISPR for creating knock-in and conditional knockout mouse models using long ssDNA donors. Nature protocols 13, 195–215, doi: 10.1038/nprot.2017.153 (2018). [DOI] [PMC free article] [PubMed] [Google Scholar]
- 59.Liu L, Cheung TH, Charville GW & Rando TA Isolation of skeletal muscle stem cells by fluorescence-activated cell sorting. Nature protocols 10, 1612–1624, doi: 10.1038/nprot.2015.110 (2015). [DOI] [PMC free article] [PubMed] [Google Scholar]
- 60.Marquis J et al. MitoRS, a method for high throughput, sensitive, and accurate detection of mitochondrial DNA heteroplasmy. BMC genomics 18, 326, doi: 10.1186/s12864-017-3695-5 (2017). [DOI] [PMC free article] [PubMed] [Google Scholar]
- 61.Wei W, Gomez-Duran A, Hudson G & Chinnery PF Background sequence characteristics influence the occurrence and severity of disease-causing mtDNA mutations. PLoS genetics 13, e1007126, doi: 10.1371/journal.pgen.1007126 (2017). [DOI] [PMC free article] [PubMed] [Google Scholar]
- 62.Stewart JB et al. Simultaneous DNA and RNA Mapping of Somatic Mitochondrial Mutations across Diverse Human Cancers. PLoS genetics 11, e1005333, doi: 10.1371/journal.pgen.1005333 (2015). [DOI] [PMC free article] [PubMed] [Google Scholar]
- 63.Livak KJ & Schmittgen TD Analysis of relative gene expression data using real-time quantitative PCR and the 2(-Delta Delta C(T)) Method. Methods 25, 402–408, doi: 10.1006/meth.2001.1262 (2001). [DOI] [PubMed] [Google Scholar]
- 64.Jing D et al. Tissue clearing of both hard and soft tissue organs with the PEGASOS method. Cell research 28, 803–818, doi: 10.1038/s41422-018-0049-z (2018). [DOI] [PMC free article] [PubMed] [Google Scholar]
- 65.Brun CE, Wang YX & Rudnicki MA Single EDL Myofiber Isolation for Analyses of Quiescent and Activated Muscle Stem Cells. Methods in molecular biology 1686, 149–159, doi: 10.1007/978-1-4939-7371-2_11 (2018). [DOI] [PubMed] [Google Scholar]
Associated Data
This section collects any data citations, data availability statements, or supplementary materials included in this article.
Supplementary Materials
Supplementary movie 1: Three-dimensional imaging of mito-Dendra2 signal from a wild-type (wt) mouse after tissue clearing.
Supplementary movie 2: Three-dimensional imaging of mito-Dendra2 signal from a Cox10−/− mouse after tissue clearing.
Supplementary movie 3: Three-dimensional imaging of mito-Dendra2 signal from a Ndufa9−/− mouse after tissue clearing.
Data Availability Statement
RNA sequencing and mtDNA sequencing data are available at the NCBI GEO website (GSE180953, GSE180867). mtDNA sequencing mapping used GRCm38 (Mus musculus genome; https://www.ncbi.nlm.nih.gov/assembly/GCF_000001635.20). Other data are provided within the manuscript, source data and supplementary materials, or available upon reasonable request.


