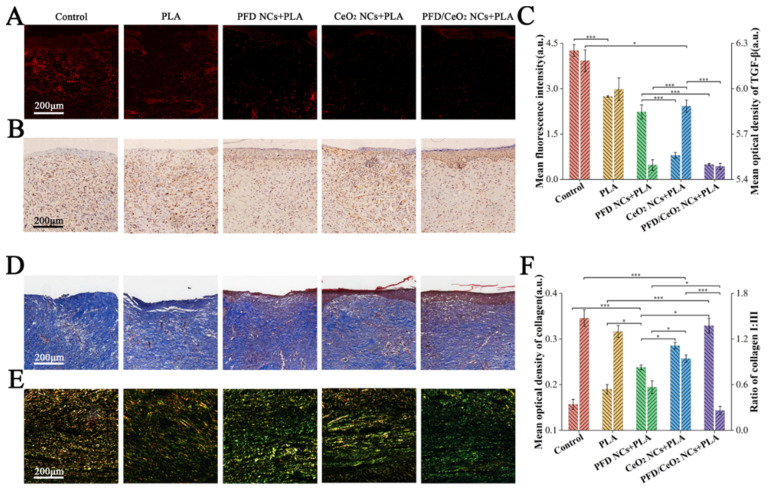
Figure 6.
(A) Immunofluorescent analysis of ROS in each group; (B) Immunohistochemical analysis of TGF-β in each group; (C) Mean fluorescence intensity of ROS and mean optical density of TGF-β in each group; (D) Masson staining in each group; (E) Sirius red staining in each group; (F) Mean optical density of collagen and the ratio of collagen I to collagen III. (*, p < 0.05; ***, p < 0.0001).

