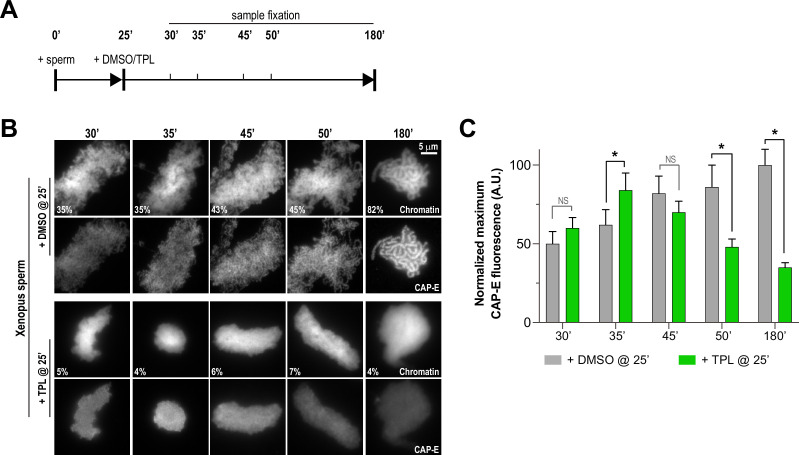
Figure 4. Triptolide perturbs condensation prior to its effects on condensin levels.
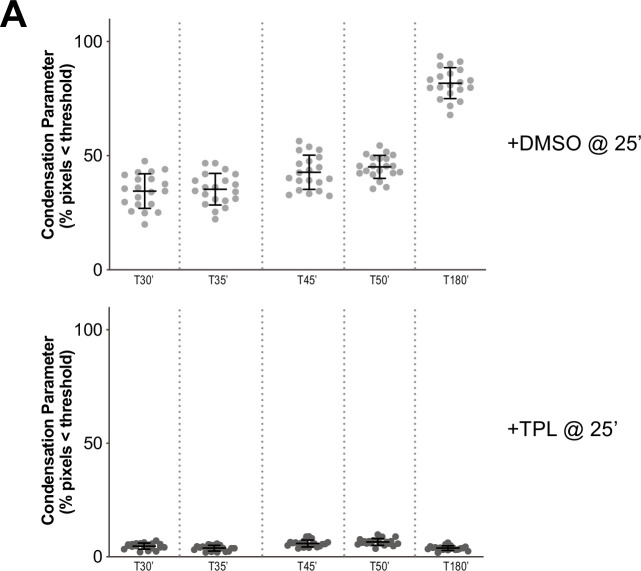
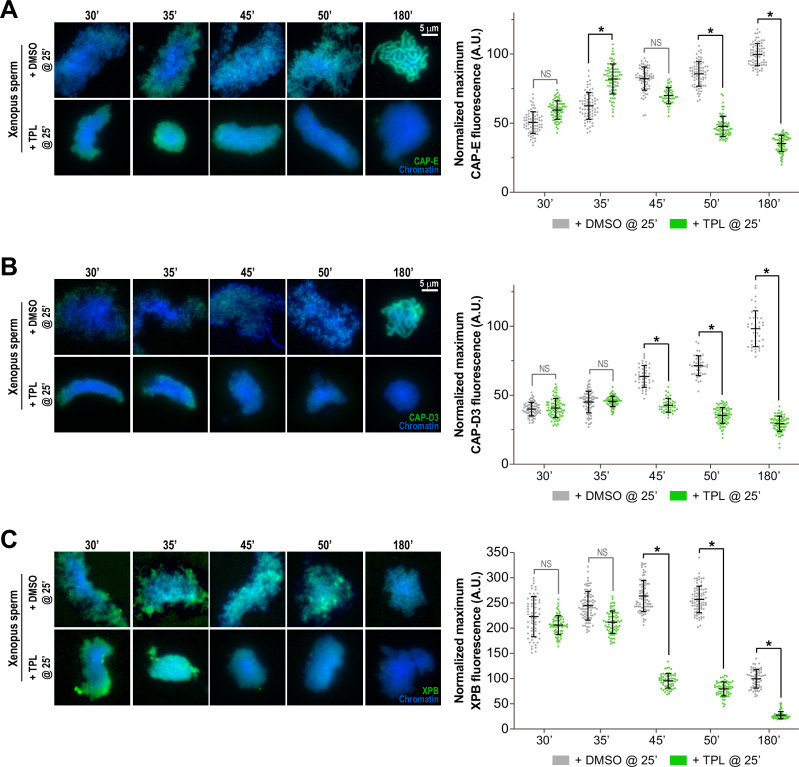
(A) Schematic of assay to test the timing of triptolide-induced defects in condensation and condensin levels. After a twenty-five minute incubation, either DMSO or triptolide (TPL) was added, and samples were taken at indicated times and processed for immunofluorescence. (B) Representative immunofluorescence images of DMSO or triptolide treated extracts at indicated timepoints. Chromatids were labeled with Hoechst and anti-CAP-E (condensin I and II). Note that condensation is already lost in in the first timepoint after triptolide addition, as in Figure 2A. Mean condensation parameters for each condition are indicated in lower left corner of each image. (C) Quantification of fluorescence intensity of CAP-E from experiment in (B), normalized to the 180 min DMSO-treated sample. n = 50 structures for each condition. Error bars represent SD, and asterisks indicate a statistically significant difference (*, p < 0.001). A.U., arbitrary units. Two biological replicates were performed, quantified structures are from a single experiment.


