Abstract
Purpose:
The retinal pigment epithelium (RPE) to Bruch’s membrane (BM) distance around geographic atrophy (GA) was measured using an optical attenuation coefficient (OAC) algorithm to determine if this measurement could serve as a clinical biomarker to predict the annual square root enlargement rate (ER) of GA.
Design:
A retrospective analysis of a prospective, observational case series.
Methods:
Eyes with GA secondary to age-related macular degeneration (AMD) were imaged with swept-source OCT (SS-OCT) using a 6×6 mm scan pattern. GA lesions were identified and measured using customized en face OCT images, and GA annual square root ERs were calculated. At baseline, the OACs were calculated from OCT datasets to generate customized en face OAC images for GA visualization. RPE-BM distances were measured using OAC data from different sub-regions around the GA.
Results:
A total of 38 eyes from 27 subjects were included in this study. Measured RPE-BM distances were the highest in the region closest to GA. The RPE-BM distances immediately around the GA were significantly correlated with GA annual square root ERs (r = 0.595, p<0.001 for a 0–300 μm rim around the GA). No correlations were found between RPE-BM distances and previously published CC flow deficits in any sub-regions.
Conclusions:
RPE-BM distances from regions around the GA significantly correlate with the annual ERs of GA. These results suggest that an abnormally thickened RPE/BM complex contributes to GA growth and this effect is independent of CC perfusion deficits.
Keywords: OCT, geographic atrophy, Optical attenuation coefficient, basal laminar deposit
Table of Contents statement
This study introduces a novel OCT strategy using optical attenuation coefficients to identify and measure the elevations of the retinal pigment epithelium to Bruch’s membrane around geographic atrophy as a clinical biomarker. This biomarker predicted the annual square root enlargement rate of geographic atrophy and was independent of choriocapillaris deficits.
INTRODUCTION
Geographic atrophy (GA) is the late stage of non-exudative (dry) age-related macular degeneration (AMD), which is a major cause of vision loss worldwide.1 GA is characterized by the loss of photoreceptors, retinal pigment epithelium (RPE), and choriocapillaris (CC),2 and leads to irreversible vision loss where the GA is present.3, 4 GA is also known as complete RPE and outer retinal atrophy (cRORA).4 Currently there are no FDA approved treatment to prevent the formation or progression of GA, but several promising therapeutic treatment clinical trials using complement inhibitors are underway.5–8 Rather than using visual acuity as a clinical trial endpoint, most GA studies use the slowing of the GA enlargement rate (ER) as the clinical trial endpoint since vision is usually affected late in the disease process when the GA progresses into the foveal region.7–12 There has been a great deal of interest in identifying GA that is more likely to enlarge more rapidly, hoping not only to understand the underlying disease pathophysiology responsible for GA growth, but also to help facilitate the testing of promising therapies to slow the progression of GA against more rapidly growing GA, so that clinical trials can be of shorter duration.11, 13
Traditionally, GA has been imaged with its ER measured using three major approaches: color fundus imaging (CFI), fundus autofluorescence (FAF), and optical coherence tomography (OCT).14–20 While CFI is of historical interest,13, 21 FAF and OCT imaging are currently used in clinical practice and clinical research because these imaging modalities provide better contrast for detecting the loss of the RPE, which is the sine qua non of GA.4, 13, 22–24 While FAF imaging provides only a two-dimensional view of the fundus without any depth information, OCT imaging, both spectral domain OCT (SD-OCT) and swept-source OCT (SS-OCT) have been used to visualize GA, quantify GA, and measure the growth of GA.14, 15, 17, 19, 25–30 The depth resolved nature of OCT imaging allows for layer specific visualization and the ability to differentiate the extent of anatomical changes across different layers. In addition to using OCT B-scans, en face OCT imaging has become a useful strategy for visualizing GA, and the use of boundary specific segmentation by using a choroidal slab under the RPE allows for an en face image that specifically accentuates the choroidal hyper-transmission defects (hyperTDs) that arise when the RPE is absent.14, 15, 31, 32 31, 32 In addition, studies have shown that hyperTDs on OCT subRPE images correlate well with the hypo-autofluorescence seen on FAF images and OCT has become the recommended imaging modality to identify the evolution and presence of GA.4, 14, 33, 34
The underlying pathophysiological mechanisms for GA formation and progression remain unclear, but multiple studies have identified structural changes associated with GA formation and progression using OCT, FAF, and CFI. Such changes include outer retina atrophy (ellipsoid zone disruption, focal photoreceptor loss), reticular pseudodrusen, also known as subretinal drusenoid deposits, hyperreflective foci, hyper-autofluorescence patterns, drusen, hyperTDs, choroid thinning, and CC loss.28, 35–41 For the prediction of GA growth rates, CC loss around the GA quantified by OCT angiography,36, 42–44 outer retinal abnormality identified by OCT minimum intensity,28, 45 the diffuse trickling pattern22, 24, 46 and the rim area focal hyper-autofluorescence identified by FAF13, 47, 48 have all been shown to correlate with or predict faster GA growth. Histopathological studies have reported a thickened RPE/Bruch’s membrane (BM) complex around the GA, contributed by basal laminar deposits (BLamDs), though few studies have attempted to measure this increased RPE-BM distance and investigate its correlation with GA growth.46, 49
In this study, we propose a new approach to visualizing GA using optical attenuation coefficients (OAC) derived from SS-OCT data as well as a method to measure RPE elevation from the BM. We then investigate the correlation between RPE-BM distances and GA annual square root ERs and develop a multiple regression model to predict the growth of GA using a combination of CC flow deficits (FDs) and RPE-BM distance around GA.
METHODS
This retrospective analysis of a prospective, observational case series was performed at the University of Miami and approved by the Institutional Review Board (IRB) of the University of Miami Miller School of Medicine, in accordance with the tenets of the Declaration of Helsinki and the Health Insurance Portability and Accountability Act of 1996 regulations. Informed consents were obtained from all subjects before participation in an ongoing prospective OCT study at the Bascom Palmer Eye Institute. Patients diagnosed with GA secondary to nonexudative AMD were enrolled from June 2016 to November 2019.
Imaging acquisition
All subjects underwent SS-OCT angiographic imaging (PLEX® Elite 9000, Carl Zeiss Meditec, Dublin, CA). This instrument uses a 100 kHz light source with a 1050 nm central wavelength and a 100 nm bandwidth, providing an axial resolution of ~ 5.5 μm and a lateral resolution of ~20 μm estimated at the retinal surface. At the baseline visit and at one-year of follow-up, 6×6 mm scans were acquired as previously described.36, 43 The 6×6 mm scans consisted 1536 pixels on each A-line (3mm), 500 A-lines per B-scan, and 2 repeated B-scans at each of the 500 B-scan positions over 6 mm. Scans with a signal strength of less than 7 or evident motion artifacts were excluded from further data analysis.
Image processing
After acquiring volumetric SS-OCT datasets, the OAC was calculated for each pixel using a depth-resolved single scattering model developed by Vermeer et al.50 and Zhou et al.51, 52 Briefly, if it’s assumed that all light is completely attenuated within the imaging range, the backscattered light is a fixed fraction of the attenuated light, and the detected light intensity is uniform over a pixel, then the OAC at each pixel within the volumetric imaging range can be written as:
| (1) |
where μ[i] is the OAC of the ith pixel, with a unit of mm−1, Δ is the axial size of the a pixel (mm) and I[i] is the detected OCT signal intensity (linear scale) at the ith pixel. Since all light is assumed to be fully attenuated within in the imaging range, can be calculated by adding up the OCT intensities of all pixels beneath the ith pixel. A manufacturer provided equation was used to convert log scale SS-OCT data back to a linear scale. Figure 1 shows an example of an OCT B-scan and its corresponding OAC B-scan.
Figure 1:
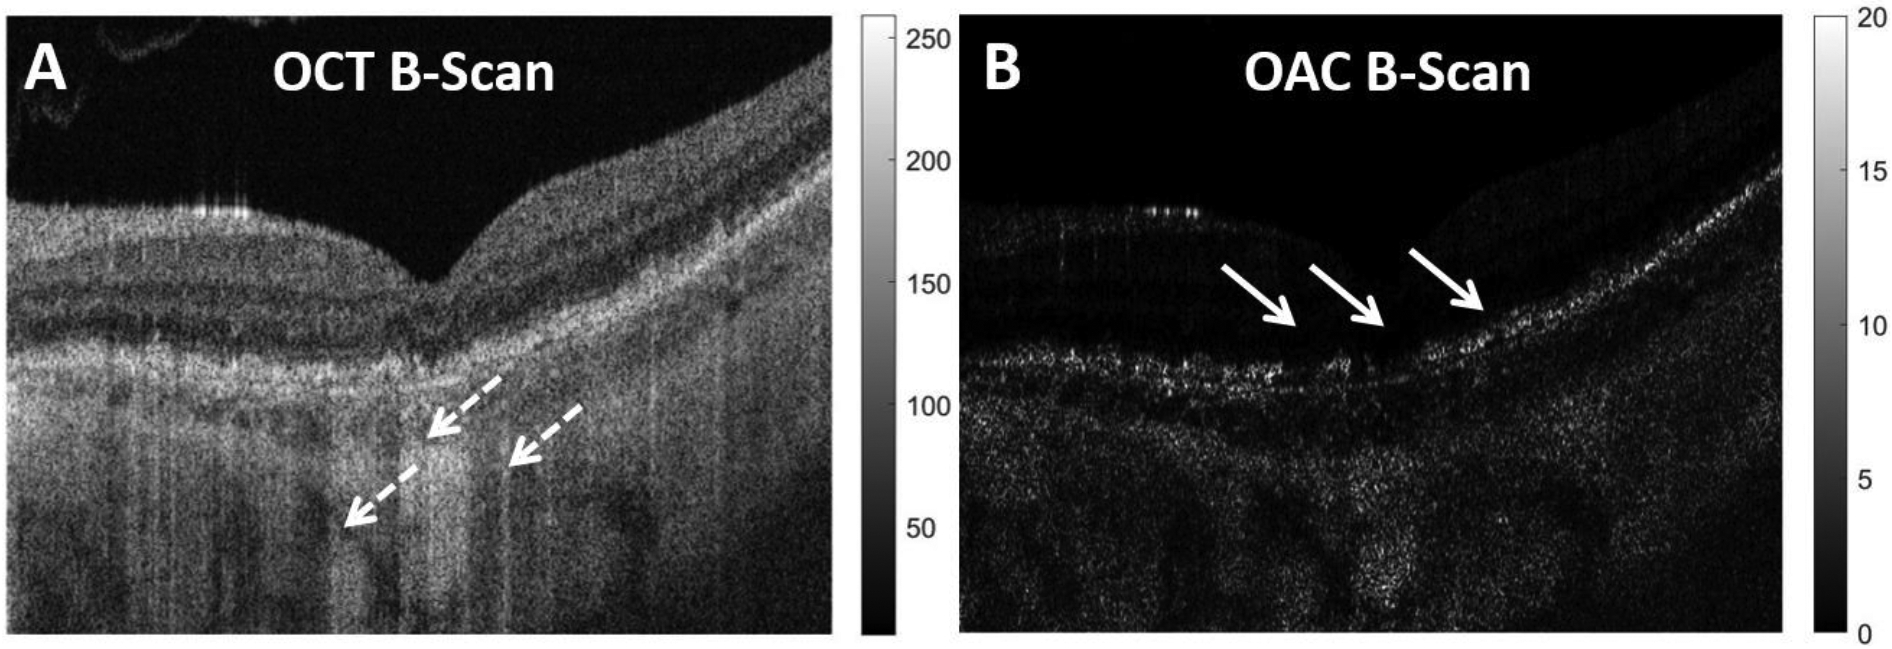
Example of a traditional swept source OCT (SS-OCT) B-scan and its corresponding optical attenuation coefficient (OAC) B-scan. A: SS-OCT B-scan from a patient diagnosed with geographic atrophy (GA), dashed white arrow indicates regions with choroidal hyper-transmission defects (hyperTDs) caused by compromised retinal pigment epithelium (RPE). B: Corresponding OAC B-scan of panel A, the solid white arrows indicate the areas where the RPE is compromised that’s responsible for the choroidal hyperTDs seen on the SS-OCT B-scan.
Semi-automatic segmentation software53 was used to identify BM on the volumetric SS-OCT data, the same segmentation was then applied to the volumetric OAC data using MATLAB version R2016b software (MathWorks, Natick, Massachusetts). Two slabs were defined to generate en face images for the GA visualization and quantification. The first slab was defined as extending from BM to 600 μm above BM, as shown by the red dashed lined in Figure 2A. Four en face OAC images were generated using the custom slab: the maximum projection image (OAC max image as shown in Figure 2B), the sum projection image (OAC sum image as shown in Figure 2C), the RPE to BM distance map (the OAC elevation map as shown in Figures 2D, 2E), and the false color OAC image, which is a composite of OAC max image (red channel), OAC sum image (green channel) and the OAC elevation map (blue channel), as shown in Figure 2F. The OAC elevation map represents the distance between RPE and BM, and RPE is identified by the pixel with the maximum OAC value above BM along each A-line. A 5×5 pixel median filter was used for smoothing. Green dashed lines in Figure 2C show an example of this RPE-BM distance on an OAC B-scan. In this paper, all OAC max images’ dynamic range was set as 0–60 mm−1, all OAC sum images’ dynamic range was set as 0–600 (unitless), and all OAC elevation maps’ dynamic range was set as 0–100 μm.
Figure 2:
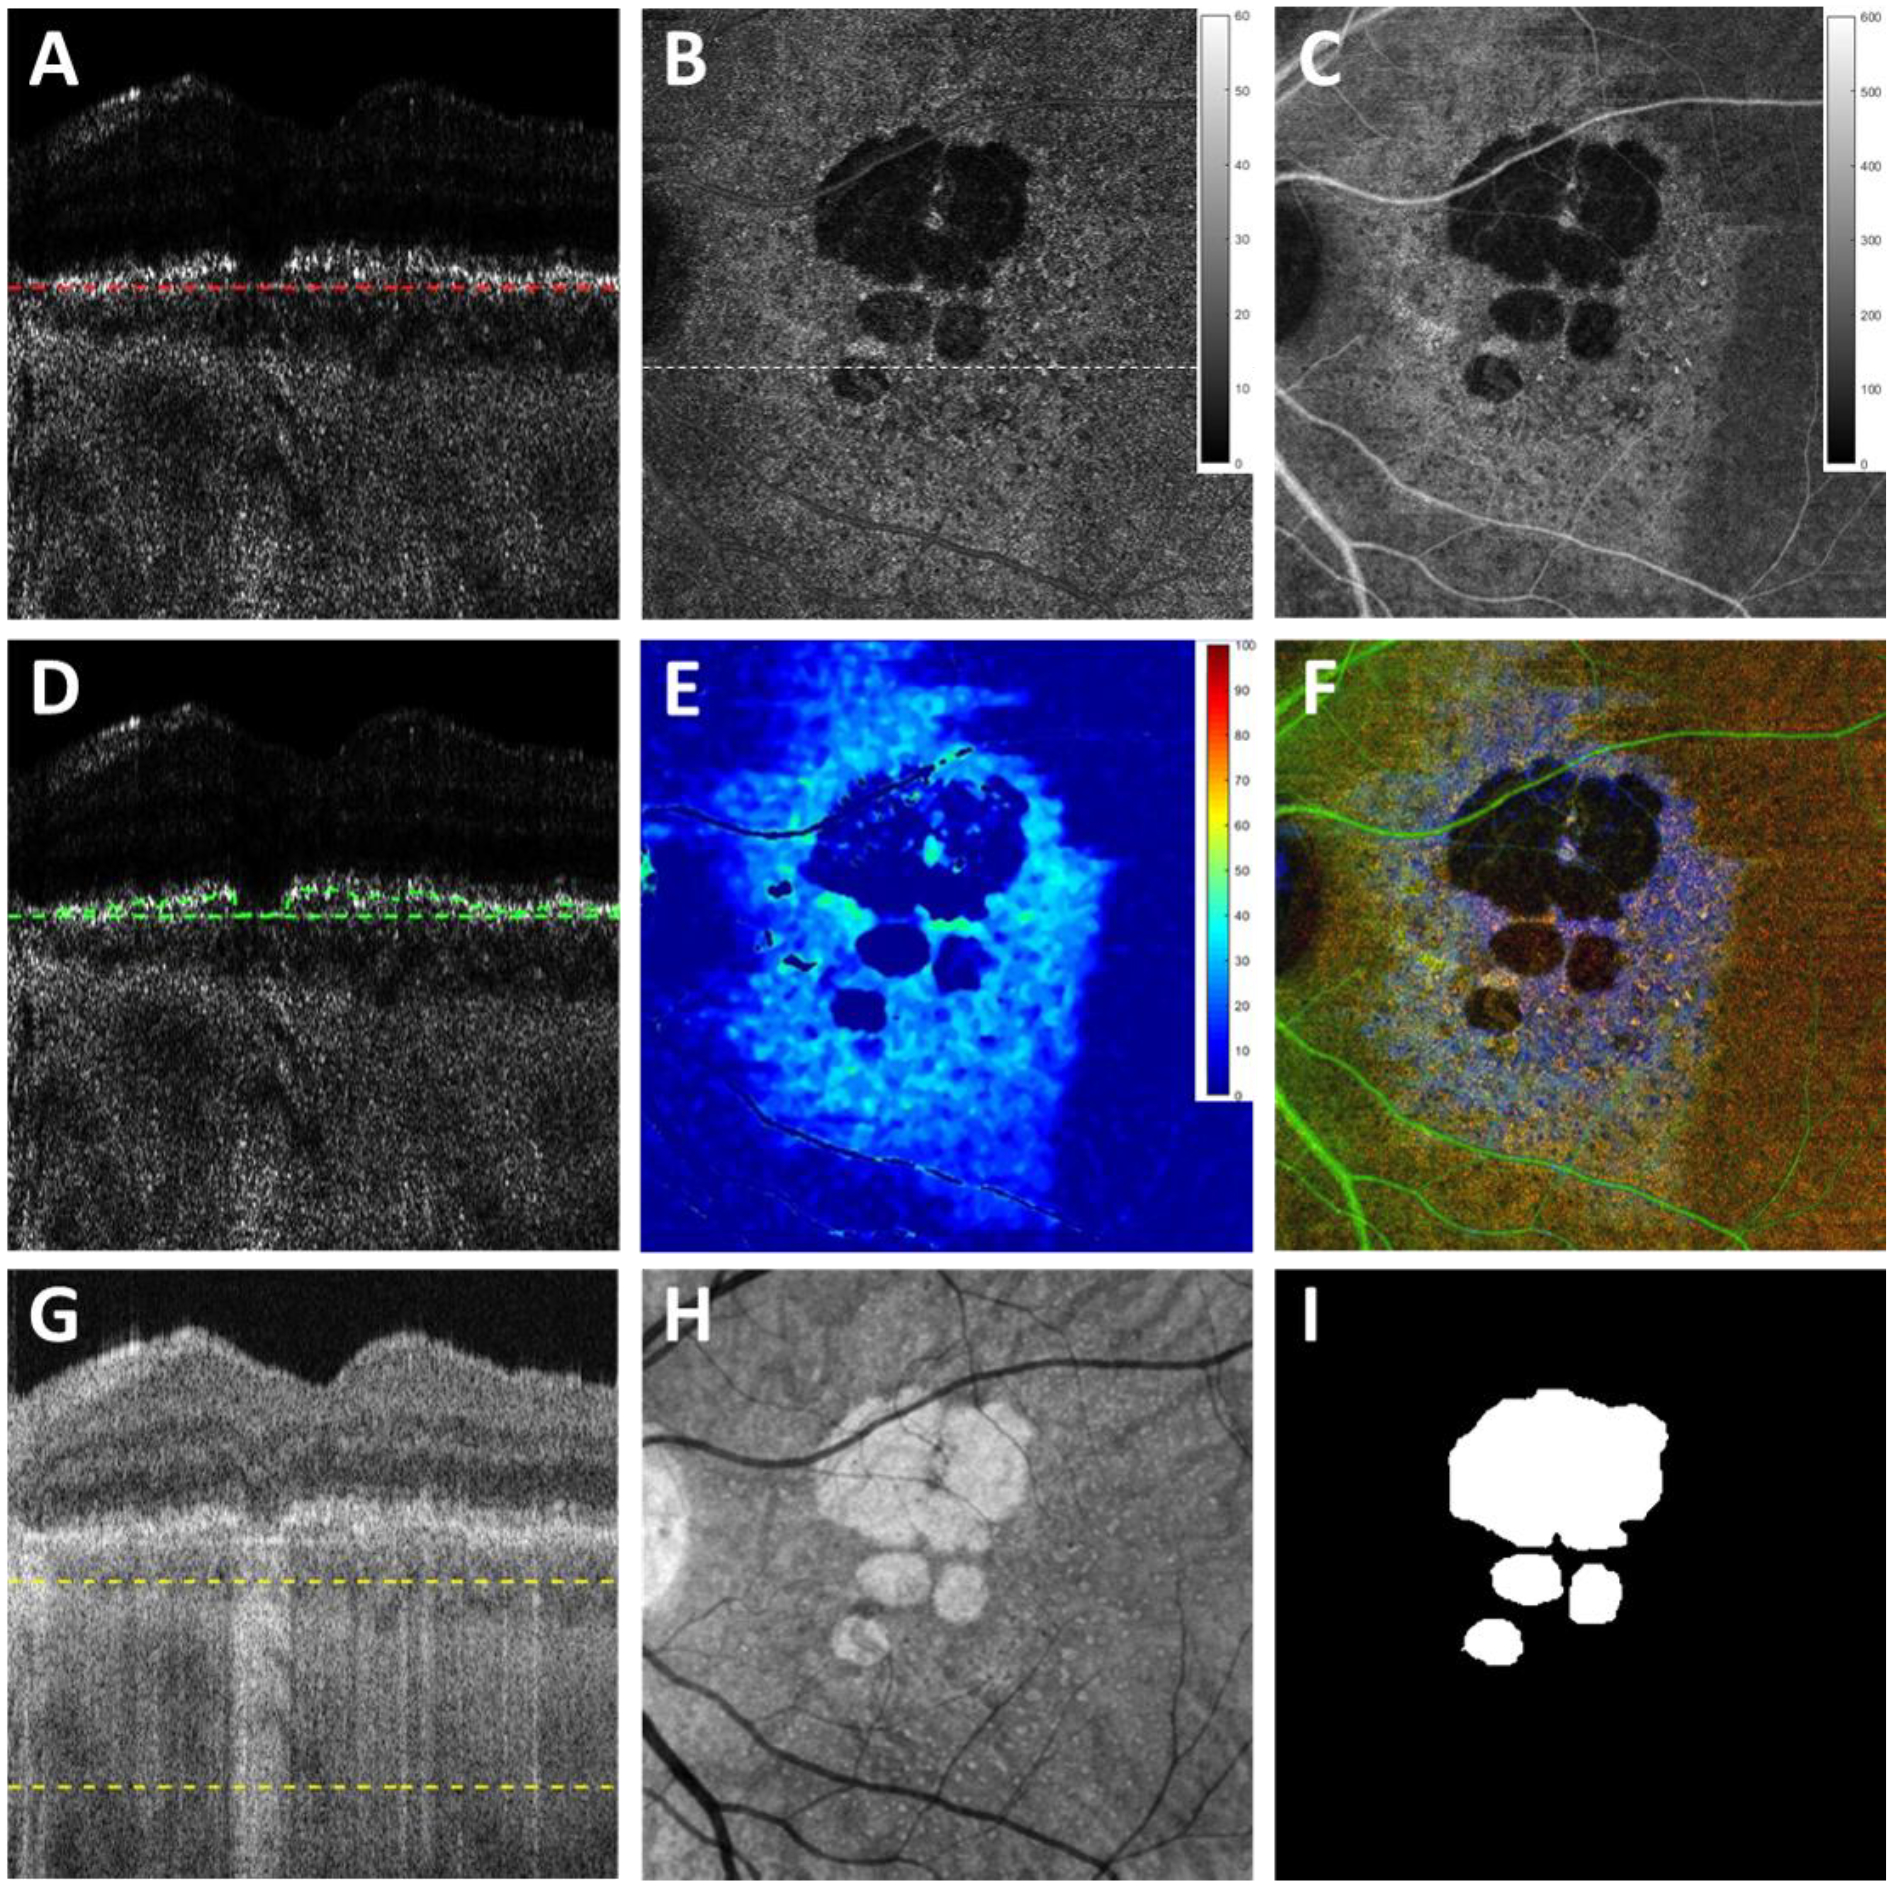
Images obtained using the optical attenuation coefficient (OAC) algorithms and the traditional OCT images with choroidal hypertransmission defect (hyperTDs). A: swept source OCT (SS-OCT) OAC B-scan with red dashed lines of the first slab, which includes 600 μm above Bruch’s membrane (BM) (upper boundary not shown due to cropping of the image); B: OAC maximum projection en face image of the first slab with a dynamic range of 0–60 (mm−1). C: OAC sum projection en face image of the first slab with a dynamic range of 0–600 (unitless). D: OAC B-scan with green dashed lines indicating the distance between OAC identified retinal pigment epithelium (RPE) and manually segmented BM. E: OAC elevation map calculated using the BM segmentation of the first slab to the OAC line shown in Panel D with the distance from the RPE to BM shown in color having a dynamic range of 0–100 (μm). F: OAC false color composite image of panels B (red channel), C (green channel) and E (blue channel). G: The same SS-OCT B-scan image as panel A with yellow dashed lines depicting the second slab from 64 μm below BM to 400 μm below BM, also known as the subRPE slab. H: OCT sum en face projection of the subRPE slab depicting the area with choroidal hyperTDs. I: Ground truth area of geographic atrophy shown in Panel H and identified by graders.
The second slab was used to generate en face images from OCT scans for the GA visualization and quantification, which was defined from 64 μm below BM to 400 μm below BM, also known as the subRPE slab, as shown between the green dashed lines in Figure 2G. The corresponding en face OCT image was generated using the subRPE slab sum projection, as shown in Figure 2H. GA lesions (Figure 2I) were manually outlined using this subRPE OCT image by 2 independent graders (Y.S. and L.W.) at baseline and 1-year follow-up visits using Photoshop CC (Adobe Systems, San Jose, California, USA), and a consensus of drawn boundaries was reached between both graders. In cases of disagreement, a senior grader (P.J.R.) served as the adjudicator, as described in previous studies.36, 43 The areas of GA were calculated using Photoshop CC (Adobe Systems, San Jose, California, USA) and a square root transformation was applied to calculate the annual square root ER, defined as the normalized differences in the square root of the area measurements between baseline and the 1-year follow-up visit, as previously described.27, 43
Sub-regional RPE-BM distance analysis
Baseline visits were used to quantify the RPE-BM distances around the GA using the OAC elevation maps (Figure 2E). When artifacts from the large retinal vessels were present, they were removed from the RPE-BM distance quantification.54 Following previous conventions for CC analysis,36 several regions were defined as follows (Figure 3): a 1-degree rim region that extends from 0 μm to 300 μm outside the GA margin (R1) shown as the region between the red and green lines; an additional 1-degree rim region located between 300 μm and 600 μm outside the GA margin (R2) between the green and yellow lines; a 2-degree rim region that combines R1 and R2 and extends from 0 μm to 600 μm outside the GA margin (R1+R2) between the red and yellow lines; the region of the total scan area minus the region of the GA, R1, and R2, and this region is known as R3 and includes the area between the yellow line to the edge of the image; and the region that includes the total scan area minus the region of GA.
Figure 3:
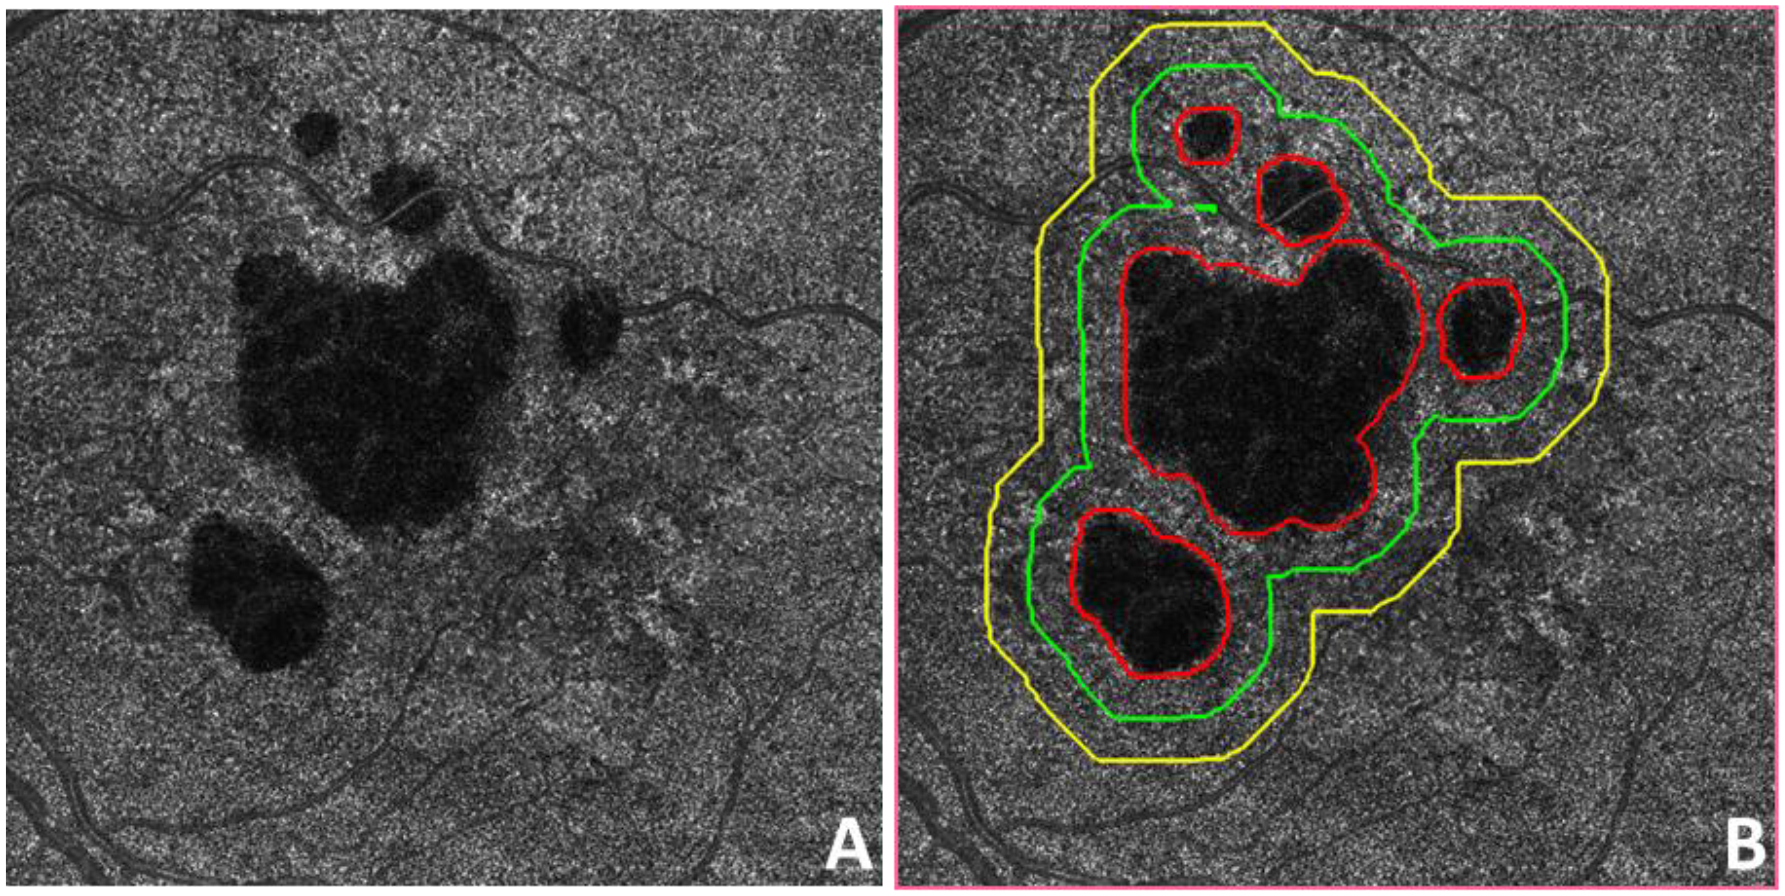
Example of regions analyzed around geographic atrophy (GA). A: Swept source OCT (SS-OCT) optical attenuation coefficient (OAC) max en face image of a subject diagnosed with GA. B: The same OAC max image as in panel A with red lines depicting manually graded area of GA. Green line represents a 300 μm wide (1-degree) region outside the GA boundary. Yellow line represents a 600 μm wide (2-degree) region outside the GA boundary. The distance between the green and yellow lines is 300 μm.
Statistical analysis
Pearson’s correlation was used to evaluate the relationships between the OAC measured RPE-BM distances and the normalized annual square root ERs of GA, as well as the relationship between the previously published percentage of CC FDs (FD%)36 and the RPE-BM distance of the same eyes. To assess the combined effects of RPE-BM distance and CC FD% on predicting GA growth, a multiple linear regression model was also calculated using RPE-BM distance and CC FD% as variables and the normalized annual square root ERs of GA as the outcome.36 All analyses were conducted using SPSS version 25.0 software (IBM, Armonk, New York, USA). A p-value of < 0.05 was considered to be statistically significant.
RESULTS
A total of 38 eyes from 27 subjects diagnosed with GA secondary to nonexudative AMD were included in this study. The relationship between the ER of GA in these eyes and surrounding CC FDs and underlying choroidal parameters was previously reported in these eyes.36, 43 As described in the Methods section, a false color OAC image was generated using the OAC max image, OAC sum image, and OAC elevation map. Figure 4 shows an example of a subject with a normal eye, Figure 5 shows an example of an AMD subject with a unifocal GA lesion, and Figure 6 shows an example of an AMD subject with a multifocal GA lesion. In all the above figures, panel A shows the OAC max images, i.e. the OAC values on the RPE. Panel B shows the OAC sum images where the accumulated optical attenuation above BM is presented. Panel C shows the OAC elevation maps where the distance from RPE to BM is presented, using a color bar of 0–100 μm. Panel D shows the false color composite OAC map, where black represents pigment loss in the RPE, the green color represents the normal RPE, and blue color represents elevations of the RPE. Panel E shows the traditional subRPE OCT image that depicts choroidal hyperTDs and panel F shows the manually labeled GA boundary using the image from panel E. Panels G and H show the OCT B-scan and OAC B-scan images, respectively.
Figure 4:
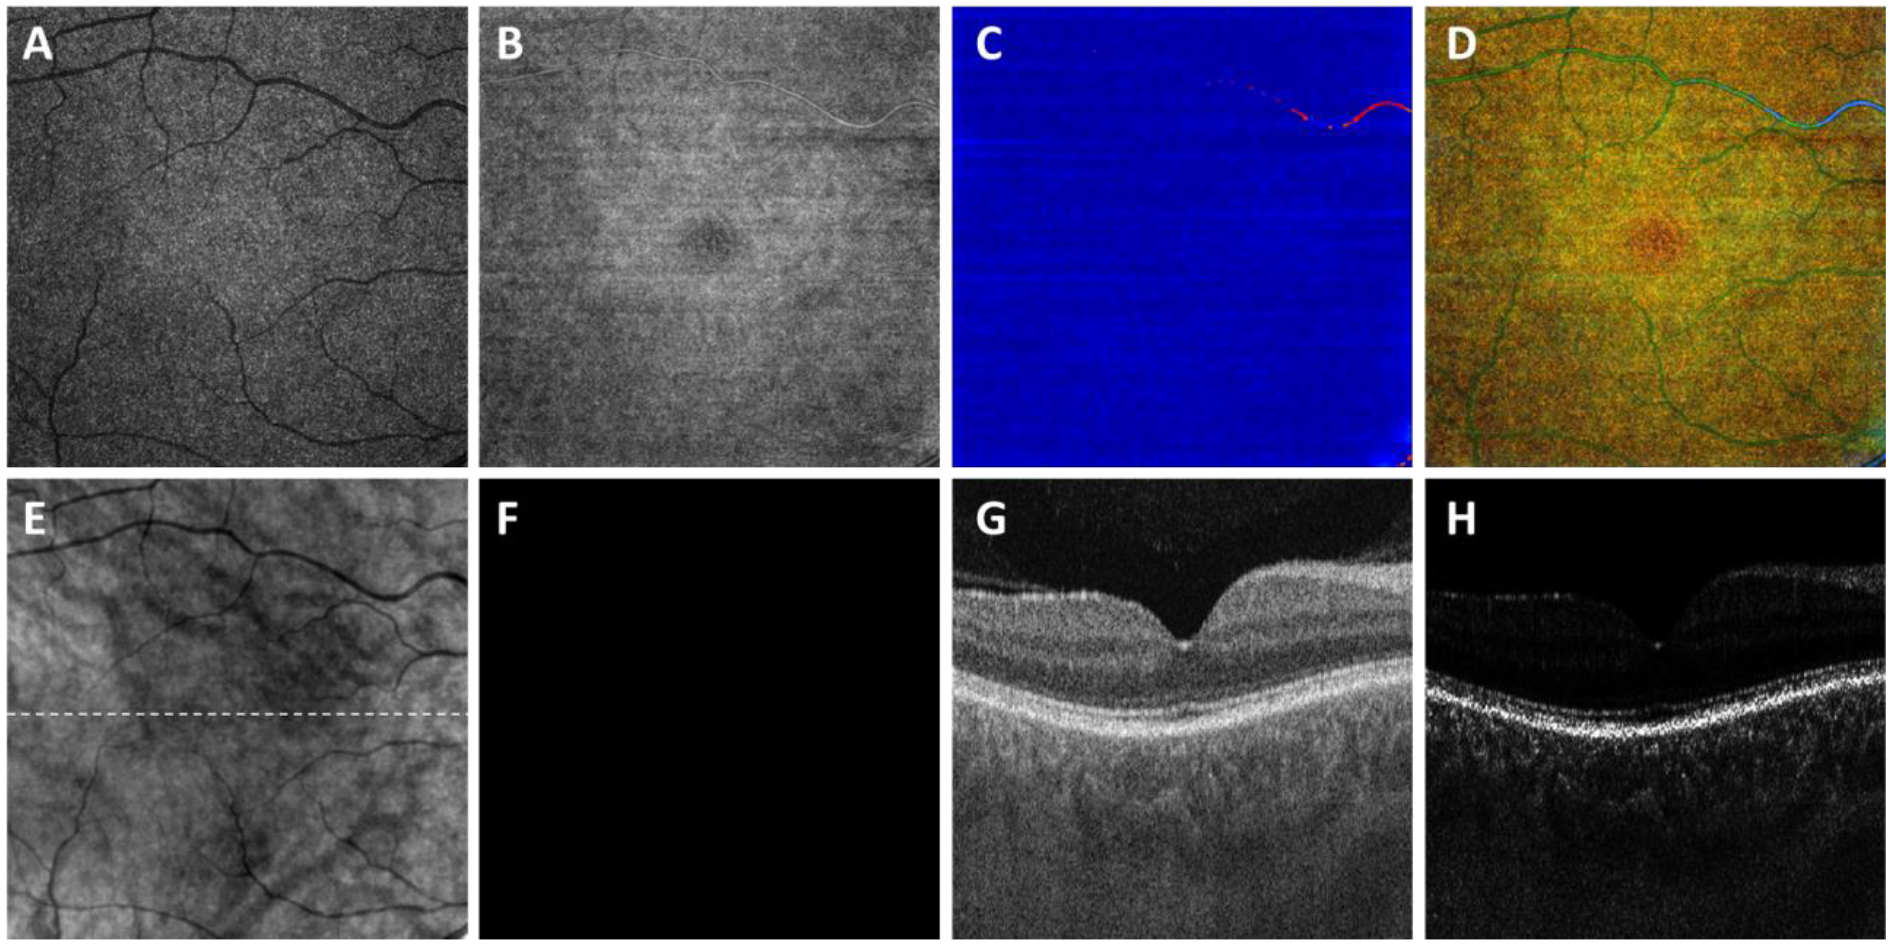
Visualization of a normal eye using the optical attenuation coefficient (OAC) estimated from swept source optical coherence tomography (SS-OCT) scans in a subject without ocular pathology. A: OAC max image. B: OAC sum image. C: OAC elevation map. D: OAC false color image. E: OCT subRPE image. F: Ground truth of GA generated by professional graders. G: OCT B-scan from the same subject, with the location represented in white dashed line in panel B. H: OAC B-scan from the same subject, with the same location as panel G. All images are from a 6×6 mm SS-OCT scan.
Figure 5:
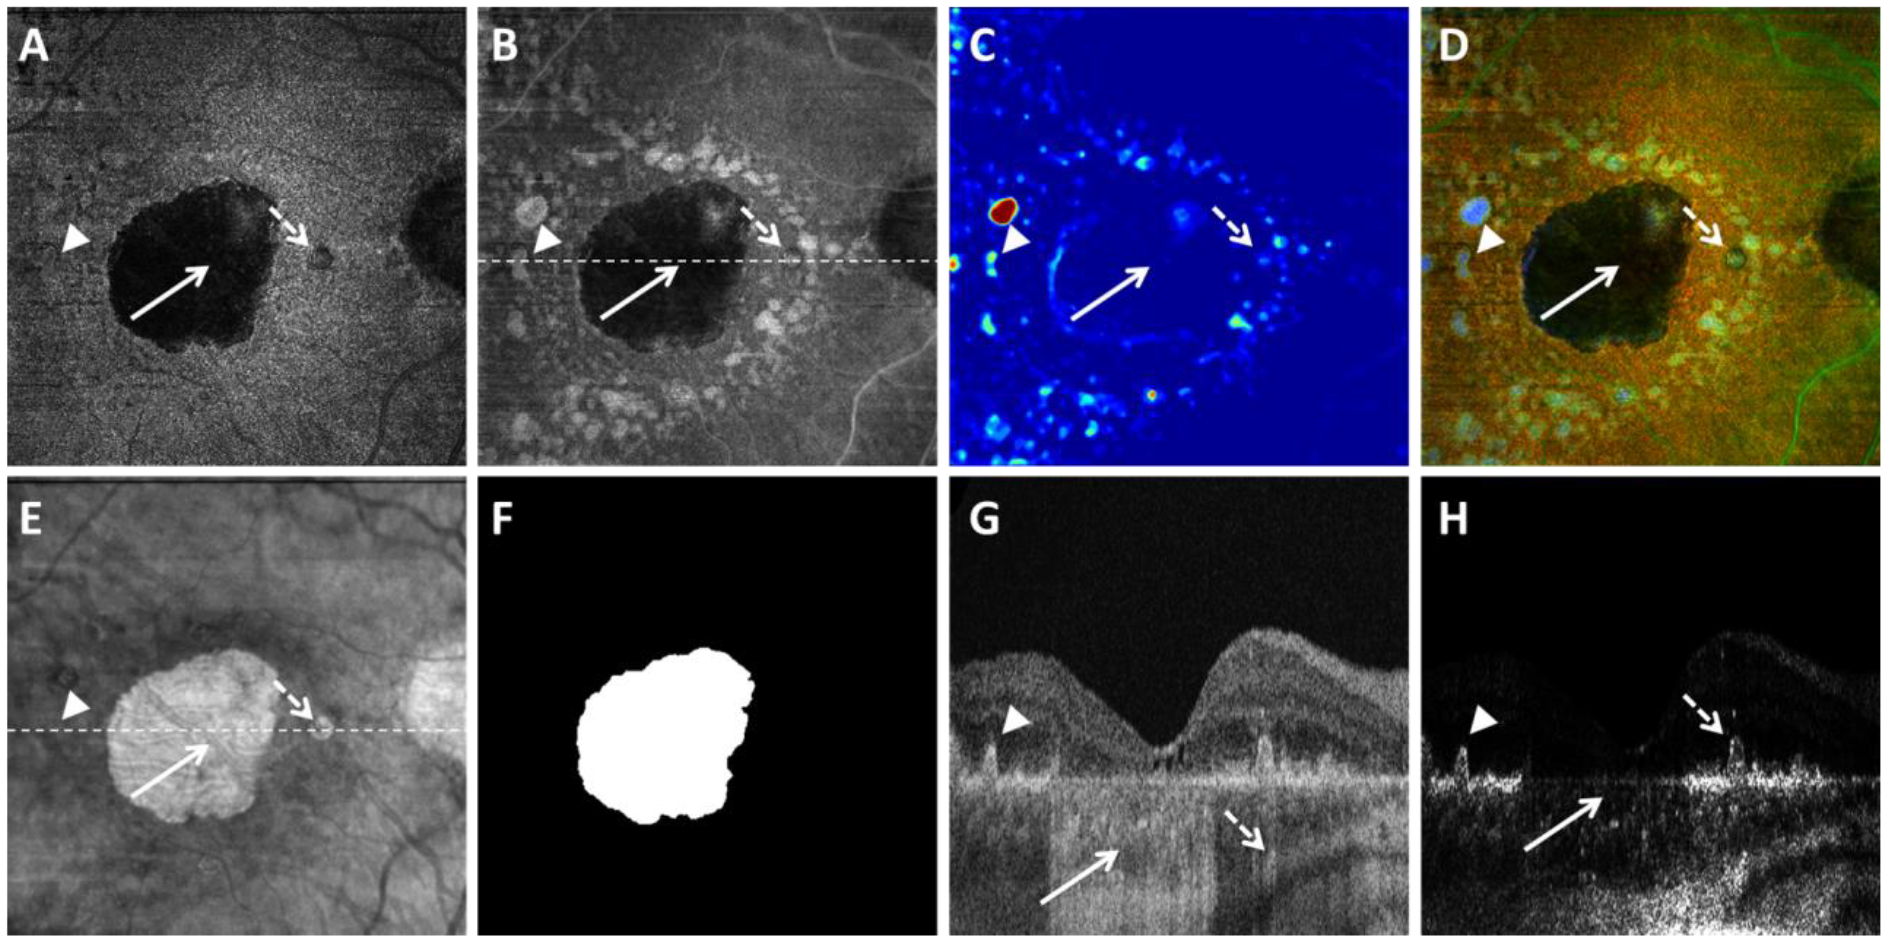
Visualization of geographic atrophy (GA) using the optical attenuation coefficient (OAC) estimated from swept source optical coherence tomography (SS-OCT) scans in a patient with a unifocal lesion. A: OAC max image. B: OAC sum image. C: OAC elevation map. D: OAC false color image. E: OCT subRPE image. F: Ground truth of GA generated by graders. G: OCT B-scan from the same subject, with the location represented in white dashed line in panel B. H: OAC B-scan from the same subject, with the same location as panel G. Solid white arrows indicate complete retinal pigment epithelium (RPE) and outer retinal atrophy, dashed white arrows indicate incomplete RPE and outer retinal atrophy, arrow heads indicate drusen. All images are from a 6×6 mm SS-OCT scan.
Figure 6:
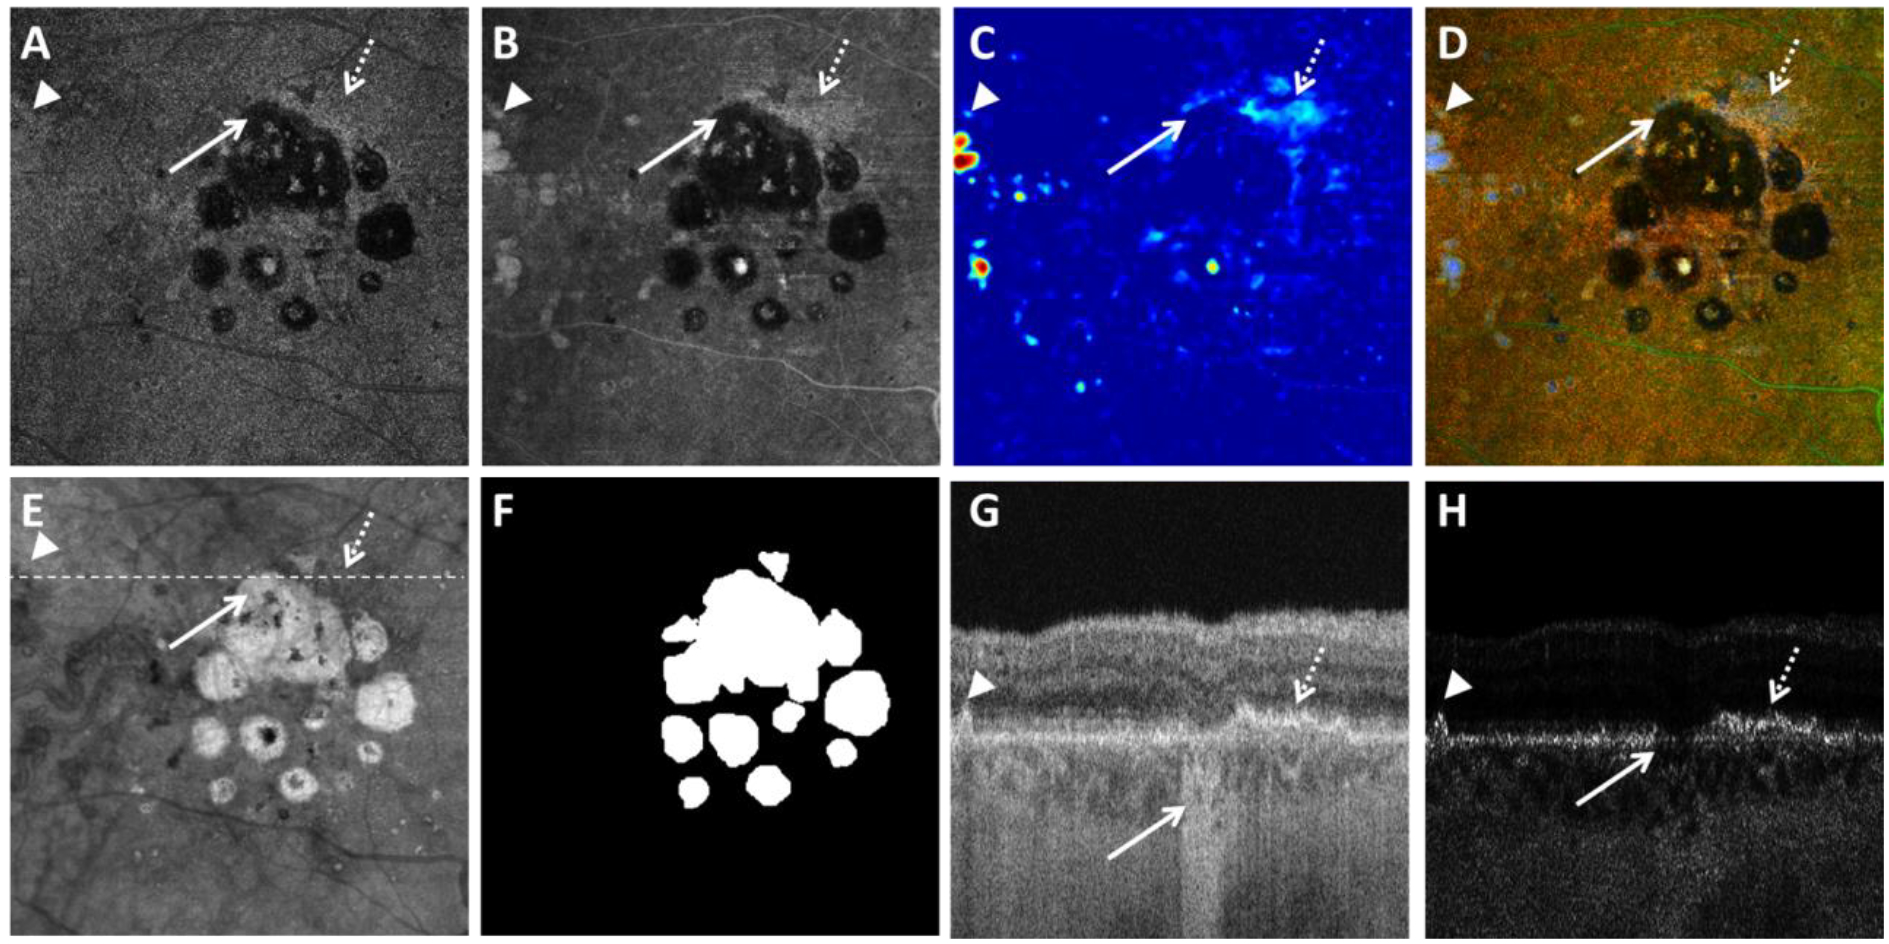
Visualization of geographic atrophy (GA) using the optical attenuation coefficient (OAC) estimated from swept source optical coherence tomography (SS-OCT) scans in a patient with a multifocal lesion. A: OAC max image. B: OAC sum image. C: OAC elevation map. D: OAC false color image. E: OCT subRPE image. F: Ground truth of GA generated by graders. G: OCT B-scan from the same subject, with the location represented in white dashed line in panel B. H: OAC B-scan from the same subject, with the same location as panel G. Solid white arrows indicate complete retinal pigment epithelium (RPE) and outer retinal atrophy, dashed white arrows indicate detected RPE-BM splitting, arrow heads indicate drusen. All images are from a 6×6 mm SS-OCT scan.
For the 38 eyes, the annual square root ERs ranged from 0.11 mm/year to 0.78 mm/year, with a mean of 0.31 mm/year and a SD of 0.15 mm/year. The RPE-BM distance calculated by OAC was found to significantly correlate with the annual GA square root ERs. Table 1 shows specific correlation (r) and significance (p) values for each sub-regional analysis and RPE-BM distances measured in each sub-region. RPE-BM distances in all sub-regions except for R3 showed a significant correlation with GA annual square root ERs. R1, a 1-degree rim region that extends from 0 μm to 300 μm outside the GA margin showed the strongest correlation (r = 0.595, p < 0.001) among all sub-regions though these significant correlations in R1, R2, R1+R2, and the total scan area minus GA were not significantly different from each other. These correlations are graphically shown as scatter plots in Figure 7.
Table 1:
Correlations between retinal pigment epithelium-Bruch’s membrane distances at baseline and the annual square root enlargement rates of geographic atrophy in different regions.
| Regions of interest | RPE-BM distance Mean ± SD (um) | Pearson’ r, p-value |
|---|---|---|
| R1 (0–300 μm) | 11.09 ± 7.74 | r =0.595, p < 0.001 |
| R2 (300–600 μm) | 9.33 ± 7.14 | r =0.526, p = 0.001 |
| R1+R2 (0–600 μm) | 9.88 ± 6.90 | r =0.571, p < 0.001 |
| R3 (total scan area minus GA, R1, R2) | 3.92 ± 3.33 | r =0.264, p = 0.110 |
| Total scan area minus GA | 5.53 ± 3.89 | r =0.407, p = 0.011 |
PRE = retinal pigment epithelium; BM = Bruch’s membrane; ER = enlargement rates; SD = standard deviation.
Figure 7:
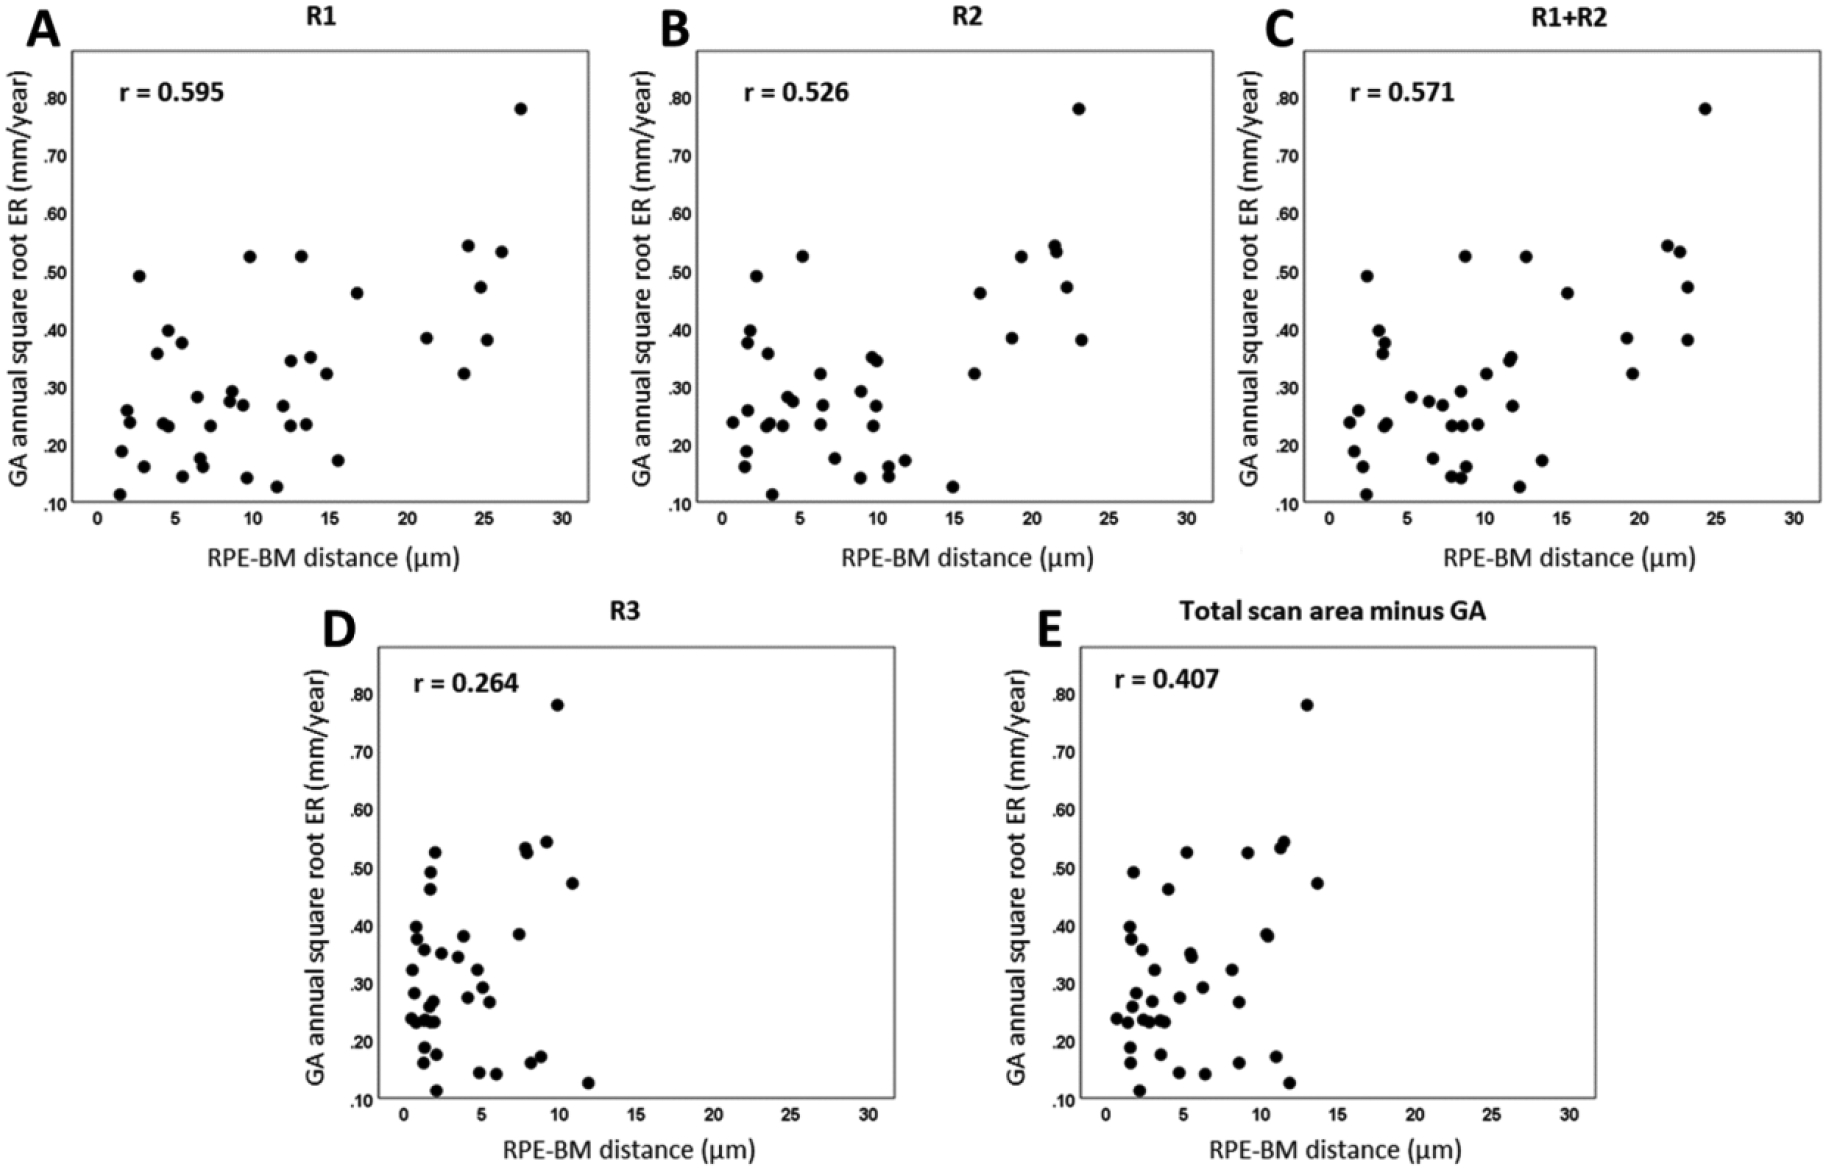
Scatter plots showing correlations between retinal pigment epithelium-Bruch’s membrane (RPE-BM) distance at baseline and the annual square root enlargement rates (ERs) of geographic atrophy (GA) in different regions: R1 (A), R2 (B), R1+R2 (C), R3 (D) and total scan area minus GA (E).
Figure 8 shows examples to illustrate the relationship between the OAC measured RPE-BM distances and the GA growth. Panels A, B, and C show the baseline visit false color OAC images from three subjects with slow, medium, and fast growth, with an annual square root ER of 0.13 mm/year, 0.32 mm/year, and 0.52 mm/year, respectively. The dashed white lines represent the GA boundaries at baseline visits and the solid white lines represent the GA boundaries at 1-year follow-up visits. Panels D, E, and F show the baseline visit OAC elevation maps with different sub-regions used for the correlation analyses.
Figure 8:
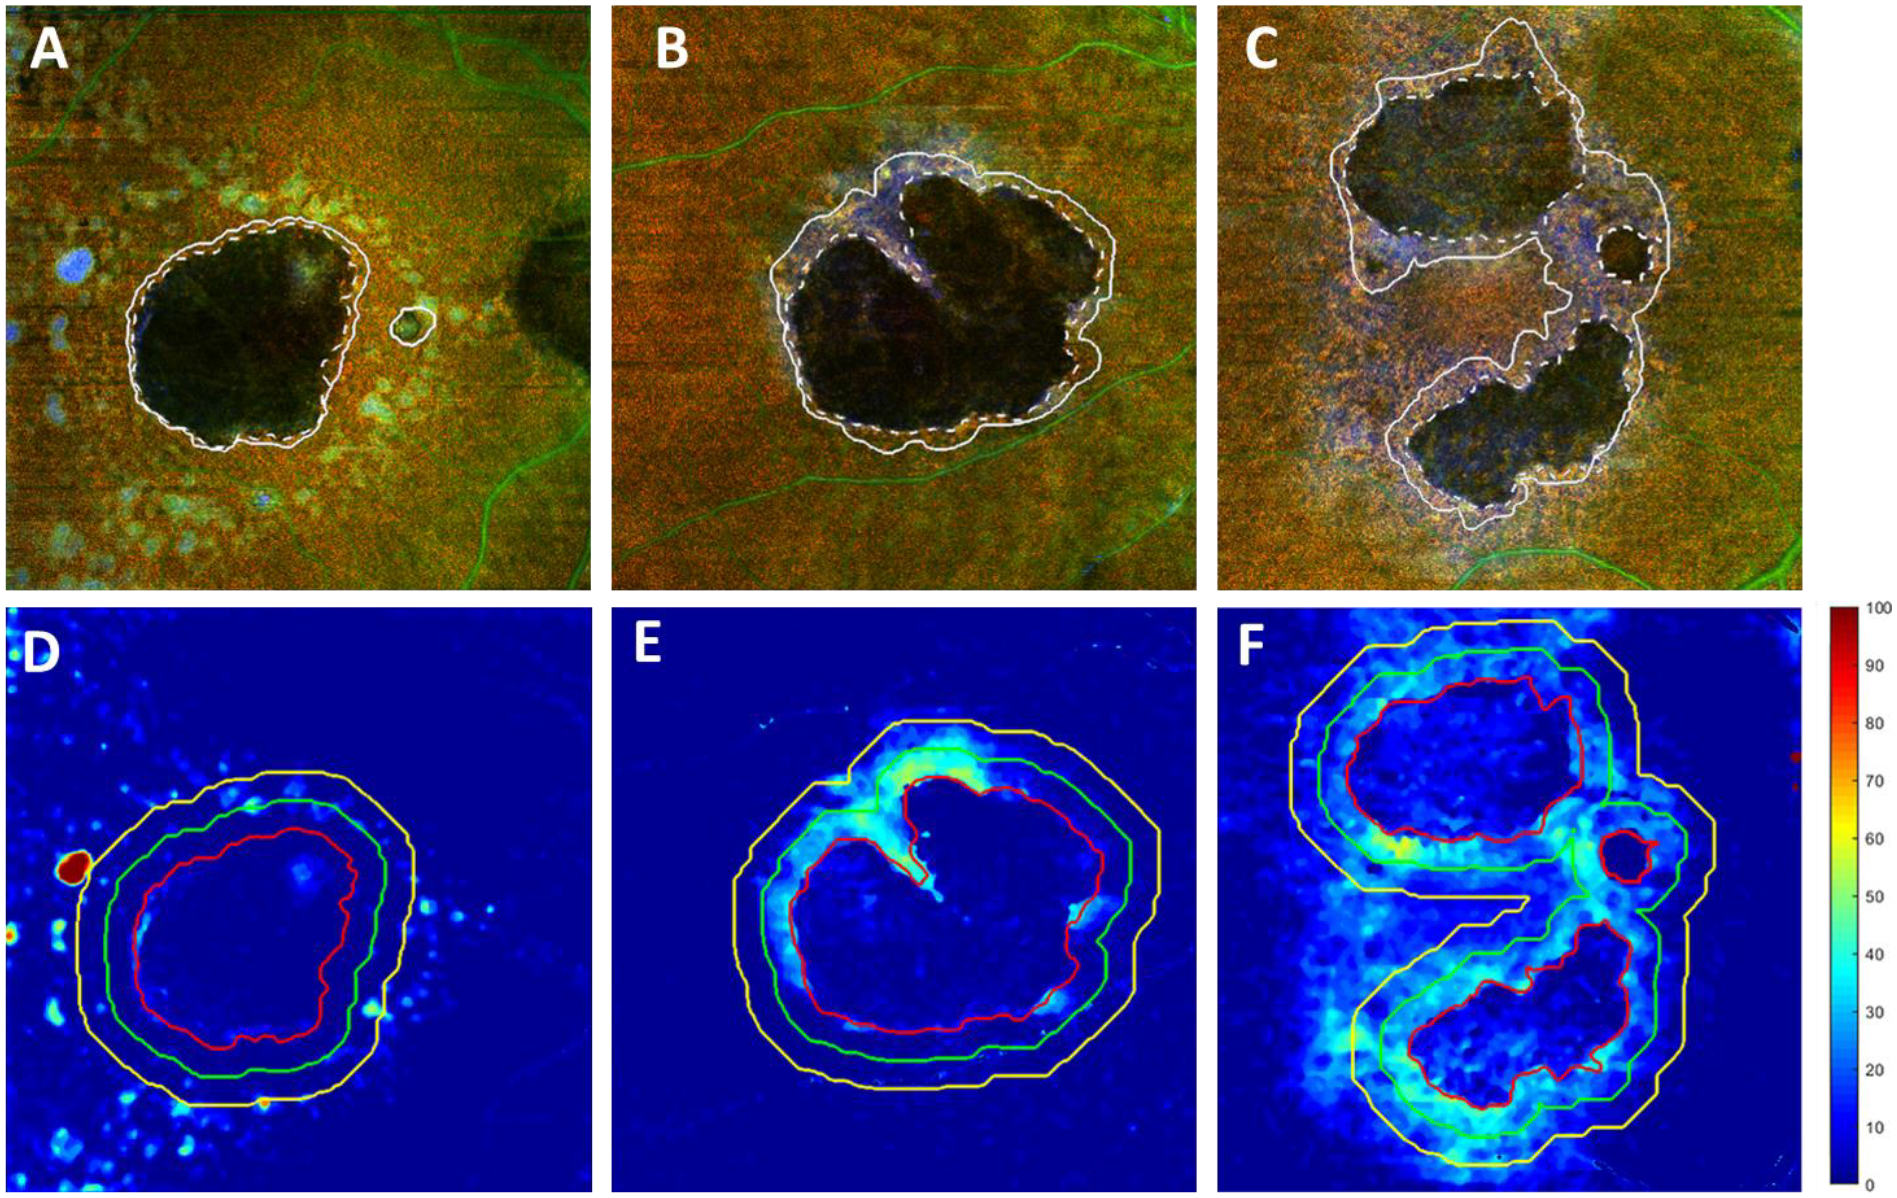
Examples of the retinal pigment epithelium (RPE) - Bruch’s membrane (BM) distances measured using the optical attenuation coefficient (OAC) around geographic atrophy (GA) lesions with different annual square root enlargement rates (ERs). A-C show baseline visit false color OAC images of subjects with GA having an annual square root ERs of 0.13 mm/year, 0.32 mm/year, and 0.52 mm/year, respectively. Dashed lines depict the outlined GA boundary at baseline visits and the solid lines depict the outlined GA boundary at the 1-year follow-up visits. D-F show the OAC measured RPE to BM distance maps from baseline visits of the same subjects. Red lines represent the outlined GA boundary, green lines represent a 300 μm rim around the GA boundary and yellow lines represent a 600 μm rim around the GA boundary.
As previously reported, we also found a significant correlation between the annual square root ERs of GA and CC FD% in these same eyes.36 To further understand the relationships between CC FD% and RPE-BM distances, Pearson’s correlation was performed between these two metrics in each sub-regions and no significant correlations were found in any sub-regions (all Pearson’s r < 0.083, all p > 0.622). Therefore, CC FD% in the total scan area minus GA (strongest correlation) and RPE-BM distance in R1 (strongest correlation) were combined to fit a multiple linear regression model to predict annual square root ERs for GA:
| (2) |
Using both variables, our multiple regression model resulted in a combined r of 0.75 and r2 of 0.57 and Figure 9 shows the scatter plot of measured GA annual square root ER against predicted GA annual square root ER for all 38 eyes.
Figure 9:
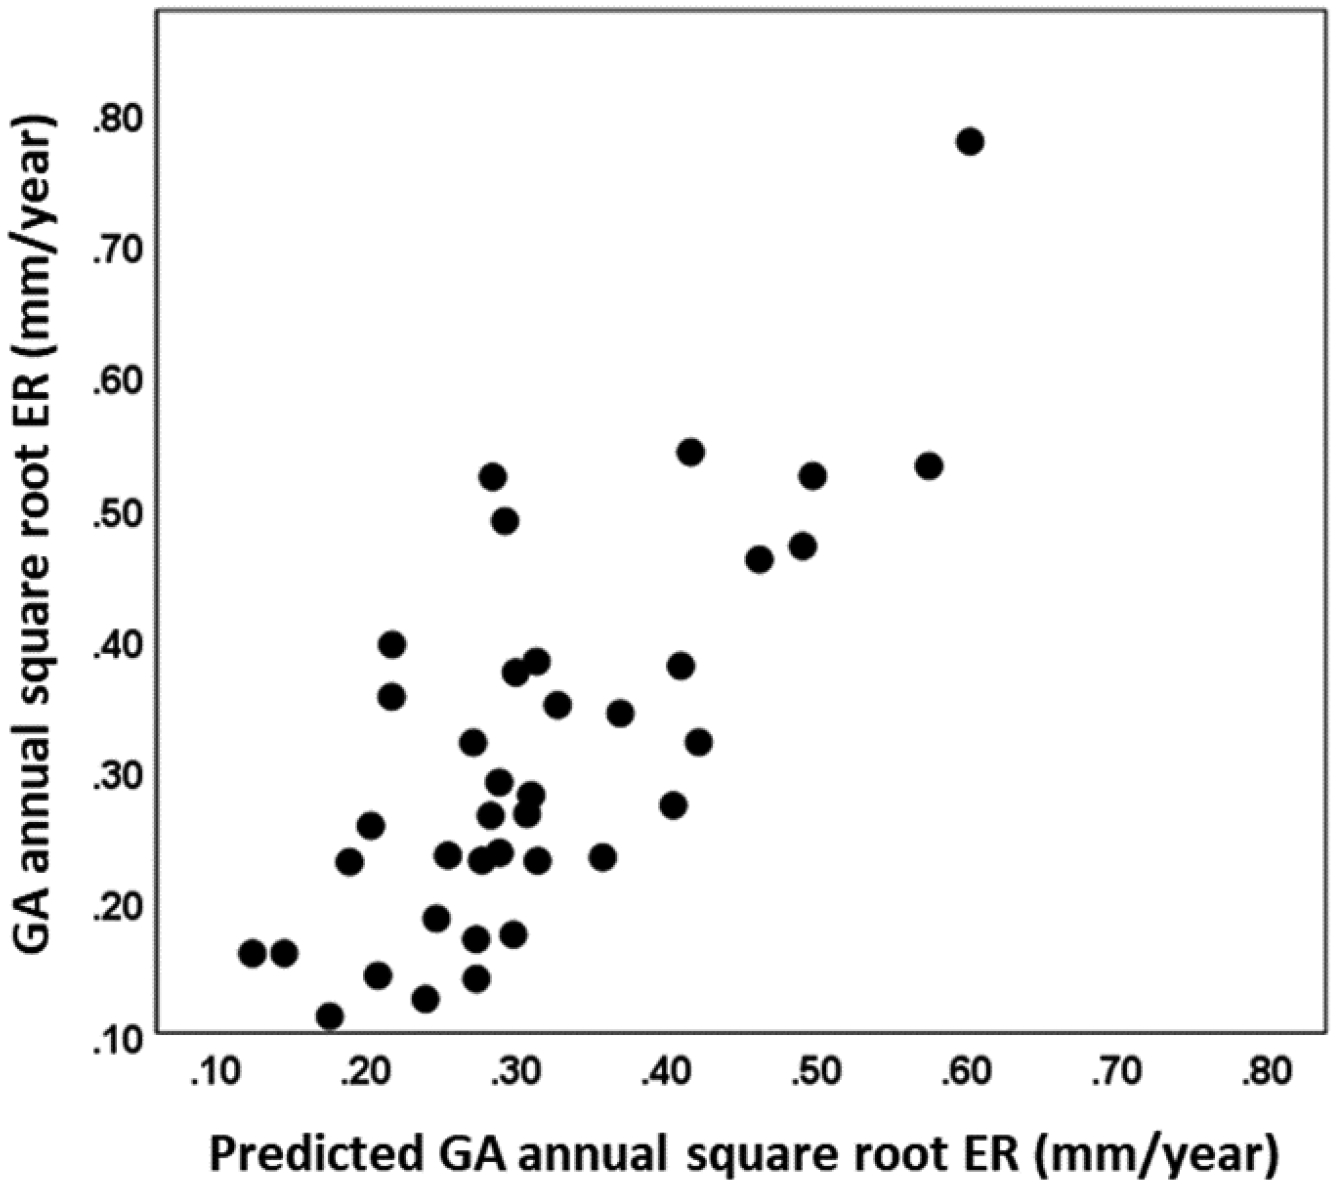
Scatter plot of measured geographic atrophy (GA) annual square root enlargement rate (ER) against predicted GA annual square root ER for all 38 eyes. Predicted GA annual square root ER was generated using a multiple regression model with the retinal pigment epithelium to Bruch’s membrane distance in the 0–300 μm rim outside of the GA and choriocapillaris flow deficit percentage in the total scan area minus GA.
DISCUSSION
In this study, we introduced a new approach for visualizing and documenting GA using the OAC derived from OCT data, we measured RPE-BM distance using the proposed OAC approach and demonstrated that thicker RPE-BM distances positively correlated with faster GA annual square root ERs, and, we showed that a multiple regression model using both RPE-BM distance and CC FD% can predict GA annual square root ERs. With our proposed OAC approach, we introduced a composite strategy of visualizing GA by combining the strong suits of traditional OCT imaging with the power of the OAC. Since OAC captures the tissue’s ability to absorb and scatter light, it provides a high contrast mechanism to identify pigmentation in the retina and this mechanism is not specific to lipofuscin or melanin. When RPE cells die and lose pigments, their OAC values significantly decrease, resulting in regions with a much darker appearance on OAC images that correspond to GA, much like the loss of lipofuscin results in a dark region when using FAF imaging. However, the advantage of OCT imaging is the ability to generate depth-resolved images. By creating a custom slab above BM, we generated three distinct en face images to provide depth-resolved information to identify GA and the surrounding RPE. A simple maximum projection of the OAC slab (600 μm above BM to BM) effectively allows direct visualization of RPE so that OAC max images generated this way could be used to identify regions of complete RPE loss. OAC sum images highlight regions where the OAC may be elevated, such as drusen, and regions of incomplete RPE loss. Thus, regions of complete RPE loss, or cRORA, would appear dark in both the max and sum projections while regions of incomplete RPE loss, or incomplete RPE and outer retina atrophy (iRORA), such as hyperTDs associated with drusen or regions undergoing RPE loss, would appear gray, providing a possibility to differentiate cRORA and iRORA from en face images. The third OAC image is the OAC elevation map, which captures the distance from the RPE to BM. This distance map allows quantification of RPE elevation, though it does not differentiate between drusen, BLamDs, or other sources of RPE/BM separation. Using these three en face images, we proposed a new false color OAC image to visualize and document GA, as demonstrated in Figures 5 and 6. Compared with traditional OCT subRPE images, this new false color OAC approach provides a better contrast as it does not include any choroidal features such as prominent choroidal vessels as with the subRPE slab images. Moreover, the color coded OAC image also provides depth information, namely, the distance from RPE to BM. Effectively, it could be used to identify GA, as well as drusen, and drusen with choroidal hyperTDs.
In addition to visualizing disease progression in the formation and growth of GA, we also quantified RPE-BM distances using the OAC measured RPE elevation in different rim regions around the GA and found significant positive correlations between GA annual square root ER and RPE-BM distance. In our analysis, thicker RPE-BM distances resulted in a significant positive correlation with GA annual square root ER in all sub-regions except for R3, which is the total scan area minus GA, R1, and R2. The R1 region (0–300 μm around the GA) resulted in the strongest correlation (r =0.595, p < 0.001) and the total scan area minus GA, R1, and R2, designated R3, resulted in weakest significant correlation (r =0.264, p = 0.110). This result strongly suggests that the thickened RPE/BM complex around the GA margin contributes to faster GA growth and this thickening is a local effect along the margins of GA. In the datasets, we observed two major sources of RPE/BM separation that included drusen associated RPE elevations (Figure 8D) and a more homogenously shallower RPE elevation that was not associated with typical drusen (Figure 8F). One of the possible sources of this low lying RPE elevation could be BLamDs as previous histopathological studies have identified BLamDs as a major contributing factor for thickened RPE/BM complex around the margins of GA.49 Previously, Fleckenstein et al. reported a separation within the RPE/BM complex on SD-OCT B-scans from eyes with the rapidly progressing diffuse-trickling GA phenotype identified by FAF. Our results are consistent with their previous findings as we measured RPE-BM distance from the en face view and found that eyes with thicker RPE/BM complex around the GA tended to progress faster. To the best of our knowledge, our study is the first study to directly measure RPE-BM distances around GA eyes in vivo and show a significant correlation between the RPE-BM distance around the GA and GA annual square root ERs.
Interestingly, we found no significant correlations between RPE-BM distance and CC flow impairment36 (Pearson’s r < 0.083, p > 0.622 in all sub-regions).This likely indicates that CC abnormalities and RPE/BM abnormalities are two independent contributing factors for GA growth. This would further serve as proof that the compensation strategy55, 56 for CC analysis that we’ve employed is valid as increased RPE elevation was not associated with decreased CC perfusion. In the RPE-BM distance analyses, we found the strongest correlation with GA growth in the R1 region (r =0.595, p < 0.001) while in the CC analyses, we found the strongest correlation with GA growth in the total scan area minus the GA region (r =0.625, p < 0.001). Though the correlations in different sub-regions were not significantly different from each other, this discrepancy might indicate that the loss of CC perfusion has a more global effect on GA growth while the thickened RPE/BM complex has a more local effect on GA growth. By combining the CC FD% in total scan area minus GA and the RPE-BM distance in R1, we developed a multiple regression model to predict GA annual square root ER that resulted in a combined r of 0.75 and r2 of 0.57. While the r2 estimate may be exaggerated by some over-fitting due to evaluating the linear regression model on the same data used to construct it, our results suggest that future studies should consider including both CC perfusion deficits and RPE/BM complex thickness measurements when developing models to predict GA growth.
There are several limitations of our study. First, the approach we selected to calculate OAC is an estimation of the true OAC values and might not be entirely accurate. We chose to use this single-scattering depth-resolved approach because it allows us to derive OAC values for each individual pixel along the A-line and it is computationally simpler to adopt. Approaches using curve fitting and multiple-scattering models could result in more accurate OAC estimation but might not fit our specific purpose.57–59 Another limitation for our OAC approach is that we assumed total light attenuation in the entire A-Scan, but when light did not attenuate to zero, our OAC approach will result in reversed projection artifacts from the choroid. Such artifacts could be further reduced by developing reverse projection artifacts removal methods or adopting more optimized OAC estimation approaches.60 Second, we are not able to confirm for now that the OAC measured RPE-BM thickness is entirely caused by BLamD. Our approach of RPE-BM distance measurement does not differentiate BLamDs from drusen or basal linear deposits, or other sources of RPE elevation. Future studies are warranted to further differentiate BLamD from other sources of RPE elevation. Third, our approach is not completely automated, and manual intervention was sometimes required to correct the segmentation of BM. However, with the future development of automatic and accurate BM segmentation, our approach could become fully automated. Lastly, it should be noted that though our analysis was based on SS-OCT data, our proposed method can equally be applied to SD-OCT data.
To summarize, we reported a novel approach to visualize GA using OAC derived from the entire OCT dataset, and this approach also allowed for the measurement of RPE-BM distances that could be presented using an en face view. Using the same 38 GA eyes that were previously published, we found significant correlations between GA annual square root ERs and the RPE-BM distances around the GA. Combined with our previously published CC analysis, we developed a multiple regression model with a combined r2 of 0.57 to predict GA annual square root ERs using the CC FD% and the RPE-BM distance measurements.
Highlights.
Optical attenuation coefficients calculated from OCT datasets could identify geographic atrophy on customized en face images.
Retinal pigment epithelium to Bruch’s membrane distances around geographic atrophy calculated by optical attenuation coefficients predict the annual square root enlargement rate of geographic atrophy.
Thickened retinal pigment epithelium/Bruch’s membrane complex around the geographic atrophy is not correlated with choriocapillaris perfusion deficits in the same region.
ACKNOWLEDGMENTS/DISCLOSURES:
a. Funding/Support: Research supported by grants from the National Eye Institute (R01EY024158, R01EY028753), the Salah Foundation, Carl Zeiss Meditec, an unrestricted grant from the Research to Prevent Blindness, Inc., New York, NY, and the National Eye Institute Center Core Grant (P30EY014801) to the Department of Ophthalmology, University of Miami Miller School of Medicine. The funding organization had no role in the design or conduct of this research.
b. Financial Disclosures: Dr. Gregori, Dr. Wang and Dr. Rosenfeld received research support from Carl Zeiss Meditec, Inc. Dr. Gregori and the University of Miami co-own a patent that is licensed to Carl Zeiss Meditec, Inc.
Dr. Rosenfeld also receives research support from Stealth BioTherapeutics. He is a consultant for Apellis, Biogen, Boehringer-Ingelheim, Carl Zeiss Meditec, Biogen, Chengdu Kanghong Biotech, EyePoint, Ocunexus Therapeutics, Ocudyne, and Unity Biotechnology. Philip Rosenfeld has equity interest in Apellis, Valitor, Verana Health, and Ocudyne.Dr. Wang discloses intellectual property owned by the Oregon Health and Science University and the University of Washington. Dr. Wang also receives research support from Tasso Inc, Moptim Inc, Colgate Palmolive Company and Facebook technologies LLC. He is a consultant to Insight Photonic Solutions, Kowa, and Carl Zeiss Meditec.
The remaining authors have no disclosures.
c. Other Acknowledgments: None.
Abbreviations:
- GA
geographic atrophy
- AMD
age-related macular degeneration
- RPE
retinal pigment epithelium
- CC
choriocapillaris
- cRORA
complete RPE and outer retinal atrophy
- ER
enlargement rate
- CFI
color fundus imaging
- FAF
fundus autofluorescence
- OCT
optical coherence tomography
- SD-OCT
spectral domain OCT
- SS-OCT
swept-source OCT
- BLamDs
basal laminar deposits
- FD
flow deficit
- OAC
optical attenuation coefficients
- BM
Bruch’s membrane
- IRB
Institutional Review Board
- iRORA
incomplete RPE and outer retina atrophy
Footnotes
Publisher's Disclaimer: This is a PDF file of an unedited manuscript that has been accepted for publication. As a service to our customers we are providing this early version of the manuscript. The manuscript will undergo copyediting, typesetting, and review of the resulting proof before it is published in its final form. Please note that during the production process errors may be discovered which could affect the content, and all legal disclaimers that apply to the journal pertain.
REFERENCES
- 1.Fleckenstein M, Keenan TD, Guymer RH, et al. Age-related macular degeneration. Nature Reviews Disease Primers. 2021;7(1):1–25. [DOI] [PubMed] [Google Scholar]
- 2.Bird AC, Phillips RL, Hageman GS. Geographic atrophy: a histopathological assessment. JAMA ophthalmology. 2014;132(3):338–345. [DOI] [PMC free article] [PubMed] [Google Scholar]
- 3.Chakravarthy U, Bailey CC, Johnston RL, et al. Characterizing disease burden and progression of geographic atrophy secondary to age-related macular degeneration. Ophthalmology. 2018;125(6):842–849. [DOI] [PubMed] [Google Scholar]
- 4.Sadda SR, Guymer R, Holz FG, et al. Consensus definition for atrophy associated with age-related macular degeneration on OCT: classification of atrophy report 3. Ophthalmology. 2018;125(4):537–548. [DOI] [PMC free article] [PubMed] [Google Scholar]
- 5.Rosenfeld PJ. Preventing the growth of geographic atrophy: an important therapeutic target in age-related macular degeneration. Ophthalmology. 2018;125(6):794–795. [DOI] [PubMed] [Google Scholar]
- 6.Li H, Chintalapudi SR, Jablonski MM. Current drug and molecular therapies for the treatment of atrophic age-related macular degeneration: phase I to phase III clinical development. Expert Opin Investig Drugs. 2017/10/03 2017;26(10):1103–1114. doi: 10.1080/13543784.2017.1369042 [DOI] [PubMed] [Google Scholar]
- 7.Liao DS, Grossi FV, El Mehdi D, et al. Complement C3 inhibitor pegcetacoplan for geographic atrophy secondary to age-related macular degeneration: a randomized phase 2 trial. Ophthalmology. 2020;127(2):186–195. [DOI] [PubMed] [Google Scholar]
- 8.Jaffe GJ, Westby K, Csaky KG, et al. C5 inhibitor Avacincaptad pegol for geographic atrophy due to age-related macular degeneration: a randomized pivotal phase 2/3 trial. Ophthalmology. 2021;128(4):576–586. [DOI] [PubMed] [Google Scholar]
- 9.Csaky KG, Richman EA, Ferris FL. Report from the NEI/FDA ophthalmic clinical trial design and endpoints symposium. Invest Ophthalmol Vis Sci. 2008;49(2):479–489. [DOI] [PubMed] [Google Scholar]
- 10.Yehoshua Z, Rosenfeld PJ, Albini TA. Current clinical trials in dry AMD and the definition of appropriate clinical outcome measures. Taylor & Francis; 2011:167–180. [DOI] [PubMed] [Google Scholar]
- 11.Schaal KB, Rosenfeld PJ, Gregori G, Yehoshua Z, Feuer WJ. Anatomic clinical trial endpoints for nonexudative age-related macular degeneration. Ophthalmology. 2016;123(5):1060–1079. [DOI] [PubMed] [Google Scholar]
- 12.Csaky K, Ferris F, Chew EY, Nair P, Cheetham JK, Duncan JL. Report from the NEI/FDA endpoints workshop on age-related macular degeneration and inherited retinal diseases. Invest Ophthalmol Vis Sci. 2017;58(9):3456–3463. [DOI] [PMC free article] [PubMed] [Google Scholar]
- 13.Fleckenstein M, Mitchell P, Freund KB, et al. The progression of geographic atrophy secondary to age-related macular degeneration. Ophthalmology. 2018;125(3):369–390. [DOI] [PubMed] [Google Scholar]
- 14.Shi Y, Yang J, Feuer W, Gregori G, Rosenfeld PJ. Persistent Hyper-Transmission Defects on En Face OCT Imaging as a Stand-Alone Precursor for the Future Formation of Geographic Atrophy. Ophthalmology Retina. 2021; [DOI] [PubMed] [Google Scholar]
- 15.Thulliez M, Motulsky EH, Feuer W, Gregori G, Rosenfeld PJ. En face imaging of geographic atrophy using different swept-source OCT scan patterns. Ophthalmol Retina. 2019;3(2):122–132. [DOI] [PubMed] [Google Scholar]
- 16.Schmitz-Valckenberg S, Sahel J-A, Danis R, et al. Natural history of geographic atrophy progression secondary to age-related macular degeneration (Geographic Atrophy Progression Study). Ophthalmology. 2016;123(2):361–368. [DOI] [PubMed] [Google Scholar]
- 17.Choi W, Moult EM, Waheed NK, et al. Ultrahigh-speed, swept-source optical coherence tomography angiography in nonexudative age-related macular degeneration with geographic atrophy. Ophthalmology. 2015;122(12):2532–2544. [DOI] [PMC free article] [PubMed] [Google Scholar]
- 18.Fleckenstein M, Schmitz-Valckenberg S, Adrion C, et al. Tracking progression with spectral-domain optical coherence tomography in geographic atrophy caused by age-related macular degeneration. Invest Ophthalmol Vis Sci. 2010;51(8):3846–3852. [DOI] [PubMed] [Google Scholar]
- 19.Fleckenstein M, Issa PC, Helb H-M, et al. High-resolution spectral domain-OCT imaging in geographic atrophy associated with age-related macular degeneration. Invest Ophthalmol Vis Sci. 2008;49(9):4137–4144. [DOI] [PubMed] [Google Scholar]
- 20.Sunness JS, Margalit E, Srikumaran D, et al. The long-term natural history of geographic atrophy from age-related macular degeneration: enlargement of atrophy and implications for interventional clinical trials. Ophthalmology. 2007;114(2):271–277. [DOI] [PMC free article] [PubMed] [Google Scholar]
- 21.Scholl HP, Peto T, Dandekar S, et al. Inter-and intra-observer variability in grading lesions of age-related maculopathy and macular degeneration. Graefes Arch Clin Exp Ophthalmol. 2003;241(1):39–47. [DOI] [PubMed] [Google Scholar]
- 22.Shen LL, Liu F, Nardini HG, Del Priore LV. Reclassification of fundus autofluorescence patterns surrounding geographic atrophy based on progression rate: a systematic review and meta-analysis. Retina. 2019;39(10):1829–1839. [DOI] [PubMed] [Google Scholar]
- 23.Schmitz-Valckenberg S, Bindewald-Wittich A, Dolar-Szczasny J, et al. Correlation between the area of increased autofluorescence surrounding geographic atrophy and disease progression in patients with AMD. Invest Ophthalmol Vis Sci. 2006;47(6):2648–2654. [DOI] [PubMed] [Google Scholar]
- 24.Holz FG, Bindewald-Wittich A, Fleckenstein M, et al. Progression of geographic atrophy and impact of fundus autofluorescence patterns in age-related macular degeneration. Am J Ophthalmol. 2007;143(3):463–472. e2. [DOI] [PubMed] [Google Scholar]
- 25.Laiginhas R, Yang J, Rosenfeld PJ, Falcão M. Nonexudative macular neovascularization–a systematic review of prevalence, natural history, and recent insights from OCT angiography. Ophthalmol Retina. 2020;4(7):651–661. [DOI] [PMC free article] [PubMed] [Google Scholar]
- 26.Moult E, Choi W, Waheed NK, et al. Ultrahigh-speed swept-source OCT angiography in exudative AMD. Ophthalmic Surg Lasers Imaging Retina. 2014;45(6):496–505. [DOI] [PMC free article] [PubMed] [Google Scholar]
- 27.Yehoshua Z, Rosenfeld PJ, Gregori G, et al. Progression of geographic atrophy in age-related macular degeneration imaged with spectral domain optical coherence tomography. Ophthalmology. 2011;118(4):679–686. [DOI] [PMC free article] [PubMed] [Google Scholar]
- 28.Yu Y, Moult EM, Chen S, et al. Developing a potential retinal OCT biomarker for local growth of geographic atrophy. Biomed Opt Express. 2020;11(9):5181–5196. [DOI] [PMC free article] [PubMed] [Google Scholar]
- 29.Ji Z, Chen Q, Niu S, Leng T, Rubin DL. Beyond retinal layers: a deep voting model for automated geographic atrophy segmentation in SD-OCT images. Transl Vis Sci Technol. 2018;7(1):1–1. [DOI] [PMC free article] [PubMed] [Google Scholar]
- 30.Chiu SJ, Izatt JA, O’Connell RV, Winter KP, Toth CA, Farsiu S. Validated automatic segmentation of AMD pathology including drusen and geographic atrophy in SD-OCT images. Invest Ophthalmol Vis Sci. 2012;53(1):53–61. [DOI] [PubMed] [Google Scholar]
- 31.Yehoshua Z, de Amorim Garcia Filho CA, Nunes RP, et al. Comparison of geographic atrophy growth rates using different imaging modalities in the COMPLETE study. Ophthalmic Surg Lasers Imaging Retina. 2015;46(4):413–422. [DOI] [PubMed] [Google Scholar]
- 32.Yehoshua Z, Garcia Filho CAA, Penha FM, et al. Comparison of geographic atrophy measurements from the OCT fundus image and the sub-RPE slab image. Ophthalmic Surg Lasers Imaging Retina. 2013;44(2):127–132. [DOI] [PubMed] [Google Scholar]
- 33.Guymer RH, Rosenfeld PJ, Curcio CA, et al. Incomplete retinal pigment epithelial and outer retinal atrophy in age-related macular degeneration: classification of atrophy meeting report 4. Ophthalmology. 2020;127(3):394–409. [DOI] [PMC free article] [PubMed] [Google Scholar]
- 34.Sayegh RG, Simader C, Scheschy U, et al. A systematic comparison of spectral-domain optical coherence tomography and fundus autofluorescence in patients with geographic atrophy. Ophthalmology. 2011;118(9):1844–1851. [DOI] [PubMed] [Google Scholar]
- 35.Niu S, de Sisternes L, Chen Q, Rubin DL, Leng T. Fully automated prediction of geographic atrophy growth using quantitative spectral-domain optical coherence tomography biomarkers. Ophthalmology. 2016;123(8):1737–1750. [DOI] [PubMed] [Google Scholar]
- 36.Shi Y, Zhang Q, Zhou H, et al. Correlations Between Choriocapillaris and Choroidal Measurements and the Growth of Geographic Atrophy Using Swept Source OCTImaging. Am J Ophthalmol. 2021;224:321–331. [DOI] [PMC free article] [PubMed] [Google Scholar]
- 37.Bhutto I, Lutty G. Understanding age-related macular degeneration (AMD): relationships between the photoreceptor/retinal pigment epithelium/Bruch’s membrane/choriocapillaris complex. Mol Aspects Med. 2012;33(4):295–317. [DOI] [PMC free article] [PubMed] [Google Scholar]
- 38.Christenbury JG, Folgar FA, O’Connell RV, et al. Progression of intermediate age-related macular degeneration with proliferation and inner retinal migration of hyperreflective foci. Ophthalmology. 2013;120(5):1038–1045. [DOI] [PMC free article] [PubMed] [Google Scholar]
- 39.McLeod DS, Grebe R, Bhutto I, Merges C, Baba T, Lutty GA. Relationship between RPE and choriocapillaris in age-related macular degeneration. Invest Ophthalmol Vis Sci. 2009;50(10):4982–4991. [DOI] [PMC free article] [PubMed] [Google Scholar]
- 40.Veerappan M, El-Hage-Sleiman A-KM, Tai V, et al. Optical coherence tomography reflective drusen substructures predict progression to geographic atrophy in age-related macular degeneration. Ophthalmology. 2016;123(12):2554–2570. [DOI] [PMC free article] [PubMed] [Google Scholar]
- 41.Marsiglia M, Boddu S, Bearelly S, et al. Association between geographic atrophy progression and reticular pseudodrusen in eyes with dry age-related macular degeneration. Invest Ophthalmol Vis Sci. 2013;54(12):7362–7369. [DOI] [PMC free article] [PubMed] [Google Scholar]
- 42.Nassisi M, Shi Y, Fan W, et al. Choriocapillaris impairment around the atrophic lesions in patients with geographic atrophy: a swept-source optical coherence tomography angiography study. Br J Ophthalmol. 2019;(103):911–917. [DOI] [PubMed] [Google Scholar]
- 43.Thulliez M, Zhang Q, Shi Y, et al. Correlations between choriocapillaris flow deficits around geographic atrophy and enlargement rates based on swept-source OCT imaging. Ophthalmol Retina. 2019;3(6):478–488. [DOI] [PMC free article] [PubMed] [Google Scholar]
- 44.Nassisi M, Baghdasaryan E, Borrelli E, Ip M, Sadda SR. Choriocapillaris flow impairment surrounding geographic atrophy correlates with disease progression. PLoS One. 2019;14(2):e0212563. [DOI] [PMC free article] [PubMed] [Google Scholar]
- 45.Stetson PF, Yehoshua Z, Garcia Filho CAA, Nunes RP, Gregori G, Rosenfeld PJ. OCT minimum intensity as a predictor of geographic atrophy enlargement. Invest Ophthalmol Vis Sci. 2014;55(2):792–800. [DOI] [PMC free article] [PubMed] [Google Scholar]
- 46.Fleckenstein M, Schmitz-Valckenberg S, Lindner M, et al. The “diffuse-trickling” fundus autofluorescence phenotype in geographic atrophy. Invest Ophthalmol Vis Sci. 2014;55(5):2911–2920. [DOI] [PubMed] [Google Scholar]
- 47.Allingham MJ, Nie Q, Lad EM, et al. Semiautomatic segmentation of rim area focal hyperautofluorescence predicts progression of geographic atrophy due to dry age-related macular degeneration. Invest Ophthalmol Vis Sci. 2016;57(4):2283–2289. [DOI] [PMC free article] [PubMed] [Google Scholar]
- 48.Bearelly S, Khanifar AA, Lederer DE, et al. Use of fundus autofluorescence images to predict geographic atrophy progression. Retina (Philadelphia, Pa). 2011;31(1):81. [DOI] [PMC free article] [PubMed] [Google Scholar]
- 49.Sura AA, Chen L, Messinger JD, et al. Measuring the Contributions of Basal Laminar Deposit and Bruch’s Membrane in Age-Related Macular Degeneration. Invest Ophthalmol Vis Sci. 2020;61(13):19–19. [DOI] [PMC free article] [PubMed] [Google Scholar]
- 50.Vermeer KA, Mo J, Weda JJ, Lemij HG, de Boer JF. Depth-resolved model-based reconstruction of attenuation coefficients in optical coherence tomography. Biomed Opt Express. 2014;5(1):322–337. [DOI] [PMC free article] [PubMed] [Google Scholar]
- 51.Zhou H, Chu Z, Zhang Q, et al. Attenuation correction assisted automatic segmentation for assessing choroidal thickness and vasculature with swept-source OCT. Biomed Opt Express. 2018;9(12):6067–6080. [DOI] [PMC free article] [PubMed] [Google Scholar]
- 52.Zhou H, Dai Y, Shi Y, et al. Age-Related changes in choroidal thickness and the volume of vessels and stroma using Swept-Source OCT and fully automated algorithms. Ophthalmol Retina. 2020;4(2):204–215. [DOI] [PMC free article] [PubMed] [Google Scholar]
- 53.Yin X, Chao JR, Wang RK. User-guided segmentation for volumetric retinal optical coherence tomography images. J Biomed Opt. 2014;19(8):086020–086020. [DOI] [PMC free article] [PubMed] [Google Scholar]
- 54.Zhang Q, Zhang A, Lee CS, et al. Projection artifact removal improves visualization and quantitation of macular neovascularization imaged by optical coherence tomography angiography. Ophthalmol Retina. 2017;1(2):124–136. [DOI] [PMC free article] [PubMed] [Google Scholar]
- 55.Zhang Q, Zheng F, Motulsky EH, et al. A Novel Strategy for Quantifying Choriocapillaris Flow Voids Using Swept-Source OCT Angiography. Invest Ophthalmol Vis Sci. 2018;59(1):203–211. [DOI] [PMC free article] [PubMed] [Google Scholar]
- 56.Shi Y, Chu Z, Wang L, et al. Validation of a Compensation Strategy Used to Detect Choriocapillaris Flow Deficits Under Drusen With Swept Source OCT Angiography. Am J Ophthalmol.S0002–9394 (20) 30329–9. [DOI] [PMC free article] [PubMed] [Google Scholar]
- 57.Almasian M, Bosschaart N, van Leeuwen TG, Faber DJ. Validation of quantitative attenuation and backscattering coefficient measurements by optical coherence tomography in the concentration-dependent and multiple scattering regime. J Biomed Opt. 2015;20(12):121314. [DOI] [PubMed] [Google Scholar]
- 58.Faber DJ, Van Der Meer FJ, Aalders MC, van Leeuwen TG. Quantitative measurement of attenuation coefficients of weakly scattering media using optical coherence tomography. Opt Express. 2004;12(19):4353–4365. [DOI] [PubMed] [Google Scholar]
- 59.Vermeer K, Van der Schoot J, Lemij H, De Boer J. Quantitative RNFL attenuation coefficient measurements by RPE-normalized OCT data. International Society for Optics and Photonics; 2012:82090U. [Google Scholar]
- 60.Liu J, Ding N, Yu Y, et al. Optimized depth-resolved estimation to measure optical attenuation coefficients from optical coherence tomography and its application in cerebral damage determination. J Biomed Opt. 2019;24(3):035002. [DOI] [PMC free article] [PubMed] [Google Scholar]


