

Abstract
Visual pathways of the brain are organized into parallel channels that code different features of the external environment. In the current study, we investigated the anatomical organization of parallel pathways from the superior colliculus (SC) to the pulvinar nucleus in the mouse. Virus injections placed in the ipsilateral and contralateral SC to induce the expression of different fluorescent proteins defines two pulvinar zones. The lateral pulvinar (Pl) receives ipsilateral SC input and the caudal medial pulvinar (Pcm) receives bilateral SC input. To examine the ultrastructure of these projections using transmission electron microscopy, we injected the SC with viruses to induce peroxidase expression within synaptic vesicles or mitochondria. We quantitatively compared the sizes of ipsilateral and contralateral tectopulvinar terminals and their postsynaptic dendrites, as well as the sizes of the overall population of synaptic terminals and their postsynaptic dendrites in the Pl and Pcm. Our ultrastructural analysis revealed that ipsilateral tectopulvinar terminals are significantly larger than contralateral tectopulvinar terminals. In particular, the ipsilateral tectopulvinar projection includes a subset of large terminals (≥ 1 μm2) that envelop dendritic protrusions of postsynaptic dendrites. We also found that both ipsilateral and contralateral tectopulvinar terminals are significantly larger than the overall population of synaptic terminals in both the Pl and Pcm. Thus, the ipsilateral tectopulvinar projection is structurally distinct from the bilateral tectopulvinar pathway, but both tectopulvinar channels may be considered the primary or “driving” input to the Pl and Pcm.
Keywords: pulvinar, superior colliculus, widefield vertical, electron microscopy, synapse, vesicle, RRID: MMRRC_030648-UCD, RRID: MMRRC_030780-UCD, RRID: Addgene_117186, RRID: Addgene_117177, RRID: SCR_003070, RRID: SCR_017293, RRID: SCR_003297, RRID: SCR_002798
Graphical Abstract

The confocal image of a coronal section through the left mouse pulvinar nucleus (PUL) illustrates the distribution of projections from the left (Ipsi, magenta) and right (Contra, green) superior colliculus (SC). This study examined the ultrastructure of ipsi and contra SC to PUL projections using viruses that induce the expression of peroxidase in synaptic vesicles (example electron micrographs circled, black arrows indicate synapses). Synaptic terminals originating from the ipsi SC were found to be significantly larger than synaptic terminals originating from the contra SC (left graph), and both populations of SC terminals were found to be significantly larger than synaptic terminals in the PUL that do not originate from the SC (right graph).
Introduction
Visual signals are parsed via retinal circuits so that the information carried to the brain by retinal ganglion cells is already segregated to some degree into parallel visual channels (reviewed by Seabrook et al., 2017). The interaction of retinal ganglion cell projections with specific brain circuits further segregates and specializes these visual channels to form dedicated information processing streams. For example, specific classes of retinal ganglion cells innervate discrete regions of the dorsal lateral geniculate nucleus (dLGN) and innervate distinct types of geniculo-cortical neurons that project to distinct lamina or modules within the primary visual cortex (striate cortex or V1; Bickford et al., 2015; Hong et al., 2019; Cruz-Martin et al., 2014; Wernet et al., 2014). Consequently, parallel retino-geniculo-cortical channels code various aspects of the visual scene such as color, form, or movement (reviewed by Briggs, 2017).
Visual pathways can also be divided into primary versus secondary. The parallel retino-geniculo-cortical channels are considered primary pathways, whereas secondary pathways are those that involve thalamic projections from the retinorecipient layers of the superior colliculus (SC; Petry and Bickford, 2019), i.e. the stratum opticum (SO), and the stratum griseum superficiale (SGS). A particularly prominent secondary pathway originates from a unique class of SC neurons termed wide field vertical (WFV) cells. WFV cells, which have been identified in a variety of species (reviewed by Basso et al., 2021), exhibit very widespread dendritic arbors that extend laterally and vertically from their somata in the SO and deep SGS to the dorsal surface of the SC; the dendritic arbors of these widefield vertical cells can extend over a millimeter in the mediolateral dimension (tree shrew: Chomsung et al., 2008; gray squirrel: May 2006; ground squirrel: Major et al 2000; mouse: Zhou et al., 2017; Gale and Murphy, 2014; Masterson et al., 2019). Retinal synapses on the distal dendritic tufts of WFV cells can initiate dendritic action potentials that travel to the soma (identified in rat: Endo et al., 2008; mouse: Gale and Murphy, 2016; and chick: Luksch et al., 2001). Thus, WFV cells faithfully convey retinal signals that sequentially activate their widespread dendritic arbors. Models of the interactions between retinal inputs and the dendrites of WFV cells have suggested that these cells are particularly well configured to act as motion detectors (Major et al., 2000). This concept has been corroborated with in vivo recordings in mice, where it has been demonstrated that WFV cells respond robustly to small discs moving in any direction within a large visual field (sweeping stimuli), or small discs that expand to fill the visual field (looming stimuli; Gale and Murphy, 2014, 2016).
WFV cells convey these motion signals to the pulvinar nucleus; neurons in regions of the pulvinar nucleus that receive SC input (tectorecipient) have large receptive fields and respond to a variety of moving visual stimuli, including sweeping and looming stimuli (recorded in Rhesus monkeys: Berman and Wurtz, 2011, cats: Chalupa et al., 1983; Chalupa and Abramson, 1988; Casanova et al., 2001; Dumbrava et al., 2001; rats: Mooney et al., 1984; and mice: Roth et al., 2016; Bennett et al., 2019). The tectorecipient pulvinar subsequently projects to striate and extrastriate regions of the visual cortex as well as the striatum and amygdala (revealed in tree shrews: Day Brown et al., 2010; Chomsung et al., 2010; rats: Nakamura et al., 2015; Clasca et al., 2012; and mice: Bennett et al., 2019; Zhou et al., 2018; Juavinett et al., 2020). Recently it has been demonstrated that the tectopulvinar pathway of the mouse relays motion information to the posterior (P) and post-rhinal (POR) cortex that is independent from signals relayed via the primary retino-geniculo-cortical stream (Beltramo et al., 2019). Thus, the secondary retino-tectal-pulvino-cortical pathway appears to be a specialized motion-detection channel.
Anatomical evidence suggests that secondary visual pathways through the pulvinar nucleus can be further subdivided into parallel visual channels, similar to those identified within the primary retino-geniculo-cortical pathways. Differential projections of WFV cells to different parts of the pulvinar nucleus were first identified in the tree shrew and described as “diffuse” and “specific” (Luppino et al., 1988). The diffuse projections are highly convergent and nontopographic; restricted injections of anterograde tracers in the SC labeled diffuse terminals throughout the dorsal pulvinar, irrespective of the location of the injection site. In contrast, the same SC injections labeled dense, spatially restricted patches of terminals in the central pulvinar, and their location varied with the location of the injection site (topographic). Diffuse and specific tectopulvinar projections were subsequently identified in the gray squirrel (Baldwin et al., 2011) where diffuse projections innervate a caudal subdivision and specific projections innervate two rostral subdivisions of the pulvinar. In this study it was also noted that the caudal pulvinar receives input from both the ipsilateral and contralateral SC. A similar innervation pattern was demonstrated in the ground squirrel where it was additionally established that the bilateral diffuse and ipsilateral specific projections originate from two different types of WFV cells (Fredes et al., 2012). Similar patterns have also been identified in Galagos, although all projections originate from the ipsilateral SC (Baldwin et al., 2013).
The mouse pulvinar nucleus receives both ipsilateral and bilateral SC projections (Zhou et al, 2017; Bennet et al., 2019), however the precise anatomical organization of tectopulvinar projections in this species has not been examined in detail. In particular, the ultrastructure of tectopulvinar terminals has not been examined in a quantitative manner. In the present study we compare the ultrastructure of the ipsilateral and contralateral tectopulvinar terminals using newly developed virus-induced peroxidase labeling techniques (Zhang et al., 2019). Furthermore, we compare the size of tectopulvinar terminals to the overall distribution of terminal sizes in the mouse pulvinar nucleus. Our results provide a critical first step toward utilizing the mouse as an experimental model to investigate parallel information channels within secondary visual pathways.
Materials and Methods
Animals
All breeding and experimental procedures were approved by the University of Louisville Institutional Animal Care and Use Committee. Experiments were carried out using mice, of either sex, of C57BL/6J (IMSR Cat# JAX_000664, RRID: IMSR_JAX:000664), a line in which layer 6 cortical neurons express Cre-recombinase (GENSAT, Ntsr1-GN220, RRID: MMRRC_030648-UCD), or a line in which widefield vertical neurons in the SC express Cre-recombinase (GENSAT, NTSR1-GN209, RRID: MMRRC_030780-UCD; Gerfen et al., 2013).
AAV injections
To label SC projections to the pulvinar nucleus, mice were deeply anesthetized with a mixture of ketamine (100–150 mg/kg) and xylazine (10–15 mg/kg). The analgesic meloxicam (1–2 mg/kg) was also injected prior to surgery. The animals were then placed in a stereotaxic apparatus (Angle Two Stereotaxic, Leica, Wetzlar, Germany). An incision was made along the scalp, and a small hole was drilled in the skull overlying the left and/or right SC. Adeno-associated viruses (AAVs; pAAV1-SV-HRP, and AAV1-DIO-Matrix-dAPEX2, gift from David Ginty (Addgene plasmid#117186 and #117177; RRID: Addgene_117186, and Addgene_117177); AAV1-Matrix-dAPREX2 (Addgene plasmid#117176; AAV9-Flex-Rev-O-ChieftdTomato or AAV2-flex-ReaChR-mcitrine) were injected unilaterally or bilaterally into the SC. In the Ntsr1-GN220 mice, a unilateral injection of pAAV1-SV-HRP in the SC was paired with bilateral injections of AAV1-DIO-Matrix-dAPEX2 in V1. The viruses were delivered via a 34-gauge needle attached to a Nanofil syringe inserted in an ultramicropump. The needle was lowered vertically into the SC or V1 and volumes of 100 nls were injected at a rate of 15nl/minute. After removal of the needle, the scalp skin was sealed with tissue adhesive (n-butyl cyanoacrylate), lidocaine was applied to the wound, and the animals were placed on a heating pad until mobile. Post-surgery, animals were carefully monitored for proper wound healing, and oral meloxicam (1–2 mg/kg) was administered for 48 hours.
Confocal microscopy
Two weeks following the AAV9-Flex-Rev-O-Chief-tdTomato and AAV2-flex-ReaChR-mcitrine injections in the SC, mice were transcardially perfused with 4% paraformaldehyde in 0.1M phosphate buffer, pH 7.4 (PB). The brains were removed from the skull and placed in the fixative solution overnight at 4° C. The next day, the brains were rinsed in PB and 70 μm thick coronal sections were cut in PB using a vibratome. The sections were then mounted on slides, dried and cover slipped with Southern Biotech Fluoromount-G. Images were subsequently collected using a (Olympus, FV1200BX61) confocal microscope.
Electron microscopy
Two weeks following the pAAV1-SV-HRP, AAV1-Matrix-dAPEX2, and/or AAV1-DIO-Matrix-dAPEX2 virus injections, mice were transcardially perfused with 2% paraformaldehyde and 2.5% glutaraldehyde in cacodylate buffer warmed to 37°C, and the brain tissue was prepared for electron microscopy following the protocol established by Zhang et al., 2019. The brains were removed from the skull and placed in the fixative overnight at 4° C. The next day, the brains were rinsed in cacodylate buffer and 70 μm thick coronal sections were cut in cacodylate buffer using a vibratome and processed immediately afterwards to prevent loss of enzyme activity. Sections were rinsed with 50 mM glycine in cacodylate buffer. The sections were then incubated in 0.3 mg/ml 3,3’-diaminobenzidine (DAB) in cacodylate buffer with 0.003% H2O2 for 1 hour. The sections were then rinsed with cacodylate buffer and fixed in 3% glutaraldehyde in cacodylate buffer at 4°C overnight.
The following day the sections were rinsed in cacodylate buffer and placed in freshly prepared 1% osmium tetroxide/1.5% potassium ferrocyanide in cacodylate buffer at room temperature for 1 hour. Sections were rinsed in distilled water and then incubated in 1% uranyl acetate in 0.05 M maleate buffer at 4 °C overnight. The next day the sections were rinsed in distilled water and then dehydrated in an ethyl alcohol series, and flat embedded in Durcupan resin between two sheets of Aclar plastic.
Durcupan–embedded sections that contained virus-labeled terminals were first examined with a light microscope to select areas for electron microscopic analysis. Selected areas were mounted on blocks, ultrathin sections (70–80 nm, silver-gray interference color) were cut using a diamond knife, and sections were collected on Formvar-coated nickel slot grids. The sections were air dried and stained with a 10% solution of uranyl acetate in methanol for 30 minutes before examination with an electron microscope.
Ultrastructural analysis
In sections of the pulvinar nucleus ipsilateral or contralateral to the pAAV1-SV-HRP virus injections in the SC, all labeled tectopulvinar terminals that were involved in a synapse were imaged. Figure 1 illustrates the ultrastructure of terminals in the pulvinar nucleus labeled with the 2 different peroxidase viruses and the ultrastructure of unlabeled synaptic terminals in the same tissue. The areas of the pre- and postsynaptic profiles were measured using ImageJ software, RRID: SCR_003070) and other ultrastructural features, such as the presence or absence of dendritic inclusions within tectopulvinar terminals, were noted.
Figure 1: Identification of virus-labeled and unlabeled synaptic profiles.

Montage images were collected to measure the size of all unlabeled synaptic terminals and postsynaptic dendrites in the Pl and Pcm. a) Low magnification montage of a coronal section through the pulvinar nucleus after collecting 4 high magnification montages in the Pl and 4 high magnification montages in the Pcm. For each high magnification montage, the electron beam caused the tissue to lighten relative to areas that were not montaged at high magnification. b) Pl montage #1. Examples of terminals labeled by a SV-HRP injection in the SC are indicated by black arrows. Examples of mitochondria labeled by a matrix-dAPEX2 virus injection in V1 are indicated with white arrows. c) Example of a labeled mitochondria (white asterisk) in a synaptic terminal resulting from the V1 injection of the matrix-dAPEX2 virus. Below is a synaptic terminal that does not contain mitochondria. The lumens of the vesicles in both terminals are clear. Black arrows indicate synapses. d) Pcm montage #1. Examples of terminals labeled by a SV-HRP injection in the SC are indicated by black arrows. Few labeled mitochondria resulting from a matrix-dAPEX2 virus injection in V1 are present in the Pcm. e) Examples of small unlabeled synaptic terminals that do not contain mitochondria. The lumens of the vesicles in both terminals are clear. Black arrows indicate synapses. f) Example of a large unlabeled terminal that contains unlabeled mitochondria (black asterisks) and vesicles with clear lumens. Black arrow indicates a synapse. g) Example of a synaptic terminal labeled with the SV-HRP virus. Note that the lumens of many of the synaptic vesicles contain a dark reaction product, while the mitochondria are unlabeled (black asterisks). Black arrow indicates a synapse. Scale bar in a = 30 μm. Scale bar in b = 5 μm and also applies to d. Scale bars in c,e,f and g = 400nm. OT, optic tract
For analysis of ultrastructural features of all terminal types in the pulvinar, a series of montages were acquired using the SerialEM software (RRID:SCR_017293). Nine 7×7 montages were taken in the Pl, identified by the presence of both vesicle-labeled tectopulvinar and mitochondria-labeled corticopulvinar terminals (Figure 1b), at 12,000X magnification (Pixel Size: 1.04 nm, Montage Dimensions: 29.8 × 17.9 um). Additionally, Nine 7×7 montages were taken in the Pcm, identified by the presence of vesicle-labeled tectopulvinar terminals and the relative lack of mitochondria-labeled corticopulvinar terminals (Figure 1d), at 12,000X magnification (Pixel Size: 1.04 nm, Montage Dimensions: 29.8 × 17.9 um).To visualize the relative positions of the high-mag montages, two 12X15 montages of the entire tissue section were acquired at 1,000X magnification (Pixel Size: 49.12 nm, Montage Dimensions: 549.5 × 602.8 um; Figure 1a). The IMOD program etomo (RRID:SCR_003297) was used to automatically align montage pieces to create a single image. These images were imported into 3dmod and presynaptic terminal areas were measured using the “Drawing Tools” plugin.
Statistical analysis
GraphPad Prism (RRID: SCR_002798) was used for statistical analysis. Unpaired nonparametric t-tests (Mann-Whitney U test) were performed to compare the sizes of ipsilateral and contralateral tectopulvinar presynaptic profiles and postsynaptic dendrites, tectopulvinar presynaptic profiles with and without dendritic protrusions, and tectopulvinar presynaptic profiles with and without mitochondria. A Mann-Whitney U test was used to compare tectopulvinar terminals and their postsynaptic partners to the overall population of unlabeled pulvinar terminals and their post synaptic partners. A Kruskal-Wallis test was used for comparisons of SC terminal sizes and their postsynaptic partners in the contralateral pulvinar with the sizes of the overall population of unlabeled terminals and their postsynaptic partners in the Pcm, as well as for the comparisons of SC terminals and their postsynaptic partners in the ipsilateral pulvinar with the overall population of terminals and their postsynaptic partners in the Pl.
Results
Bilateral and ipsilateral projection zones in the mouse pulvinar nucleus
As previously described, the tectorecipient zones of the rodent pulvinar nucleus can be divided based on the projections from the ipsilateral and contralateral SC (reviewed in Zhou et al., 2017). As illustrated in Figure 2, the caudal medial pulvinar (Pcm) receives input from both the ipsilateral and contralateral SC, while the lateral pulvinar (Pl) receives input exclusively from the ipsilateral SC. High magnification images illustrate that the Pl (Figure 2d) contains a subset of tectopulvinar terminals that appear to be larger than those in the Pcm (Figure 2e).
Figure 2: Ipsilateral and contralateral projections from the superior colliculus (SC) define two zones of the mouse pulvinar nucleus.
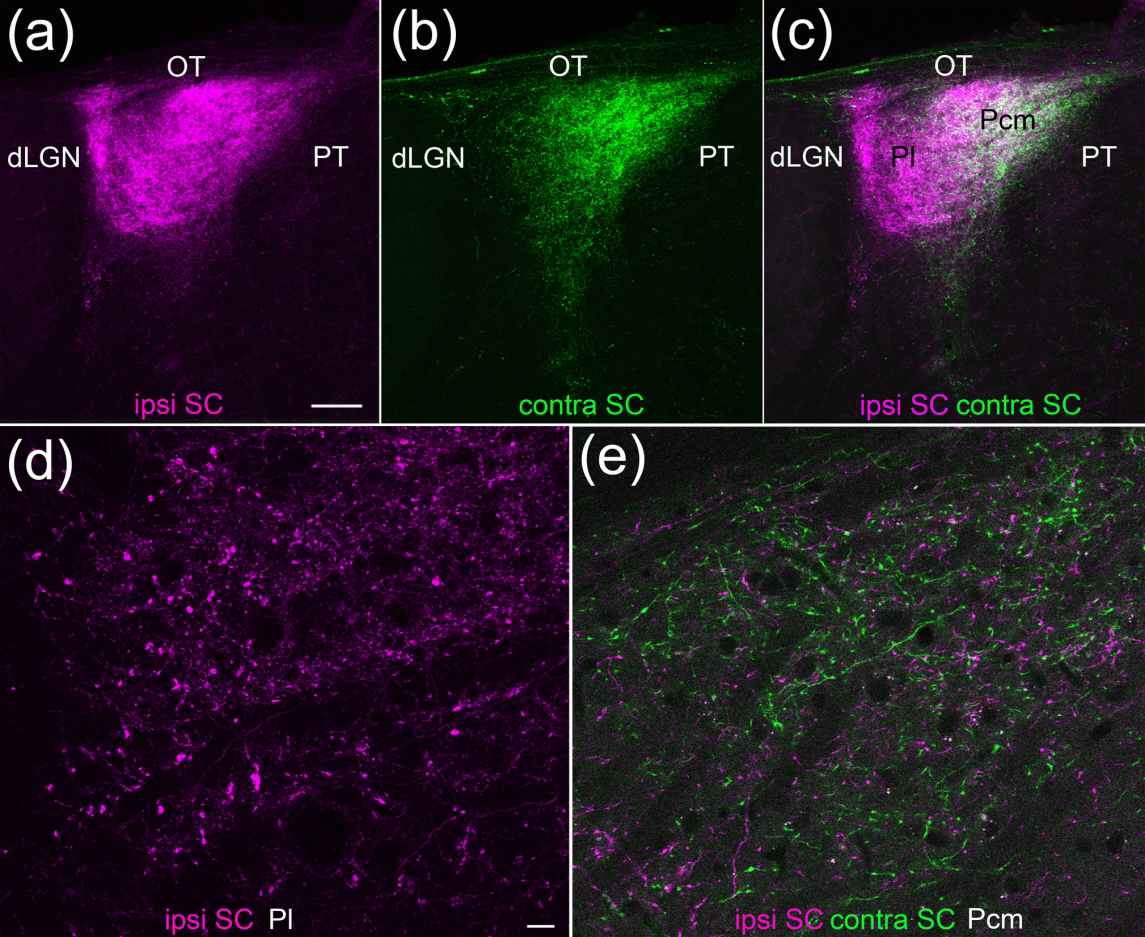
Two different virus injections were placed in the left and right SC and confocal images of coronal sections of the pulvinar nucleus were collected. (a-c) The lateral pulvinar (Pl) is primarily innervated by ipsilateral SC terminals (a,c magenta), while the caudal medial pulvinar (Pcm) is innervated by both ipsilateral and contralateral (b,c green) SC terminals (5 μm optical images, 60 μm stack). Scale bar = 100 μm. d,e) High magnification images of virus-labeled tectopulvinar terminals in the Pl (d) and Pcm (e). 1 μm optical images, 6 μm stacks. Scale bar = 10 μm and applies to d and e. dLGN, dorsal lateral geniculate nucleus, OT, optic tract, PT, pretectum.
Viral labelling of synaptic terminals via APEX2 expression
To examine the synaptic organization of ipsilateral and contralateral tectopulvinar terminals, we injected one side of the SC with viruses that express peroxidase in synaptic vesicles (SV-HRP, a fusion protein of synaptophysin and HRP which labels the lumen of synaptic vesicles), or in the matrix of mitochondria (matrix-dAPEX2; Zhang et al., 2019). In one animal we injected the SV-HRP virus in the SC and the matrix-dAPEX2 virus bilaterally in V1. The SV-HRP and matrix-dAPEX2 viruses induce the expression of peroxidase within axon terminals originating from neurons at the injection site. When the peroxidase is revealed with a DAB reaction, the lumens of a subset of vesicles (19.6 ± 12.4%, Zhang et al., 2019) within labeled terminals are filled with reaction product, or all the mitochondria within the labeled terminals are filled with reaction product (Zhang et al., 2019). We considered a terminal labeled if it contained at least 1 labeled DAB-labeled mitochondrion (e.g. Figure 1c), or at least 5 DAB-labeled synaptic vesicles (e.g. Figure 1g). The advantage of these viral labeling techniques is that ultrastructural features are not obscured and labeled terminals can clearly be distinguished from surrounding unlabeled synaptic terminals (e.g. Figure 1e,f). However, a caveat of these viral labeling techniques is that the DAB labeling patterns may be undetectable within synaptic terminals that do not contain mitochondria (e.g. Figure 1e) or synaptic terminals that contain very few synaptic vesicles.
Ultrastructure of ipsilateral and contralateral tectopulvinar projections
Using the virus that labels synaptic vesicles, we examined the synaptic connections of a total of 286 tectopulvinar terminals, all collected from one animal (164 in the pulvinar ipsilateral to the SC injection site, and 122 in the pulvinar contralateral to the SC injection site). Pulvinar terminals labeled by the SV-HRP virus injected in the ipsilateral SC exhibited a range of morphologies (Figure 3 presynaptic terminals pseudo colored magenta, postsynaptic dendrites pseudo colored yellow). Most notable were large prominent terminals (Figure 3a–d) that included dendritic protrusions engulfed by the presynaptic terminal (similar to the ultrastructure of retinogeniculate terminals Bickford et al., 2010; Hammer et al., 2015; Morgan et al., 2016; Cheadle et al., 2020); these protrusions were often the site of synaptic connections (black arrows Figure 3 a–d). In addition to these large terminals, the pulvinar ipsilateral to the SC virus injection also included smaller terminals, without dendritic protrusions, that made simple synaptic connections with postsynaptic dendrites (black arrows Figure 3 e–i). In contrast, the terminals labeled in the pulvinar contralateral to the SC SV-HRP virus injection exhibited more uniform features (Figure 4 presynaptic terminals pseudo colored green, postsynaptic dendrites pseudo colored blue). These terminals primarily made simple synaptic connections (black arrows Figure 4 a–h) with postsynaptic dendrites that did not protrude into the terminals.
Figure 3: Ultrastructure of ipsilateral tectopulvinar terminals.

(a-i) Terminals in the pulvinar nucleus (Pl and Pcm) labeled by a virus injection in the ipsilateral SC were identified by a dark reaction product in a subset of their synaptic vesicles. Labeled terminals are indicated by magenta overlay, black arrows indicate synapses, and postsynaptic dendrites and dendritic inclusions are indicated by yellow overlay. The labeled tectopulvinar terminals varied in size. The largest labeled terminals contained dendritic protrusions (a-d). e) The asterisk indicates a corticothalamic terminal labeled by a V1 virus injection. Scale bar in a = 400 nm and also applies to f. Scale bar in b = 600nm and also applies to c,d, and g-i.
Figure 4: Ultrastructure of contralateral tectopulvinar terminals.

(a-h) Terminals in the pulvinar nucleus (Pcm) labeled by a virus injection in the contralateral SC were identified by a dark reaction product in a subset of their synaptic vesicles. Labeled terminals are indicated by green overlay, black arrows indicate synapses, and postsynaptic dendrites are indicated by blue overlay. Scale bar = 600 nm and applies to all panels.
Quantitative comparison of ipsilateral and contralateral tectopulvinar projections
To quantitively compare the ipsilateral and contralateral tectopulvinar terminals labeled within one animal, we measured the areas of the labeled synaptic terminals as well as the areas of their postsynaptic dendrites. We also noted whether each labeled terminal contained dendritic protrusions and/or mitochondria. Tectopulvinar terminals ipsilateral to the SC SV-HRP virus injection were found to be significantly larger than contralateral tectopulvinar terminals labeled with the SV-HRP virus (Figure 5a; ipsilateral tectopulvinar terminals 0.90 ± 0.80 μm2, contralateral tectopulvinar terminals 0.63 ± 0.37 μm2, p<0.0005). This difference is presumably due to the presence of a subset of ipsilateral terminals with presynaptic areas ≥ 1 μm2 (40 of 164 or ~25%). These terminals often contained dendritic protrusions. In fact, ipsilateral tectopulvinar terminals that contained dendritic protrusions were found to be significantly larger than ipsilateral tectopulvinar terminals that did not contain protrusions (Figure 5c). Although dendritic protrusions were observed within some contralateral tectopulvinar terminals (6 of 122 or 5%), these were not found to be significantly different than contralateral tectopulvinar terminals that did not contain dendritic protrusions (Figure 5d).
Figure 5: Comparison of the size of ipsilateral and contralateral tectopulvinar terminals and their postsynaptic targets.

Within animal comparison of ipsilateral and contralateral projections from SC to PUL labeled with the SV-HRP virus. (a,b) Quantitative analysis of the size of presynaptic terminal and postsynaptic dendrite sizes. (c,d) Quantitative analysis of the sizes of ipsilateral and contralateral presynaptic terminals, comparing those with and without dendritic protrusions. (e,f) Quantitative analysis of the sizes of ipsilateral and contralateral presynaptic terminals, comparing those with and without mitochondria. Unpaired non-parametric - t test (Mann-Whitney U test) was performed for statistical analysis. ** p ≤ 0.005; *** p ≤ 0.0005; ns = non-significant. Black bars indicate mean and standard deviation.
Despite these differences in presynaptic terminal sizes, our analysis revealed no significant difference in the size of dendrites postsynaptic to ipsilateral and contralateral tectopulvinar terminals (Figure 5b; dendrites postsynaptic to ipsilateral tectopulvinar terminals 0.78 ± 0.78 μm2, dendrites postsynaptic to contralateral tectopulvinar terminals 0.73 ± 0.71 μm2). Finally, although the majority of tectopulvinar terminals contained mitochondria, the smallest tectopulvinar terminals both ipsilateral (Figure 5e; terminal size 0.43 ± 0.13 μm2) and contralateral (Figure 5f; terminal size 0.37± 0.11 μm2) to the SC SV-HRP virus injections did not contain mitochondria (e.g. Figure 3f,h and Figure 4f,g). Therefore, we did not analyze tissue from animals in which tectopulvinar terminals were labeled with the matrix-dAPEX2 virus.
Ultrastructure of the overall population of terminals in the Pl and Pcm
To determine how the ipsilateral and contralateral tectopulvinar terminals compare to the overall population of synaptic terminals in the mouse pulvinar nucleus, we collected montage images of tissue from the Pl and Pcm (Figure 1a,b,d) and measured all terminals that were engaged in synapses as well as their postsynaptic dendrites. The Pl and Pcm were identified using landmarks observed at both the light and electron microscopic level (e.g. optic tract and blood vessel patterns) as well as mediolateral location (Figure 1a). In addition, in the animal used for this study, we also injected the matrix-dAPEX2 virus in V1 to induce the expression of dAPEX2 in the mitochondria of layer 6 neurons. This allowed us to confirm the identification of the Pl, which contains a high density of V1 axons and terminals (Figure 1b) and the Pcm, which contains a very low density of V1 axons and terminals (Figure 1d, Zhou et al., 2017). The V1 synaptic terminals were not analyzed in detail because although mitochondria labeled with dAPEX2 were contained in many layer 6 axons, few layer 6 synaptic terminals contain mitochondria at the site of synaptic connections (Figures 1c, 3e).
We measured 346 synaptic terminals and 315 postsynaptic dendrites in the Pcm and 481 synaptic terminals and 435 postsynaptic profiles in the Pl, using tissue from the same animal in which images of SV-HRP labeled tectopulvinar terminals were collected (Figures 3 and 4). The overall population of tectopulvinar terminals (labeled with a unilateral SV-HRP injection in the SC) was found to be significantly larger (0.79 ± 0.67 μm2) than the overall population of terminals in the pulvinar nucleus that were not labeled by virus injections (0.26 ± 0.17 μm2; Figure 6a). In addition, ipsilateral tectopulvinar terminals (0.90 ± 0.80 μm2)) were found to be significantly larger than the overall population of unlabeled terminals measured in montages of the Pl (0.24 ± 0.17 μm2; Figure 6b) and contralateral tectopulvinar terminals (0.63 ± 0.37 μm2) were found to be significantly larger than the overall population of unlabeled terminals measured in montages of the Pcm (0.28 ± 0.16 μm2; Figure 6c). Dendrites postsynaptic to ipsilateral tectopulvinar terminals (0.78 ± 0.78 μm2) were significantly larger than the overall population of dendrites postsynaptic to unlabeled terminals in the Pl (0.40 ± 0.37 μm2; p<0.0001). Additionally, dendrites postsynaptic to contralateral tectopulvinar terminals (0.73 ± 0.71 μm2) were significantly larger than the overall population of dendrites postsynaptic to unlabeled terminals in the Pcm (0.43 ± 0.52 μm2;p<0.0001).
Figure 6: Comparison tectopulvinar synaptic terminals to the overall population of synaptic terminals in the Pl and Pcm.

Within animal comparison of projections from SC to PUL labeled with the SV-HRP virus with surrounding terminals in the PUL not labeled with the virus. (a,b,c) Quantitative analysis of the size of presynaptic terminal sizes, comparing unlabeled terminals with SC to PUL terminals (a), unlabeled terminals in the Pcm with contralateral SC to PUL terminals (b), and unlabeled terminals in the Pl with ipsilateral SC to PUL terminals (c). (d,e,f) Quantitative analysis of the size of postsynaptic dendrite sizes, comparing dendrites contacted by unlabeled terminals in PUL with dendrites contacted by SC to PUL terminals (d), dendrites contacted by unlabeled terminals in the Pcm with dendrites contacted by contralateral SC to PUL terminals (e), and dendrites contacted by unlabeled terminals in the Pl with dendrites contacted by ipsilateral SC to PUL terminals (f). A Mann-Whitney U test was utilized in for the comparison in panels (a,d), and a Kruskal-Wallis test was utilized for comparisons in panels (b,c,e,f). *** p< 0.0001. Black bars indicate mean and standard deviation.
Discussion
Our results support the following conclusions: 1) the mouse pulvinar nucleus can be divided into two distinct tectorecipient zones: the Pcm that receives input from the ipsilateral and contralateral SC, and the Pl that receives input only from the ipsilateral SC. 2) Viruses that induce the expression of peroxidase in synaptic vesicles or mitochondria provide a valuable new resource for examining the ultrastructure of identified synaptic terminals. 3) Compared to contralateral tectopulvinar terminals, ipsilateral tectopulvinar terminals include a subset of terminals that are significantly larger and contact dendrites that extend dendritic protrusions into the presynaptic terminal. 4) Tectopulvinar terminals are the largest synaptic terminals in both the Pl and the Pcm. Below, we discuss literature relevant to each of these conclusions.
Do ipsilateral and bilateral tectopulvinar projections originate from different SC cell types?
The organization of the tectorecipient zones of the mouse pulvinar nucleus is similar in many ways to that identified in the ground squirrel. In this species, the caudal pulvinar receives bilateral SC projections from WFV cells that have somata located in the lower SGS and dendrites that extend to the dorsal surface of the SC (type I WFV cells), while the rostral pulvinar receives ipsilateral projections from WFV cells that have somata located in the SO and dendrites that end more ventrally within the SGS (type II WFV cells; Fredes et al., 2012). Furthermore, unilateral BDA injections in the caudal pulvinar of the ground squirrel labeled terminals in the contralateral caudal pulvinar, while unilateral injections in the rostral pulvinar did not label any terminals in the contralateral pulvinar, demonstrating that the axons of type I WFV cells branch to innervate the ipsilateral and contralateral caudal pulvinar, while the axons of type II WFV cells project specifically to the ipsilateral rostral pulvinar (Fredes et al., 2012).
In the mouse, following dual injections of retrograde tracers in the left and right pulvinar nucleus, a subset of WFV cells is labeled by both injections (Zhou et al., 2017). Therefore, in the mouse, the axons of at least a subset of WFV branch to innervate both the ipsilateral and contralateral pulvinar. However, since it is difficult to inject the Pl without involving the Pcm, it is not known whether ipsilateral versus bilateral projections originate from separate cell types. Nevertheless, there is some evidence for separate morphological subtypes of WFV cells in the mouse. In vitro cell filling with biocytin as well as retrograde viral labeling suggests that some WFV cells extend dendrites to the surface of the SC, while others have dendrites that end lower within the SGS (Gale and Murphy, 2014; Masterson et al., 2019, Zhou et al., 2017). Although such labeling techniques may not always reveal the entire extent of the dendritic arbors, similar techniques have clearly identified multiple morphological subtypes of WFV cells in other species (ground squirrel; Major et al., 2000; chick; Lusksch et al., 2001). Finally, antibodies against substance P or adenosine deaminase label terminals in restricted regions of the tectorecipient pulvinar suggesting that a subset of WFV cells express these substances in their axonal boutons (mouse; Zhou et al., 2017; rat; Lane et al., 1993; Nakaya et al., 1994; Masterson et al., 2010; cat; Hustler and Chalupa, 1991; Kelly et al., 2003; primates; Stepniewska et al., 2000).
Evaluation of peroxidase viruses
Since this study is one of the first to extensively evaluate the use of viruses that induce the expression of peroxidase to examine the ultrastructure of identified thalamic synaptic terminals, we feel that a discussion of the advantages and disadvantages of their use is warranted. A particular advantage of peroxidase expression induced by both the SV-HRP virus and the matrix-dAPEX2 virus is the fact that the diaminobenzidine solution required to reveal the peroxidase can easily penetrate throughout tissue sections, even those that are well fixed for electron microscopy. No detergents or other agents are required to increase penetration into the tissue, and synaptic terminals are labeled through the entire depth of the reacted tissue sections. Thus, these viruses are particularly useful for the reconstruction of labeled profiles from serial thin sections or utilizing serial block-face, serial-section, or focused ion beam scanning electron microscopy (Zhang et al., 2019).
Furthermore, since labeling patterns produced by the SV-HRP and matrix-dAPEX2 viruses are unique, they can be combined in single animals to identify synaptic terminals from more than one source. Finally, in comparison to viruses or tracers that fill synaptic terminals, the SV-HRP and matrix-dAPEX2 viruses are superior in that ultrastructural details (such as presynaptic densities) are not obscured. However, we detected a few disadvantages of using these viral labeling techniques. For the SV-HRP virus, because the labeling is confined to synaptic vesicles, we found it difficult to detect the labeled terminals at the light microscopic level. Thus, it can be challenging to select the appropriate regions of embedded tissue for subsequent electron microscopic analysis. This was not an issue when using the matrix-dAPEX2 virus; terminals labeled by this virus were easily identified at the light microscopic level. However, one disadvantage of the matrix-dAPEX2 virus is that not all synaptic terminals contain mitochondria. Thus, this virus is inferior to the vesicle virus for identifying all synaptic terminals originating from an injection site (at least within single thin sections). Despite these minor caveats, the viruses evaluated in this study provide very valuable new resources for examining the ultrastructure of identified synaptic terminals.
Variations in tectopulvinar terminal ultrastructure and postsynaptic responses
Tectopulvinar terminals have consistently been found to form clusters of relatively large terminals that surround and synapse on relatively large, presumed proximal, dendrites of pulvinar neurons (Rhesus monkey: Partlow et al., 1977; tree shrew: Chomsung et al., 2008; Wei et al., 2011; cat: Kelly et al., 2003; grey squirrel: Robson and Hall, 1977; rat: Masterson et al., 2009; hamster: Crain and Hall, 1980a). However, several previous studies have noted differences in the ultrastructure of tectal terminals that innervate different thalamic zones. In the cat, projections to the medial subdivision of the lateral posterior nucleus (LPm) and a region of the lateral subdivision of the lateral posterior nucleus (LPl-2) originate from separate cells in the SGS (Abramson and Chaulpa, 1988). Tectal terminals in the LPm form tubular clusters that surround and synapse on relatively large dendrites, while tectal terminals in the LPl-2 form more discrete clusters of terminals that involve more GABAergic interneurons (Kelly et al., 2003). Similarly, in the tree shrew, comparison of the ultrastructure of “diffuse” tectal terminals in the dorsal pulvinar (Pd) and “specific” terminals in the central pulvinar (Pc) revealed differences in the degree of convergence on postsynaptic dendrites, the length of synapses, as well as the involvement of interneurons in synaptic arrangements (Chomsung et al., 2008; Wei et al., 2011). Moreover, these structural differences were found to correlate with two types of postsynaptic responses recorded in the tree shrew in vitro. One type of response was evoked at short latency, exhibited a larger threshold amplitude, and decreased in amplitude with increased stimulation frequency. The second type, which exhibited a greater degree of convergence, was evoked at longer latencies, exhibited smaller threshold amplitudes and maintained relatively stable amplitudes in response to a range of stimulation frequencies (Wei et al., 2011). Similar results were found in the caudal pulvinar of the rat, corresponding to the mouse Pcm. Here electrical activation of tectopulvinar axons with a range of frequencies elicited responses that maintained stable amplitudes (Masterson et al., 2010). Therefore, a variety of evidence suggests that the unique synaptic arrangements of tectopulvinar terminals mediate distinct postsynaptic responses.
Can tectopulvinar terminals be considered “drivers”?
In the dorsal lateral geniculate nucleus (dLGN), retinal terminals are the primary determinate of receptive field properties, i.e. these terminals are considered to be “driver” inputs (Sherman and Guillery, 1998). We found that the large ipsilateral tectopulvinar terminals that include dendritic protrusions are structurally similar to large retinogeniculate terminals in the mouse, which also often include dendritic protrusions (Bickford et al., 2010; Hammer et al., 2015; Morgan et al., 2016; Cheadle et al., 2020). Moreover, we found that tectopulvinar terminals are the largest terminals in the Pl and Pcm, suggesting that they may strongly influence the receptive field properties of the pulvinar neurons they innervate. In fact, it has recently been demonstrated that inactivation of the SC greatly diminishes the responsiveness of tectorecipient pulvinar neurons and abolishes the transfer of visual motion information through the pulvinar nucleus to the posterior and postrhinal cortex (Bennett et al., 2019; Beltramo et al., 2019). In addition, the receptive field properties of tectorecipient pulvinar neurons are similar to those of the WFV cells that innervate them. Both respond robustly to small discs moving in any direction within a large visual field (sweeping stimuli), or small discs that expand to fill the visual field (looming stimuli; Gale and Murphy, 2014, 2016; Bennett et al., 2019). Thus, the tectopulvinar projection appears to fulfill the definition of being the “driving” input to the Pl and Pcm.
However, mouse pulvinar neurons exhibit a wide range of receptive field sizes (Siegle et al., 2021; Roth et al., 2016; Bennett et al., 2019). This variation might correlate with neurons innervated by large ipsilateral terminals or smaller bilateral terminals. In fact, the largest receptive field sizes are recorded in the most caudal regions of the pulvinar (Bennett et al., 2019), potentially constructed via the convergence of multiple bilateral terminals on individual pulvinar neurons. This type of configuration may not fulfill the original definition of a thalamic driver as an afferent that shows little convergence (Sherman and Guillery, 1998). However, these pulvinar neurons could still be considered to be “driven” by a single input source.
Accumulating evidence also suggests that in addition to the SC, pulvinar neurons receive convergent input from multiple cortical areas (Roth et al., 2016; Blot et al., 2021; Juavinett et., 2020; Bennett et al., 2019). These convergent inputs include input from layer 5 cortical neurons which can also form large synaptic terminals (Zhou et al., 2017). Specifically, retrograde monosynaptic tracing techniques have shown that pulvinar neurons that project to either the anterior-lateral cortical area (AL) or the posteromedial cortical area (PM) receive inputs from layer 5 cortical neurons (located primarily in V1), as well as from the ipsilateral SC (Blot et al., 2021). This provides further evidence for the specialization of pulvinar zones that receive ipsilateral versus bilateral SC input. In the somatosensory system, it has been demonstrated that large synaptic terminals from the trigeminal nucleus and layer 5 of the barrel cortex converge to innervate the proximal dendrites of single neurons in the medial subdivision of the mouse posterior nucleus. When activated simultaneously, these two inputs combine in a supralinear fashion (Groh et al., 2014). In the pulvinar nucleus, convergence of V1 layer 5 input with ipsilateral SC input could provide a mechanism to detect the relative timing between cortical and subcortical signals, perhaps providing a means to boost the saliency of expected or unexpected signals (Roth et al 2016; Blot et al., 2021).
Acknowledgements:
This work was supported by the National Eye Institute (R01EY024173 and R01EY031322), the National Institute of Neurological Disorders and Stroke (U01NS122040) and the National Institute of General Medical Sciences (P20GM1034236). We thank Dr. David Ginty for providing the pAAV1-SV-HRP and AAV1-DIO-Matrix-dAPEX2 viruses and detailed tissue preparation protocols.
Footnotes
Conflict of interest: The authors declare no competing financial interests.
Data availability:
The data that support the findings of this study are available from the corresponding author upon reasonable request.
References cited
- Abramson BP, & Chalupa LM (1988). Multiple pathways from the superior colliculus to the extrageniculate visual thalamus of the cat. The Journal of Comparative Neurology, 271(3). 10.1002/cne.902710308 [DOI] [PubMed] [Google Scholar]
- Baldauf ZB, Chomsung RD, Carden WB, May PJ, & Bickford ME (2005). Ultrastructural analysis of projections to the pulvinar nucleus of the cat. I: Middle suprasylvian gyrus (areas 5 and 7). The Journal of Comparative Neurology, 485(2). 10.1002/cne.20480 [DOI] [PMC free article] [PubMed] [Google Scholar]
- Baldwin MKL, Balaram P, & Kaas JH (2013). Projections of the superior colliculus to the pulvinar in prosimian galagos ( Otolemur garnettii ) and VGLUT2 staining of the visual pulvinar. Journal of Comparative Neurology, 521(7). 10.1002/cne.23252 [DOI] [PMC free article] [PubMed] [Google Scholar]
- Baldwin MKL, Wong P, Reed JL, & Kaas JH (2011). Superior colliculus connections with visual thalamus in gray squirrels (Sciurus carolinensis): Evidence for four subdivisions within the pulvinar complex. The Journal of Comparative Neurology, 519(6). 10.1002/cne.22552 [DOI] [PMC free article] [PubMed] [Google Scholar]
- Basso MA, Bickford ME, & Cang J (2021). Unraveling circuits of visual perception and cognition through the superior colliculus. Neuron, 109(6). 10.1016/j.neuron.2021.01.013 [DOI] [PMC free article] [PubMed] [Google Scholar]
- Beltramo R, & Scanziani M (2019). A collicular visual cortex: Neocortical space for an ancient midbrain visual structure. Science, 363(6422). 10.1126/science.aau7052 [DOI] [PubMed] [Google Scholar]
- Bennett C, Gale SD, Garrett ME, Newton ML, Callaway EM, Murphy GJ, & Olsen SR (2019). Higher-Order Thalamic Circuits Channel Parallel Streams of Visual Information in Mice. Neuron, 102(2). 10.1016/j.neuron.2019.02.010 [DOI] [PMC free article] [PubMed] [Google Scholar]
- Berman RA, & Wurtz RH (2011). Signals Conveyed in the Pulvinar Pathway from Superior Colliculus to Cortical Area MT. Journal of Neuroscience, 31(2). 10.1523/JNEUROSCI.4738-10.2011 [DOI] [PMC free article] [PubMed] [Google Scholar]
- Berson DM, & Graybiel AM (1978). Parallel thalamic zones in the LP-pulvinar complex of the cat identified by their afferent and efferent connections. Brain Research, 147(1). 10.1016/0006-8993(78)90778-3 [DOI] [PubMed] [Google Scholar]
- Bickford ME, Slusarczyk A, Dilger EK, Krahe TE, Kucuk C, & Guido W (2010). Synaptic development of the mouse dorsal lateral geniculate nucleus.Journal of Comparative Neurology, 518(5). 10.1002/cne.22223 [DOI] [PMC free article] [PubMed] [Google Scholar]
- Bickford ME, Zhou N, Krahe TE, Govindaiah G, & Guido W (2015). Retinal and Tectal “Driver-Like” Inputs Converge in the Shell of the Mouse Dorsal Lateral Geniculate Nucleus. Journal of Neuroscience, 35(29). 10.1523/JNEUROSCI.3375-14.2015 [DOI] [PMC free article] [PubMed] [Google Scholar]
- Blot A, Roth MM, Gasler I, Javadzadeh M, Imhof F, & Hofer SB (2021). Visual intracortical and transthalamic pathways carry distinct information to cortical areas. Neuron. 10.1016/j.neuron.2021.04.017 [DOI] [PMC free article] [PubMed] [Google Scholar]
- Briggs F (2017). Mammalian Visual System Organization. In Oxford Research Encyclopedia of Neuroscience. Oxford University Press. 10.1093/acrefore/9780190264086.013.66 [DOI] [Google Scholar]
- Caldwell RB, & Mize RR (1981). Superior colliculus neurons which project to the cat lateral posterior nucleus have varying morphologies. The Journal of Comparative Neurology, 203(1). 10.1002/cne.902030106 [DOI] [PubMed] [Google Scholar]
- Casanova C, Merabet L, Desautels A, & Minville K (2001). Chapter 5 Higher-order motion processing in the pulvinar. 10.1016/S0079-6123(01)34006-2 [DOI] [PubMed]
- Chalupa LM, & Abramson BP (1988). Chapter 8: Receptive-field properties in the tecto- and striate-recipient zones of the cat’s lateral posterior nucleus. 10.1016/S0079-6123(08)60468-9 [DOI] [PubMed]
- Chalupa L, & Abramson B (1989). Visual receptive fields in the striate-recipient zone of the lateral posterior-pulvinar complex. The Journal of Neuroscience, 9(1). 10.1523/JNEUROSCI.09-01-00347.1989 [DOI] [PMC free article] [PubMed] [Google Scholar]
- Chalupa L, Williams R, & Hughes M (1983). Visual response properties in the tectorecipient zone of the cat’s lateral posterior-pulvinar complex: a comparison with the superior colliculus. The Journal of Neuroscience, 3(12). 10.1523/JNEUROSCI.03-12-02587.1983 [DOI] [PMC free article] [PubMed] [Google Scholar]
- Cheadle L, Rivera SA, Phelps JS, Ennis KA, Stevens B, Burkly LC, Lee W-CA, & Greenberg ME (2020). Sensory Experience Engages Microglia to Shape Neural Connectivity through a Non-Phagocytic Mechanism. Neuron, 108(3). 10.1016/j.neuron.2020.08.002 [DOI] [PMC free article] [PubMed] [Google Scholar]
- Chomsung RD, Wei H, Day-Brown JD, Petry HM, & Bickford ME (2010). Synaptic Organization of Connections between the Temporal Cortex and Pulvinar Nucleus of the Tree Shrew. Cerebral Cortex, 20(4). 10.1093/cercor/bhp162 [DOI] [PMC free article] [PubMed] [Google Scholar]
- Chomsung RD, Petry HM, & Bickford ME (2008). Ultrastructural examination of diffuse and specific tectopulvinar projections in the tree shrew. The Journal of Comparative Neurology, 510(1). 10.1002/cne.21763 [DOI] [PMC free article] [PubMed] [Google Scholar]
- Clascá F, Rubio-Garrido P, & Jabaudon D (2012). Unveiling the diversity of thalamocortical neuron subtypes. European Journal of Neuroscience, 35(10). 10.1111/j.1460-9568.2012.08033.x [DOI] [PubMed] [Google Scholar]
- Crain BJ, & Hall WC (1980). The normal organization of the lateral posterior nucleus of the golden hamster. The Journal of Comparative Neurology, 193(2). 10.1002/cne.901930204 [DOI] [PubMed] [Google Scholar]
- Cruz-Martín A, El-Danaf RN, Osakada F, Sriram B, Dhande OS, Nguyen PL, Callaway EM, Ghosh A, & Huberman AD (2014). A dedicated circuit links direction-selective retinal ganglion cells to the primary visual cortex. Nature, 507(7492). 10.1038/nature12989 [DOI] [PMC free article] [PubMed] [Google Scholar]
- Day-Brown JD, Wei H, Chomsung RD, Petry HM, & Bickford ME (2010). Pulvinar Projections to the Striatum and Amygdala in the Tree Shrew. Frontiers in Neuroanatomy, 4. 10.3389/fnana.2010.00143 [DOI] [PMC free article] [PubMed] [Google Scholar]
- Dumbrava D, Faubert J, & Casanova C (2001). Global motion integration in the cat’s lateral posterior-pulvinar complex. European Journal of Neuroscience, 13(12). 10.1046/j.0953-816x.2001.01598.x [DOI] [PubMed] [Google Scholar]
- Endo T, Tarusawa E, Notomi T, Kaneda K, Hirabayashi M, Shigemoto R, & Isa T (2008). Dendritic Ih Ensures High-Fidelity Dendritic Spike Responses of Motion-Sensitive Neurons in Rat Superior Colliculus. Journal of Neurophysiology, 99(5). 10.1152/jn.00556.2007 [DOI] [PubMed] [Google Scholar]
- Fredes F, Vega-Zuniga T, Karten H, & Mpodozis J (2012). Bilateral and ipsilateral ascending tectopulvinar pathways in mammals: A study in the squirrel (spermophilus beecheyi). The Journal of Comparative Neurology, 520(8). 10.1002/cne.23014 [DOI] [PMC free article] [PubMed] [Google Scholar]
- Gale SD, & Murphy GJ (2014). Distinct Representation and Distribution of Visual Information by Specific Cell Types in Mouse Superficial Superior Colliculus. Journal of Neuroscience, 34(40). 10.1523/JNEUROSCI.2768-14.2014 [DOI] [PMC free article] [PubMed] [Google Scholar]
- Gale SD, & Murphy GJ (2016). Active Dendritic Properties and Local Inhibitory Input Enable Selectivity for Object Motion in Mouse Superior Colliculus Neurons. Journal of Neuroscience, 36(35). 10.1523/JNEUROSCI.0645-16.2016 [DOI] [PMC free article] [PubMed] [Google Scholar]
- Gerfen CR, Paletzki R, & Heintz N (2013). GENSAT BAC Cre-Recombinase Driver Lines to Study the Functional Organization of Cerebral Cortical and Basal Ganglia Circuits. Neuron, 80(6). 10.1016/j.neuron.2013.10.016 [DOI] [PMC free article] [PubMed] [Google Scholar]
- Groh A, Bokor H, Mease RA, Plattner VM, Hangya B, Stroh A, Deschenes M, & Acsády L (2014). Convergence of Cortical and Sensory Driver Inputs on Single Thalamocortical Cells. Cerebral Cortex, 24(12). 10.1093/cercor/bht173 [DOI] [PMC free article] [PubMed] [Google Scholar]
- Hammer S, Monavarfeshani A, Lemon T, Su J, & Fox MA (2015). Multiple Retinal Axons Converge onto Relay Cells in the Adult Mouse Thalamus. Cell Reports, 12(10). 10.1016/j.celrep.2015.08.003 [DOI] [PMC free article] [PubMed] [Google Scholar]
- Harting JK, Hall WC, Diamond IT, & Martin GF (1973). Anterograde degeneration study of the superior colliculus inTupaia glis: Evidence for a subdivision between superficial and deep layers. The Journal of Comparative Neurology, 148(3). 10.1002/cne.901480305 [DOI] [PubMed] [Google Scholar]
- Hong YK, Burr EF, Sanes JR, & Chen C (2019). Heterogeneity of retinogeniculate axon arbors. European Journal of Neuroscience, 49(7). 10.1111/ejn.13986 [DOI] [PMC free article] [PubMed] [Google Scholar]
- Hutsler JJ, & Chalupa LM (1991). Substance P immunoreactivity identifies a projection from the cat’s superior colliculus to the principal tectorecipient zone of the lateral posterior nucleus. The Journal of Comparative Neurology, 312(3). 10.1002/cne.903120306 [DOI] [PubMed] [Google Scholar]
- Juavinett AL, Kim EJ, Collins HC, & Callaway EM (2020). A systematic topographical relationship between mouse lateral posterior thalamic neurons and their visual cortical projection targets. Journal of Comparative Neurology, 528(1). 10.1002/cne.24737 [DOI] [PMC free article] [PubMed] [Google Scholar]
- Kawamura S (1974). Topical organization of the extrageniculate visual system in the cat. Experimental Neurology, 45(3). 10.1016/0014-4886(74)90151-4 [DOI] [PubMed] [Google Scholar]
- Kelly LR, Li J, Carden WB, & Bickford ME (2003). Ultrastructure and synaptic targets of tectothalamic terminals in the cat lateral posterior nucleus. The Journal of Comparative Neurology, 464(4). 10.1002/cne.10800 [DOI] [PubMed] [Google Scholar]
- Lane RD, Bennett-Clarke CA, Allan DM, & Mooney RD (1993). Immunochemical heterogeneity in the tecto-LP pathway of the rat. The Journal of Comparative Neurology, 333(2). 10.1002/cne.903330207 [DOI] [PubMed] [Google Scholar]
- Luksch H, Karten HJ, Kleinfeld D, & Wessel R (2001). Chattering and Differential Signal Processing in Identified Motion-Sensitive Neurons of Parallel Visual Pathways in the Chick Tectum. The Journal of Neuroscience, 21(16). 10.1523/JNEUROSCI.21-16-06440.2001 [DOI] [PMC free article] [PubMed] [Google Scholar]
- Luppino G, Matelli M, Carey RG, Fitzpatrick D, & Diamond IT (1988). New view of the organization of the pulvinar nucleus inTupaia as revealed by tectopulvinar and pulvinar-cortical projections. The Journal of Comparative Neurology, 273(1). 10.1002/cne.902730107 [DOI] [PubMed] [Google Scholar]
- Major DE, Luksch H, & Karten HJ (2000). Bottlebrush dendritic endings and large dendritic fields: Motion-detecting neurons in the mammalian tectum. The Journal of Comparative Neurology, 423(2). 10.1002/1096-9861(20000724)423:2<243::AID-CNE5>3.0.CO;2-5 [DOI] [PubMed] [Google Scholar]
- Marín G, Letelier JC, Henny P, Sentis E, Farfán G, Fredes F, Pohl N, Karten H, & Mpodozis J (2003). Spatial organization of the pigeon tectorotundal pathway: An interdigitating topographic arrangement. Journal of Comparative Neurology, 458(4). 10.1002/cne.10591 [DOI] [PubMed] [Google Scholar]
- Masterson SP, Zhou N, Akers BK, Dang W, & Bickford ME (2019). Ultrastructural and optogenetic dissection of V1 corticotectal terminal synaptic properties. Journal of Comparative Neurology, 527(4). 10.1002/cne.24538 [DOI] [PMC free article] [PubMed] [Google Scholar]
- Masterson SP, Li J, & Bickford ME (2009). Synaptic organization of the tectorecipient zone of the rat lateral posterior nucleus. The Journal of Comparative Neurology, 515(6). 10.1002/cne.22077 [DOI] [PMC free article] [PubMed] [Google Scholar]
- Masterson SP, Li J, & Bickford ME (2010). Frequency-Dependent Release of Substance P Mediates Heterosynaptic Potentiation of Glutamatergic Synaptic Responses in the Rat Visual Thalamus. Journal of Neurophysiology, 104(3). 10.1152/jn.00010.2010 [DOI] [PMC free article] [PubMed] [Google Scholar]
- May PJ (2006). The mammalian superior colliculus: laminar structure and connections. 10.1016/S0079-6123(05)51011-2 [DOI] [PubMed]
- Mooney RD, Fish SE, & Rhoades RW (1984). Anatomical and functional organization of pathway from superior colliculus to lateral posterior nucleus in hamster. Journal of Neurophysiology, 51(3). 10.1152/jn.1984.51.3.407 [DOI] [PubMed] [Google Scholar]
- Morgan JL, Berger DR, Wetzel AW, & Lichtman JW (2016). The Fuzzy Logic of Network Connectivity in Mouse Visual Thalamus. Cell, 165(1). 10.1016/j.cell.2016.02.033 [DOI] [PMC free article] [PubMed] [Google Scholar]
- Nakamura H, Hioki H, Furuta T, & Kaneko T (2015). Different cortical projections from three subdivisions of the rat lateral posterior thalamic nucleus: a single-neuron tracing study with viral vectors. European Journal of Neuroscience, 41(10). 10.1111/ejn.12882 [DOI] [PubMed] [Google Scholar]
- Nakaya Y, Kaneko T, Shigemoto R, Nakanishi S, & Mizuno N (1994). Immunohistochemical localization of substance P receptor in the central nervous system of the adult rat. The Journal of Comparative Neurology, 347(2). 10.1002/cne.903470208 [DOI] [PubMed] [Google Scholar]
- Partlow GD, Colonnier M, & Szabo J (1977). Thalamic projections of the superior colliculus in the rhesus monkey,Macaca mulatta. A light and electron microscopic study. The Journal of Comparative Neurology, 171(3). 10.1002/cne.901710302 [DOI] [PubMed] [Google Scholar]
- Petry HM, & Bickford ME (2019). The Second Visual System of The Tree Shrew. Journal of Comparative Neurology, 527(3). 10.1002/cne.24413 [DOI] [PMC free article] [PubMed] [Google Scholar]
- Robson JA, & Hall WC (1977). The organization of the pulvinar in the grey squirrel (Sciurus carolinensis). II. Synaptic organization and comparisons with the dorsal lateral geniculate nucleus. The Journal of Comparative Neurology, 173(2). 10.1002/cne.901730211 [DOI] [PubMed] [Google Scholar]
- Rodrigo-Angulo ML, & Reinoso-Suárez F (1982). Topographical organization of the brainstem afferents to the lateral posterior-pulvinar thalamic complex in the cat. Neuroscience, 7(6). 10.1016/0306-4522(82)90260-3 [DOI] [PubMed] [Google Scholar]
- Roth MM, Dahmen JC, Muir DR, Imhof F, Martini FJ, & Hofer SB (2016). Thalamic nuclei convey diverse contextual information to layer 1 of visual cortex. Nature Neuroscience, 19(2). 10.1038/nn.4197 [DOI] [PMC free article] [PubMed] [Google Scholar]
- Seabrook TA, Burbridge TJ, Crair MC, & Huberman AD (2017). Architecture, Function, and Assembly of the Mouse Visual System. Annual Review of Neuroscience, 40(1). 10.1146/annurev-neuro-071714-033842 [DOI] [PubMed] [Google Scholar]
- Sherman SM, & Guillery RW (1998). On the actions that one nerve cell can have on another: Distinguishing “drivers” from “modulators.” Proceedings of the National Academy of Sciences, 95(12). 10.1073/pnas.95.12.7121 [DOI] [PMC free article] [PubMed] [Google Scholar]
- Siegle JH, Jia X, Durand S, Gale S, Bennett C, Graddis N, Heller G, Ramirez TK, Choi H, Luviano JA, Groblewski PA, Ahmed R, Arkhipov A, Bernard A, Billeh YN, Brown D, Buice MA, Cain N, Caldejon S, … Koch C (2021). Survey of spiking in the mouse visual system reveals functional hierarchy. Nature. 10.1038/s41586-020-03171-x [DOI] [PMC free article] [PubMed] [Google Scholar]
- Spreafico R, Kirk C, Franceschetti S, & Avanzini G (1980). Brain stem projections to the pulvinar-lateralis posterior complex of the cat. Experimental Brain Research, 40(2). 10.1007/BF00237539 [DOI] [PubMed] [Google Scholar]
- Stepniewska I, Qi H-X, & Kaas JH (2000). Projections of the superior colliculus to subdivisions of the inferior pulvinar in New World and Old World monkeys. Visual Neuroscience, 17(4). 10.1017/S0952523800174048 [DOI] [PubMed] [Google Scholar]
- Takahashi T (1985). The organization of the lateral thalamus of the hooded rat. The Journal of Comparative Neurology, 231(3). 10.1002/cne.902310302 [DOI] [PubMed] [Google Scholar]
- Wei H, Masterson SP, Petry HM, Bickford ME (2011) Diffuse and specific tectopulvinar terminals in the tree shrew: synapses, synapsins, and synaptic potentials. PLoS One. 6(8). 10.1371/journal.pone.0023781. [DOI] [PMC free article] [PubMed] [Google Scholar]
- Wernet MF, Huberman AD, & Desplan C (2014). So many pieces, one puzzle: cell type specification and visual circuitry in flies and mice. Genes & Development, 28(23). 10.1101/gad.248245.114 [DOI] [PMC free article] [PubMed] [Google Scholar]
- Zhang Q, Lee W-CA, Paul DL, & Ginty DD (2019). Multiplexed peroxidase-based electron microscopy labeling enables simultaneous visualization of multiple cell types. Nature Neuroscience, 22(5). 10.1038/s41593-019-0358-7 [DOI] [PMC free article] [PubMed] [Google Scholar]
- Zhou N, Maire PS, Masterson SP, & Bickford ME (2017). The mouse pulvinar nucleus: Organization of the tectorecipient zones. Visual Neuroscience, 34. 10.1017/S0952523817000050 [DOI] [PMC free article] [PubMed] [Google Scholar]
- Zhou N, Masterson SP, Damron JK, Guido W, & Bickford ME (2018). The mouse pulvinar nucleus links the lateral extrastriate cortex, striatum and amygdala. Journal of Neuroscience, 38(2). 10.1523/JNEUROSCI.1279-17.2017. [DOI] [PMC free article] [PubMed] [Google Scholar]
Associated Data
This section collects any data citations, data availability statements, or supplementary materials included in this article.
Data Availability Statement
The data that support the findings of this study are available from the corresponding author upon reasonable request.