Abstract
Background
The functional significance and mechanisms determining the development and individual variability of structural brain asymmetry remain unclear. Here, we systematically analyzed all relevant components of the most prominent structural asymmetry – brain torque (BT) and their relationships with potential genetic and nongenetic modifiers in a sample comprised 24,112 individuals from 6 cohorts.
Methods
BT features, including petalia, bending, dorso-ventral shift, brain tissue distribution asymmetries and cortical surface positional asymmetries, were directly modelled using a set of automatic 3D brain shape analysis approaches. Age, sex- and handedness-related effects on BT were assessed. The genetic architecture and phenomic associations of BT were investigated conducting genome- and phenome-wide association scans.
Results
Our results confirmed the population-level predominance of the typical anticlockwise torque and suggested a “first attenuating, then enlarging” dynamic across the lifespan (3–81 years) primarily for frontal, occipital and perisylvian BT features. Sex/handedness, BT and cognitive function of verbal-numerical reasoning were found to be interrelated statistically. We observed differential heritability of up to 56% for BT, especially in temporal language areas. Individual variations of BT were also associated with various phenotypic variables of neuroanatomy, cognition, lifestyle, sociodemographics, anthropometry, physical health, adult and child mental health. Our genomic analyses identified a number of genetic associations at lenient significance levels, which need to be further validated using larger samples in the future.
Conclusions
This study provides a comprehensive description of BT and insights into biological and other factors that may contribute to the development and individual variations of BT.
Keywords: brain asymmetry, age, sex, handedness, heritability, big data discovery
Introduction
Structural brain asymmetries have been thought to be the anatomical basis of functional lateralization (1). However, brain asymmetry studies accumulated over the past decades evidence that it is difficult to establish explicit relationships between structural and functional asymmetries (2–4), as structural asymmetry could be affected by diverse factors, such as age (5–8), sex (9), genetics (10–14) and brain disorders (5, 15–20). Brain asymmetries have been observed prenatally (21, 22), indicating an inherently lateralized, genetically mediated program of brain development (14). However, recent imaging genetic studies revealed that the heritability of structural asymmetries was less than 30% in adults (10–13), suggesting existence of environmental modifiers (21). By far, the literature has not been consistent (4, 10, 23). Most previous studies were based on limited sample sizes and heterogeneous methods for brain asymmetry measurement and analysis. Therefore, large-scale, systematic studies of structural asymmetries and possible influencing factors are required to acquire definitive and normative references for future studies (4, 10).
The most prominent structural asymmetry is an overall hemispheric twist of the brain, known as the Yakovlevian torque (24). The brain torque (BT) consists of three major components (3): 1) antero-posterior petalia referring to the protrusion of the right frontal and left occipital poles over the contralateral extremities, 2) left-right tissue distribution asymmetry (TDA) of wider/larger right frontal lobe and left occipital lobe, and 3) bending of the left occipital lobe over the right across the midline. BT may also include a bending in the frontal region and a relative hemispheric shift along the dorso-ventral axis (25). Recently, Kong and colleagues (12) comprehensively analyzed global brain skew (skewing factors from affine transformation) in a sample of ~40,000 adults. They demonstrated population-level, anticlockwise horizontal and vertical skews of the brain, and associated them with handedness and various measures of regional brain structure, cognitive functions, sociodemographics, physical and mental health. They also reported a heritability of 4–13% for the global skew. These results provide a large-scale description of the overall BT in adults. However, studying only the global asymmetry may neglect important genetic and phenotypic associations of individual BT components. No significant genetic loci were detected in the genome-wide association study (GWAS) for the global skew (12), whereas, recent genomic and phenomic studies have identified differential genetic and phenotypic associations of regional structural measures (26–28) and their asymmetries (13) across the brain. Furthermore, genetic contributions for brain asymmetries were estimated using adult cohorts mostly (10–13), and the lifespan trajectory of BT has remained unclear. Here, we systematically characterized all relevant components of BT in a sample comprised 24,112 children and adults, and assessed their lifespan (3–81 years) trajectories and their relationships with genetic and a broad range of nongenetic factors.
Materials and Methods
We utilized neuroimaging data of 24,112 subjects from 6 cohorts: Adolescent Brain Cognitive Development (ABCD (29)), Human Connectome Project (HCP (30)), International Consortium for Brain Mapping (ICBM (31)), Pediatric Imaging, Neurocognition, and Genetics (PING (32)), Philadelphia Neurodevelopmental Cohort (PNC (33)) and UK Biobank (UKB (34)). Sample characteristics were summarized in Table S1. All study procedures were approved by the institutional review boards of the participating institutions of these projects, and all participants provided written informed consent.
Brain torque (BT) profiles, including fontal/occipital petalia, bending and shift, tissue distribution asymmetry (TDA) of hemispheric width (Asymwidth) and perimeter (Asymperimeter) at 60 contiguous coronal brain slices, and vertex-wise and regional surface positional asymmetries (SPA) along the left-right (AsymLR), antero-posterior (AsymAP) and dorso-ventral (AsymDV) axes, were measured from structural magnetic resonance imaging (MRI) data using a workflow of automatic 3D brain shape analysis approaches introduced recently (25, 35–37) (Fig. 1). Especially, we computed mean AsymLR, AsymAP and AsymDV within 74 brain regions defined by the Destrieux atlas (38) as the traits for SPA in genome/phenome scans to overcome the computational challenge to implement vertex-wise throughput analyses. This resulted 348 BT profiles in total (6 lobar + 60×2 TDA + 74×3 regional SPA measures).
Figure 1.
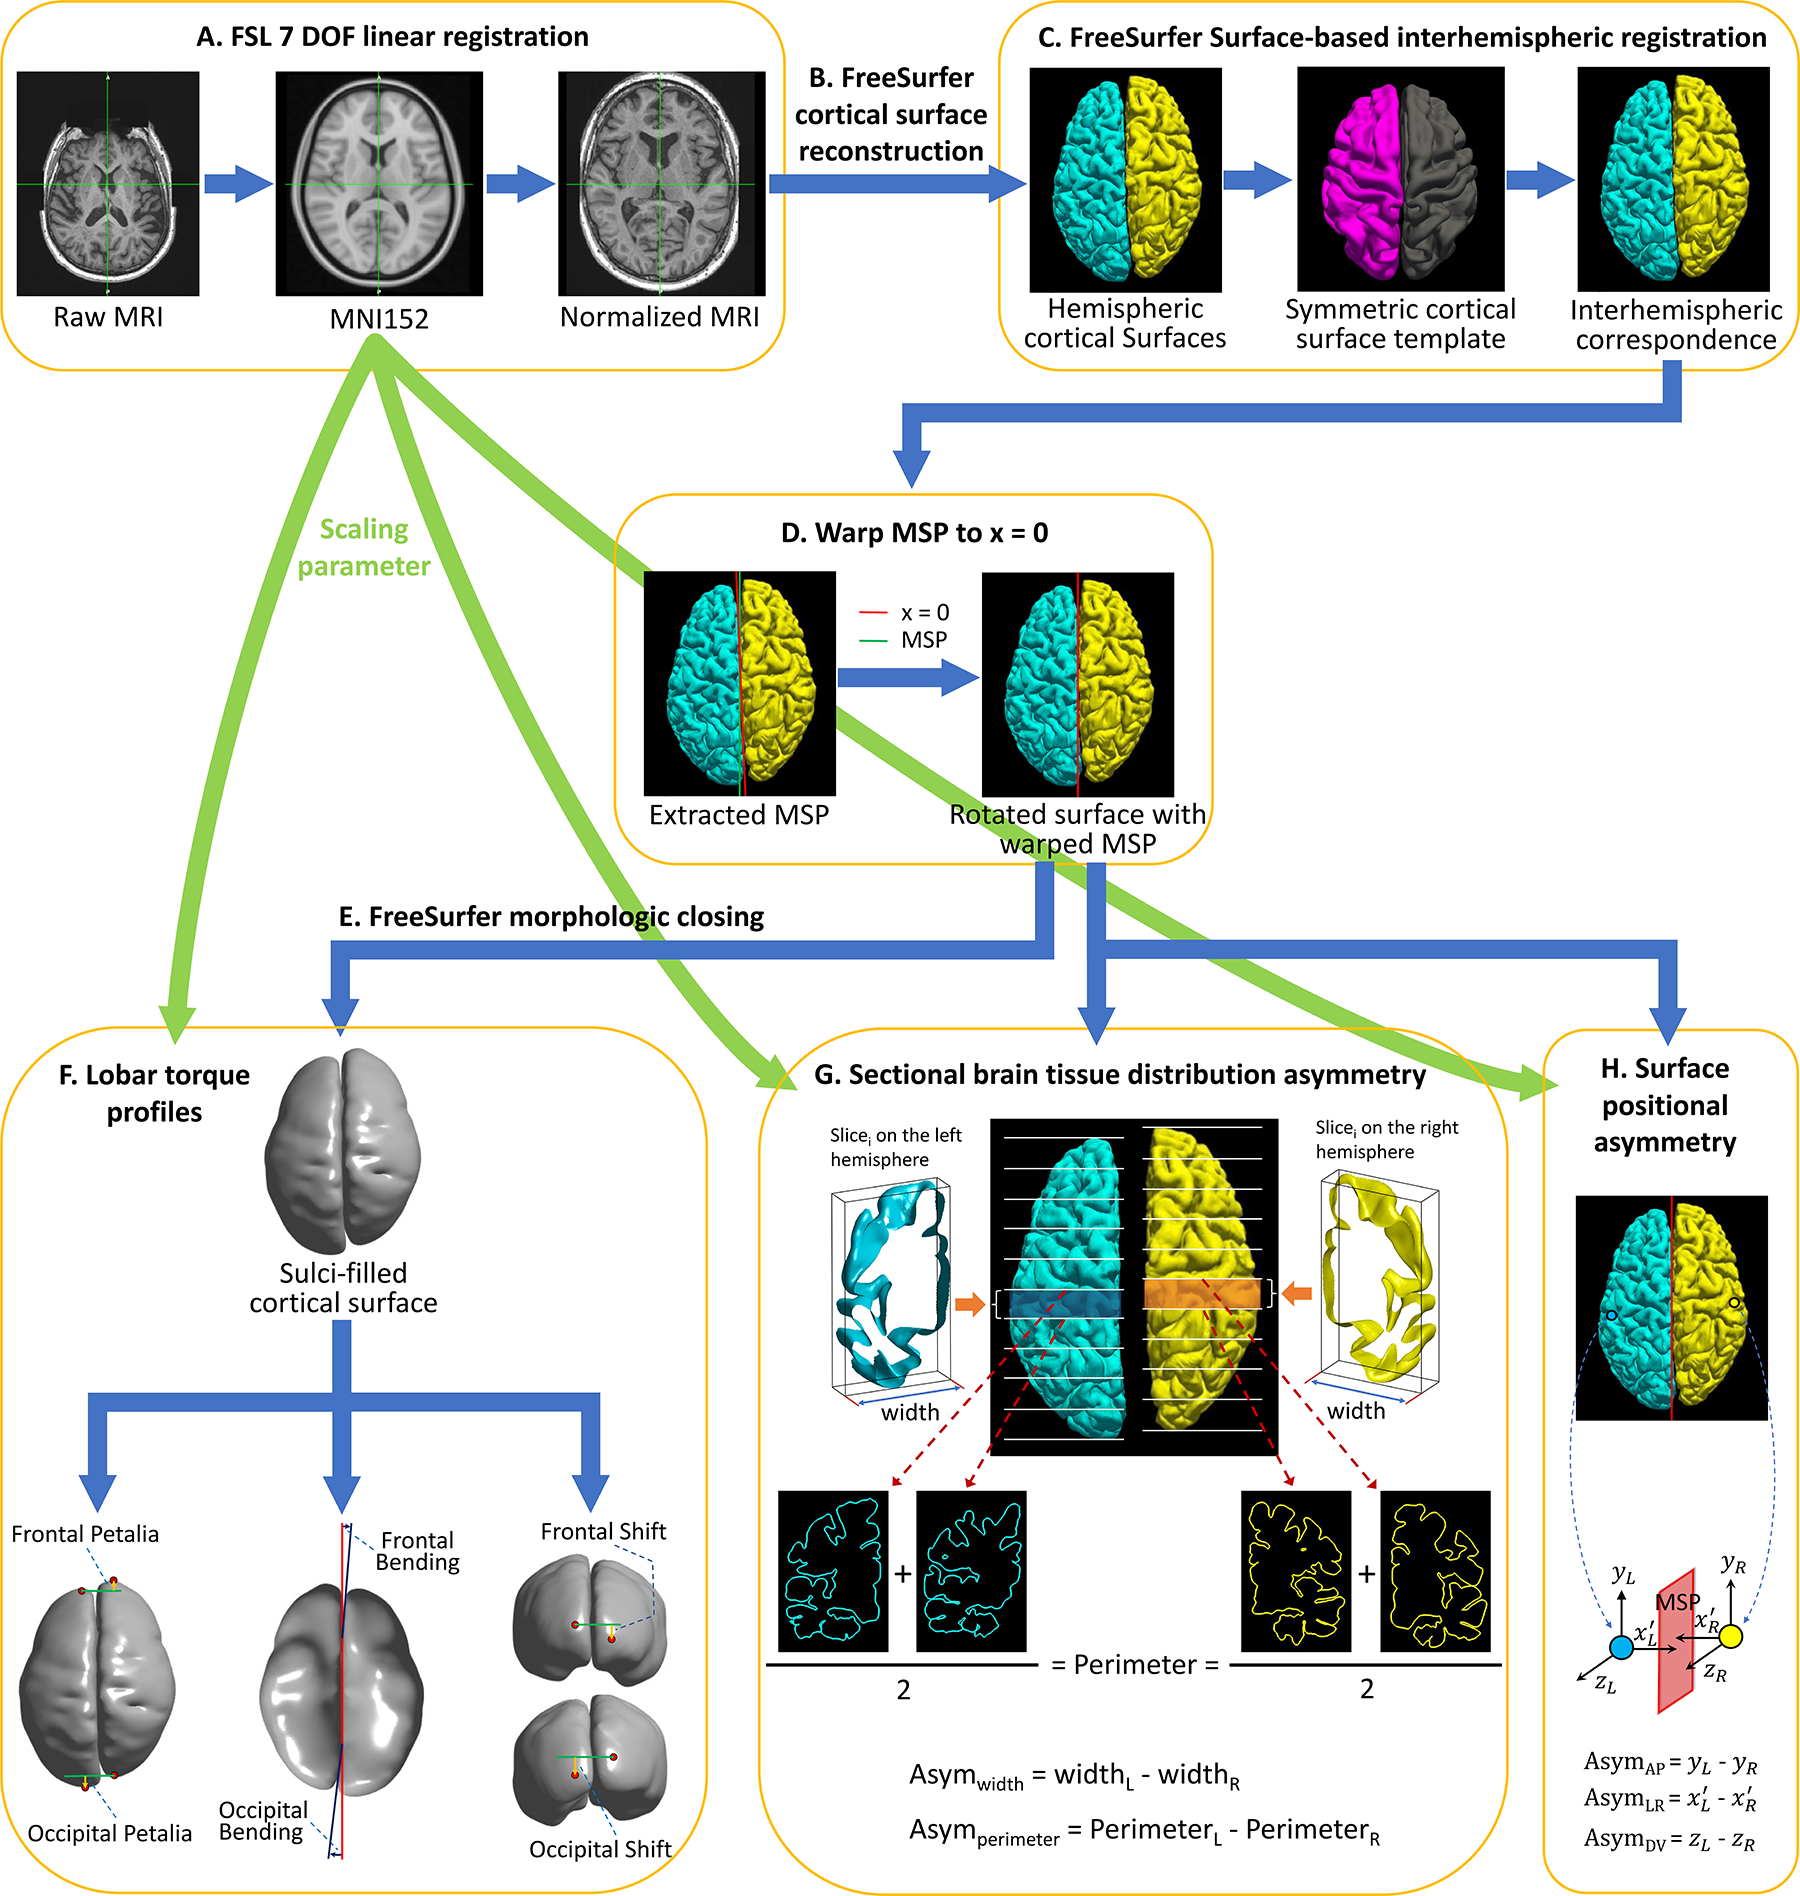
Workflow for computing complex brain torque profiles. A: FSL preprocessing for normalizing the native brain volume to the standard MNI152 template using a 7 degrees of freedom (DOF) transformation. B: FreeSurfer processing on the spatially normalized brain volume to reconstruct cortical hemispheric surfaces. C: FreeSurfer surface-based interhemispheric registration to establish vertex-wise interhemispheric correspondence. D: Correcting for mis-registration of the brain mid-sagittal plane (MSP) by rotating the brain surface with an 3D angle between MSP and the plane x = 0. MSP was extracted as the plane best fitting the two hemispheric medial surfaces. E: FreeSurfer morphologic closing to fill sulci and smooth the cortical surface. F: Computing petalia and shift as the respective displacements of the left and right frontal/occipital extreme points along the antero-posterior and dorso-ventral axes respectively. Estimating bending as the angles between the planes best fitting the interhemispheric fissure in the frontal/occipital regions and MSP. G: Measuring left-right asymmetries in hemispheric width (Asymwidth) and perimeter (Asymperimeter) in 60 contiguous coronal brain slices. Sectional hemispheric width and perimeter was measured as the bounding box width and the average pial surface length at two ends of each brain slice respectively. H: Computing interhemispheric surface positional asymmetries along the left-right axis (AsymLR) as vertex-wise differences in the distances to MSP on the x-axis, and asymmetries along the antero-posterior (AsymAP) and dorsal-ventral axis (AsymDV) as the vertex-wise relative displacements on the y- and z-axes respectively.
Effects of age, sex, handedness, sex-by-handedness interaction and total intracranial volume were tested for BT profiles using multiple linear regression models. Phenome scans were conducted to explore associations of BT profiles with extensive phenotypic variables from UKB and with diverse measures of child psychopathological symptoms/behaviors from ABCD and PNC.
Pedigree-based heritability () of BT features was estimated using the twin data from ABCD and HCP using SOLAR-Eclipse (39). Single-nucleotide polymorphism (SNP)-based heritability () were estimated using LDSC (40) with the GWAS summary statistics for UKB and the meta-GWAS summary statistics and using GCTA-GREML (41) with the filtered genotyping dataset from UKB. GWAS analyses on BT measures were conducted for each imaging-genomics cohort (ABCD, PING, PNC and UKB). We then used METAL (42) to perform meta-GWAS analysis using the z-scores method, based on P-values, sample sizes and direction of effect, with genomic control correction. Association lookups were performed for all leading SNPs via the NHGRI-EBI catalog of published GWASs (43) to check whether they had been previously associated with other traits. Analyses of gene-based associations, gene-set enrichment and gene-property were implemented using MAGMA (44). Genetic correlations between BT features and 9 complex traits that were widely related to brain asymmetry were estimated by correlating the current meta-GWAS summary statistics with recent GWAS summary statistics for those traits (45–53) using LDSC (40).
Detailed materials and methods are described in Supplementary Materials and Methods. Complete summary statistics of genomic and phenomic analyses and the codes for BT measurements are available at http://phewas.loni.usc.edu/data/contents.php.
Results
Population-level average brain torque
The pooled sample showed right-frontal and left-occipital petalia, leftward-frontal and rightward-occipital bending (Fig. 2–A), rightward-frontal and leftward-occipital Asymwidth and Asymperimeter (Fig. 2–B). Both the frontal and occipital poles showed a downward shift (Fig. 2–A). The petalia, bending and shift in the occipital region were significantly larger than their frontal counterparts (Table S2). The prevalence of these BT patterns demonstrated their predominance in the population (Table S3 and Fig. S1). SPA results showed that most of the left hemispheric surface was displaced nearer to the mid-sagittal plane, posteriorly and inferiorly relative to the right (Fig. 2–C). Especially, a leftward AsymLR in the superior temporal sulcus was surrounded by opposite effects, indicating a deeper right superior temporal sulcus than left. The most pronounced posterior and ventral relative displacements were located in the posterior boundary of the Sylvian fissure and the left lateral superior temporal gyrus was lifted upward, implying a longer, narrower and less curved left Sylvian fissure than the right. The average BT patterns were largely reproduced in individual datasets (Table S2 and Fig. S2–S3). Most of the BT measures were significantly intercorrelated (Fig. S4).
Figure 2.
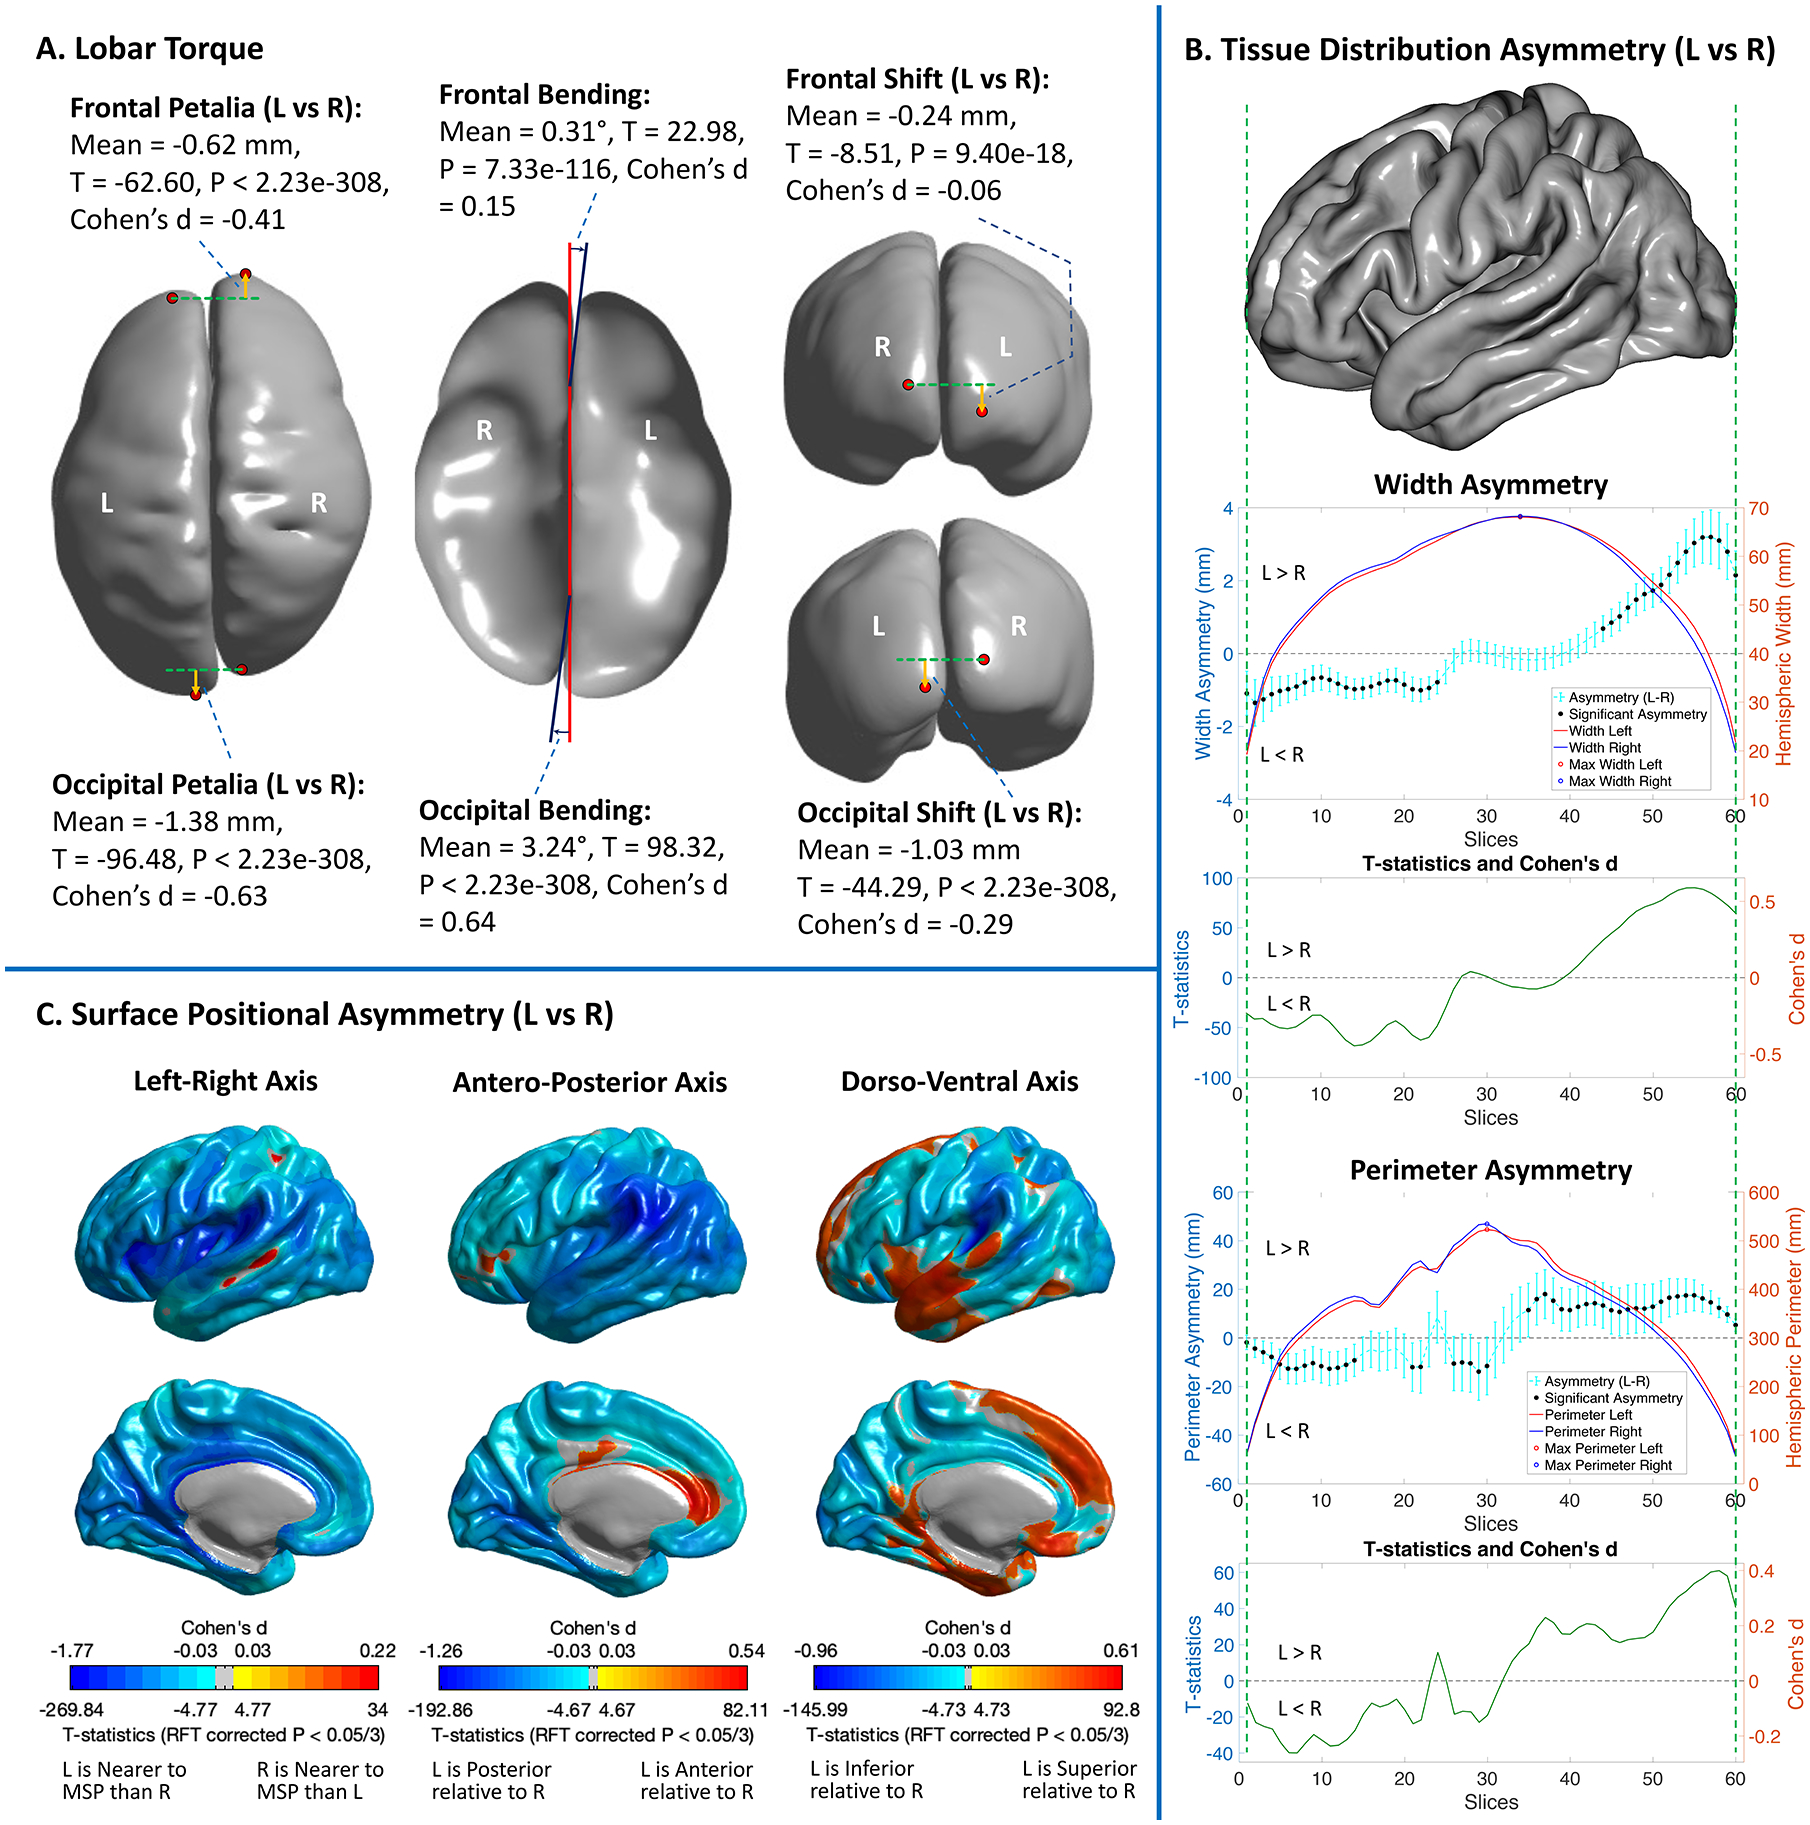
Population-level, average brain torque measures computed in the pooled sample. (A) Statistics for petalia, bending and shift are illustrated on a smoothed cortical surface model. Negative petalia = left hemispheric extreme is displaced posteriorly relative to right; positive bending angle = anticlockwise twist; negative shift = left hemispheric extreme is displaced inferiorly relative to right. Red points represent frontal/occipital extremes. Orange arrows show directions of petalia and shift. In the middle panel, red and blue lines respectively represent the middle-sagittal plane and the fitted frontal/occipital interhemispheric planes in the axial view. (B) Cyan lines with error bars show the means and 95% confidence intervals of sectional asymmetries in hemispheric width and perimeter. Significant asymmetries (P < 0.05/120 and asymmetry/(left+right) > 2%) are marked with black dots. T-statistics and Cohen’s d for these sectional asymmetries are illustrated with green lines bellow the asymmetry plots. The left hemisphere of the FreeSurfer fsaverage cortical surface template is displayed above the asymmetry plots as the reference of brain anatomy. (C). Significant (random field theory (RFT) corrected P < 0.05/3) surface positional asymmetries along the Left-Right, Antero-Posterior and Dorso-Ventral axes. Color bars represent the T-statistics and Cohen’s d. L = Left, R = Right.
Age, sex and handedness effects on brain torque
linear and nonlinear, cross-sectional age trajectories of BT profiles were characterized across the lifespan in the pooled sample (Fig. 3, S5–S6). Most nonlinear age trajectories, primarily observed for frontal, occipital and perisylvian BT features, were characterized by an initial negative age-BT association from childhood to early young adulthood, followed by a positive association in late young adulthood, and then a stabilization of the torque (cubic model) or lack of the phase of stabilization (quadratic model) in late adulthood; most of the linear age trajectories were delineated by a positive BT-age association. Of note, sites and scanners were not adjusted for the pooled sample because the absence of age overlapping across all cohorts (Table S1) caused pronounced associations between age and sites/scanners (r > 0.79). For validation, age effects were retested in separate age windows using subsamples with overlapped age ranges and adjusting for sites/scanners and other covariates (Supplementary Methods). Patterns of the complex age-BT associations over the lifespan were largely reproduced (Fig. 4, S7–S8).
Figure 3.
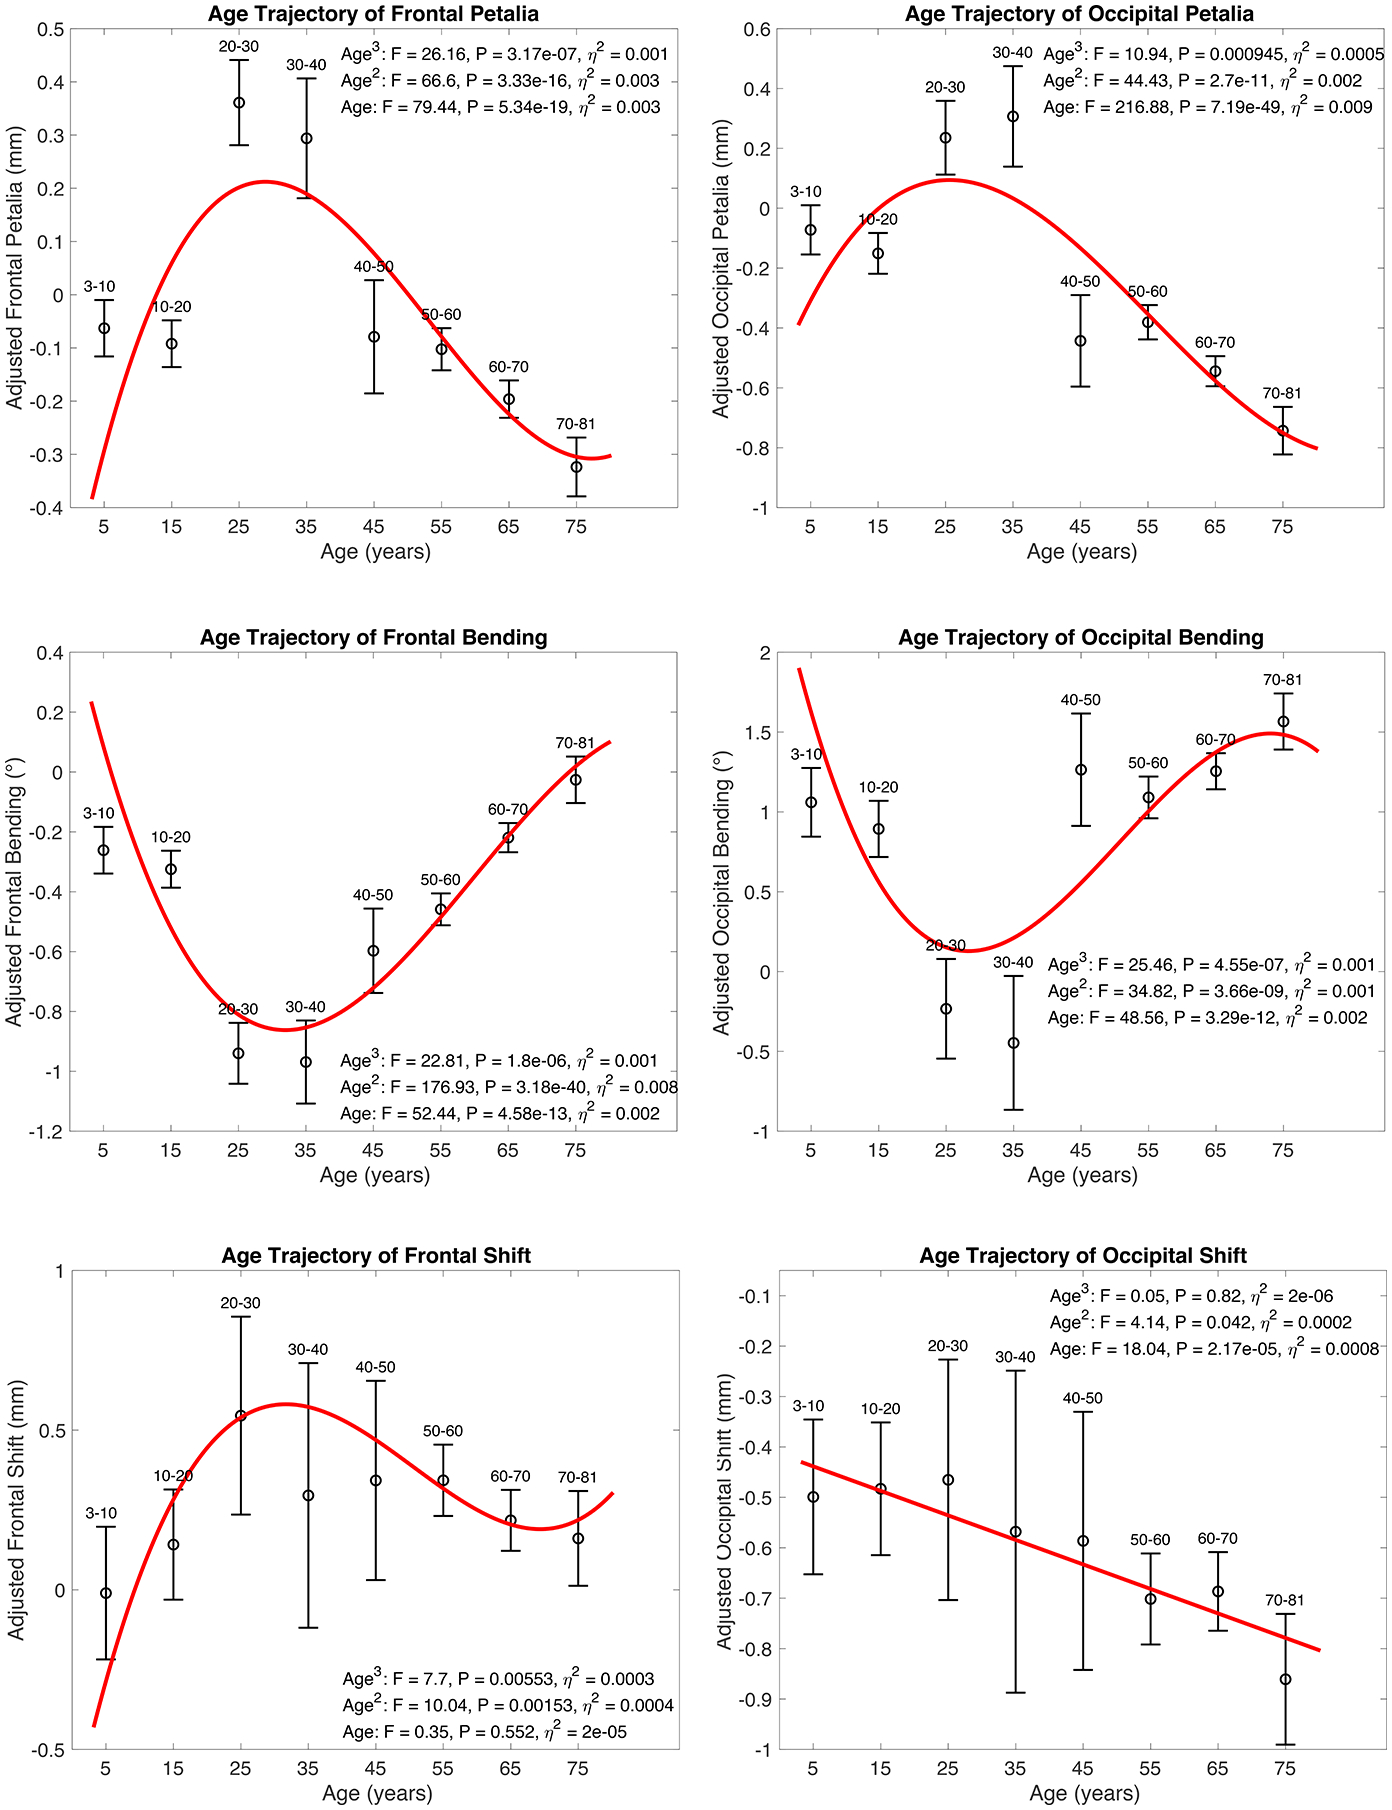
Age-related differences in petalia, bending and shift assessed in the pooled sample. Statistics for cubic, quadratic and linear age effects are annotated in each subplot. Red lines represent fitted age trajectories. Black circles with error bars show the means and 95% confidence intervals of adjusted measures of frontal/occipital petalia, bending and shift in sub-age groups. Age-related differences in tissue distribution asymmetries and surface positional asymmetries assessed in the pooled sample are illustrated in Fig. S5–S6.
Figure 4.
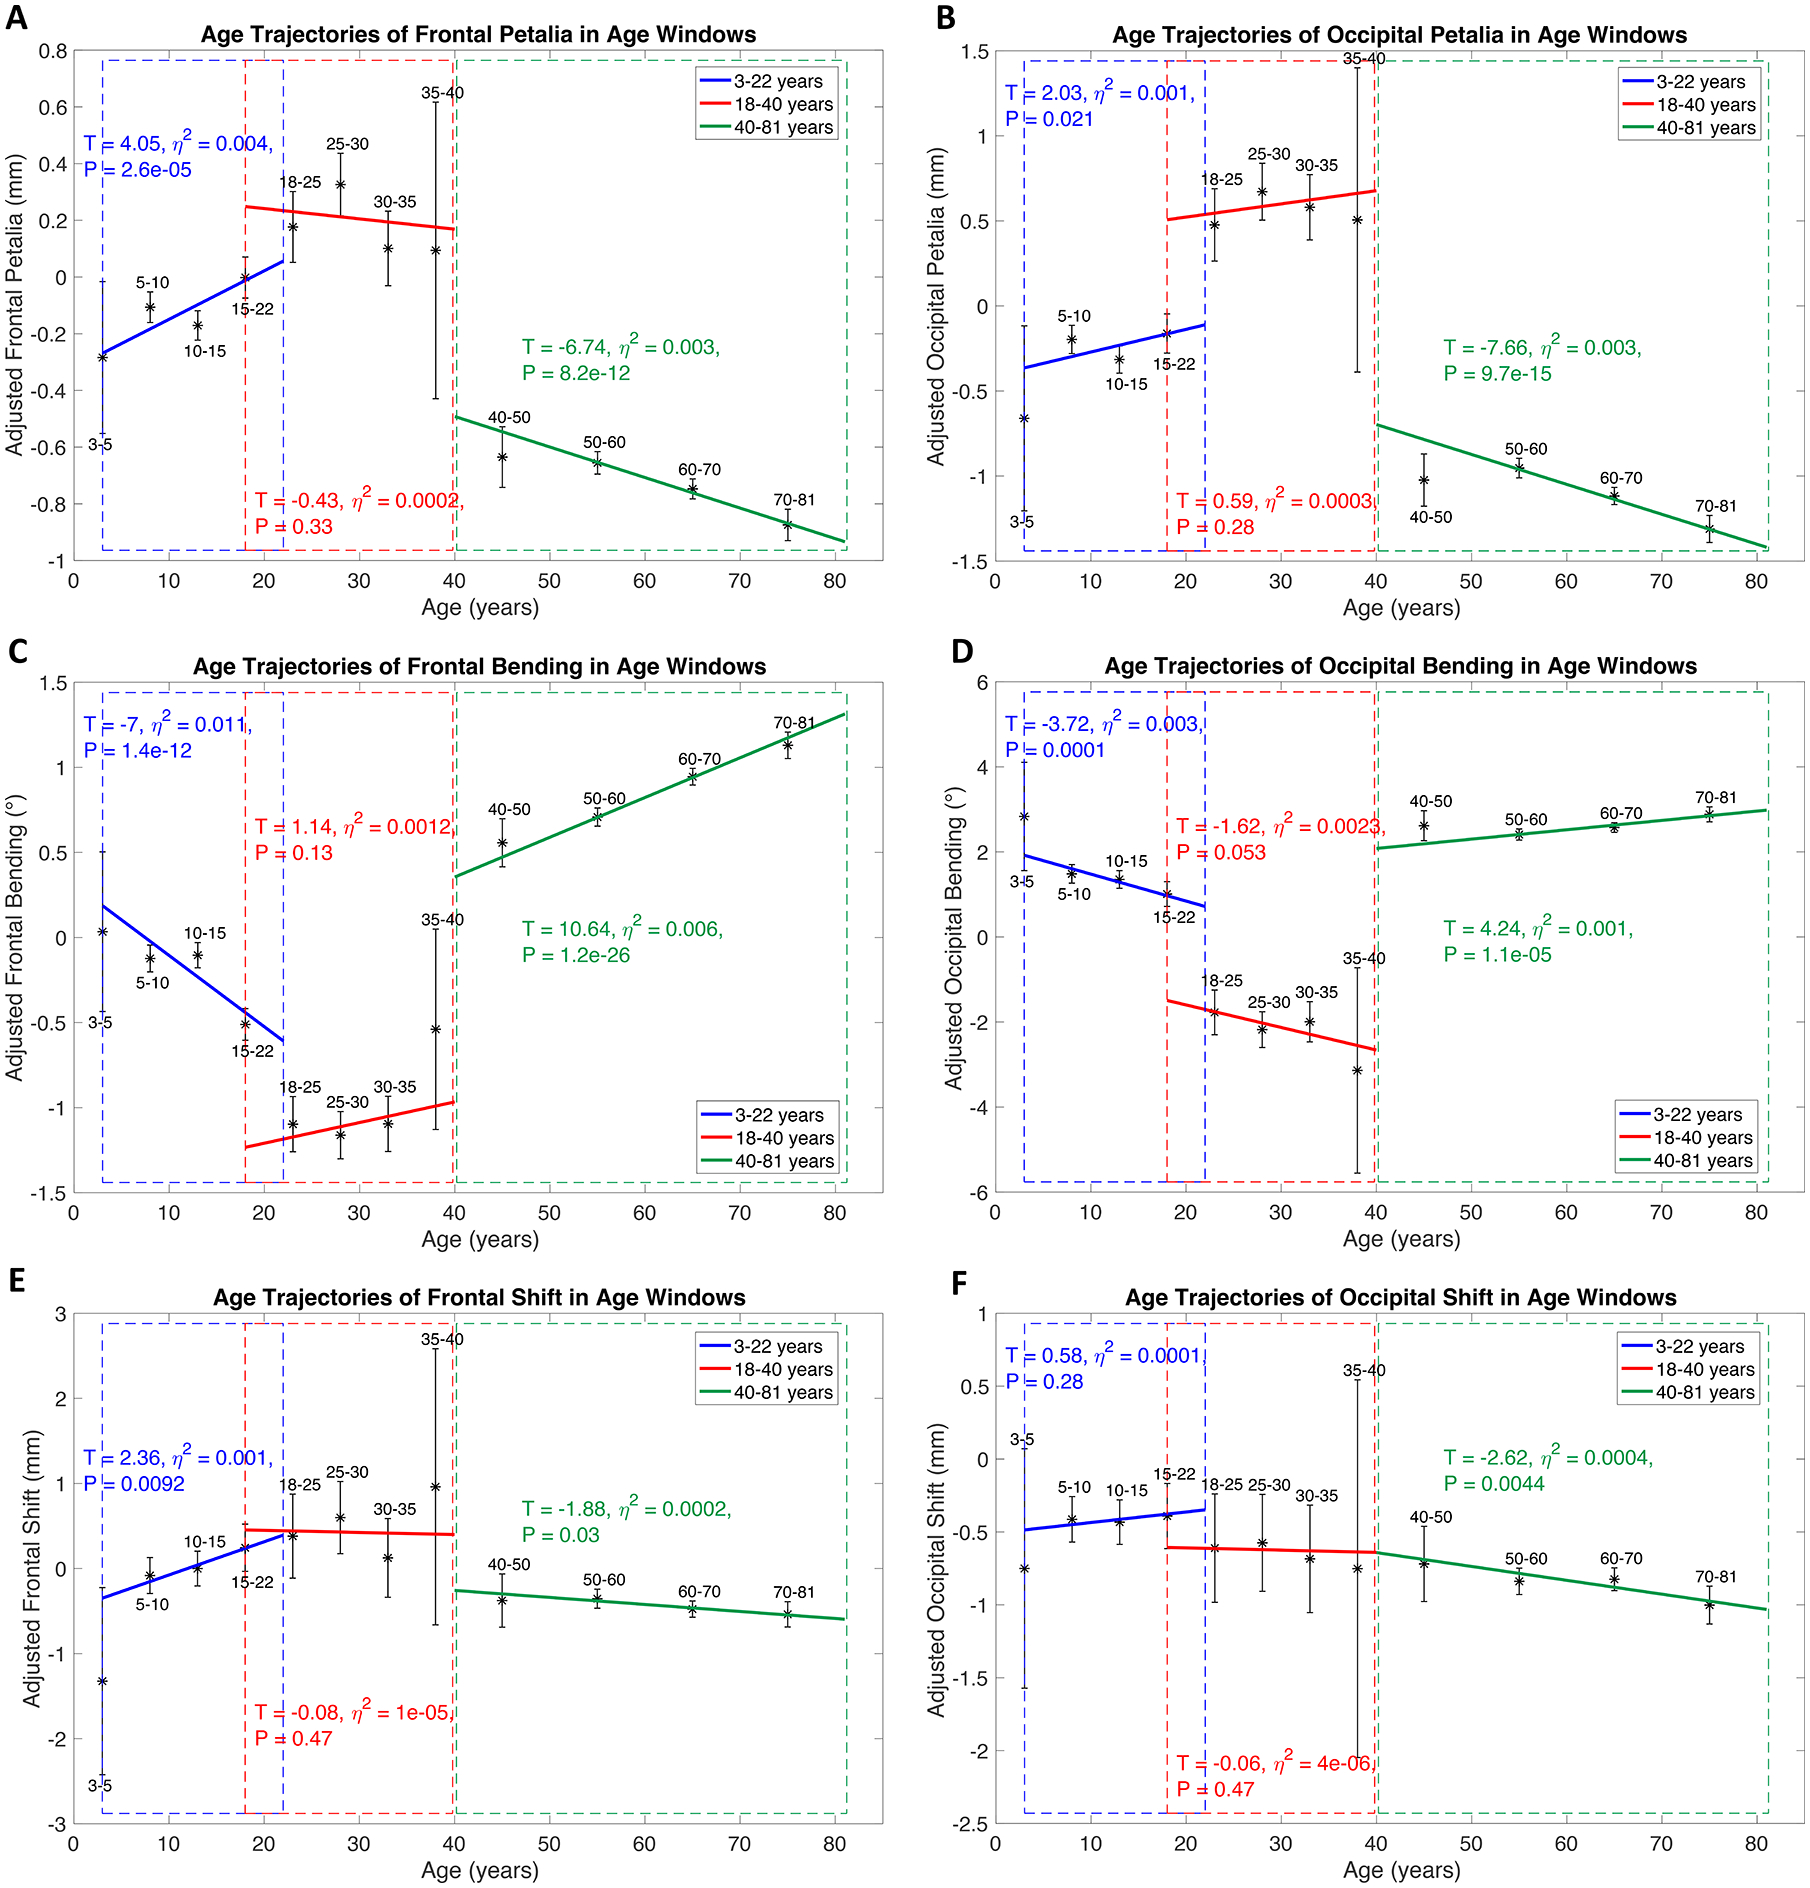
Age effects on petalia, bending and shift assessed in separate age windows using subsamples with overlapped age ranges (ABCD, PING and PNC for 3–22 years, HCP and a part of ICBM for 18–40 years, UKB and a part of ICBM for 40–81 years) and adjusting for sites and scanners and other covariates. Blue, red and green lines represent fitted age trajectories in age windows of 3–22, 18–40 and 40–81 years respectively. Statistics for age effects in each age window are annotated with the same color of the corresponding age trajectory. Blue, red and green dash rectangles highlight the age windows respectively. Black asterisks with error bars show the means and 95% confidence intervals of adjusted measures of frontal/occipital petalia, bending and shift in sub-age groups. Age-related effects on tissue distribution asymmetries and surface positional asymmetries assessed in the split analyses are illustrated in Fig. S7–S8.
Compared to females, males showed increased magnitude and variance of right-frontal and left-occipital petalia, leftward-frontal bending (Fig. 5 and Table S4), rightward-frontal and leftward-occipital Asymwidth, leftward-occipital Asymperimeter (Fig. S9–A and S10–A), and the population-level average patterns of SPA (Fig. S9–B and S10–B). The prevalence of typical right-frontal and left-occipital petalia and leftward-frontal and rightward-occipital bending were also increased in males (Table S5–S6).
Figure 5.
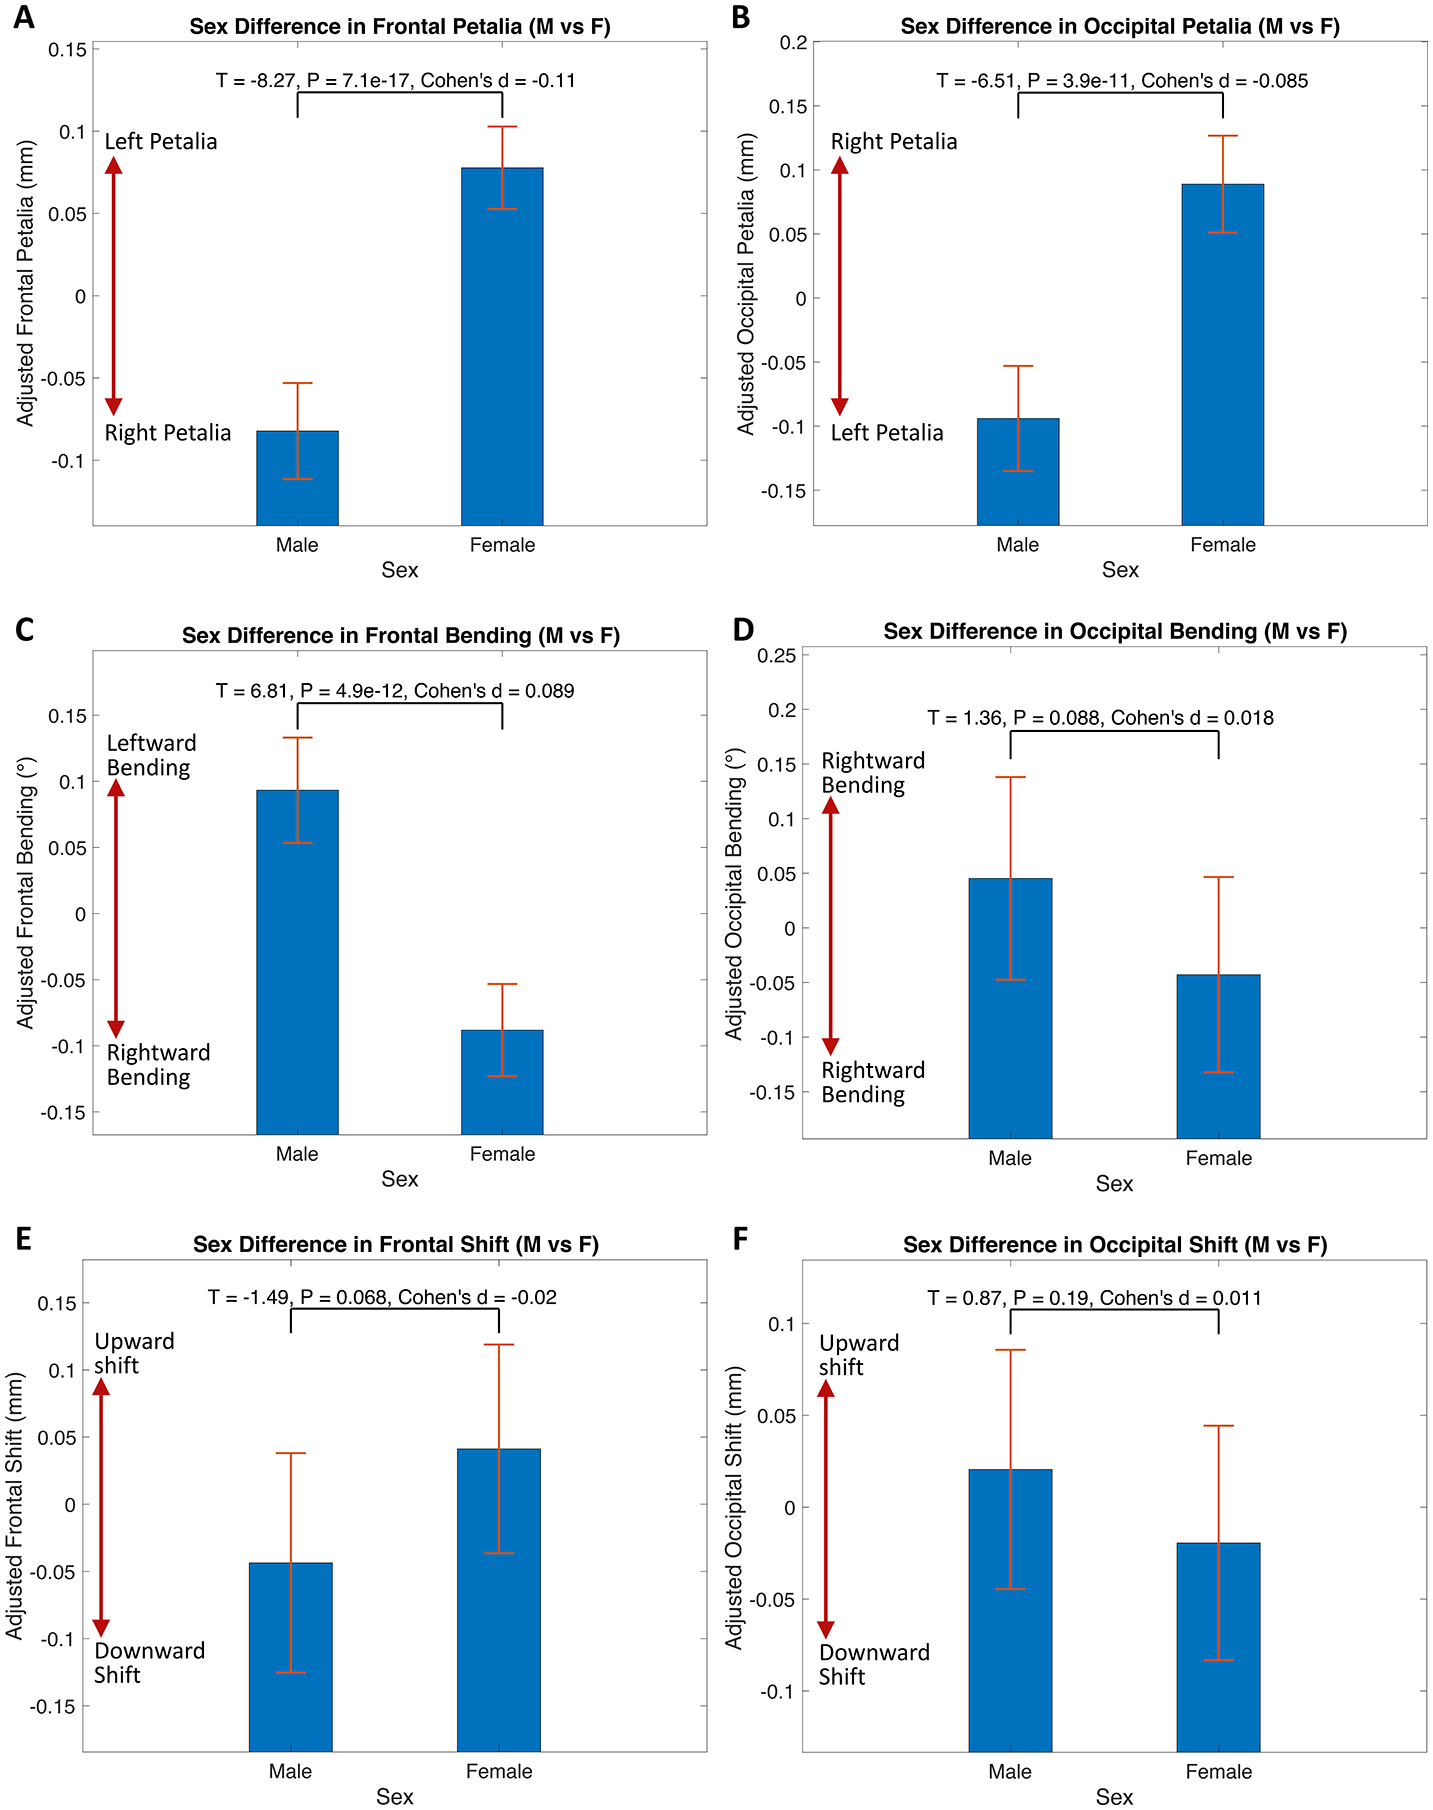
Sex differences in petalia, bending and shift assessed in the pooled sample. Bar graphs with error bars show the means and 95% confidence intervals of adjusted measures of frontal/occipital petalia, bending and shift for males (M) and females (F). Statistics for sex comparisons are annotated in each subplot. Sex differences in brain tissue distribution asymmetries and surface positional asymmetries are illustrated in Fig. S9.
Right-handers showed increased leftward-frontal bending and leftward-occipital Asymwidth than left-handers (Fig. 6–C and S11–A) and larger left-occipital petalia than mixed-handers (Fig. 6–B). Differences in SPA between right- and left-handers were detected primarily in the medial parietal cortex for AsymLR, in the insula and perisylvian cortex for AsymAP, and in the motor, temporal and lateral occipital cortices for AsymDV (Fig. S11–B). Mixed-handers showed different variance (Table S7 and Fig. S12–S13) and prevalence (Table S5–S6) of BT measures from both right- and left-handers. Right-handers, compared to left-handers, also showed decreased variance of frontal Asymwidth and occipital Asymperimeter and of distributed SPA measures (Fig. S12–S13). No effects of sex-by-handedness interaction and total intracranial volume were found for all BT features.
Figure 6.
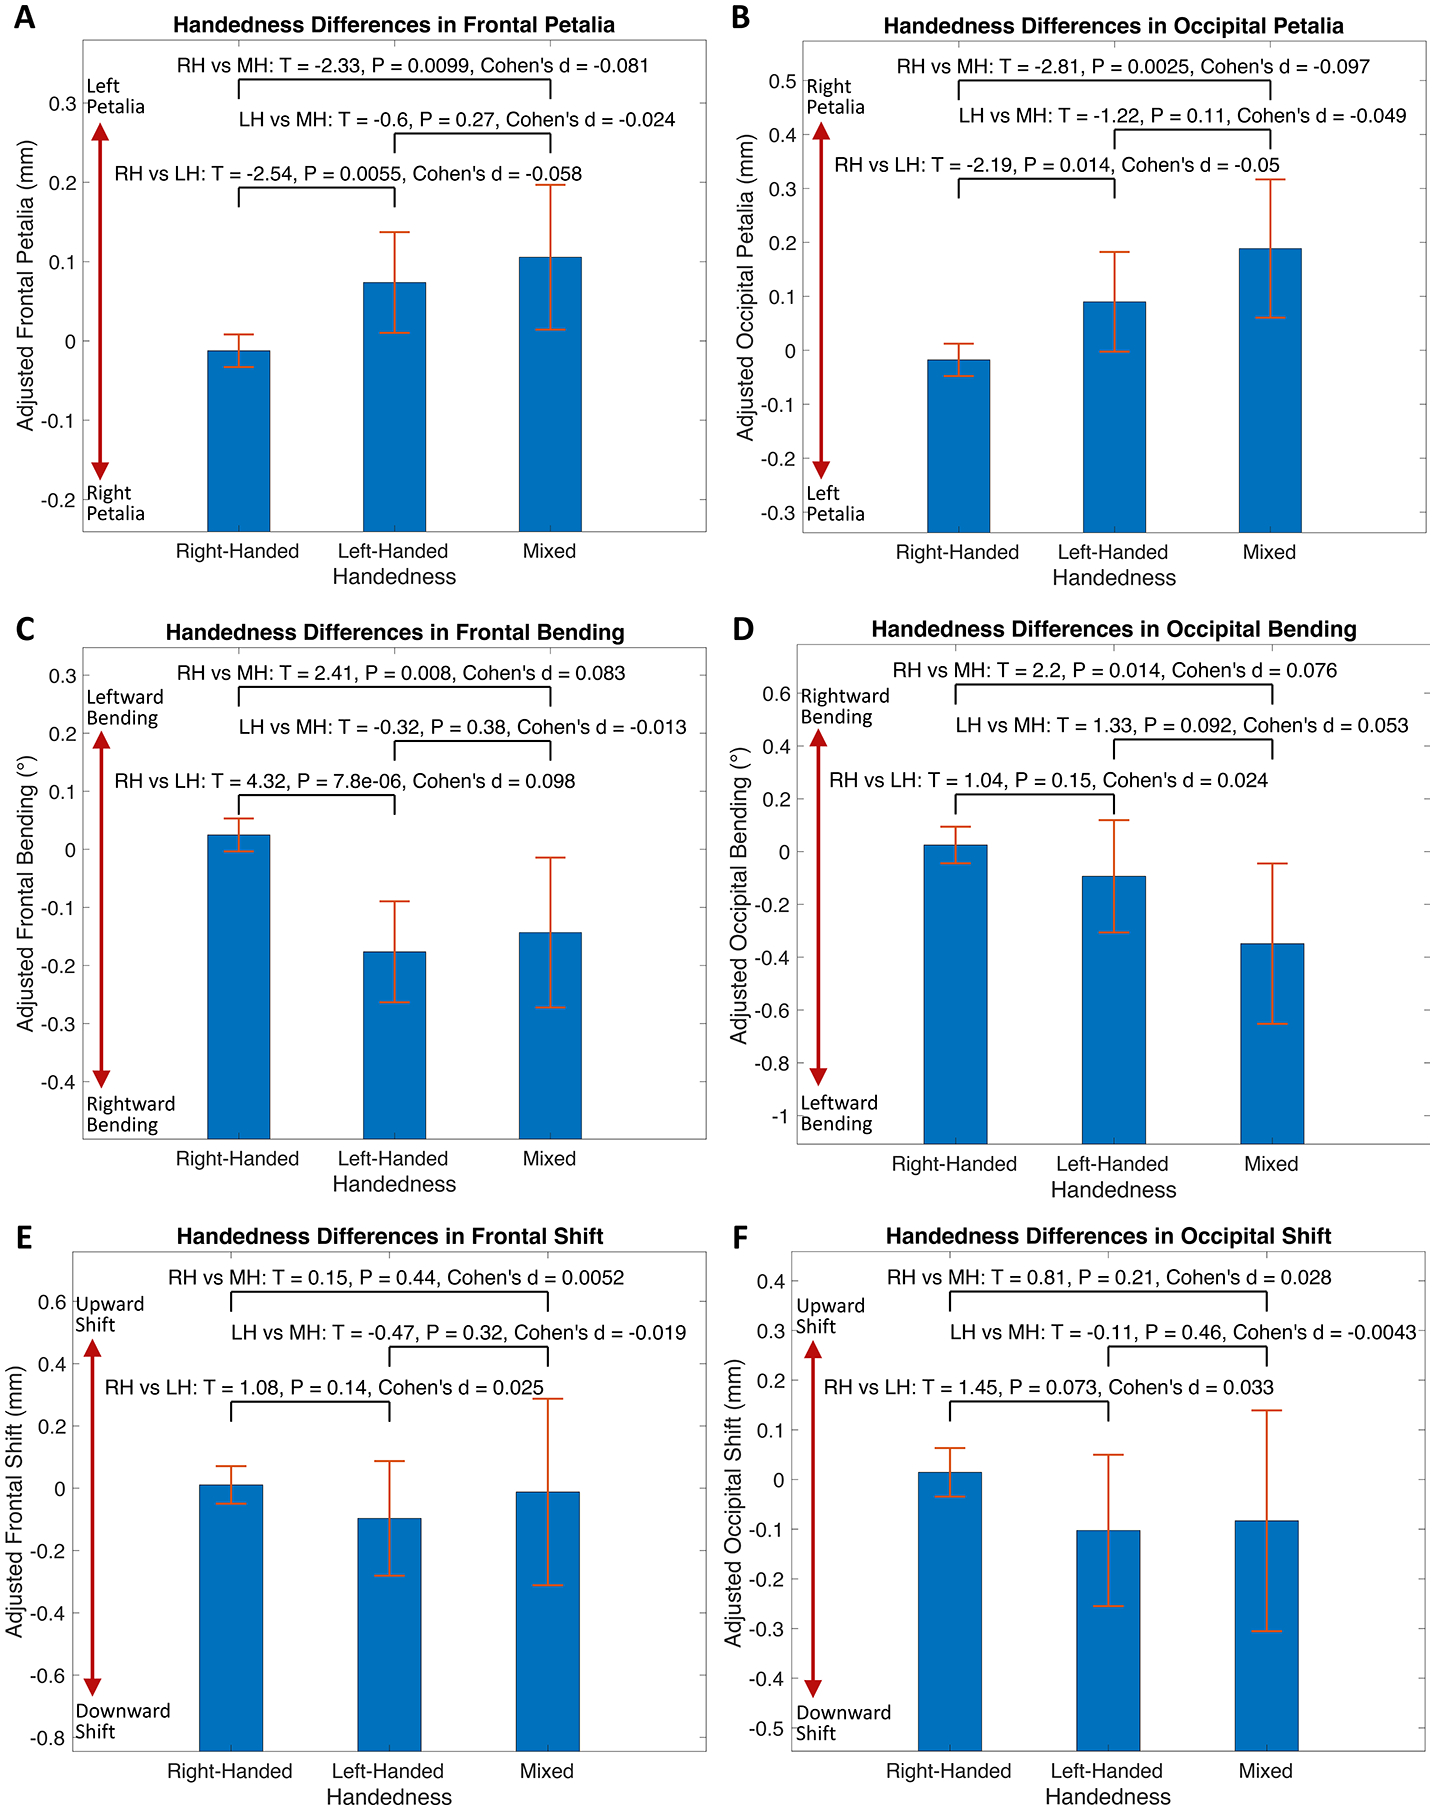
Handedness differences in petalia, bending and shift assessed in the pooled sample. Bar graphs with error bars show the means and 95% confidence intervals of adjusted measures of frontal/occipital petalia, bending and shift for right-handers (RH), left-handers (LH) and mixed-handers (MH). Statistics for handedness comparisons are annotated in each subplot. Handedness differences in tissue distribution asymmetries and surface positional asymmetries are illustrated in Fig. S11.
Phenome scan analyses
Scanning over extensive phenotypic data from UKB, we identified 942 BT-related phenotypes (P < 0.05/6334 phenotypes/348 BT measures). The majority (832 out of 942) were regional brain MRI measures, including regional grey matter (GW) volume, surface area and thickness, microstructural measures of white matter (WM) tracts, and volume, mean intensity and/or T2* of subcortical regions and lateral ventricles (Fig. 7). These associations were always lateralized to one hemisphere or reversed between the two hemispheres and were twisted along the anterior-posterior axis (Fig. 8). The most pronounced associations (P < 5e-324) were observed for bipolar and major depression status, smoking status and the cognitive function of verbal-numerical reasoning (fluid intelligence) (Fig. 7). The other associated phenotypes included alcohol consumption, education, household, anthropometric measures and etc. Detailed results are listed in Table S8–S13.
Figure 7.
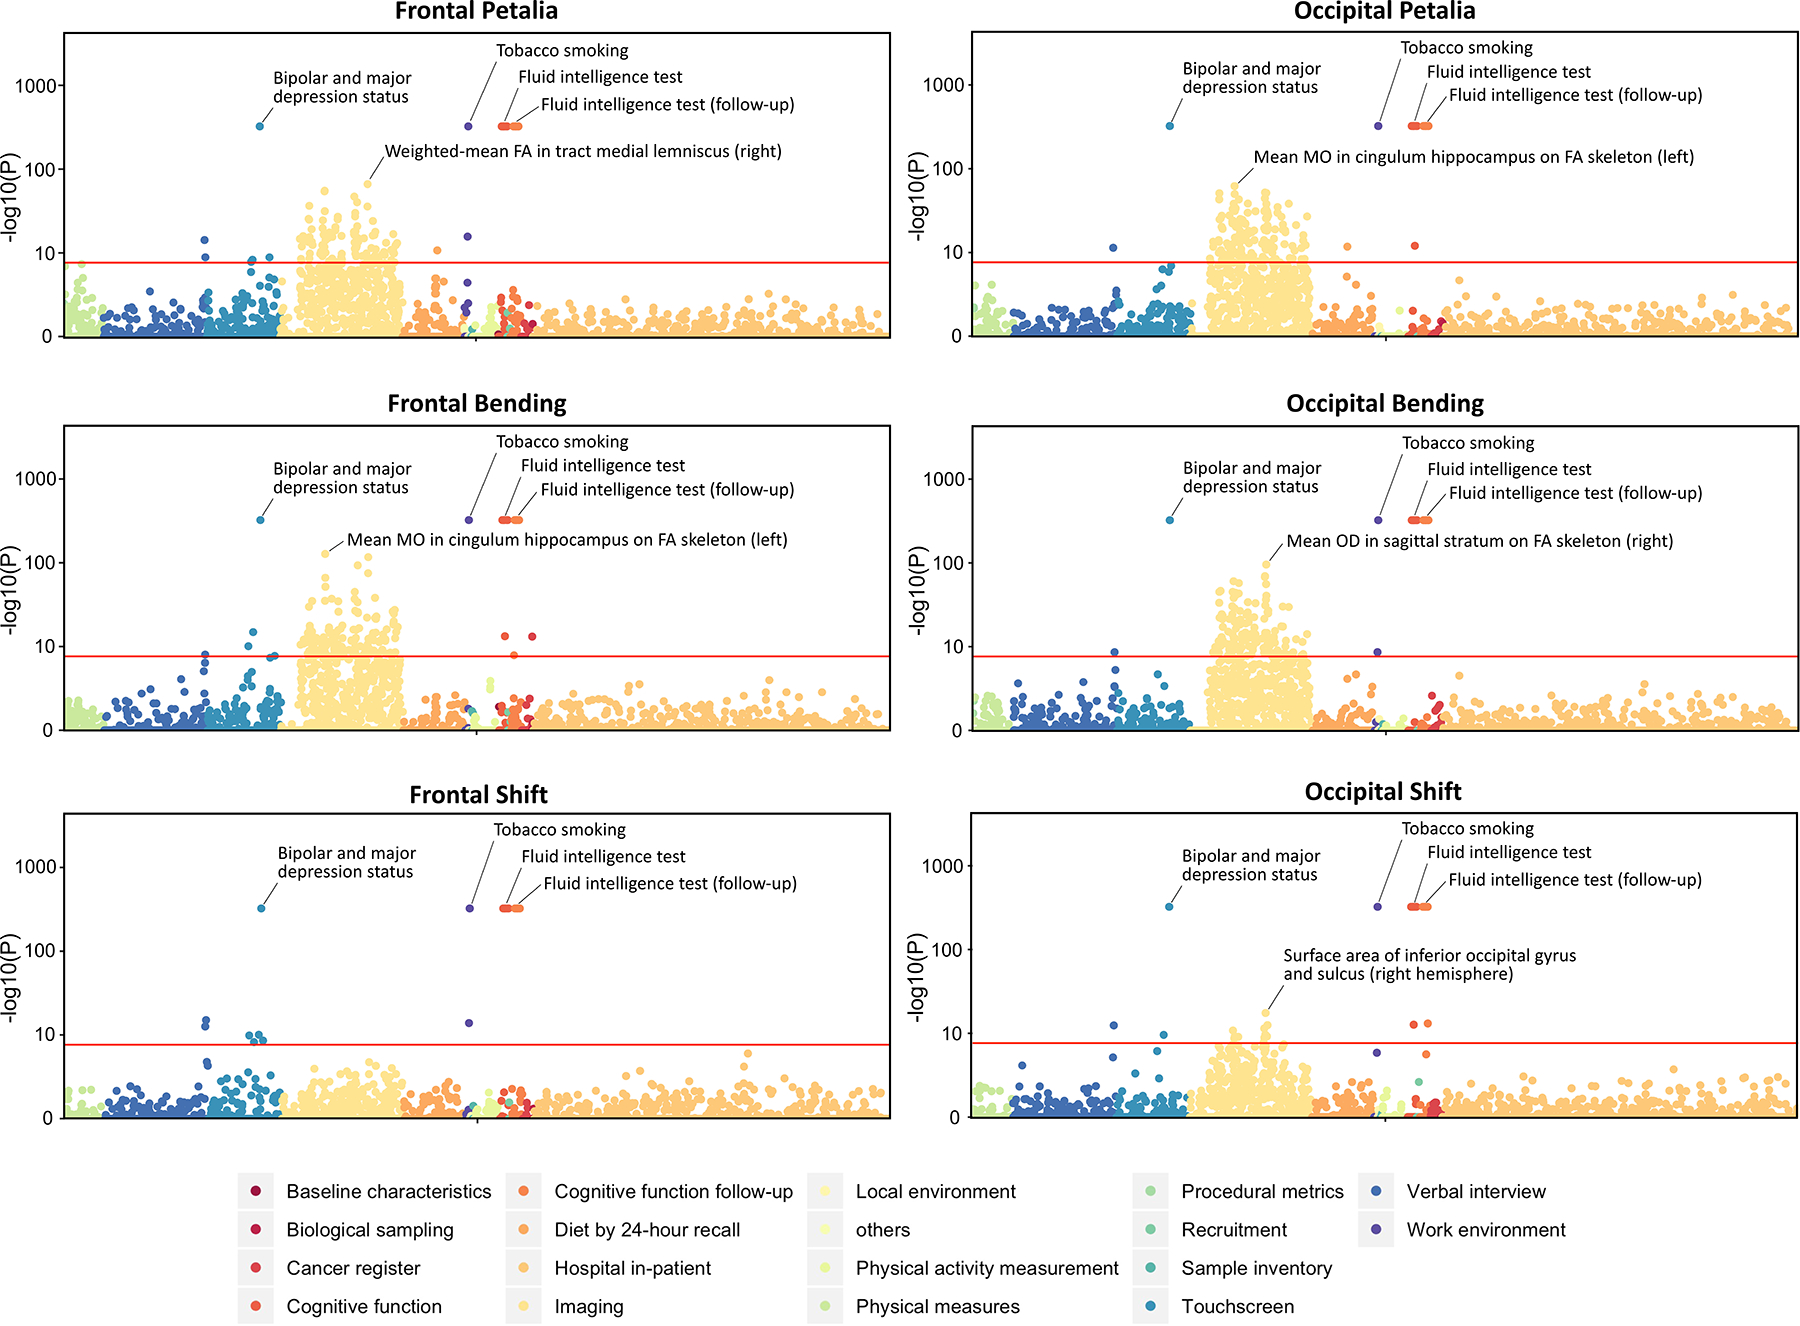
Manhattan plots for phenome-wide associations of frontal/occipital petalia, bending and shift assessed using the UK Biobank dataset. Red lines indicate the phenome-wide significant threshold adjusted for the number of brain torque measures (P < 0.05/6334 phenotypes/348 BT measures = 2.27e-8). For complete results of the phenome scans, see Table S8–S13.
Figure 8:
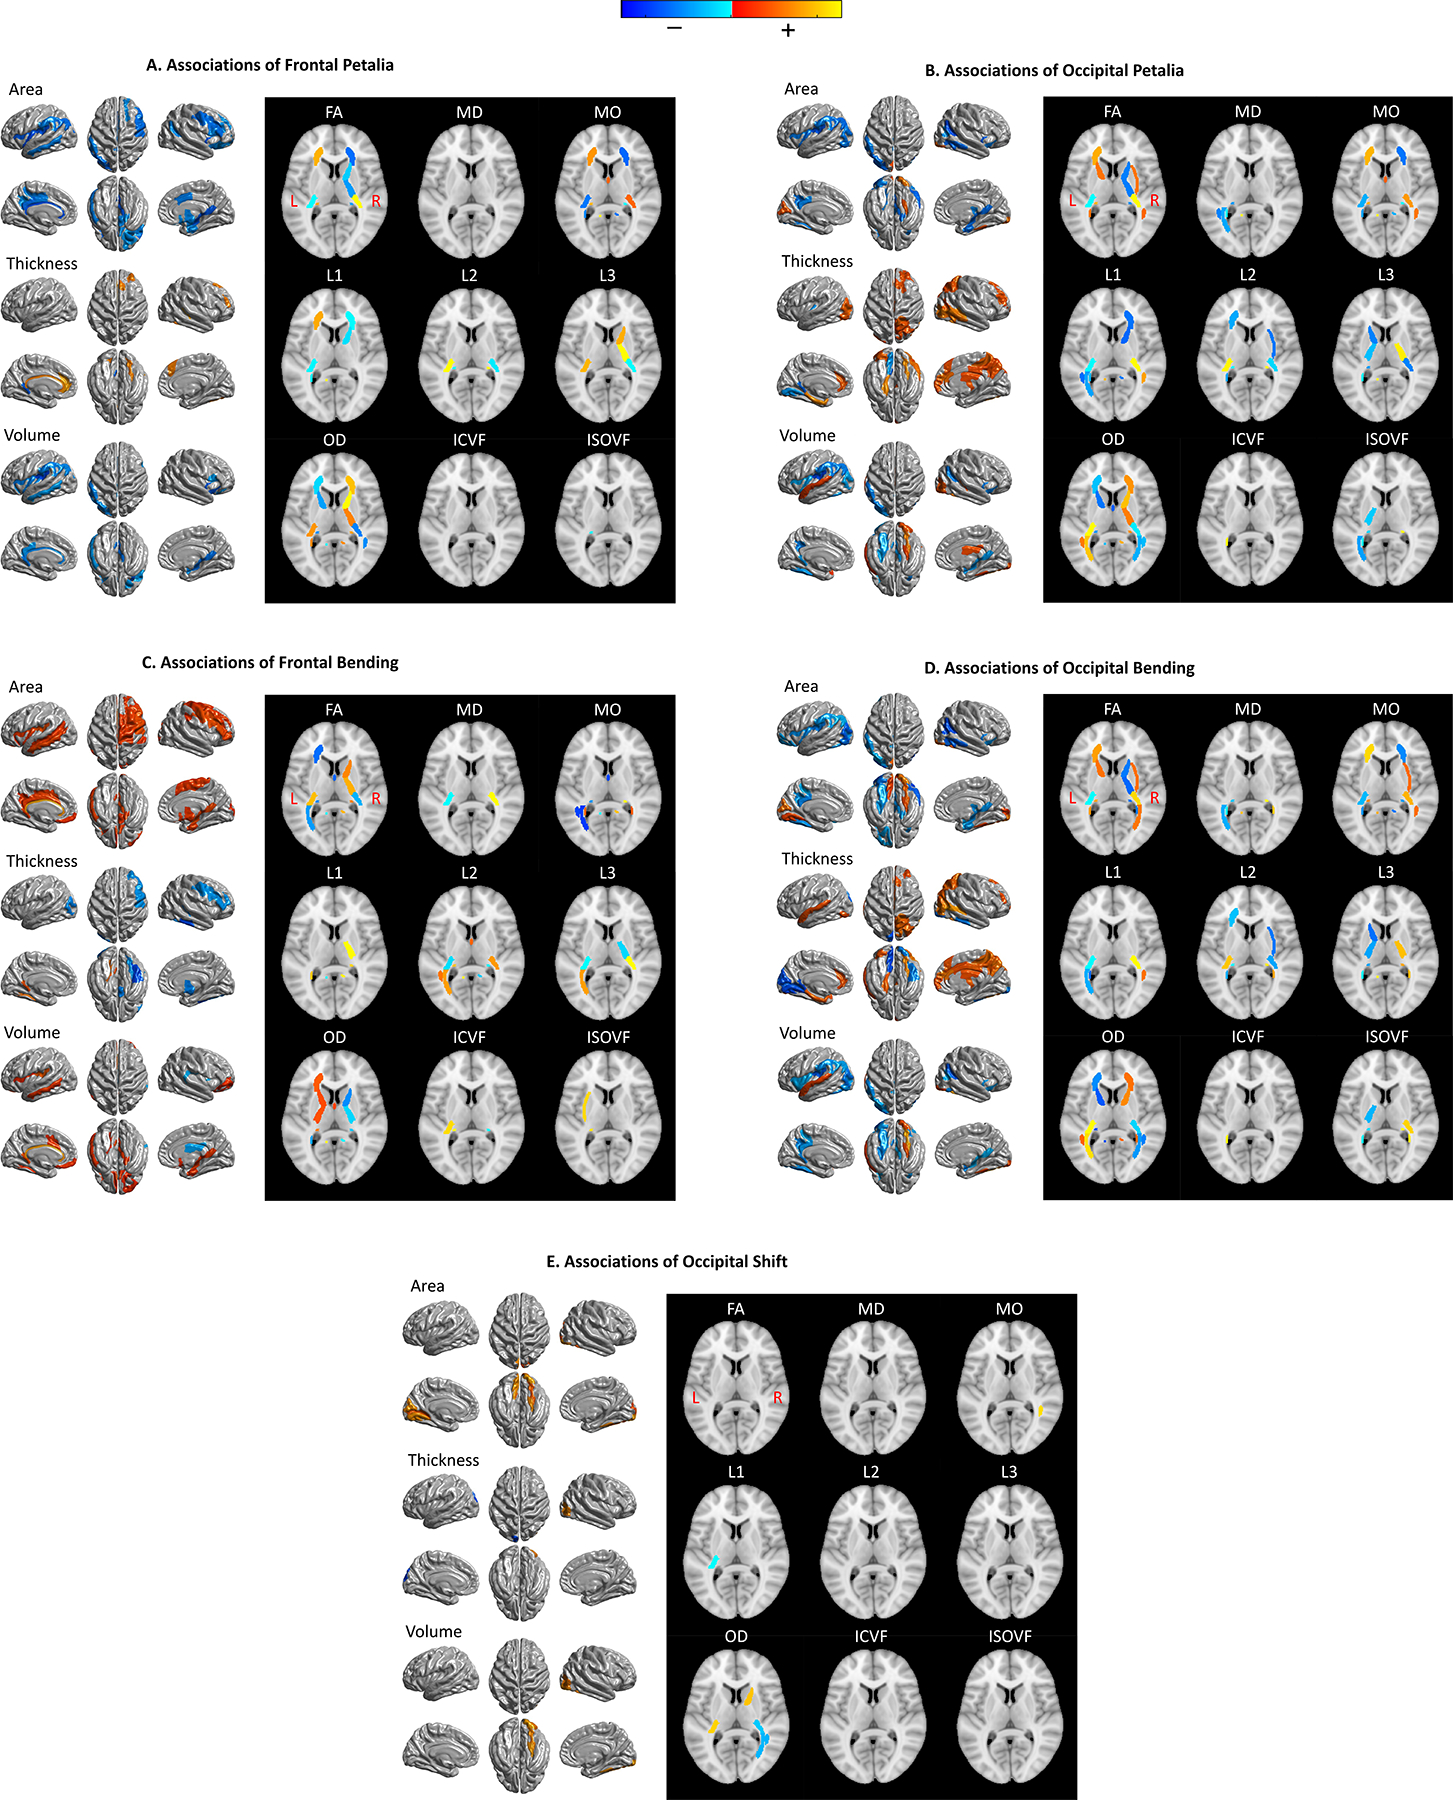
Maps of associations between lobar brain torque profiles and gray matter (GM) and white matter (WM) metrics identified in the phenome scans using the UK Biobank data set. The panels show phenome-wide significant associations (P < 0.05/6334 phenotypes/348 BT measures = 2.27e-8) of frontal petalia (A), occipital petalia (B), frontal bending (C), occipital bending (D) and occipital shift (E). No significant associations between frontal shift and brain imaging metrics were found. The results, therefore, are not shown here. Red-yellow and blue-cyan represent positive and negative associations respectively. On the left of each panel, statistics of associations between BT features and regional measures of cortical surface area, thickness and volume are rendered on the FreeSurfer fsaverage cortical surface template; on the right, association statistics for WM tracks are displayed on a selected axial slice (z = 8) of the MNI152 brain template. FA = fractional anisotropy, MD = mean diffusivity, MO = mode of anisotropy, L1/ L2/L3 = the three eigenvalues of diffusion, OD = orientation dispersion, ICVF = intra-axonal volume fraction, ISOVF = isotropic volume fraction. For complete results of phenome-wide association scans, see Table S8–S13.
In both ABCD and PNC cohorts, BT features were associated with attention-deficit/hyperactivity disorder (ADHD), oppositional defiant disorder (ODD), conduct disorder, social problems, and anxiety/stress/depression (P < 0.05/20 psychopathological measures for ABCD and P < 0.05/112 psychopathological measures for PNC) (Fig. S14–S15 and Table S15–S16). We also found interactions between age and symptoms of ADHD, conduct disorder, manic disorder, obsessive compulsive disorder (OCD) and psychosis on BT features of children and adolescents using the PNC dataset (P < 0.05/112) (Fig. S16 and Table S17). None of these associations survived in the further adjustment of the number of BT features.
Heritability of brain torque
The ABCD sample showed a among all BT profiles (Fig. 9), especially for frontal petalia (, 95% confidence interval (CI) = [10.73%, 43.65%]), occipital bending (, 95% CI = [12.63%, 43.20%]), TDA in the posterior brain (peak , 95% CI = [23.19%, 58.81%]), AsymAP in the frontal and occipital regions (peak , 95% CI = [24.14%, 60.15%]), and AsymLR in the planum temporale (peak , 95% CI = [46.03%, 65.94%]). The HCP cohort showed lower estimates than ABCD (Fig. 9). The most heritable profile was AsymLR in STS (peak , 95% CI = [27.98%, 51.74%]). The patterns of were similar to the pedigree-based results for HCP, however, the estimates were remarkably lower possibly because the GWAS genotyping arrays do not contain all variants in the genome (Table S18 and Fig. S17–S18).
Figure 9.

Pedigree-based heritability () of brain torque profiles estimated using the ABCD and HCP datasets. (A) Bar graphs with error bars illustrate estimates and 95% confidence intervals (CI) for frontal/occipital petalia, bending and shift. (B) Blue lines with error bars represent estimates and 95% CI for sectional width and perimeter asymmetries. Red dots indicate significant heritability (P < 0.05/120). The left hemisphere of the FreeSurfer fsaverage cortical surface template is displayed above the heritability plots as the reference of brain anatomy. (C) Maps of estimates (thresholded at FDR < 0.05/3) and corresponding standard errors (SE) of surface positional asymmetries along the Left-Right (AsymLR), Antero-Posterior (AsymAP) and Dorso-Ventral (AsymDV) axes. .
Genome-wide association analyses
At the genome-wide significance threshold of P < 5e-8, the meta-GWAS analysis identified 133 genetic associations, including 86 independent lead SNPs (LD r2 < 0.2) (Fig. 10, S19–S20 and Table S19). 2 lead SNPs survived in further adjustment for the number of BT profiles: rs187862372 (Z = −6.51, P = 7.74e-11) and rs143950091 (Z = 6.43, P = 1.30e-10). Association lookups showed that 84 out the 86 lead variants were intronic/close to genes that were previously associated with other traits, such as GM/WM/ventricular structures, cognitive abilities, neurological and psychiatric disorders, cardiovascular, autoimmune and inflammatory diseases, educational attainment, alcohol consumption, smoking, sleep, anthropometric characteristics and physical appearance (Table S20–S21). Additionally, 3 lead variants were involved in cytoskeletal organization and its regulation. MAGMA genome-wide, gene analysis on the meta-GWAS results revealed extra 22 genes (P < 0.05/18359 genes) (Table S22–S24). MAGMA gene-set analysis showed 75 biological pathways (P < 0.05/7563 gene sets) (Table S25). Among them were the Gene Ontology (GO) biological process (BP) terms
Figure 10.
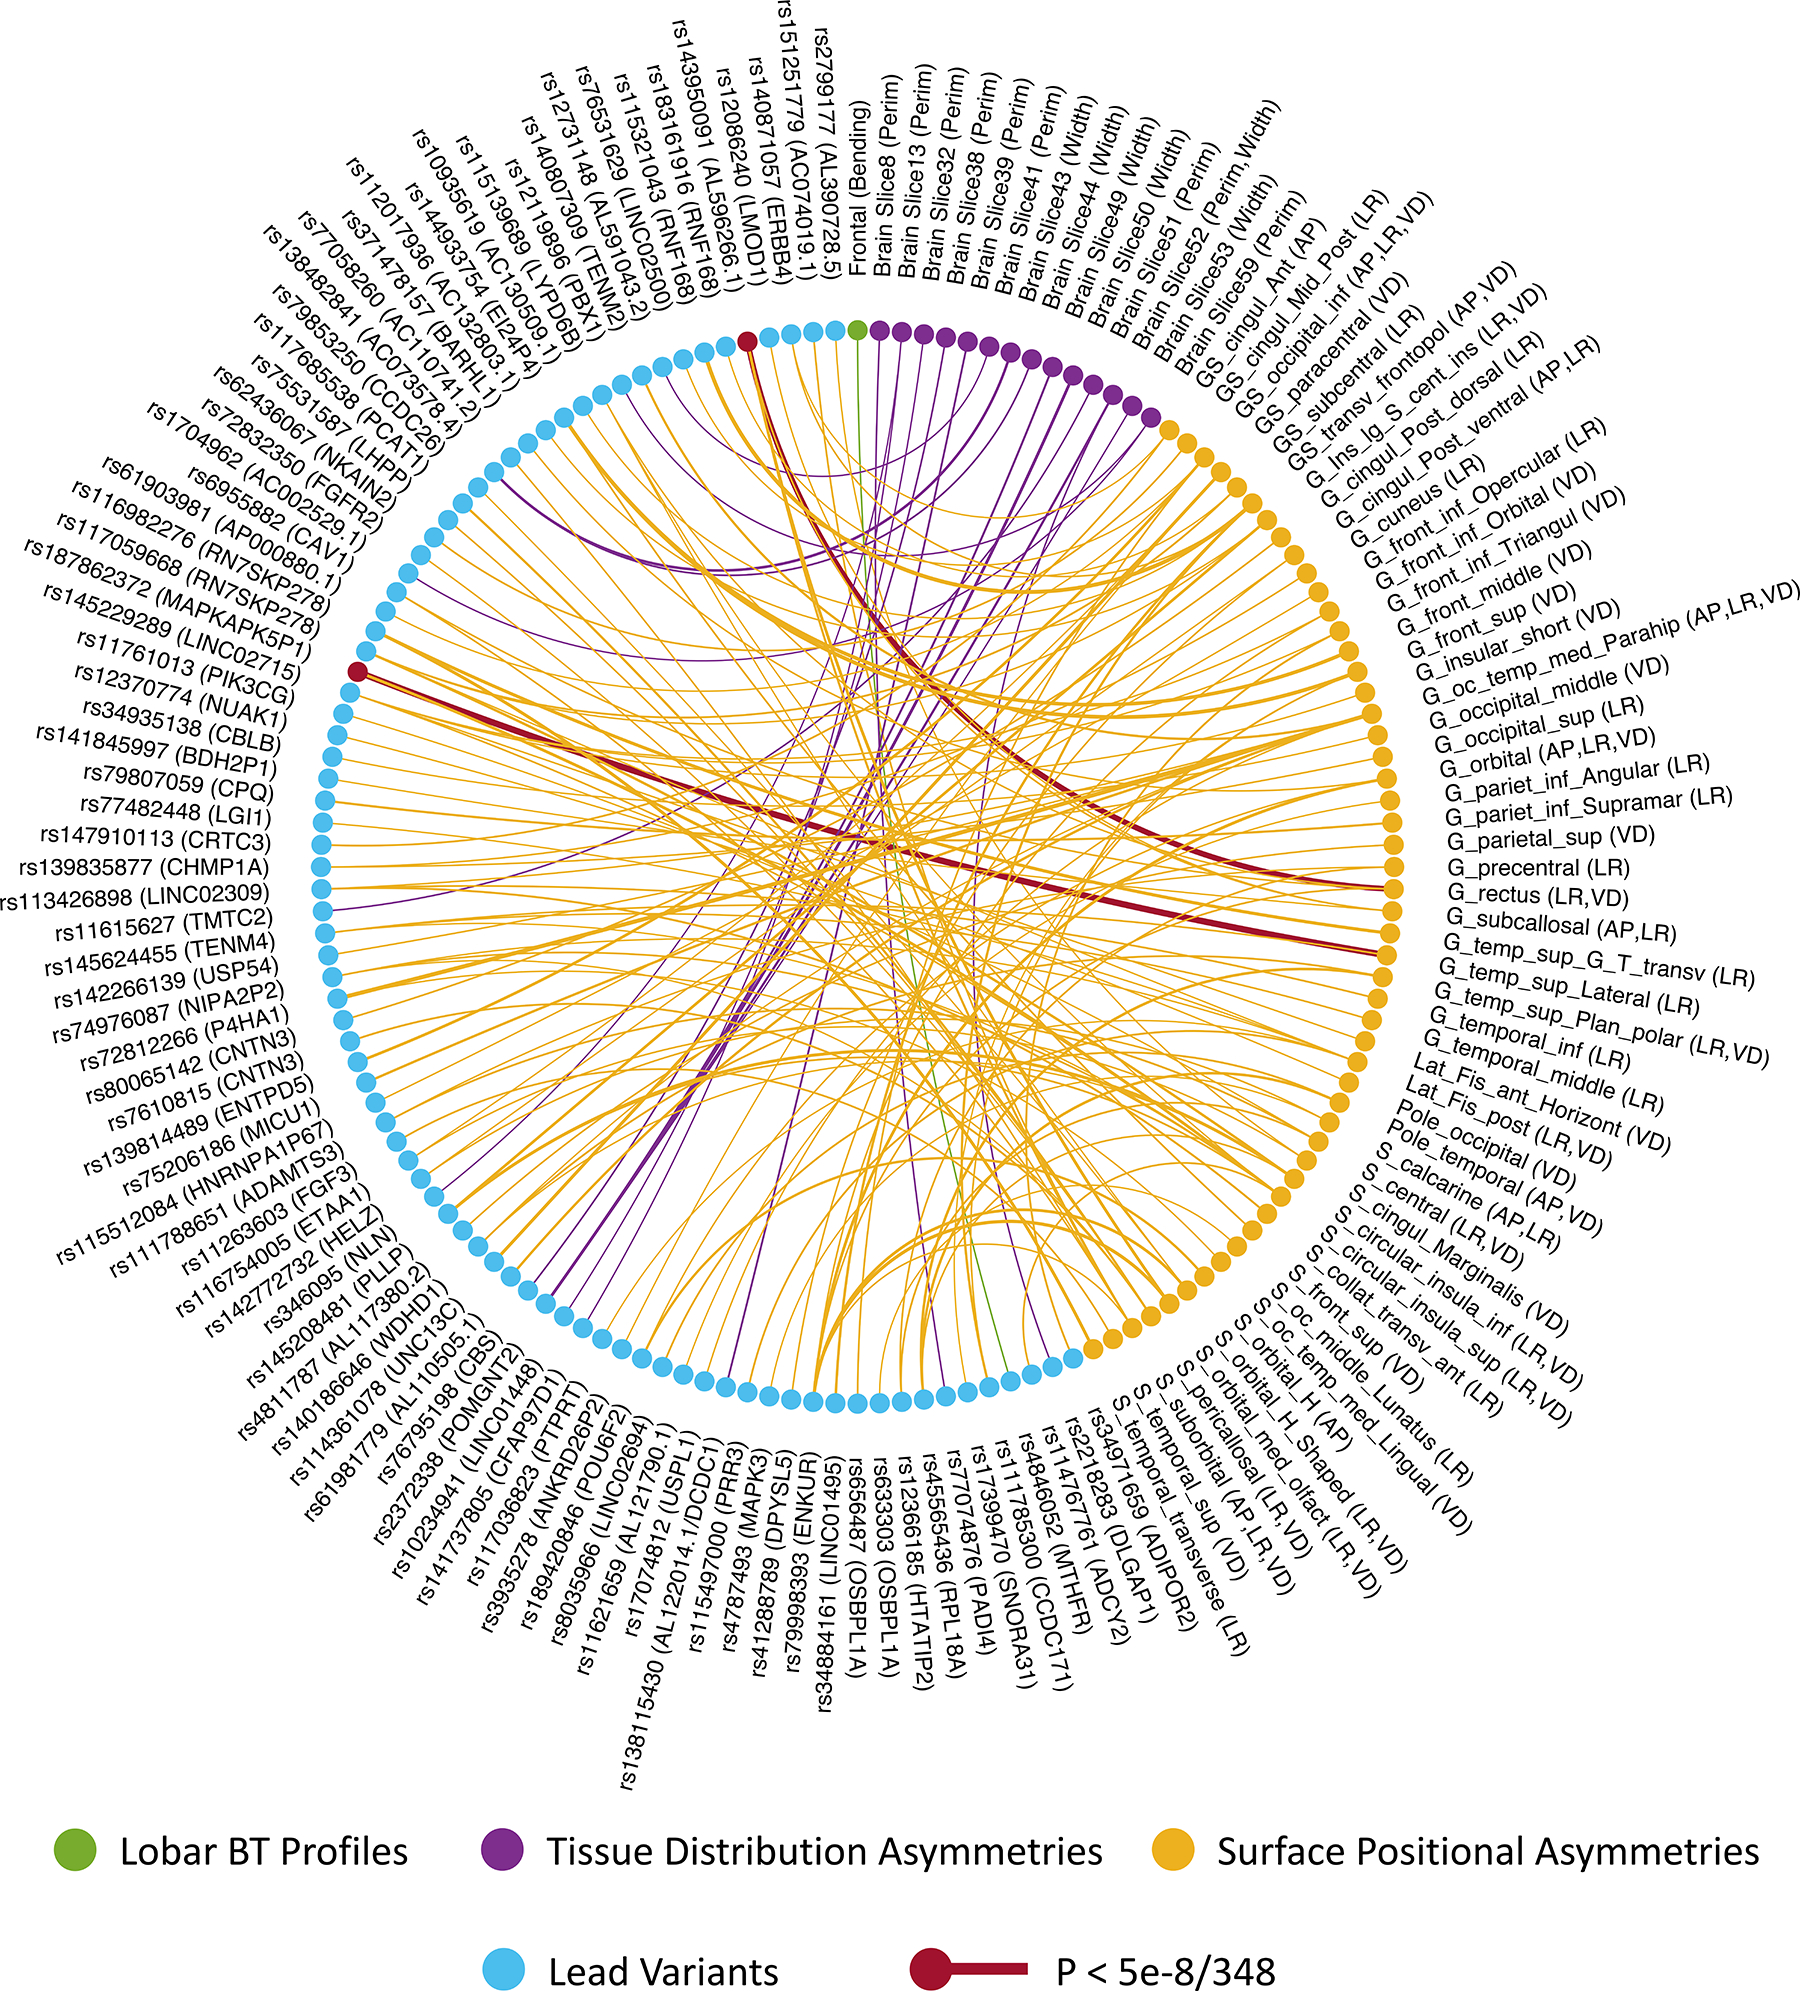
Overview of significant (P < 5e-8) gene-brain torque (BT) associations identified in the meta-GWAS (involving individual GWASs using the ABCD, PING, PNC and UKB datasets). Ribbons in the connectogram plot illustrate associations between the 86 lead variants (cyan nodes) and different BT profiles (green, purple and yellow nodes). Ribbons are colored with the colors of linked BT profiles. Especially, the associations survived in the further adjustment of the number of BT profiles (P < 5e-8/348) are highlighted in red. Ribbon thickness represents the - log(P) value of the corresponding association. The lead variants are annotated with SNP IDs and closest genes. Width = Width Asymmetry, Perim = Perimeter Asymmetry, LR = asymmetry along left-right axis, AP = asymmetry along Antero-Posterior axis, DV = asymmetry along Dorso-Ventral axis. For the abbreviations of brain surface regions, see Table S14.
‘BP:GO_neuronal_action_potential_propagation’, and
‘BP:GO_regulation_of_neuron_projection_development’, ‘BP:GO_neuron_differentiation’,
‘BP:GO_neuron_development’ and
‘BP:GO_cell_morphogenesis_involved_in_neuron_differentiation’, and
‘BP:GO_central_nervous_system_myelin_maintenance’. MAGMA gene-property analysis showed that gene expression levels during gestational stages were positively correlated with the genetic associations with multiple BT profiles (P < 0.05/31 age stages, Fig. S21–S22 and Table S26).
Genetic correlation between BT features and with other traits
We observed genetic correlations between most of BT features (|rg| = 0.37 to 1, P < 0.05) (Fig. S23 and Table S27). BT features also showed genetic correlations with other traits (|rg| = 0.12 to 0.55, P < 0.05), including educational attainment, intelligence, ADHD, Alzheimer’s disease (AD), schizophrenia and bipolar disorder (Fig. S24 and Table S28). Although the rg values of many genetic correlations were high (or moderate), none of them survived in Bonferroni corrections, likely due to the relatively large standard errors (SE = 0.08 to 0.50) caused by the low estimates and/or insufficient sample sizes here (Z-score for genetic correlation is a function of SE and SE is a function of sample sizes and (54)).
Discussion
The current study represents the first, large-scale, systematic study of all brain torque (BT) components. The population-level average BT patterns observed here, including right-frontal and left-occipital petalia, leftward-frontal and rightward-occipital bending, rightward-frontal and leftward-occipital TDA, as well as downward frontal and occipital shift, were consistent with previous studies that applied the same brain shape analysis approaches to small samples (25, 35–37). Our SPA data yielded details about local geometric distortions related to BT, especially reflecting a deeper right superior temporal sulcus and a longer, narrower and less curved left Sylvian fissure. These systematic data delineated how the overall anticlockwise horizontal and vertical brain skews (12) were formed. It has been illustrated that the typical BT patterns were absent in chimpanzees (25, 35–37, 55), suggesting an important role of BT in human brain evolution.
The most important finding of the current study is that the inter-individual variations of BT features were associated with age, sex, handedness as well as a number of phenotypic variables. We illustrated U-shaped, cross-sectional age trajectories peaking in the late young adulthood primarily for frontal, occipital and perisylvian BT features, suggesting a general “first attenuating, then enlarging” dynamic with age. A longstanding 3D lateralized neuro-embryologic growth model proposed by Best (56) predicted that the early-developed, rightward morphological asymmetry in frontal-motor regions may become attenuated by the later left-biased growth of prefrontal tertiary association regions, whereas the leftward posterior asymmetry may converge with the left-biased growth of posterior tertiary association areas, resulting a more striking left-occipital petalia than right-frontal petalia in adults. Consistently, we observed larger average occipital torque than frontal torque. However, the “first attenuating, then enlarging” trajectory was observed in both frontal and occipital regions. Recent brain morphometric data has revealed that the development of tertiary association areas is not always left-biased, e.g., cortical thinning is right-biased in the parietal-temporal-occipital area (7, 8). Thus, we adjust and extend Best’s prediction as that during neurodevelopment, early gross asymmetries may be attenuated by the later growth of tertiary association areas that is biased to the opposite side; then, according to the “first in, last out” theory (57), the attenuated gross asymmetries in adults may be enlarged by the lateralized, earlier aging of certain tertiary association areas (58, 59).
Compared to females, typical BT patterns were more predominant in males in terms of population prevalence and magnitude. This is consistent with the accumulative evidence suggesting that females have a more bilateral brain organization than males (9). Right-handedness was associated with multiple distinct BT patterns compared to mixed- and left-handedness. Sex and handedness were also associated with differences in the variance of distributed BT features, consistently with previous neuroimaging and behavioral data (60–62), The relationship between sex and handedness differences in brain asymmetry and cognitive abilities remains unclear (9, 63). Our phenome scans identified the cognitive function of verbal-numerical reasoning as one of the most prominent phenotypic variables associated with BT. We also found an increased verbal-numerical reasoning score in males compared to females and in right-handers compared to mixed-handers in the same UKB sample (Fig. S25). These inter-associations may reflect potential relations between sex/handedness (right-handed vs mixed-handed) differences in BT and in the ability of verbal-numerical reasoning. Specific mediation or causal analysis is needed to demonstrate the true relationships in the future.
Although the significance levels of age, sex and handedness effects were high due to the large sample size here, the effect sizes of these factors were small (η2 < 0.02 for age, Cohen’s d < 0.25 for sex and handedness), indicating that large proportions of individual variability of BT are explained by other factors. Genetic contributions to the development of BT were observed. The highest heritability was detected for BT features of the temporal language areas, including AsymLR in the planum temporale for ABCD () and in the superior temporal sulcus () for HCP; and Asymwidth in sections corresponding to the planum temporale for UKB (). The heritability estimated from the HCP and UKB adult cohorts were consistent with previous structural asymmetry studies using the same or other adult cohorts (10–13). Of note, these estimates for adults were generally lower than those computed using the ABCD children sample who likely underwent less environmental influence than adults. This age difference in heritability estimates supports the hypothesis of an environmental contribution to the development of structural brain asymmetry (2, 3). Here, our phenome scans associated BT with various environmental factors, such as tobacco smoking, alcohol consumption, education, household, country of birth, home area population density and etc., many of which were associated with global brain skew also (12). Moreover, BT measures were pronouncedly associated with diverse brain MRI metrics in widespread cortical/subcortical regions, WM tracts and lateral ventricles. These associations displayed notable hemispheric asymmetries and anterior-posterior twists. Thus, BT development may involve lateralized dynamics of distributed GM structural changes (5, 6), synaptic pruning (20), axon tension (64), and/or ventricular enlargement (19). In another study (59), we revealed that environmental factors, such as tobacco smoking, alcohol consumption, education, sleep and etc., may independently and jointly modify age trajectories of brain morphologies in spread regions across the middle and late adulthood, and many patterns of these effects appeared to be biased to one hemisphere. Taking together, individual variations of BT, especially among adults, partially may be consequences of lateralized alterations in brain structural development that are induced by those environmental influences.
In line with previous clinical brain asymmetry studies (5, 16, 19, 65, 66), our phenome scans associated BT with adult mental health of bipolar and major depression status and pediatric psychopathological symptoms/behaviors, such as ADHD, ODD, conduct disorder, social problems, and anxiety/stress/depression. Several psychopathological symptoms, e.g., ADHD, conduct disorder, OCD, etc., were also associated with the age-related BT differences during the childhood. Considering associations of BT with widespread GM, WM and ventricular structures, our findings suggest the need to assess and/or control for aspects of BT in other studies of brain structural changes in development and aging and related behavioral/psychiatric symptomatology. Moreover, autism has been associated with altered brain asymmetry (16), and the higher prominence of BT in males than females observed here is homogeneous with prevailing theories regarding autism and brain development (67). However, autism-related data were not available here. It could be a meaningful future work to investigate the relationship between BT and autism spectrum symptomatology.
In (12), no individual genetic loci were associated with global brain skew at the genome-wide significance threshold of P < 5e-8, even with a larger sample (~40,000). The current meta-GWAS identified 86 independent lead SNPs at the same threshold. These genetic associations, except for 2 lead variants, did not survive in the further correction for the number of BT measures, hence there is a chance that they are false positives. However, the further Bonferroni correction might also lead to false negatives in this exploratory study (68, 69), especially given the pronounced intercorrelations between the BT measures. Validating these results using larger samples is required for the future (e.g., expanding the ABCD and UKB datasets with more recent releases that were not accessible here). The same scenario also applies to the gene-set associations that did not remain significant in the further adjustment. With such caution, the lenient results are discussed here, considering the scientific promise they might provide. Broad patterns emerged show that the possible BT-associated genes were often implicated in the development of cortical/subcortical and ventricular morphology and WM microstructures (e.g. NUAK1, LYPD6B, LINC02694) as well as cognitive abilities and intelligence (e.g. ADCY2, AL596266.1, TENM4). These genes also determine susceptibility or resistance to diverse insults: neurodevelopmental (e.g. LINC02715, TENM4), neurodegenerative (e.g. NKAIN2, TENM4), mental (e.g. LINC02694, TENM4), autoimmune (e.g. LINC02694, PCAT1), inflammatory (e.g. CRTC3, CCDC26) and cardiovascular (e.g. MTHFR, AL122014.1), and have been associated with sociodemographic factors (e.g. PTPRT and TENM4 for educational attainment), lifestyle behaviors of alcohol consumption, smoking, sleep and related disorders (e.g. TENM2, AC132803.1), anthropometric characteristics (e.g. ADAMTS3, CCDC171) and physical appearance (e.g. PTPRT, CCDC26). These traits were largely homogeneous with those BT-associated phenotypes identified in the phenome scans. Thus, there may exist a genetic basis for the phenomic associations of BT. Additionally, cytoskeletal-related genes have been associated with regional morphometric asymmetries (13) and global skew (12) of the human brain recently. Cytoskeleton is known to play an important role in embryonic development of organ laterality in other species (70, 71). Consistently, the possible BT-associated genes included 3 key genes in cytoskeletal organization and its regulation: LMOD1, CHMP1A and MAPK3, supporting the hypothesis of a cytoskeleton-mediated mechanism for human brain asymmetry development (12, 13). Moreover, the gene-set enrichment analysis revealed that some genes that may influence BT were involved in biological processes related to neuronal development and central nervous system myelin maintenance. This may be related to the mechanisms of synaptic pruning (20) and axon tension (64) in the development of BT. The gene-property analysis leniently correlated genetic associations of multiple BT features with higher gene expression levels during the gestational stages. This is well in line with the recent findings for structural interhemispheric asymmetries (13), and supports the existence of an early developmental mechanism for brain asymmetry establishment (21, 22). Subsequent studies with preplanned hypotheses should be conducted to confirm these gene-set associations.
Limitations
Several limitations of this study that were not discussed above also need to be considered. First, we implemented mass univariate analyses only. The strong intercorrelations between BT features would allow deriving latent, integrative phenotypes of BT using multivariate techniques, e.g., principal component analysis, which could provide a more holistic view of BT in future studies. Second, although the lifespan age trajectories characterized in the pooled sample were roughly validated in split analyses using subsamples with age overlapping in certain age windows and adjusting for sites/scanners, it is desirable to construct a lifespan sample using datasets with large age overlapping to enable a full adjustment of these factors. Third, caution is needed for the diversity of handedness measurements in our sample (single question vs. questionnaire, see Supplementary Methods), which might introduce bias to the detected handedness effects (72). Forth, consistently with recent studies of global (12) and lobar BT (25), we observed no correlations between BT features and total intracranial volume (|r| < 0.1). However, there might exist unknown nonlinear relationships, which could not be addressed by simply including total intracranial volume as a covariate in the analysis. Further study is needed to determine the true dependence/independence between BT and brain size. Last, the robustness of associations with pediatric psychopathology was ensured by the consistency between the two independent datasets (ABCD and PNC). However, it is likely that the child psychopathological effects were diluted, as ABCD and PNC samples were generally healthy and not enriched for any specific disorders (29, 33, 73). Validating the results using clinical datasets is required for future work.
Conclusions
In conclusion, this large-scale study demonstrated that the anticlockwise BT is predominant in the population and illustrated that BT is associated with a broad range of biological, environmental, behavioral and clinical factors, yielding insights into the biological mechanisms determining the development and individual variability of BT.
Supplementary Material
KEY RESOURCES TABLE
| Resource Type | Specific Reagent or Resource | Source or Reference | Identifiers | Additional Information |
|---|---|---|---|---|
| Add additional rows as needed for each resource type | Include species and sex when applicable. | Include name of manufacturer, company, repository, individual, or research lab. Include PMID or DOI for references; use “this paper” if new. | Include catalog numbers, stock numbers, database IDs or accession numbers, and/or RRIDs. RRIDs are highly encouraged; search for RRIDs at https://scicrunch.org/resources. | Include any additional information or notes if necessary. |
| Antibody | N/A | |||
| Bacterial or Viral Strain | N/A | |||
| Biological Sample | N/A | |||
| Cell Line | N/A | |||
| Chemical Compound or Drug | N/A | |||
| Commercial Assay Or Kit | N/A | |||
| Deposited Data; Public Database | Brain MRI data, phenotypic and/or genotyping data of human subjects, both males and females, from 6 cohorts | Adolescent Brain Cognitive Development (ABCD, PMID: 29051027), Human Connectome Project (HCP, PMID: 22366334), International Consortium for Brain Mapping (ICBM, PMID: 11545704), Pediatric Imaging, Neurocognition, and Genetics (PING, PMID: 25937488), Philadelphia Neurodevelopmental Cohort (PNC, PMID: 25840117) and UK Biobank (UKB, PMID: 25826379). | ||
| Genetic Reagent | N/A | |||
| Organism/Strain | N/A | |||
| Peptide, Recombinant Protein | N/A | |||
| Recombinant DNA | N/A | |||
| Sequence-Based Reagent | N/A | |||
| Software; Algorithm | FSL v5.0 (https://fsl.fmrib.ox.ac.uk/fsl/fslwiki/), FreeSurfer v6.0 (https://surfer.nmr.mgh.harvard.edu), LONI pipeline (http://pipeline.loni.usc.edu), Neuroimaging PheWAS (http://phewas.loni.usc.edu/phewas/), PLINK v2.0 (https://www.cog-genomics.org/plink/2.0/), Michigan Imputation Server (https://imputationserver.sph.umich.edu/), SOLAR-Eclipse v8.4.2 (http://solar-eclipse-genetics.org), GCTA v1.93.2beta (https://cnsgenomics.com/software/gcta/#Overview), LDSC (https://github.com/bulik/ldsc), METAL v2020-05-05 (https://genome.sph.umich.edu/wiki/METAL), MAGMA v1.07 (https://ctg.cncr.nl/software/magma) and PHESANT (https://github.com/MRCIEU/PHESANT). | |||
| Transfected Construct | N/A | |||
| Other | N/A |
Acknowledgments
This work was supported by the Big Data for Discovery Science (BDDS) (NIH Grant No. U54EB020406), the Laboratory of Neuro Imaging Resource (LONIR) (NIH Grant No. P41EB015922), and the Genetic Influences on Human Neuroanatomical Shapes (NIH Grant No. R01MH094343).
Data used in this work was obtained from the ABCD, HCP, ICBM, PING, PNC and UKB. ABCD is supported by the National Institutes of Health and additional federal partners under award numbers U01DA041048, U01DA050989, U01DA051016, U01DA041022, U01DA051018, U01DA051037, U01DA050987, U01DA041174, U01DA041106, U01DA041117, U01DA041028, U01DA041134, U01DA050988, U01DA051039, U01DA041156, U01DA041025, U01DA041120, U01DA051038, U01DA041148, U01DA041093, U01DA041089, U24DA041123, and U24DA041147. A full list of supporters is available at https://abcdstudy.org/federal-partners.html. A listing of participating sites and a complete listing of the study investigators can be found at https://abcdstudy.org/consortium_members/. HCP (WU-Minn Consortium, Principal Investigators: David Van Essen and Kamil Ugurbil; 1U54MH091657) is funded by the 16 NIH Institutes and Centers that support the NIH Blueprint for Neuroscience Research; and by the McDonnell Center for Systems Neuroscience at Washington University. ICBM (Principal Investigator: John Mazziotta, MD, PhD) was supported by the National Institute of Biomedical Imaging and BioEngineering. ICBM data are disseminated by the Laboratory of Neuro Imaging at the University of Southern California. ICBM is the result of efforts of co-investigators from UCLA, Montreal Neurologic Institute, University of Texas at San Antonio, and the Institute of Medicine, Juelich/Heinrich Heine University – Germany. PING was supported by the National Institute on Drug Abuse and the National Institute of Child Health and Human Development (RC2DA029475, R01HD061414). PNC was supported by MH089983 and MH089924. This research was conducted, using the UK Biobank Resource under approved project 25641 (principal applicant: L.Z.). The investigators within ABCD, HCP, ICBM, PING, PNC and UKB provided data but did not participate in analysis or writing of this article. We thank Lily Xiang and Neil Roberts for assistance with building the workflow for computing complex BT measures; Xiang-Zhen Kong and Clyde Francks for sharing the manuscript on brain skew study. We also declare that this paper has been posted on bioRxiv as a preprint (https://www.biorxiv.org/content/10.1101/2021.03.09.434625v2).
Footnotes
Publisher's Disclaimer: This is a PDF file of an unedited manuscript that has been accepted for publication. As a service to our customers we are providing this early version of the manuscript. The manuscript will undergo copyediting, typesetting, and review of the resulting proof before it is published in its final form. Please note that during the production process errors may be discovered which could affect the content, and all legal disclaimers that apply to the journal pertain.
Disclosures
All authors report no biomedical financial interests or potential conflicts of interest.
References
- 1.Wada JA (2009): Is functional hemispheric lateralization guided by structural cerebral asymmetry? Can J Neurol Sci. 36 Suppl 2:S25–31. [PubMed] [Google Scholar]
- 2.Duboc V, Dufourcq P, Blader P, Roussigné M (2015): Asymmetry of the Brain: Development and Implications. Annu Rev Genet. 49:647–672. [DOI] [PubMed] [Google Scholar]
- 3.Toga AW, Thompson PM (2003): Mapping brain asymmetry. Nat Rev Neurosci. 4:37–48. [DOI] [PubMed] [Google Scholar]
- 4.Ocklenburg S, Güntürkün O (2017): The Lateralized Brain : The Neuroscience and Evolution of Hemispheric Asymmetries. Saint Louis: Elsevier Science & Technology,, pp 1 online resource (383 pages). [Google Scholar]
- 5.Shaw P, Lalonde F, Lepage C, Rabin C, Eckstrand K, Sharp W, et al. (2009): Development of cortical asymmetry in typically developing children and its disruption in attention-deficit/hyperactivity disorder. Arch Gen Psychiatry. 66:888–896. [DOI] [PMC free article] [PubMed] [Google Scholar]
- 6.Li G, Nie J, Wang L, Shi F, Lyall AE, Lin W, et al. (2014): Mapping longitudinal hemispheric structural asymmetries of the human cerebral cortex from birth to 2 years of age. Cereb Cortex. 24:1289–1300. [DOI] [PMC free article] [PubMed] [Google Scholar]
- 7.Plessen KJ, Hugdahl K, Bansal R, Hao X, Peterson BS (2014): Sex, age, and cognitive correlates of asymmetries in thickness of the cortical mantle across the life span. J Neurosci. 34:6294–6302. [DOI] [PMC free article] [PubMed] [Google Scholar]
- 8.Zhou D, Lebel C, Evans A, Beaulieu C (2013): Cortical thickness asymmetry from childhood to older adulthood. Neuroimage. 83:66–74. [DOI] [PubMed] [Google Scholar]
- 9.Hirnstein M, Hugdahl K, Hausmann M (2019): Cognitive sex differences and hemispheric asymmetry: A critical review of 40 years of research. Laterality. 24:204–252. [DOI] [PubMed] [Google Scholar]
- 10.Kong XZ, Mathias SR, Guadalupe T, Glahn DC, Franke B, Crivello F, et al. (2018): Mapping cortical brain asymmetry in 17,141 healthy individuals worldwide via the ENIGMA Consortium. Proc Natl Acad Sci USA. 115:E5154–E5163. [DOI] [PMC free article] [PubMed] [Google Scholar]
- 11.Guadalupe T, Mathias SR, vanErp TGM, Whelan CD, Zwiers MP, Abe Y, et al. (2017): Human subcortical brain asymmetries in 15,847 people worldwide reveal effects of age and sex. Brain Imaging Behav. 11:1497–1514. [DOI] [PMC free article] [PubMed] [Google Scholar]
- 12.Kong X-Z, Postema M, Schijven D, Carrión-Castillo A, Pepe A, Crivello F, et al. (2021): Large-scale Phenomic and Genomic Analysis of Brain Asymmetrical Skew. Cerebral Cortex. 31:4151–4168. [DOI] [PMC free article] [PubMed] [Google Scholar]
- 13.Sha Z, Schijven D, Carrion-Castillo A, Joliot M, Mazoyer B, Fisher SE, et al. (2021): The genetic architecture of structural left-right asymmetry of the human brain. Nature Human Behaviour. 5:1226–1239. [DOI] [PMC free article] [PubMed] [Google Scholar]
- 14.Francks C (2015): Exploring human brain lateralization with molecular genetics and genomics. Ann N Y Acad Sci. 1359:1–13. [DOI] [PubMed] [Google Scholar]
- 15.Zhao L, Ruotsalainen U, Hirvonen J, Hietala J, Tohka J (2010): Automatic cerebral and cerebellar hemisphere segmentation in 3D MRI: adaptive disconnection algorithm. Med Image Anal. 14:360–372. [DOI] [PubMed] [Google Scholar]
- 16.Postema MC, van Rooij D, Anagnostou E, Arango C, Auzias G, Behrmann M, et al. (2019): Altered structural brain asymmetry in autism spectrum disorder in a study of 54 datasets. Nat Commun. 10:4958. [DOI] [PMC free article] [PubMed] [Google Scholar]
- 17.Altarelli I, Leroy F, Monzalvo K, Fluss J, Billard C, Dehaene-Lambertz G, et al. (2014): Planum temporale asymmetry in developmental dyslexia: Revisiting an old question. Hum Brain Mapp. 35:5717–5735. [DOI] [PMC free article] [PubMed] [Google Scholar]
- 18.Wachinger C, Nho K, Saykin AJ, Reuter M, Rieckmann A, Initiative AsDN (2018): A Longitudinal Imaging Genetics Study of Neuroanatomical Asymmetry in Alzheimer’s Disease. Biol Psychiatry. 84:522–530. [DOI] [PMC free article] [PubMed] [Google Scholar]
- 19.Maller JJ, Thomson RH, Rosenfeld JV, Anderson R, Daskalakis ZJ, Fitzgerald PB (2014): Occipital bending in depression. Brain. 137:1830–1837. [DOI] [PubMed] [Google Scholar]
- 20.Fullard K, Maller JJ, Welton T, Lyon M, Gordon E, Koslow SH, et al. (2019): Is occipital bending a structural biomarker of risk for depression and sensitivity to treatment? J Clin Neurosci. 63:55–61. [DOI] [PubMed] [Google Scholar]
- 21.Kasprian G, Langs G, Brugger PC, Bittner M, Weber M, Arantes M, et al. (2011): The prenatal origin of hemispheric asymmetry: an in utero neuroimaging study. Cereb Cortex. 21:1076–1083. [DOI] [PubMed] [Google Scholar]
- 22.Ocklenburg S, Schmitz J, Moinfar Z, Moser D, Klose R, Lor S, et al. (2017): Epigenetic regulation of lateralized fetal spinal gene expression underlies hemispheric asymmetries. Elife. 6. [DOI] [PMC free article] [PubMed] [Google Scholar]
- 23.de Kovel CGF, Aftanas L, Aleman A, Alexander-Bloch AF, Baune BT, Brack I, et al. (2019): No Alterations of Brain Structural Asymmetry in Major Depressive Disorder: An ENIGMA Consortium Analysis. Am J Psychiatry. 176:1039–1049. [DOI] [PubMed] [Google Scholar]
- 24.LeMay M (1976): Morphological cerebral asymmetries of modern man, fossil man, and nonhuman primate. Ann N Y Acad Sci. 280:349–366. [DOI] [PubMed] [Google Scholar]
- 25.Xiang L, Crow T, Roberts N (2019): Cerebral torque is human specific and unrelated to brain size. Brain Struct Funct. 224:1141–1150. [DOI] [PMC free article] [PubMed] [Google Scholar]
- 26.Smith SM, Douaud G, Chen W, Hanayik T, Alfaro-Almagro F, Sharp K, et al. (2021): An expanded set of genome-wide association studies of brain imaging phenotypes in UK Biobank. Nat Neurosci. 24:737–745. [DOI] [PMC free article] [PubMed] [Google Scholar]
- 27.Elliott LT, Sharp K, Alfaro-Almagro F, Shi S, Miller KL, Douaud G, et al. (2018): Genome-wide association studies of brain imaging phenotypes in UK Biobank. Nature. 562:210–216. [DOI] [PMC free article] [PubMed] [Google Scholar]
- 28.Miller KL, Alfaro-Almagro F, Bangerter NK, Thomas DL, Yacoub E, Xu J, et al. (2016): Multimodal population brain imaging in the UK Biobank prospective epidemiological study. Nat Neurosci. 19:1523–1536. [DOI] [PMC free article] [PubMed] [Google Scholar]
- 29.Volkow ND, Koob GF, Croyle RT, Bianchi DW, Gordon JA, Koroshetz WJ, et al. (2018): The conception of the ABCD study: From substance use to a broad NIH collaboration. Dev Cogn Neurosci. 32:4–7. [DOI] [PMC free article] [PubMed] [Google Scholar]
- 30.Van Essen DC, Ugurbil K, Auerbach E, Barch D, Behrens TE, Bucholz R, et al. (2012): The Human Connectome Project: a data acquisition perspective. Neuroimage. 62:2222–2231. [DOI] [PMC free article] [PubMed] [Google Scholar]
- 31.Mazziotta J, Toga A, Evans A, Fox P, Lancaster J, Zilles K, et al. (2001): A probabilistic atlas and reference system for the human brain: International Consortium for Brain Mapping (ICBM). Philos Trans R Soc Lond B Biol Sci. 356:1293–1322. [DOI] [PMC free article] [PubMed] [Google Scholar]
- 32.Jernigan TL, Brown TT, Hagler DJ Jr., Akshoomoff N, Bartsch H, Newman E, et al. (2016): The Pediatric Imaging, Neurocognition, and Genetics (PING) Data Repository. Neuroimage. 124:1149–1154. [DOI] [PMC free article] [PubMed] [Google Scholar]
- 33.Satterthwaite TD, Connolly JJ, Ruparel K, Calkins ME, Jackson C, Elliott MA, et al. (2016): The Philadelphia Neurodevelopmental Cohort: A publicly available resource for the study of normal and abnormal brain development in youth. Neuroimage. 124:1115–1119. [DOI] [PMC free article] [PubMed] [Google Scholar]
- 34.Sudlow C, Gallacher J, Allen N, Beral V, Burton P, Danesh J, et al. (2015): UK biobank: an open access resource for identifying the causes of a wide range of complex diseases of middle and old age. PLoS Med. 12:e1001779. [DOI] [PMC free article] [PubMed] [Google Scholar]
- 35.Xiang L, Crow T, Roberts N (2019): Automatic analysis of cross-sectional cerebral asymmetry on 3D in vivo MRI scans of human and chimpanzee. J Neurosci Res. 97:673–682. [DOI] [PubMed] [Google Scholar]
- 36.Hou L, Xiang L, Crow TJ, Leroy F, Rivière D, Mangin JF, et al. (2019): Measurement of Sylvian Fissure asymmetry and occipital bending in humans and Pan troglodytes. Neuroimage. 184:855–870. [DOI] [PubMed] [Google Scholar]
- 37.Li X, Crow TJ, Hopkins WD, Gong Q, Roberts N (2018): Human torque is not present in chimpanzee brain. Neuroimage. 165:285–293. [DOI] [PubMed] [Google Scholar]
- 38.Destrieux C, Fischl B, Dale A, Halgren E (2010): Automatic parcellation of human cortical gyri and sulci using standard anatomical nomenclature. Neuroimage. 53:1–15. [DOI] [PMC free article] [PubMed] [Google Scholar]
- 39.Kochunov P, Jahanshad N, Marcus D, Winkler A, Sprooten E, Nichols TE, et al. (2015): Heritability of fractional anisotropy in human white matter: a comparison of Human Connectome Project and ENIGMA-DTI data. Neuroimage. 111:300–311. [DOI] [PMC free article] [PubMed] [Google Scholar]
- 40.Finucane HK, Bulik-Sullivan B, Gusev A, Trynka G, Reshef Y, Loh PR, et al. (2015): Partitioning heritability by functional annotation using genome-wide association summary statistics. Nat Genet. 47:1228–1235. [DOI] [PMC free article] [PubMed] [Google Scholar]
- 41.Yang J, Lee SH, Goddard ME, Visscher PM (2011): GCTA: a tool for genome-wide complex trait analysis. Am J Hum Genet. 88:76–82. [DOI] [PMC free article] [PubMed] [Google Scholar]
- 42.Willer CJ, Li Y, Abecasis GR (2010): METAL: fast and efficient meta-analysis of genomewide association scans. Bioinformatics. 26:2190–2191. [DOI] [PMC free article] [PubMed] [Google Scholar]
- 43.Buniello A, MacArthur JAL, Cerezo M, Harris LW, Hayhurst J, Malangone C, et al. (2019): The NHGRI-EBI GWAS Catalog of published genome-wide association studies, targeted arrays and summary statistics 2019. Nucleic Acids Res. 47:D1005–D1012. [DOI] [PMC free article] [PubMed] [Google Scholar]
- 44.de Leeuw CA, Mooij JM, Heskes T, Posthuma D (2015): MAGMA: generalized gene-set analysis of GWAS data. PLoS Comput Biol. 11:e1004219. [DOI] [PMC free article] [PubMed] [Google Scholar]
- 45.Lee JJ, Wedow R, Okbay A, Kong E, Maghzian O, Zacher M, et al. (2018): Gene discovery and polygenic prediction from a genome-wide association study of educational attainment in 1.1 million individuals. Nat Genet. 50:1112–1121. [DOI] [PMC free article] [PubMed] [Google Scholar]
- 46.Savage JE, Jansen PR, Stringer S, Watanabe K, Bryois J, de Leeuw CA, et al. (2018): Genome-wide association meta-analysis in 269,867 individuals identifies new genetic and functional links to intelligence. Nat Genet. 50:912–919. [DOI] [PMC free article] [PubMed] [Google Scholar]
- 47.Demontis D, Walters RK, Martin J, Mattheisen M, Als TD, Agerbo E, et al. (2019): Discovery of the first genome-wide significant risk loci for attention deficit/hyperactivity disorder. Nat Genet. 51:63–75. [DOI] [PMC free article] [PubMed] [Google Scholar]
- 48.Grove J, Ripke S, Als TD, Mattheisen M, Walters RK, Won H, et al. (2019): Identification of common genetic risk variants for autism spectrum disorder. Nat Genet. 51:431–444. [DOI] [PMC free article] [PubMed] [Google Scholar]
- 49.Ripke S, Walters J, O’Donovan M (2020): Mapping genomic loci prioritises genes and implicates synaptic biology in schizophrenia. medRxiv. [Google Scholar]
- 50.Stahl EA, Breen G, Forstner AJ, McQuillin A, Ripke S, Trubetskoy V, et al. (2019): Genome-wide association study identifies 30 loci associated with bipolar disorder. Nat Genet. 51:793–803. [DOI] [PMC free article] [PubMed] [Google Scholar]
- 51.Wray NR, Ripke S, Mattheisen M, Trzaskowski M, Byrne EM, Abdellaoui A, et al. (2018): Genome-wide association analyses identify 44 risk variants and refine the genetic architecture of major depression. Nat Genet. 50:668–681. [DOI] [PMC free article] [PubMed] [Google Scholar]
- 52.Nagel M, Jansen PR, Stringer S, Watanabe K, de Leeuw CA, Bryois J, et al. (2018): Meta-analysis of genome-wide association studies for neuroticism in 449,484 individuals identifies novel genetic loci and pathways. Nat Genet. 50:920–927. [DOI] [PubMed] [Google Scholar]
- 53.Jansen IE, Savage JE, Watanabe K, Bryois J, Williams DM, Steinberg S, et al. (2019): Genome-wide meta-analysis identifies new loci and functional pathways influencing Alzheimer’s disease risk. Nat Genet. 51:404–413. [DOI] [PMC free article] [PubMed] [Google Scholar]
- 54.Bulik-Sullivan B, Finucane HK, Anttila V, Gusev A, Day FR, Loh PR, et al. (2015): An atlas of genetic correlations across human diseases and traits. Nat Genet. 47:1236–1241. [DOI] [PMC free article] [PubMed] [Google Scholar]
- 55.Leroy F, Cai Q, Bogart SL, Dubois J, Coulon O, Monzalvo K, et al. (2015): New human-specific brain landmark: the depth asymmetry of superior temporal sulcus. Proc Natl Acad Sci USA. 112:1208–1213. [DOI] [PMC free article] [PubMed] [Google Scholar]
- 56.Best CT (1988): The emergence of cerebral asymmetries in early human development: a literature review and a neuroembryological model. In: Molfese DL, Segalowitz SJ, editors. Brain Lateralization in children: Developmental implications. New York: Guilford Press, pp 5–34. [Google Scholar]
- 57.Douaud G, Groves AR, Tamnes CK, Westlye LT, Duff EP, Engvig A, et al. (2014): A common brain network links development, aging, and vulnerability to disease. Proc Natl Acad Sci USA. 111:17648–17653. [DOI] [PMC free article] [PubMed] [Google Scholar]
- 58.Zhao L, Boucher M, Rosa-Neto P, Evans AC (2013): Impact of scale space search on age- and gender-related changes in MRI-based cortical morphometry. Hum Brain Mapp. 34:2113–2128. [DOI] [PMC free article] [PubMed] [Google Scholar]
- 59.Zhao L, Matloff W, Ning K, Kim H, Dinov ID, Toga AW (2019): Age-Related Differences in Brain Morphology and the Modifiers in Middle-Aged and Older Adults. Cereb Cortex. 29:4169–4193. [DOI] [PMC free article] [PubMed] [Google Scholar]
- 60.Ritchie SJ, Cox SR, Shen X, Lombardo MV, Reus LM, Alloza C, et al. (2018): Sex Differences in the Adult Human Brain: Evidence from 5216 UK Biobank Participants. Cereb Cortex. 28:2959–2975. [DOI] [PMC free article] [PubMed] [Google Scholar]
- 61.Wierenga LM, Doucet GE, Dima D, Agartz I, Aghajani M, Akudjedu TN, et al. (2020): Greater male than female variability in regional brain structure across the lifespan. Hum Brain Mapp. 10.1002/hbm.25204. [DOI] [PMC free article] [PubMed] [Google Scholar]
- 62.Gordon NM, Rudroff T, Enoka JA, Enoka RM (2012): Handedness but not dominance influences variability in endurance time for sustained, submaximal contractions. Journal of Neurophysiology. 108:1501–1510. [DOI] [PubMed] [Google Scholar]
- 63.Papadatou-Pastou M (2018): Handedness and cognitive ability: Using meta-analysis to make sense of the data. Prog Brain Res. 238:179–206. [DOI] [PubMed] [Google Scholar]
- 64.Van Essen DC (1997): A tension-based theory of morphogenesis and compact wiring in the central nervous system. Nature. 385:313–318. [DOI] [PubMed] [Google Scholar]
- 65.Maller JJ, Anderson R, Thomson RH, Rosenfeld JV, Daskalakis ZJ, Fitzgerald PB (2015): Occipital bending (Yakovlevian torque) in bipolar depression. Psychiatry Res. 231:8–14. [DOI] [PubMed] [Google Scholar]
- 66.Kong XZ, Postema MC, Guadalupe T, de Kovel C, Boedhoe PSW, Hoogman M, et al. (2020): Mapping brain asymmetry in health and disease through the ENIGMA consortium. Hum Brain Mapp. [DOI] [PMC free article] [PubMed] [Google Scholar]
- 67.Loomes R, Hull L, Mandy WPL (2017): What Is the Male-to-Female Ratio in Autism Spectrum Disorder? A Systematic Review and Meta-Analysis. J Am Acad Child Adolesc Psychiatry. 56:466–474. [DOI] [PubMed] [Google Scholar]
- 68.Perneger TV (1998): What’s wrong with Bonferroni adjustments. BMJ. 316:1236–1238. [DOI] [PMC free article] [PubMed] [Google Scholar]
- 69.Feise RJ (2002): Do multiple outcome measures require p-value adjustment? BMC Med Res Methodol. 2:8. [DOI] [PMC free article] [PubMed] [Google Scholar]
- 70.Ray P, Chin AS, Worley KE, Fan J, Kaur G, Wu M, et al. (2018): Intrinsic cellular chirality regulates left-right symmetry breaking during cardiac looping. Proc Natl Acad Sci USA. 115:E11568–E11577. [DOI] [PMC free article] [PubMed] [Google Scholar]
- 71.Tee YH, Shemesh T, Thiagarajan V, Hariadi RF, Anderson KL, Page C, et al. (2015): Cellular chirality arising from the self-organization of the actin cytoskeleton. Nat Cell Biol. 17:445–457. [DOI] [PubMed] [Google Scholar]
- 72.Cuellar-Partida G, Tung JY, Eriksson N, Albrecht E, Aliev F, Andreassen OA, et al. (2021): Genome-wide association study identifies 48 common genetic variants associated with handedness. Nat Hum Behav. 5:59–70. [DOI] [PMC free article] [PubMed] [Google Scholar]
- 73.Karcher NR, Barch DM (2021): The ABCD study: understanding the development of risk for mental and physical health outcomes. Neuropsychopharmacology. 46:131–142. [DOI] [PMC free article] [PubMed] [Google Scholar]
Associated Data
This section collects any data citations, data availability statements, or supplementary materials included in this article.


