

Abstract
Background:
Stroke is a major cause of serious disability in the United States. Previous studies found multiple associations of serum metabolites with acute ischemic stroke (AIS) compared to controls, but few of them evaluated metabolome in a longitudinal fashion. Therefore, we compared the metabolome of the acute and chronic stages of ischemic stroke.
Methods:
We evaluated 1295 serum metabolites from the cohort of 60 stroke patients at acute and chronic stages by performing global metabolomics using ultra-high-performance liquid chromatography/mass spectrometry (LC-MS) and gas chromatography/mass spectrometry (GC-MS). We used Orthogonal Partial Least Square-Discrimination Analysis (OPLS-DA) to inspect group disparity and a mixed regression model to compare metabolites in the acute and chronic stages with Two-Stage Benjamini & Hochberg (TSBH) and Bonferroni correction for multiple testing.
Results:
The OPLS-DA revealed significant separation of acute and chronic stage metabolites. Mixed regression identified 228 metabolites with TSBH, and 29 metabolites with Bonferroni correction different in acute and chronic stages. At the acute stage, there was a consistent increase of the metabolites of mono/diacylglycerols, sphingolipids, medium/long-chain fatty acids, and amino acids glycine, valine, and tyrosine. At the same time, there was a consistent decrease of the metabolites of acyl-choline related fatty acids, phospholipids, and amino acids alanine, aspartate, and tyramine. Additionally, we identified eight novel metabolites significantly altered at the acute stage of stroke.
Conclusion:
Our pilot study demonstrated significant alterations in metabolomic patterns between the acute and chronic stages of stroke, validating some case-control findings. Future investigation in a larger independent cohort is warranted to identify early biomarkers of acute ischemic stroke.
Keywords: Metabolomics, acute and chronic ischemic stroke, sphingolipids, fatty acids, monoacylglycerols, biomarkers
Introduction
Acute ischemic stroke (AIS) is a leading cause of serious disability in the United States.[1] Despite recent advances in diagnostic and imaging technologies, many patients continue to suffer from the drastic consequences of this disease due to limitations in timely diagnosis and management. Currently, the diagnostic workup of AIS is restricted to vascular imaging and echocardiography, which allow detection of a cause of AIS in only 75% of cases; thus, the etiology of the rest 25% of the cryptogenic strokes remains unknown).[1] Therefore, newer approaches for the detection and prevention of AIS are warranted.
Metabolomics has the ability to identify large numbers of low molecular weight metabolites in bodily fluids, which may lead to the discovery of novel disease mechanisms, pharmacologic treatments, and biomarkers. Previous metabolome studies of AIS revealed multiple metabolite associations and classified them according to pathophysiological mechanisms: excitotoxicity with an increase in glutamate, oxidative stress with production of free radicals, and perturbed concentrations of uric acid, matrix metalloproteinase-9, branch-chained amino acids, sphingolipids, homocysteine, and stroke-mediated inflammation, affecting fatty acid and phospholipid metabolism.[2] Even though these discoveries align with stroke pathophysiology, many of those markers also change in other medical conditions, limiting their utility. Occlusion of the brain vessel during stroke leads to ischemia, interruption of the blood-brain barrier (BBB), and release of metabolites into the serum.[3] Evaluation of such markers during this severe (acute) stage of stroke is important for spotting immediate changes of ischemia and discovering early AIS biomarker predictors. The chronic stage of stroke may provide essential information on recovery or simply represent a baseline metabolite concentration for a given patient because most inflammatory markers decline following day seven after stroke and may reach normal levels by day 90.[4, 5] Further, comparing only ischemic stroke patients with healthy controls cannot entirely exclude the influence of multiple other individual factors and medical conditions that yield distinct metabolic profiles.[6, 7] Therefore, in this pilot study, we investigated changes in blood metabolites during the acute and chronic stages of stroke on the same cohort of patients. We believe that our longitudinal design has the potential to eliminate the influence of other factors and identify putative subtle metabolomic changes that are more representative of acute ischemia.
Methods
Study Participants
The study participants were part of our ongoing Metabolome in Ischemic Stroke Study (MISS), which investigates biomarkers using genomics, metabolomics, and other -omics technologies.[2, 8–10] MISS was approved by our institutional review board. All patients underwent magnetic resonance imaging (MRI) with diffusion-weighted imaging (DWI) sequence during admission for AIS definition. All patients were evaluated on admission with the National Institute of Health Stroke Scale (NIHSS; 0–42 points reflecting the least to the most severe neurological deficit), and then with the Miami Emergency Neurological Deficit examination to monitor for signs of neurological deterioration during the hospital admission at the acute stage.[11, 12] During follow-up (chronic stage), we reviewed medical records and performed another NIHSS to rule out recurrent stroke.[11] After informed consent, we collected serum in the acute (within the first 72 hours) and chronic (3–6 months) stages of ischemic stroke. We excluded patients with: (1) hemorrhagic conversion of ischemic stroke and formation of hematoma defined by the European Cooperative Acute Stroke Study [13, 14]; (2) fluctuating neurological exam during the acute stage; (3) systemic infection at presentation or during admission with fever >38.0 C, elevated white blood cells, diagnosis of pneumonia, or urinary tract infection; (4) renal disease with glomerular filtration rate (GFR)<45; and (5) recurrent stroke in the chronic stage, because these conditions could yield distinct metabolome profiles.[6]
Metabolome analysis
100-ml aliquots of frozen sera from MISS patients were shipped on dry ice to Metabolon, Inc. (NC, USA) to measure global (untargeted) metabolomics profiling using ultrahigh performance liquid chromatography/mass spectrometry (LC-MS) and gas chromatography/mass spectrometry (GC-MS) as described earlier. Serum samples were extracted, proteins were precipitated with methanol, and aliquots were analyzed by LC-MS in the positive (one optimized for hydrophilic compounds, the other optimized for hydrophobic compounds), negative, and polar ion modes. All methods utilized Waters ACQUITY ultra-performance liquid chromatography and a Thermo Scientific Q-Exactive high resolution/accurate mass spectrometer interfaced with a heated electrospray ionization source and Orbitrap mass analyzer operated at 35,000 mass resolution. Assignment of a unique mass, signal-to-noise calculation, and compound identification were based on the mass spectral pattern as compared with the NIST and Wiley mass spectral libraries, followed by visual inspection for quality control as described previously.[15] Quality control and assurance used an internal matrix and several internal standards to determine instrument variability, with representative relative standard deviations of 3% (serum) for internal standards and 8% (serum) for endogenous biochemicals. In this sample, 1295 metabolites were detected and quantified in the acute and chronic stages of stroke.
Statistical analysis
The clinical and demographic variables were summarized using mean for continuous variables and numbers and percentages for categorical variables. Before the statistical analysis, the raw metabolite profile data were normalized through log-transformation, which resulted in some negative values, and scaled by the R package Specmine.[16] Orthogonal partial least squares discriminant analysis (OPLS-DA) was conducted by R package ropls to inspect group disparity using multivariate data as described previously, and principal component analysis (PCA) was conducted to evaluate hidden structures within our data as described previously.[17] We performed mixed regression analysis to compare metabolites between the acute and chronic stages using age, gender, ethnicity, body mass index (BMI), history of hypertension, hyperlipidemia, diabetes mellitus, GFR, and time to sample collection as covariates. Because of the exploratory nature of our study, we applied the less conservative Two-Stage Benjamini & Hochberg (TSBH) procedure for multiple testing to capture a greater number of metabolites and pathways that are different in the acute and chronic stages, followed by the more conservative and commonly used Bonferroni correction.[18]
Results
We analyzed data gathered on 1295 metabolites from a cohort of stroke patients: 60 in the acute stage (two were excluded after quality control) and 31 patients in the chronic stage (29 were lost to follow-up). Participants were 60±13-years-old on average, 50% were Caucasian, and 38% were men. Risk factors included hypertension (68%), hyperlipidemia (33%), diabetes (29%), and coronary artery disease (20%). Mean BMI was 29±6.1, suggesting overweight. The average acute stage NIHSS was 7.7±6.3, without worsening in the chronic stage. The average infarction volume was 30±46.7 ml (Table 1). The average time to sample collection was 47.35±17.07 hours in the acute stage and 4.7±1.37 months in the chronic stage.
Table 1.
Clinical characteristics of MISS patients
| Characteristics | All patients (n=60) |
|---|---|
| Age, years mean (SD) | 60 ±13 |
| Male gender (%) | 23 (38) |
| Pre-existing risk factors | |
| Hypertension (%) | 41 (68%) |
| Hyperlipidemia (%) | 20 (33%) |
| Diabetes (Hgb A1C>6.5%) (%) | 17 (29%) |
| Coronary Artery Disease (%) | 12 (20%) |
| BMI, mean (SD) | 29.03 ±6.10 |
| NIHSS, mean (SD) | 7.70 ±6.30 |
| Admission systolic blood pressure, mmHg, mean (SD) | 149.12 ±27.32 |
| Admission diastolic blood pressure, mmHg, mean (SD) | 88.74 ±22.27 |
| Glucose on admission, mean (SD) | 150.51 ±110.01 |
| LDL-cholesterol (mg/dl), mean (SD) | 99.81 ±41.30 |
| Infarction volume, ml, mean (SD) | 30.36 ± 46.70 |
SD–standard deviation; NIHSS–National Institute of Health Stroke Scale; BMI–Body Mass Index; LDL–Low-density lipoprotein cholesterol
OPLS-DA of metabolite concentrations identified two distinct populations, suggesting that the metabolome profiles differed in the acute and chronic stages (Figure 1). PCA analysis did not reveal hidden structures in our data. Comparative analysis of acute and chronic stage metabolites using mixed regression discovered 375 compounds that differed in the acute and chronic stages of stroke. Of these compounds, 228 remained significant after using the TSBH correction for multiple testing (Table 2). Among the 228 metabolites, 109 (48%) represented the lipid superpathway, 56 (25%) had an unknown chemical formula, and 32 (14%) represented the amino acid superpathway. Carbohydrates, vitamins, cofactors, peptides, nucleotides, and energy compounds accounted altogether for 31 metabolites (13%). Analysis of the lipid superpathway detected several species of sphingolipids, mono/diacyglycerols, endocannabinoids and medium/long-chain fatty acids that were significantly elevated during the acute stage of stroke, while metabolites of acyl-choline related fatty acids, phospholipids, plasmogen, and eicosanoids were reduced. Analysis of the amino acid superpathway was significant for the elevation of metabolites of glycine, valine, and tyrosine at the acute stage, while metabolites of alanine, aspartate, and tyramine, and others were reduced (Table 2).
Figure 1:
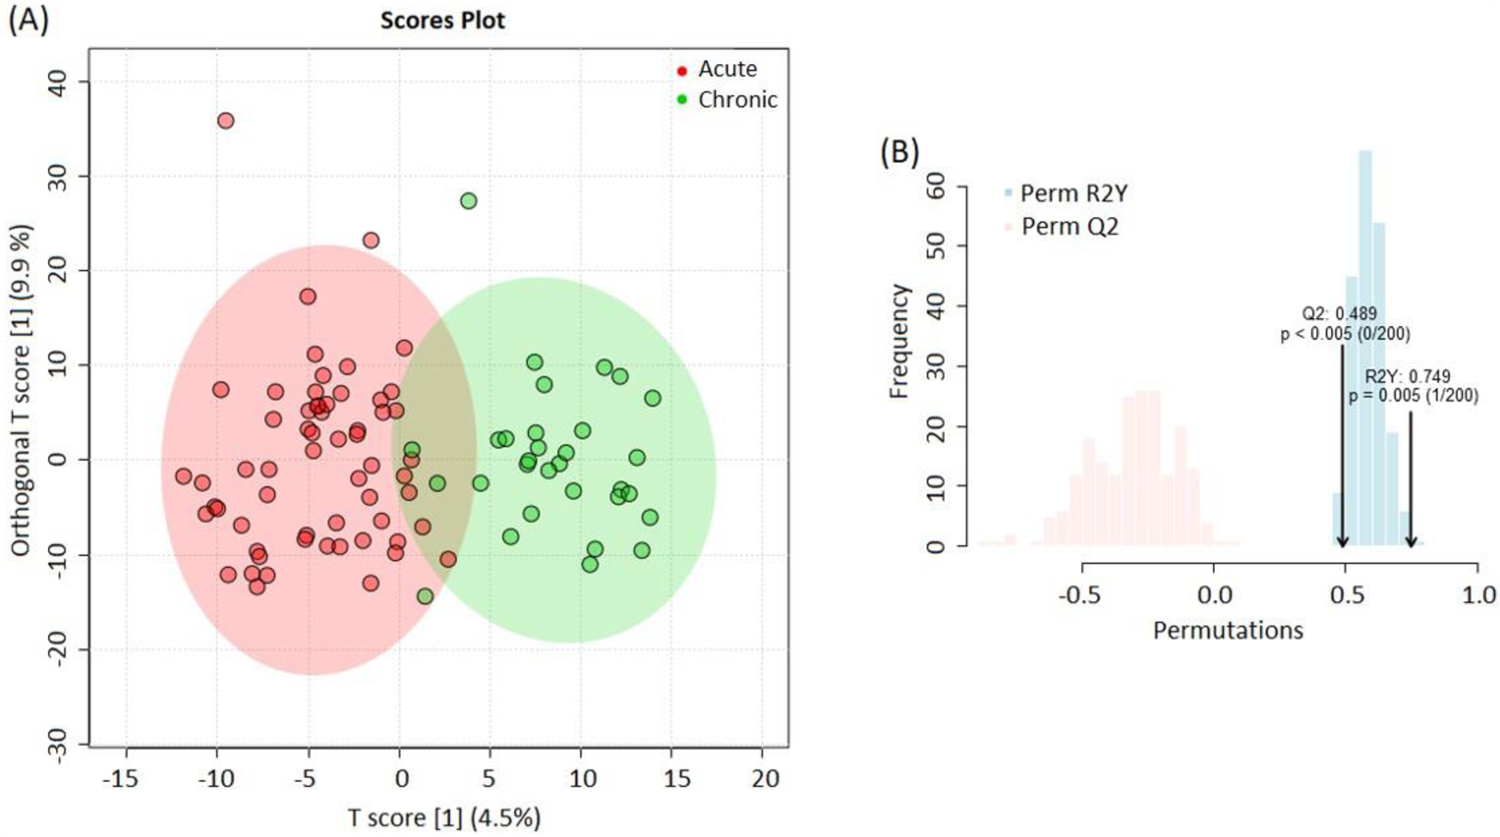
(A) OPLS-DA analysis shows two different populations of metabolites representing the acute (red) and chronic (green) stages of ischemic stroke. The analysis accounts for all metabolites. (B) OPLS-DA model comprises two blocks of modeled variances: predicted Q2 (red) and explained by data R2Y (blue) for classifying the acute and chronic stages.
Table 2.
Subpathway analysis of metabolites with different concentrations in acute to chronic stages of stroke after TSBH correction for multiple testing.
| Number of metabolites | Number (%) of metabolites elevated in acute stage (n=105) | Number (%) of metabolites decreased in acute stage (n=123) |
|---|---|---|
| Lipid super pathway | ||
| Sphingolipids | 22 (21%) | 0 (0%) |
| Mono- and diacylglycerols | 19 (18%) | 0 (0%) |
| Long/Medium chain fatty acids | 16 (15%) | 0 (0%) |
| Pregnolone, progestin, androgen (steroids) | 6 (6%) | 1 (1%) |
| Endocannabinoids | 4 (4%) | 2 (2%) |
| Fatty acid metabolism (Acyl-choline) | 0 (0%) | 11 (9%) |
| Fatty acid dicarboxylate, monohydroxy | 0 (0%) | 12 (10%) |
| Plasmogen | 0 (0%) | 5 (4%) |
| Phospholipids | 0 (0%) | 4 (3%) |
| Eicosanoid | 0 (0%) | 2 (2%) |
| Amino acid super pathway | ||
| Glycine; Valine | 3 (3%) | 1 (1%) |
| Tyrosine | 1 (1%) | 0 (0%) |
| Alanine and Aspartate | 1 (1%) | 2 (2%) |
| Leucine, Isoleucine, and Valine | 1 (1%) | 4 (3%) |
| Tyramine | 0 (0%) | 1 (1%) |
| Phenylalanine | 0 (0%) | 1 (1%) |
| Histidine | 0 (0%) | 1 (1%) |
| Glutamate | 0 (0%) | 2 (2%) |
| Lysine | 0 (0%) | 2 (2%) |
| Tryptophan | 0 (0%) | 4 (3%) |
| Urea cycle; Arginine and Proline | 0 (0%) | 5 (4%) |
| Other metabolite pathways | ||
| Glycolysis/Gluconeogenesis | 4 (4%) | 0 (0%) |
| Fibrinogen | 2 (2%) | 0 (0%) |
| Fibrinogen Cleavage | 0 (0%) | 6 (5%) |
| Other metabolites | 11(10%) | 11 (9%) |
| Unknown | 15 (14%) | 45 (37%) |
Comparative analysis of acute and chronic stage metabolites using mixed regression with more conservative Bonferroni correction identified 29 metabolites (Table 3). Fifteen of them were increased in the acute stage, including six metabolites of sphingolipids: N-stearoyl-sphinganine (d18:0/18:0), Sphingomyelin, N-palmitoyl-sphinganine (d18:0/16:0), N-palmitoyl-heptadecasphingosine, N-stearoyl-sphingosine, N-palmitoyl-sphingosine (d18:0/16:0); two metabolites of monoacylglycerol: 1-oleoylglycerol (18:1), and 2-oleoylglycerol (18:2); two metabolites of amino acids: Glycylvaline and Hydroxyproline; and four metabolites with unknown formula. Fourteen metabolites had decreased concentration in acute stage, including four metabolites of acyl-choline related fatty acids: eicosapentaenoylcholine, and N-linoleoylserine, oleoylcholine, and stearoylcholine; two metabolites of amino acids: N-Carbamoyl alanine and 3-methoxytyramine sulfate; two metabolites of phospholipids: 1-palmitoyl-glycerophosphotidilinositol, glycerophosphotidilinositol; and four metabolites with unknown formula.
Table 3.
Summary of metabolites showing significant variation between the acute and chronic stages of stroke, sorted by regression coefficients
| Metabolite | Average Acute Stage | Average Chronic Stage | Regression Coefficient | BF corrected p-value | Metabolism |
|---|---|---|---|---|---|
| X – 15523 | 3.348 | 0.271 | 3.036 | 0.000891 | Undiscovered |
| X – 17343 | −0.562 | −3.047 | 2.867 | 0.0105 | Undiscovered |
| Glycylvaline | −0.873 | −3.606 | 2.745 | 0.0199 | Dipeptide |
| X – 21816 | 0.251 | −1.622 | 1.811 | 0.0139 | Undiscovered |
| 1-oleoylglycerol (18:1) | 1.362 | −0.407 | 1.783 | 0.00406 | Monoacylglycerol |
| 2-oleoylglycerol (18:2) | 1.331 | −0.421 | 1.781 | 0.00173 | Monoacylglycerol |
| 4-methoxyphenol sulfate | 0.694 | −0.941 | 1.745 | 0.0000219 | Tyrosine |
| N-stearoyl-sphinganine (d18:0/18:0) | 0.283 | −1.246 | 1.51 | 0.00014 | Sphingolipids (Ceramide) |
| X – 18945 | −0.916 | −1.89 | 1.068 | 0.0335 | Undiscovered |
| Sphingomyelin | 0.337 | −0.444 | 0.765 | 0.00744 | Sphingolipids |
| N-palmitoyl-sphinganine (d18:0/16:0) | 0.324 | −0.399 | 0.731 | 0.000512 | Sphingolipids (Ceramide) |
| N-palmitoyl-heptadecasphingosine | 0.166 | −0.443 | 0.591 | 0.0274 | Sphingolipids (Ceramide) |
| N-stearoyl-sphingosine | 0.383 | −0.108 | 0.498 | 0.0156 | Sphingolipids (Dihydroceramide) |
| N-palmitoyl-sphingosine (d18:0/16:0) | 0.328 | −0.043 | 0.355 | 0.0141 | Sphingolipids (Ceramide) |
| Hydroxyproline | 0 | −0.494 | −0.473 | 0.0164 | Urea cycle; Arginine and Proline |
| X – 13431 | −0.195 | 0.347 | −0.538 | 0.0419 | Undiscovered |
| X – 21831 | −1.367 | −0.656 | −0.696 | 0.0499 | Undiscovered |
| 1-palmitoyl-Glycerophosphotidilinositol | −0.16 | 0.611 | −0.753 | 0.0158 | Phospholipid |
| X – 10458 | −0.26 | 0.733 | −0.884 | 0.000037 | Undiscovered |
| N-Carbamoyl alanine | −0.328 | 0.617 | −0.934 | 0.0419 | Alanine and Aspartate |
| Eicosapentaenoylcholine | −0.714 | 0.423 | −1.019 | 0.000207 | Fatty acids (Acyl-choline) |
| N-linoleoylserine | −1.008 | 0.128 | −1.094 | 0.00804 | Fatty acids |
| Oleoylcholine | −0.553 | 0.682 | −1.18 | 0.0474 | Fatty Acid |
| X – 25805 | −2.242 | −1.078 | −1.181 | 0.0144 | Undiscovered |
| Stearoylcholine | −0.562 | 0.815 | −1.277 | 0.0251 | Fatty Acid |
| 3-methoxytyramine sulfate | −1.268 | 0.1 | −1.341 | 0.0000418 | Amino acids |
| Glycerophosphotidilinositol | −0.43 | 1.119 | −1.458 | 0.0102 | Phospholipid |
| X – 12216 | −0.674 | 1.057 | −1.56 | 0.000458 | Undiscovered. |
| X – 12849 | −2.33 | 0.147 | −2.239 | 0.02 | Undiscovered |
Data were adjusted for age, gender, ethnicity, BMI, history of hypertension, hyperlipidemia, diabetes mellitus, and glomerular filtration rate (GFR).
Discussion
In this study we identified 29 metabolites predominantly of the lipid and amino acid origin that differed significantly in the acute compared to the chronic stage of stroke. In earlier case-control studies, metabolites of sphingolipids and amino acids valine and tyrosine were associated with acute stroke.[19–22] Our longitudinal analysis validated some of those findings; metabolites of valine, however, previously had no association. Mono/diacylglycerols were newly identified metabolites. In addition, we found eight novel compounds of unknown chemical structures that were not previously described. The increase of serum metabolites during acute ischemia probably reflects contributions from breakdown and leakage through disrupted cellular membranes, up or down-regulation of enzymes, which led to the interruption of the BBB and diffusion of the metabolites into the bloodstream.[2]
One novelty of our study is the elevation of mono/diacylglycerols in the acute stage of stroke compared to the chronic stage. Mono/diacylglycerols are intermediate degradation products of triacylglycerols (triglyceride), the main component of any cellular membrane. During the acute stage of stroke, triacylglycerols degrade into mono/diacylglycerols and then metabolized by the enzyme monoacylglycerol lipase (MAGL) to free fatty acids.[23] In addition, MAGL regulates endocannabinoid system.[23] As in the current study, we observed elevated levels of endocannabinoid metabolites, medium and long-chain fatty acids during the acute stage, which may suggest the increase of MAGL activity during acute ischemia. Interestingly, that therapeutic inhibition of MAGL resulted in reduced infarct volume with improved stroke outcomes in rats – making it a potential target for intervention.[24] Acyl-choline-related fatty acids and phospholipids had lower concentrations in acute than the chronic stage in our study but were shown to be higher in case-control studies.[22] Such discrepancy may result from long-lasting inflammation after acute stroke leading to continuous degradation of these compounds and comparatively high levels in the chronic stage.[4]
Elevation of sphingolipids in the acute stage is another important finding of our study. Unlike triglycerides, sphingolipids are more abundant in brain tissue than in other organs and contribute up to 10–12% of the total lipid content of the nerve cells, participate in crucial nervous system processes, and regulate physiological as well as pathophysiological processes.[25] In this investigation, sphingolipids had the highest proportion of all elevated acute stage metabolites even after adjusting for the TSBH or the Bonferroni correction. These findings suggest their potential as diagnostic biomarkers. Pathophysiological processes of sphingolipids elevation in acute stage of stroke are complex because they lead to the release of multiple bioactive compounds, such as N-palmitoyl-sphingosine (ceramide) and sphingosine-1-phosphate (S1P), which activate a variety of cellular signaling pathways.[26] N-palmitoyl-sphingosine activates intrinsic and extrinsic apoptotic pathways through receptor-independent mechanisms, as well as the generation of ceramides and gangliosides (glycosphingolipid).[27] S1P is a ligand for a family of G protein-coupled receptors, which functions as a growth and survival factor in various cells, including the endothelial vasculature and neurons.[25] Thus, both N-palmitoyl-sphingosine and S1P regulate cellular functions in an opposing manner. Any disturbances in the steady relationship between these sphingolipids can accelerate the process of apoptosis, leading to neural cell degeneration and cell death.[27] Such increased plasma concentrations of ceramides (d18:1/18:0), (d18:1/20:0), and (d18:1/22:0) were earlier associated with poor outcomes of AIS. [21]
Among multiple and conflicting changes in amino acid metabolism identified in case-control studies, our study with longitudinal design validated the observed increase of valine and tyrosine, but not glycine during the acute stage of stroke. Tyrosin was previously reported to be elevated in acute compared to the chronic stage in our study with a limited number of metabolites.[9] The increase of valine and tyrosine were earlier attributed to stroke-related excitotoxicity and oxidative stress. [28] However, in other study glycin and tyrosine had lower concentration in stroke patients comparing to controls.[20] The observed changes in the metabolism of other amino acids would require further investigation.
Strengths of our study include a well-characterized patient cohort with the availability of longitudinal data that allowed comparing the change of metabolites in the same patients over time and minimizing the influence of multiple individual factors on the human metabolome. Use of untargeted metabolomics enabled the identification of many unidentified metabolites that could eventually help in future discoveries. Major limitation of the study is the absence of a control group, which makes interpretation of metabolite levels difficult as chronic stage metabolites may still be elevated or decreased comparing to non-stroke individuals. In addition, we did not account for functional and radiological [10] covariates of our patients because this could substantially decrease the number of significant metabolites, decrease sensitivity, and limits the interpretation of our findings.
In summary, our findings demonstrated significant alterations in metabolomic patterns between the acute and chronic stages of stroke and identified important metabolites involved in lipid, and amino acid metabolism. Indeed, the elevation of some metabolites (specifically the sphingolipids) during acute brain ischemia is supported by case-control studies. Further validation of these findings in a larger independent cohort with the inclusion of matched healthy controls is warranted to identify putative molecules as predictive biomarkers for AIS in humans.
Acknowledgments:
The authors thank all the participants of MISS who made this study possible. The authors would also like to acknowledge Claire DelpirouNouh for help with recruiting patients, and the technical assistance provided by Ms. Cynthia Bejar is duly acknowledged.
Funding:
This study was partly supported by NIH (R01DK082766), Presbyterian Health Foundation Team Science Award, College of Medicine Alumni Association Award (COMAA), and the Leinbach Seed Grant.
Footnotes
Publisher's Disclaimer: This is a PDF file of an unedited manuscript that has been accepted for publication. As a service to our customers we are providing this early version of the manuscript. The manuscript will undergo copyediting, typesetting, and review of the resulting proof before it is published in its final form. Please note that during the production process errors may be discovered which could affect the content, and all legal disclaimers that apply to the journal pertain.
Disclosures: Authors have nothing to disclose
References:
- [1].Powers WJ, Rabinstein AA, Ackerson T, Adeoye OM, Bambakidis NC, Becker K, et al. Guidelines for the Early Management of Patients With Acute Ischemic Stroke: 2019 Update to the 2018 Guidelines for the Early Management of Acute Ischemic Stroke: A Guideline for Healthcare Professionals From the American Heart Association/American Stroke Association. Stroke. 2019;50:e344–e418. [DOI] [PubMed] [Google Scholar]
- [2].Sidorov E, Sanghera DK, Vanamala JKP. Biomarker for Ischemic Stroke Using Metabolome: A Clinician Perspective. J Stroke. 2019;21:31–41. [DOI] [PMC free article] [PubMed] [Google Scholar]
- [3].Jiang X, Andjelkovic AV, Zhu L, Yang T, Bennett MVL, Chen J, et al. Blood-brain barrier dysfunction and recovery after ischemic stroke. Prog Neurobiol. 2018;163–164: 144–71. [DOI] [PMC free article] [PubMed] [Google Scholar]
- [4].Alexandrova ML, Bochev PG. Oxidative stress during the chronic phase after stroke. Free Radic Biol Med. 2005;39:297–316. [DOI] [PubMed] [Google Scholar]
- [5].Marquardt L, Ruf A, Mansmann U, Winter R, Buggle F, Kallenberg K, et al. Inflammatory response after acute ischemic stroke. J Neurol Sci. 2005;236:65–71. [DOI] [PubMed] [Google Scholar]
- [6].Tofte N, Persson F, Rossing P. Omics research in diabetic kidney disease: new biomarker dimensions and new understandings? J Nephrol. 2020. [DOI] [PubMed] [Google Scholar]
- [7].Newgard CB. Metabolomics and Metabolic Diseases: Where Do We Stand? Cell Metab. 2017;25:43–56. [DOI] [PMC free article] [PubMed] [Google Scholar]
- [8].Reddivari L, Sapkota BR, Rudraraju A, Liang Y, Aston C, Sidorov E, et al. Metabolite signatures of diabetes with cardiovascular disease: a pilot investigation. Metabolomics. 2017;13:154. [Google Scholar]
- [9].Sidorov E, Bejar C, Xu C, Ray B, Reddivari L, Chainakul J, et al. Potential Metabolite Biomarkers for Acute Versus Chronic Stage of Ischemic Stroke: A Pilot Study. J Stroke Cerebrovasc Dis. 2020:104618. [DOI] [PubMed] [Google Scholar]
- [10].Sidorov EV, Bejar C, Xu C, Ray B, Gordon D, Chainakul J, et al. Novel Metabolites as Potential Indicators of Ischemic Infarction Volume: a Pilot Study. Transl Stroke Res. 2020. [DOI] [PubMed] [Google Scholar]
- [11].Spilker J, Kongable G, Barch C, Braimah J, Brattina P, Daley S, et al. Using the NIH Stroke Scale to assess stroke patients. The NINDS rt-PA Stroke Study Group. J Neurosci Nurs. 1997;29:384–92. [DOI] [PubMed] [Google Scholar]
- [12].LaCombe DM, Gordon DL, Issenberg SB, Vega A, Brocato C, Siegel M, et al. Stroke on the mend. JEMS. 2000;25:32–41. [PubMed] [Google Scholar]
- [13].del Zoppo GJ, Poeck K, Pessin MS, Wolpert SM, Furlan AJ, Ferbert A, et al. Recombinant tissue plasminogen activator in acute thrombotic and embolic stroke. Ann Neurol. 1992;32:78–86. [DOI] [PubMed] [Google Scholar]
- [14].Pessin MS, Del Zoppo GJ, Estol CJ. Thrombolytic agents in the treatment of stroke. Clin Neuropharmacol. 1990;13:271–89. [DOI] [PubMed] [Google Scholar]
- [15].Dehaven CD, Evans AM, Dai H, Lawton KA. Organization of GC/MS and LC/MS metabolomics data into chemical libraries. J Cheminform. 2010;2:9. [DOI] [PMC free article] [PubMed] [Google Scholar]
- [16].Costa C, Maraschin M, Rocha M. An R package for the integrated analysis of metabolomics and spectral data. Comput Methods Programs Biomed. 2016;129:117–24. [DOI] [PubMed] [Google Scholar]
- [17].Chong J, Soufan O, Li C, Caraus I, Li S, Bourque G, et al. MetaboAnalyst 4.0: towards more transparent and integrative metabolomics analysis. Nucleic Acids Res. 2018;46:W486–W94. [DOI] [PMC free article] [PubMed] [Google Scholar]
- [18].Paynter NP, Balasubramanian R, Giulianini F, Wang DD, Tinker LF, Gopal S, et al. Metabolic Predictors of Incident Coronary Heart Disease in Women. Circulation. 2018;137:841–53. [DOI] [PMC free article] [PubMed] [Google Scholar]
- [19].Fiedorowicz A, Kozak-Sykala A, Bobak L, Kalas W, Strzadala L. Ceramides and sphingosine-1-phosphate as potential markers in diagnosis of ischaemic stroke. Neurol Neurochir Pol. 2019;53:484–91. [DOI] [PubMed] [Google Scholar]
- [20].Wang D, Kong J, Wu J, Wang X, Lai M. GC-MS-based metabolomics identifies an amino acid signature of acute ischemic stroke. Neurosci Lett. 2017;642:7–13. [DOI] [PubMed] [Google Scholar]
- [21].Lee TH, Cheng CN, Chao HC, Lee CH, Kuo CH, Tang SC, et al. Plasma ceramides are associated with outcomes in acute ischemic stroke patients. J Formos Med Assoc. 2021. [DOI] [PubMed] [Google Scholar]
- [22].Sun H, Zhao J, Zhong D, Li G. Potential serum biomarkers and metabonomic profiling of serum in ischemic stroke patients using UPLC/Q-TOF MS/MS. PLoS One. 2017;12:e0189009. [DOI] [PMC free article] [PubMed] [Google Scholar]
- [23].Gil-Ordonez A, Martin-Fontecha M, Ortega-Gutierrez S, Lopez-Rodriguez ML. Monoacylglycerol lipase (MAGL) as a promising therapeutic target. Biochem Pharmacol. 2018;157:18–32. [DOI] [PubMed] [Google Scholar]
- [24].Choi SH, Arai AL, Mou Y, Kang B, Yen CC, Hallenbeck J, et al. Neuroprotective Effects of MAGL (Monoacylglycerol Lipase) Inhibitors in Experimental Ischemic Stroke. Stroke. 2018;49:718–26. [DOI] [PMC free article] [PubMed] [Google Scholar]
- [25].Mencarelli C, Martinez-Martinez P. Ceramide function in the brain: when a slight tilt is enough. Cell Mol Life Sci. 2013;70:181–203. [DOI] [PMC free article] [PubMed] [Google Scholar]
- [26].Sun N, Keep RF, Hua Y, Xi G. Critical Role of the Sphingolipid Pathway in Stroke: a Review of Current Utility and Potential Therapeutic Targets. Transl Stroke Res. 2016;7:420–38. [DOI] [PMC free article] [PubMed] [Google Scholar]
- [27].Tserng KY, Griffin RL. Ceramide metabolite, not intact ceramide molecule, may be responsible for cellular toxicity. Biochem J. 2004;380:715–22. [DOI] [PMC free article] [PubMed] [Google Scholar]
- [28].Liu M, Zhou K, Li H, Dong X, Tan G, Chai Y, et al. Potential of serum metabolites for diagnosing post-stroke cognitive impairment. Mol Biosyst. 2015;11:3287–96. [DOI] [PubMed] [Google Scholar]