

Abstract
Much confusion exists about the chemical composition of widely sold Cannabis sativa products that utilize the cannabidiol (CBD) acronym and related terms such as “CBD oil”, “CBD plus hemp oil”, “full spectrum CBD”, “broad spectrum CBD”, and “Cannabinoids”. Their rational chemical and subsequent biological assessment requires both knowledge of the chemical complexity and the characterization of significant individual constituents. Applicable to hemp preparations in general, this study demonstrates how the combination of liquid-liquid based separation techniques, NMR analysis, and quantum mechanical-based NMR interpretation facilitates the process of natural product composition analysis by allowing specific structural characterization and absolute quantitation of cannabinoids present in such products with a large dynamic range. Countercurrent separation of a commercial “CBD oil” yielded high purity CBD plus a more polar cannabinoid fraction containing cannabigerol and cannabidivarin, as well as a less polar cannabinoid fraction containing cannabichromene, trans-Δ9-tetrahydrocannabinol, cis-Δ9-tetrahydrocannabinol, and cannabinol. Representatives of six cannabinoid classes were identified within a narrow range of polarity which underscores the relevance of residual complexity in biomedical research on cannabinoids. Characterization of the individual components and their quantitation in mixed fractions was undertaken by TLC, HPLC, 1H (q)NMR spectroscopy, 1H iterative full spin analysis (HiFSA), 13C NMR, and 2D NMR. The developed workflow and resulting analytical data enhance the reproducible evaluation of “CBD et al.” products, which inevitably represent complex mixtures of varying molecular populations, structures, abundances, and polarity features.
Graphical Abstract

Cannabis, endowed with beneficial medicinal properties, has a long history of both use and abuse as a fiber- and hallucinogen-containing plant material, respectively. The genus Cannabis produces a family of distinctive congeneric polyketide terpenoid hybrid compounds that are known as cannabinoids, of which cannabidiol (CBD, 1, Scheme 1) has received much attention recently. Historically, the most well-known Cannabis phytochemical was the hallucinogenic (−)-trans-Δ9-tetrahydrocannabinol (2a) commonly referred to as THC. Driven at least in part by the special legal status of THC, recent attention has turned to CBD, which is a major cannabinoid found in the heat-treated extracts of many Cannabis cultivars. Particularly in North America, CBD products have flooded the marketplace. They are often promoted as safe, non-addictive herbal preparations that may treat a multitude of medical and mood-related conditions.1
Scheme 1.

Structures, atom numbering, and names of the investigated cannabinoids.
As is the case with many herbal preparations with (purported) therapeutic value, the major phytochemical constituent is often also identified as the “active principle”; typically without a thorough investigation of any unavoidable chemical complexity [Residual Complexity (RC)] of the preparation that is being marketed and/or tested.2 The result is that the medicinal value of the individual phytochemicals and their preparations are obscured rather than clarified through rigorously performed and reported research. Efforts by governmental agencies to control drugs, foods, and cosmetics containing CBD are inadequate to regulate international and intranational markets and, therefore, represent an important public health threat.3,4 In response, one must consider the full measure of complexity in terms of analyte population described by the number of metabolites present, their structural elucidation to the extent possible, the relative abundance measured by absolute quantitation techniques, and the polarity characteristics, which are the foundation for chromatographic separation.
Cannabis Preparations.
Cannabinoids have been extracted, heat-treated, and concentrated from Cannabis plant material for centuries in the form of hashish.5 Producing hashish from either fresh or dried resin glands of Cannabis flowers is a largely mechanical, rather than chemical, process that results in highly concentrated cannabinoids. The practice of creating high quality Cannabis extracts continues to evolve, with low temperature extractors, filters, organic solvent enrichment, rosin pressing, and other techniques.6
As is the case with many other phytochemicals, the parts of the organism selected and their state of development greatly influences the potency of the resulting preparation. Cannabinoids are mainly produced by the resin glands of female inflorescences. Interestingly, cannabinoids are increasingly being marketed in the form of an “oil” product that contains hemp seed extract.7 Hemp seeds are not known to contain any cannabinoids. However, if hemp seeds are harvested and extracted without thorough cleaning, cannabinoids in the resin adhering to the seed coat are present in the extract.8,9 This situation creates labeling confusion because both hemp seed oil (fatty acid derivatives) and hemp essential oil (volatile terpenoids) may, or may not, contain cannabinoids.
Preparations containing concentrated cannabinoids, beside resin, have typically relied on their extraction from plant material by organic liquids.10 A wide range of organic solvents are adequate for cannabinoid extraction, and their capacities to extract other material (triglycerides, terpenes, waxes, chlorophylls) varies. In the case of organic solvents, the process almost always requires heating to aid extraction and/or to remove excess solvent in the recovery of cannabinoids. Several solvent extraction methods, such as dynamic maceration, ultrasound-assisted extraction, and microwave assisted extraction, have been applied to recovering cannabinoids from Cannabis plant material.11 Moreover, supercritical CO2 has emerged as a popular method of Cannabis extraction due to its ability to produce consumable products free of residual solvents.12
Once extracted, cannabinoids may be separated and purified by a number of methods. Liquid-liquid partitioning is commonly used to process large quantities of extract through the separation and selective removal of compounds that have significantly different polarity or solubility characteristics than the target cannabinoid(s) of interest. Precipitation techniques such as phase separation and crystallization also allow large quantities of extract to be purified. Dissolving an extract in ethanol and cooling it down, a process called “winterization”, causes the solidification of plant waxes to the extent that they can be physically separated from cannabinoids. Another approach leading to high purity CBD is the use of pentane for its crystallization.13 Finally, short-path distillation is also used, especially in cases where terpene content is important for the consumer or the producer.14 From a practical standpoint, distillation also allows decarboxylation of the acidic cannabinoids to occur.7
“CBD et al.” Materials and Residual Complexity.
The level and composition of cannabinoids in a given product may be adjusted by adding whole hemp plant extracts and/or seed oil. Marketers are not required to reveal the complete chemical content of hemp preparations. Therefore, a variety of ambiguous terms have been coined such as CBD oil, CBD hemp oil, full spectrum CBD, cannabinoids, phytocannabinoid-rich hemp, or CBD to describe the alleged “CBD” content of products. Researchers are confronted with the same challenging labeling and terminology issues as consumers when it comes to evaluating hemp preparations.
Extraction methodology will have a significant impact on what ends up in the preparation labeled as “CBD et al.” materials. In other words, different extraction methodologies will leave different chemical residue fingerprints, i.e., Residual Complexity (RC), in the final preparation. Besides the phytochemicals present in the original extract being carried through to the final step, new chemicals such as solvents may be introduced. In addition, chemical transformations, such as decarboxylation, can occur under the conditions used for extraction and purification. Understandably, there is some concern that CBD may rearrange to THC. This chemically feasible transformation may occur to a small extent during extraction, separation, and purification.15,16 Even synthetic CBD will have its own distinctive chemical residue fingerprint.17 These compositional patterns may be used to identify the source and method of production of the CBD. A review of the different analytical fingerprint methods that have been applied to illegal drugs, but that could be applied to cannabinoids as well, was conducted recently.18
The importance of determining the chemical composition of the sample being assessed for biological activity cannot be overemphasized in studies that seek to understand the health promotion or even medicinal value of natural product (NP) preparations. Chemical characterization of NPs and their preparations goes well beyond simply reporting the percent content or purity of the major component - such as CBD in hemp/C. sativa products. Extracts and purified NP that originate from botanicals invariably contain a mixture of phytochemicals that are not separated by the fractionation process(es) employed to generate the preparation. If a pure target NP is desired, the minor (often congeneric) phytochemicals that reside in the mixture form the RC associated with the sample. In the case of CBD extraction from Cannabis cultivars classified as “hemp”, CBD and CBDA (cannabidiolic acid) are the major metabolites that are accompanied by a host of congeneric cannabinoids and other phytochemicals that comprise what is known as “CBD oil” or “cannabinoids”. The composition (including their RC) will vary with the source, the extraction method, and dynamic chemical transformations during extraction, purification, storage, and handling. Studies on cannabinoid stability in different preparations under different temperatures has highlighted the susceptibility of cannabinoids to degradation and rearrangements under ambient conditions.19,20 In particular, CBD is readily degraded in organic solvents in the presence of light (254 nm).21 In addition to product-centric considerations, bioassay conditions create another opportunity for the generation of RC, whereby the sample is subjected to new environmental conditions such as pH, the presence of metal ions, light, enzymes, and related in vitro biochemistry. For in vivo experiments such as clinic trials, it is well known that the administered material will likely be further modified by physiological conditions and enzymatic transformations to produce new chemical forms.
The workflow of this investigation starts with a high capacity liquid-liquid separation step that effectively separates cannabinoids from lipophilic components present in the commercial sample. Fractionation continues through both hydrostatic (centrifugal partition chromatography or CPC) and hydrodynamic (countercurrent chromatography or CCC) instruments.22 Fraction characterization was performed by quantitative 1H NMR (qHNMR) as the primary quantitation method. Besides structural characterization, NMR has been used previously for both the quantitation of cannabinoids in extracts and the creation of cannabinoid profiles of crude extracts.23–29 Notably, qNMR provides a means of quantitation that is independent of response factors. Here, qHNMR accompanied by HiFSA (1H iterative Full Spin Analysis) was employed for the unambiguous structural dereplication of chemical constituents and in order to afford high reproducibility for future use of the chromatographic and structural data generated. Combined with HiFSA, qHNMR allows reproducible and accurate quantitation of phytochemicals in mixtures.30
RESULTS AND DISCUSSION
A commercially available cannabinoid source described as “highly concentrated CBD oil containing 1,500+ mg cannabinoids per fluid ounce” was employed for the proof of principle in this study.31 Quantitative 1H NMR (qHNMR) spectroscopic analysis of the original preparation revealed the mass percentage of CBD (1) of 4.48% w/w. CBD was quantitated primarily based on the integrals of the olefinic H-2, H-9(trans), H-9(cis) signals found at 5.5724, 4.6589, and 4.5573 ppm respectively (Figure S1). The aromatic hydrogens H-2’and H-4’, the hydroxyl hydrogen signal, and the methyl groups H-7 and H-10 are also evident in the original “CBD oil”. Therefore, the application of qNMR to the direct measurement of 1 in “CBD oil” preparations was demonstrated to be feasible. Several prominent cannabinoids could be detected in the aromatic hydrogen signal region (6.05 - 6.4 ppm), but signal resolution and baseline behavior were insufficient for accurate quantitation (Figure S1).
Quantitative Partitioning.
Partitioning the “CBD oil” preparation with biphasic n-hexane/ACN/MeOH (10:7:3 v/v) created a cannabinoid enriched lower phase, which represented 14.5% w/w of the original preparation (Figure S2). While some fatty acid derivatives remained in the lower phase, this simple partitioning recovered 1 (enriched to 31.0%) and related cannabinoids quantitatively (Figure S3). The integration of the aromatic H-1’ resonance of cannabichromene (CBC, 3) at 6.6080 ppm was sufficient for the quantitation of CBC at 1.03% (Figure S2). The qNMR quantification of cannabichromene cannabigerol (CBG, 4) in the lower phase at 0.96% was accomplished by the integration of the H-1’ methylene resonance at 3.3903 ppm (Figure S2).
A series of partitioning experiments with ten solvent systems (SSs) from eight solvent system families was performed with the goal of finding a suitable biphasic SS for the removal of CBD from the cannabinoid enriched extract (Table 1). When partitioned between n-hexane and MeOH, 1 and CBN (5) favored the polar phase. Adding ACN as a bridging solvent to n-hexane, and MeOH further increased the relative concentration of cannabinoids in the lower (polar) phase. Other bridging solvents increased the K values, but the difference between the K values (separation factor) was too low. The formulation of four component SSs containing both n-hexane and H2O, such as n-hexane/EtOAc/MeOH/H2O (HEMWat), had the effect of increasing the separation factor. Several SS formulations gave desirable K values for CBD as measured by HPLC at 273 nm. However, when the potential interference of fatty acid derivatives was considered, the n-hexane/EtOAc/ACN/H2O (HEAcWat) 8:2:8:2 triphasic system (upper/middle/lower, 40/52.5/7.5 v/v) was deemed optimal when the upper and middle phases were used.
Table 1.
Systematic Search of an Optimized Solvent System for the Targeted Purification and Separation of CBD (1) and CBN (5).
| solvent system | solvent ratios | K values | |
|---|---|---|---|
| CBD (1) | CBN (5) | ||
| HM | 0.22 | 0.45 | |
| HAcM | 10:5:5 | 0.11 | 0.33 |
| HterAc | 10:1:10 | 0.28 | 0.66 |
| HDiAc | 10:3:7 | 0.32 | 0.50 |
| HAtAc | 10:6:4 | 0.36 | 0.44 |
| HEMWat | 8:2:8:2 | 1.90 | 6.70 |
| HEMWat | 9:1:9:1 | 0.59 | 1.80 |
| HAtAcWat | 10:6:4:1 | 0.36 | 1.00 |
| HEAcWat | 8:2:8:2 | 0.54 | 1.70 |
Partitioning experiments were analyzed by UHPLC witha UV detection (λ 273 nm; K = Cup/Clp; H = n-hexane, Di = dichloromethane, ter = MTBE, E = EtOAc, Ac = ACN, At = acetone, M = MeOH, Wat = H2O).
This approach to solvent system formulation yielded a solvent system that had not previously been used for the fractionation of cannabinoids. A liquid-liquid chromatography process, countercurrent distribution (CCD) was employed in the 50’s and 60’s to purify cannabinoids utilizing a biphasic liquid-liquid solvent system ligroin/MeOH/H2O.32 In 2004, Hazekamp et al. reported that liquid-liquid chromatography technique, centrifugal partition chromatography, was capable of successfully separating three acidic and four neutral cannabinoids from the hexane extract of dried C. sativa flower tops, including CBDA and CBD with hexane/acetone/ACN.33 Recently, Popp et al. described the isolation of CBDA (cannabidiolic acid) and CBDVA (cannabidivarinic acid) from the supercritical fluid extract of C. sativa aerial parts with pH-zone-refining centrifugal partition chromatography (CPC) employing an n-hexane/EtOAc/EtOH/H2O solvent system modified with trifluoroacetic acid as retainer and triethylamine as eluter.34 Another study employed CPC to remove pesticide residues from the CBD found in high-CBD content hemp extract with n-heptane/MeOH/H2O, n-heptane/acetone/H2O, and n-heptane/ACN/H2O solvent systems.35 These references to earlier studies illustrate the versatility of biphasic solvent systems in cannabinoid analysis.
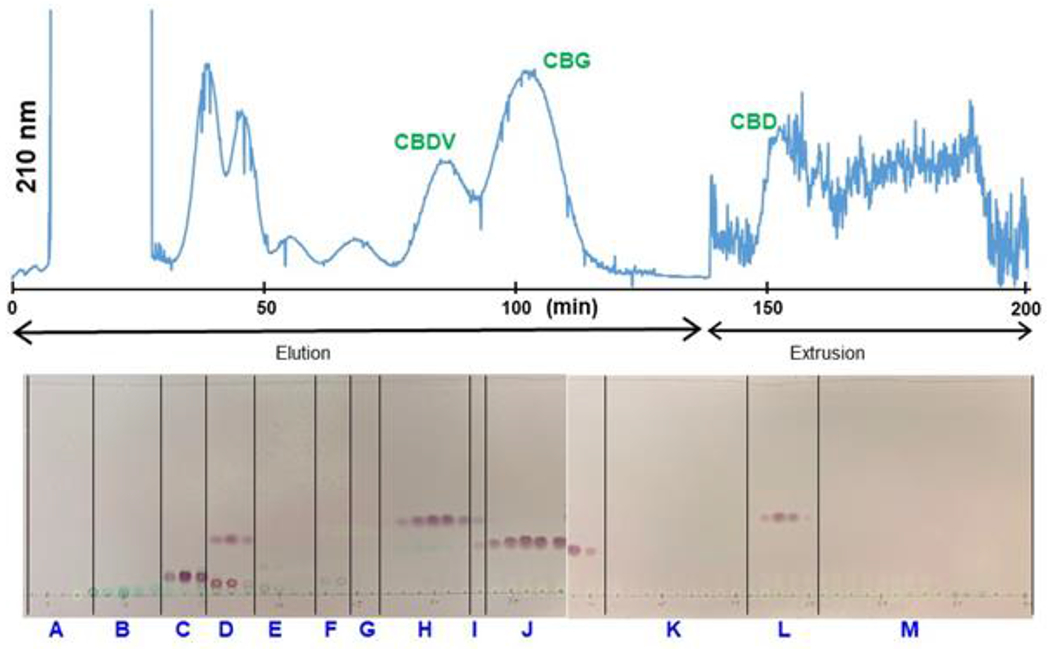
Performing a CPC separation under normal phase conditions (ascending mode) permitted the rapid elution of nonpolar constituents, followed by a band of nonpolar cannabinoids which included 2a, 2b, 3, and CBN (5), eluted before 1. A band of polar cannabinoids which included 4 and CBDV (5), as well as a group of polar constituents, were obtained by extruding the column (Figure 1). TLC analysis of the individual fractions revealed the separation potential of this chromatographic step. Individual fractions were also analyzed by UHPLC to monitor the presence of prominent cannabinoids and remaining chemical complexity. Based on TLC and UHPLC analysis, individual test tubes were combined into 12 fractions (A-L).
Figure 1.

Preparative CPC chromatogram (UV detection at 210, 254, and 273 nm) of CBD (1) enriched material (partition of “CBD Oil” product, 1.455 g) in the biphasic solvent system, n-hexane/EtOAc/ACN/H2O (HEAcWat) 8:2:8:2, in ascending mode (normal phase elution), with a flow rate of 10 mL/min at 3000 rpm. The stationary phase retention volume ratio was 0.68. The corresponding TLC fractogram was developed in the upper phase of HEMWat 9:1:9:1 and visualized with sulfuric acid and vanillin reagent upon heating. The NMR spectra of fractions A - L are included in the Supporting Information.
Performed on each combined fraction (stacked spectra shown in Figures S16 and S17), qNMR analysis indicated that high-purity 1 was obtained (85% w/w, 1.18 < K < 5.90, 500.1 mg) with 94% w/w recovery. A small amount of 1 overlapped with the polar cannabinoid band (Figure 2). As expected, some cannabinoids were characterized that were not detectable in neither the original nor the enriched cannabinoid fraction. Notably, trans-Δ9-tetrahydrocannabinol (2a, 0.51 % of the enriched sample) and cis-Δ9-tetrahydrocannabinol (2b, 0.24 % of the enriched sample) were confirmed in combined fraction C (0.39 < K < 0.82). The quantitation of trans and cis-Δ9-THC was achieved by integrating their H-10a signals at 3.1976 and 3.5552 ppm respectively (Figures S5 and S6). Fraction A (0 < K < 0.32) contained primarily triglycerides with oleic, linoleic, linolenic esters in equal proportions.36 Fraction B (0.32 < K < 0.39) also contained triglycerides of unsaturated fatty acids along with some 1,2-diglycerides, confirming that hemp seed oil is rich in derivatives of oleic, linoleic, and α-linolenic fatty acids.37
Figure 2.

CBD (1) detection in CPC fractions E through I (see Figure 1). The asterisk indicates the target signal of H-2 at 5.5724 ppm used for quantitation. Fraction F was 85% pure 1 with a mass of 413.6 mg (28.4% of CBD enriched “CBD Oil” material).
CPC fractionation of the cannabinoid enriched lower phase provided sufficient material for the preparative HPLC purification of cannabinoid standards that were used for unambiguous structural determination of the cannabinoids: 2a (3.1 mg), 2b (1.8 mg), and cannabichromene (CBC, 3, 4.6 mg). Preparative HPLC of combined polar fractions yielded cannabigerol (CBG, 4, 2.8 mg) and cannabidivarin (CBDV, 6, 0.8 mg). Cannabinoid identification was based on the comparison of 1H and 13C NMR data with the literature,24,29,38,39 as well as independent 1H NMR full spin analysis.
CCS of the Primary Partitions.
Nonpolar fractions analyzed by NMR showed a majority of fatty acid derivatives from the residual oil in the initial primary partition. Every fraction, except the one that contained purified 1, had signals between 5.30 and 5.40 ppm, corresponding to fatty acid olefinic hydrogens. The middle (H-2) hydrogen of the glycerol moiety resonated between 5.25 and 5.30 ppm in the three nonpolar fractions. The interior allylic hydrogen found in poly-unsaturated fatty acids, discoverable at 2.75 to 2.85 ppm, was present in many fractions. Five more regions of distinctive fatty acid signals were found between 0.80 and 2.40 ppm, a signal area which overlaps with those of the cannabinoid aliphatic chain (Figures S16 and S17).36
The separation of the nonpolar cannabinoid band (0.39 < K < 1.18) was undertaken with a partitioning study focusing on trans-Δ9-THC (2a) and CBC (3). Four different SSs were evaluated (Table 2). Both target compounds were strongly attracted to the halogenated solvents in the n-hexane/CHCl3/MeOH/H2O and n-hexane/CH2Cl2/ACN/H2O SSs. Both the n-hexane/EtOAc/MeOH/H2O and n-hexane/MTBE/ACN/H2O (HterAcWat) SSs gave K values that predicted the resolution of 2 and 3 (resolution factor 1.9) within reasonable elution volumes. HterAcWat was chosen due to its favorable solubility characteristics. Although both 2a and 2b were detected by TLC and UHPLC, no SS was found that would sufficiently resolve them.
Table 2.
Systematic Search of an Optimized Solvent System for the Targeted Purification and Separation of cis-Δ9-THC (2b), trans-Δ9-THC(2b), and CBC (3).
| solvent system | solvent ratios | K value | ||
|---|---|---|---|---|
| Δ9-cis-THC (2b) | Δ9-trans-THC (2a) | CBC (3) | ||
| HChMWat | 3:7:7:3 | 0.05 | 0.05 | 0.01 |
| HDiAcWat | 8:2:8:2 | 0.39 | 0.38 | 0.28 |
| HEMWat | 8:2:9:1 | 0.91 | 0.82 | 3.38 |
| HterAcWat | 8:2:8:2 | 2.38 | 2.45 | 4.77 |
Partitioning experiments were analyzed by UHPLC with UV detection (λ 273 nm; K = Cup/Clp; H = n-hexane, ter = MTBE, Di = dichloromethane, Ch = chloroform, Ac = ACN, M = MeOH, Wat = H2O).
The smaller sample size (90.7 mg) and a desire for optimally resolved components indicated that HSCCC (High Speed Countercurrent Chromatography) was the most appropriate instrument choice for the fractionation of the combined fractions C, D, and E. Individual test tubes were analyzed by TLC and UHPLC (Figure 3). Based on analyte patterns, the test tubes were combined to create 16 fractions (C-A to C-P).
Figure 3.

The HSCCC separation of 12.3 mg combined fractions C & D (see Figure 1) in the solvent system n-hexane/EtOAc/ACN/H2O (HterAcWat) 8:2:8:2, in descending mode (reversed phase elution order), with a flow rate of 4.0 mL/min at 800 rpm. UV detection was at 210 nm. The stationary phase retention volume ratio (Sf) was 0.77. The corresponding TLC fractogram was developed in the upper phase of HEMWat 9:1:9:1 and visualized with sulfuric acid and vanillin reagent upon heating. The NMR spectra of fractions CA through CP is found in Figures S18 and S19. The observed K values of CBN (5), Δ9-cis-THC (2b), Δ9-trans-THC (2a), and CBC (3) were 1.54, 2.65, 2.82, and 3.74 respectively.
A mixture of 6.6 mg cis- and 2.7 mg trans-Δ9-tetrahydrocannabinol was collected with nearly 100% recovery in fractions C-H and H-I (2.26 < K < 3.20) from the injected sample (Figure 4).
Figure 4.

THC (2) detection and quantitation in CPC combined fractions C & D (Figure 1) and HSCCC combined fractions C-I and C-H (Figure 3). The single and double asterisks denote the reference signals for the quantitation of Δ9-trans-THC (2a; H-10a at 3.1976 ppm) and Δ9-cis-THC (2b; H-10a at 3.5552 ppm), respectively.
Fractions C-K and C-L (3.26 < K < 4.37) contained enriched 3 (46.8%) with high recovery (93.5%; Figure 5). The fractions on the polar and nonpolar sides of the bands of 2 and 3 were analyzed for minor cannabinoids (Figures S18 and S19). A fraction on the polar side of 2 (1.37 < K < 1.76) contained cannabinol (CBN, 5) identified based on matching 1H and 13C NMR data (Figure S24).40
Figure 5.

Detection and quantitation of CBC (3) in CPC combined fractions C & D and E (Figure 1) and HSCCC combined fractions C-L and C-K (Figure 3). The asterisk marks the H-4 signal (6.6080 ppm) used for the quantification of 3.
The separation of polar cannabinoids from fraction I (5.90 < K < 8.27) was initiated with a partitioning study focusing on cannabigerol (CBG, 4) and cannabidivarin (CBDV, 6). Eight SSs from five families were evaluated (Table 3). Considering differential K values as suitable predictors of separation, only the HEMWat SS, among those tested, demonstrated a reasonable separation. The HEMWat 3:1:3:1 SS displayed a particularly good separation of 4 and 6, with a resolution factor of 1.4, and also resolving other components of unknown structure.
Table 3.
Systematic Search of an Optimized Solvent System for the Targeted Purification and Separation of Cannabigerol (CBG, 4) and Cannabidivarin (CBDV, 6).
| solvent system | solvent ratios | K value | |
|---|---|---|---|
| CBDV (6) | CBG (4) | ||
| DiMWat | 10:7:3 | 0.08 | 0.07 |
| terAcWat | 10:6:4 | 150 | 145 |
| HEMWat | 3:7:7:3 | 2.95 | 5.14 |
| HEMWat | 3:1:3:1 | 1.28 | 1.82 |
| HEMWat | 7:3:8:2 | 0.72 | 0.87 |
| HEMWat | 8:2:8:2 | 0.66 | 0.82 |
| HChMWat | 8:2:8:2 | 0.65 | 0.63 |
| HterAcWat | 8:2:8:2 | 0.44 | 0.53 |
Partitioning experiments were analyzed with UHPLC with UV detection (λ 273 nm; K = Cup/Clp; H = n-hexane, E = EtOAc, ter = methyl tert-butylether, Di = dichloromethane, Ch = chloroform, Ac = acetonitrile (ACN), M = MeOH, Wat = \H2O).
The smaller sample size (45.4 mg) and a desire for optimally resolved components indicated that HSCCC was an appropriate choice of instrument for separating this fraction I. Figure 6 shows that 4 and 5 were nearly fully separated. The test tubes were combined into 13 fractions (I-A to I-M).
Figure 6.
The HSCCC separation of 45.4 mg combined fraction I (Figure 1) in the solvent system n-hexane/EtOAc/MeOH/H2O (HEMWat) 3:1:3:1, in descending mode (reversed phase elution order), with a flow rate of 4.0 mL/min at 800 rpm. UV detection was at 210 nm. The stationary phase retention volume ratio was 0.89. The corresponding TLC fractogram was developed in the upper phase of HEMWat 9:1:9:1 and visualized with sulfuric acid and vanillin reagent upon heating. The NMR spectra of combined fractions IC through IM is found in Figures S20 and S21. The observed K values of 6, 4, and 1 were 1.29, 1.59 and 3.14, respectively.
Identification and quantitation of CBG (4) was performed for fractions I-J and I-I. The distinctive resonance of H-1’ resonating at 3.3903 ppm was used for the quantitation of 4 (Figure 7). Compound 6 (2.3 mg), in fraction I-H, was quantitated via qHNMR by its aromatic H-2 resonance at 5.5702 ppm (Figure 8). The hydrophilic end of the chromatogram (0 < K < 1.13) showed the presence of monoglycerides and diglycerides with unsaturated fatty acid esters (Figures S20 and S21).36
Figure 7.

Identification and quantification of CBG (4) in CPC combined fraction I (Figure 1) and HSCCC combined fractions I-J and I-I (Figure 6). The asterisk shows the distinctive signal of H-1’ resonating at 3.3903 ppm that was used for its quantification.
Figure 8.
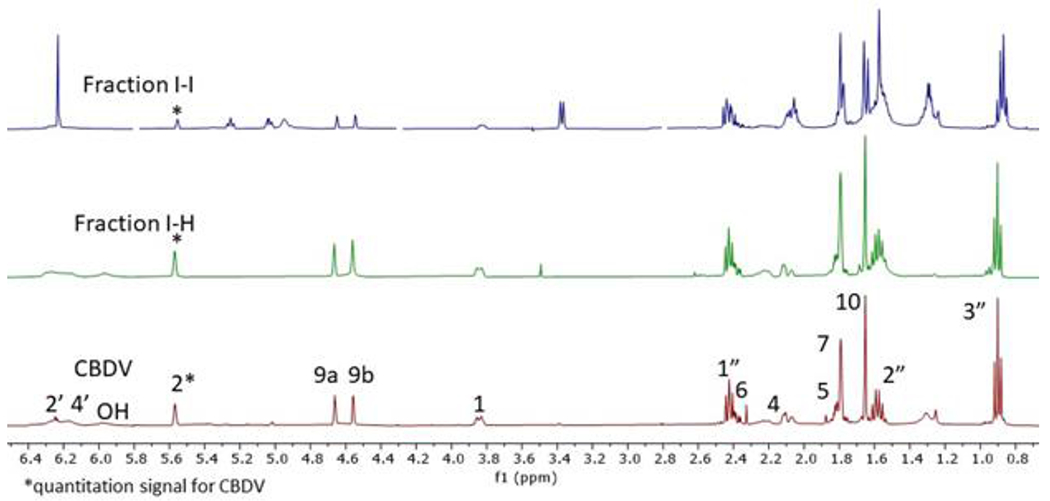
Detection and quantification of CBDV (6) in HSCCC combined fractions I-J and I-H (Figure 6). The asterisk marks the signal of H-2 at 5.5702 ppm used for quantitation.
Structural, QM-based, and Quantitative NMR Analysis.
For the analysis of complex matrices such as Cannabis preparations, qNMR has found increased use in measuring the amounts of individual small molecule components.26,27,33,41 In this context, complexity refers to the number of different chemical structures, the variability of the constituent polarities based on functional groups, the range of constituent molecular mass, and the dynamic range of constituent abundance. Interfering compounds are a challenge to all forms of quantitation, therefore, various sample preparation methods have been developed to “clean-up” samples before analysis. Sample processing invariably is based on the functional group and polarity characteristics. Issues relating to incomplete separations and/or loss of compounds of interest are a consideration for every method of sample preparation. NMR has the advantage of minimizing sample preparation and avoiding the use of reference standards for quantitation.
Involving quantum mechanics-based interpretation of 1H NMR spectra, HiFSA (1H iterative Full Spin Analysis) takes 1H NMR quantification a step further by exploiting the full potential of 1D 1H NMR data as it contributes towards definitive structural characterization, appropriate signal assignments, and enhanced quantification. In addition to identifying distinguished signals for quantitation, strategically placed hydrogens with multiple coupling partners may act as fingerprint descriptors of whole or partial spin systems. This can be used to great effect with the terpene moiety of cannabinoids. For example, between the resonances of H-2 and H-6 of 1, all hydrogens in the ten-carbon terpenoid ring system were represented. The vinyl proton, H-2, secluded at 5.5724 ppm was coupled to H-1 through 3J coupling, and the methylene H-4 and methyl H-7 groups by allylic 4J couplings (Figure S33). In addition, H-6 resonating at 2.4026 ppm was coupled to H-1 (3.8582 ppm, 10.28 Hz) and the methylene H-5 hydrogens via 3J couplings as well as to the pair of H-9 hydrogens via allylic 4J coupling.
Although representing a critical pair of separation in terms of their close polarity characteristics, 2a and 2b exhibited significant differences in their 1H NMR spectra. The positions of the two aromatic hydrogens were similar, but the vinyl hydrogen, H-10, was positioned at 6.2963 ppm in the trans vs. 6.2074 ppm in the cis isomer (Figures S5 and S6). The position of the H-10a resonance, shifted from 3.1976 ppm in the trans to 3.5552 ppm in the cis diastereomer, influenced by the modified magnetic environment associated with the chiral carbons. Another noticeable shift in ppm was between H8A/B in trans and cis (2.1624/2.1677 and 1.9943/1.9786 ppm, respectively). The H-10 to H-6a 3J coupling constant changed from 10.99 to 5.62 in 2a vs. 2b, respectively, reflecting the change in the dihedral angle (Figures S34 and S35).
The structural elucidation of 3 is under-reported in the literature. The article announcing its discovery in 1966 gave a partial assignment of 1H NMR values and no 13C NMR data.42 A subsequent article by Kane et al. gives complete 13C NMR assignments, but no 1H NMR data.42,43 Two synthesis articles report on a partial assignment of 1H NMR signals44 and 13C NMR data with no assignments.45 In this investigation, HSQC and HMBC were performed to discern correct 13C NMR assignments. The two aromatic carbons C-2 and C-4 may be difficult to assign because H-2 and H-4 only have each other as coupling partners. HSQC correlated 107.8414 and 6.1161 ppm for the CH-2 position and 109.2606 and 6.2530 ppm for the CH-4 position (Figure S12). Unfortunately, HMBC did not allow distinction between these two positions because they exhibit equidistant J-coupling paths to H-1” (2.4403 ppm), H-1’ (6.6080 ppm), and H-4 (6.1161 ppm) (Figure S13). A NOESY experiment was performed with 3 to ascertain the assignments for this critical resonance pair. The H-2 (6.1161 ppm) and H-4 (6.2530 ppm) signals both corresponded to H-1” (2.4403 ppm) and H-2” (1.5557 ppm), while only H-2 yielded a crosspeak with the H-1 (4.6221 ppm) alcohol (Figure S15). The two methylenes, C-5’ and C-4”, have similar chemical shifts in 13C NMR. HSQC correlated 22.8364 and 2.1052 ppm for the methylene 5’ position, and 22.6679 and 1.3046 ppm for the methylene 4” position. HMBC confirmed the 5’ position with a correlation between 22.8364 and 1.7225 ppm (H-4’B). HMBC also confirmed the 4” position with correlations of 22.6615 ppm with both 0.8842 ppm (H-5”) and 1.3046 ppm (H-3”). The assignments of the three “singlet” methyl groups should be performed carefully. HSQC correlated the 5.7927 and 1.6596 ppm (H-8’), 26.3661and 1.3782 ppm (H-9’), and 17.7348 and 1.5758 ppm (H-10’). HMBC confirmed the assignment for 9’ with a correlation between 26.3623 ppm (C-9’) and 5.4938 ppm (H-2’) as well as 41.053 ppm (C-4’) and 1.3782 ppm (H-9’). The NOESY experiment showed that the signal for H-9’ (1.3782 ppm) had a crosspeak with H-2’ (5.4938 ppm). In HMBC, the isopropylidene methyls 8’ and 10’ were correlated with each other, whereas 25.7927 ppm (C-10’) was correlated to 5.0956 ppm (H-6’). HIFSA indicated that the 4J couplings H-8’ and H-10’ with H-6’ were −0.93 and −0.27 Hz respectively. This may explain why the H-8’ signal is shorter than that of H-10’. The NOESY experiment showed that both H-8’ (1.6596 ppm) and H-10’ (1.5758 ppm) had cross peaks with H-5’ (2.1052 ppm). However, only H-8’ generated a crosspeak with H-6’ (5.0956 ppm).
The linear terpene chain of 4 was described by the fingerprint created by H-2’ (5.2701 ppm) and H-6’ (5.0528 ppm), both isolated signals that may have appeared as broad triplets (Figure S8). The vinyl hydrogen, H-2′, was coupled to the methylene H-1’ hydrogens through 3J coupling, and the methylene H-8’ and methyl H-9’ groups by allylic 4J couplings (Figure S37). The other vinyl hydrogen, H6’, was coupled to the methylene H-5’ through 3J coupling, and the pair of methyl groups H-8’ and H-10’ groups by allylic 4J couplings. In 4, the aromatic protons at H-2 and H-4 (6.2478 ppm) were equivalent due to the substitution symmetry of the ring. In regard to the assignments of the “singlet” methyl groups, the NOESY experiment showed that the H-9’ resonance at 1.8100 ppm corresponded strongly with that of H-1’ (3.3903 ppm), which is consistent for that position (Figure S15). However, neither the resonances designated as belonging to H-8’ (1.6760 ppm) nor H-10’ (1.5897 ppm) had any significant nOe cross peaks.
Understandably, 5 had very similar 1H NMR signals to its homolog, 1. Differences in chemical shift for hydrogens outside of the alkyl chains, except for H-1, were <9 ppb. The tertiary hydrogen, H-1, was shifted from 3.8582 ppm in 1 to 3.8420 in 5 (Figure S10). In the alkyl chain, the H-1” methylene hydrogens were shifted from 2.4358 ppm in 1 to 2.4265 ppm in 5. The alkyl chain hydrogens H-1”, H-2”, and H-5” in 1 resonated at nearly identical chemical shifts as H-1”, H-2”, and H-3” in 5, with very small yet characteristic chemical shift differences of 9.3, 29.5, and 23.3 ppb(!), respectively.
CONCLUSIONS
Liquid-liquid Methodology in Cannabinoid Analysis.
The methodology described in this study was applied to the identification and quantitation of six structurally distinct key cannabinoids in a representative “CBD Oil” product. The challenges posed by the overall chemical complexity of the sample with the overwhelming presence of fatty acid derivatives among the analyte population, the structural similarities of congeneric metabolites, and the large dynamic range of cannabinoid abundances, led to a multi-step separation approach based primarily on the polarity characteristics of the analytes. Fortunately, liquid-liquid methodologies ensured minimal sample loss during the process. Indeed, all observed recoveries were greater than 90%, indicating that practical handling and weighing of multiple relatively crude samples are the main analytical bottleneck and explanation for the deviation from the theoretical unity recovery which is achievable in CCS (see ref. 46 and references therein). Removal of most of the lipophilic matrix compounds was achieved with liquid-liquid separation in the first step, which showed a 6.9-fold enrichment of 1.
The second CPC step isolated the major cannabinoid 1 from the crude sample in a highly purified form, as 1 was the major cannabinoid, representing 4.5 m/m % of the “CBD oil”. With 1 effectively removed from the sample, the lower abundance cannabinoids were split into two separate bands representing congeners of lower vs. higher polarity than 1. Orthogonal re-chromatography of the lower polarity cannabinoids created purified fractions of trans-/cis-THC (2a/b) and 3. CBN (5) was detected in this fraction as well. Second step orthogonal chromatography of the polar fraction created purified fractions of 4 and 6. Collectively, the outcomes demonstrate that progressive fractionation with minimal sample loss allows the uncovering of low abundance cannabinoids not observed in previous fractions. Essentially, preparative separation and analytical methods must work hand-in-hand to address the challenges of recognizing, characterizing, and eventually isolating compounds of interest from complex matrices. Further purification of fractions from the initial CPC step were used to create small quantities of high purity reference compounds with HPLC. However, follow-up purification of fractions with countercurrent separation may also be used to isolate cannabinoids of interest with high recovery.
Paving the Way for Natural Cannabinoid DESIGNER Materials.
Not only are purified cannabinoids produced with CCS, but valuable knockout fractions are also obtained with relatively high selectivity (see chromatograms in Figures 1, 2 and 6, for the 1H NMR spectra of each fraction). Knock-out extracts are powerful tools for comprehensive biological activity studies, and the methodology described in this study may be seamlessly applied to the Depleting and Enriching Select Ingredients to Generate Normalized Extract Resources (DESIGNER) approach to advance a systematic and rational manner of separating components from biologically active source materials. DESIGNER methodology initiates the investigation of RC and permits the assessment of the potential therapeutic value of NPs, with the aid of the high-resolution capabilities of CCS.47–52 In contrast to single or few phytochemical-driven chromatographic fractionation, this approach makes an effort to account for all the components present in the original sample as the purification progresses.
The DESIGNER fractionation protocol is still directed at purification of target compounds, but with the additional requirement to minimize compound overlap between fractions and the goal to preserve and study overlapping components that constitute the RC of the target compounds. This contrasts with the practice of chromatographic “peak shaving” that yields high purity compounds (with their corresponding residual complexity) at the expense of overall recovery. As a result, complex fractions that may or may not contain additional low-abundance cannabinoids are not regarded as waste material but represent an integral part of chemical and pharmacological evaluation. Sample complexity, rather than being a nuisance to be “cleaned up”, becomes an opportunity to explore complex relationships between potentially biologically active components.
The Residual Complexity of CBD and Cannabinoids in General.
In a complex mixture, such as a Cannabis extract, it is highly unlikely that only a single compound has a particular biological activity, while all others including its congeners are essentially biologically inert. One notable finding of the present study is that the CBD-targeted “sorting” of cannabinoids by partition chromatography resolves five additional, structurally distinct cannabinoids within a narrow band of polarity. Collectively, the six cannabinoids (1-6) likely form a critical mixture and represent a prototypic case of Residual Complexity (go.uic.edu/residualcomplexity) that challenges non-orthogonal analytical protocols. Systematic searches for the most suitable CCS solvent systems led to their resolution in the present study.
The present findings also provide new insight that Residual Complexity is not necessarily restricted to the occurrence of closely related congeners (e.g., homologues such as 1 vs. 6), but can involve structural diversity, even within a greater compound class (e.g., 1 vs. 2-5 as cannabinoids). This makes Residual Complexity an essential consideration for emerging research on the biomedical properties of cannabinoids, which concomitantly increase the demand for preparative quantities of minor cannabinoids for biological evaluation. In addition, as natural sources continue to be a viable source for chiral analytes (such as cannabinoids 1, 2, 3, and 6), stereochemical identity and purity deserve attention.
The presented purification, QM-based identification, and analysis of CBD and five other, structurally diverse cannabinoids enables the systematic exploration of the SAR of Cannabis constituents. One example of such studies is our recent report regarding the SARS-CoV-2 antiviral potential of these cannabinoids.53
EXPERIMENTAL SECTION
Materials and Reagents.
As a representative of a widely marketed product, a “highly concentrated CBD oil containing 1,500+ mg cannabinoids per fluid ounce” was obtained from Bluebird Botanicals (Louisville, CO, USA). Samples were stored at −20 °C until analyzed. Deuterated chloroform was obtained from Cambridge Isotope Laboratories, Inc. (Andover, MA, USA). HPLC grade solvents and other chemicals were reagent grade from Sigma-Aldrich Inc. (St. Louis, MO, USA). All organic solvents were analytical grade, purchased from Pharmco-AAPER (Crookfield, CT, USA), and distilled before use. The external calibrant, dimethyl sulfone (Code N. 048–33,271; 99.9 % purity), was from Wako Pure Chemical Ind., Ltd. (Osaka, Japan).
CCS Instruments.
CPC employed a SCPC-250 (Armen Instrument, Saint Ave, France) chromatograph equipped with a 266 mL rotor containing 16 stacked disks with a total of 864 twin-cells. The total active volume was 210 mL, and the volume of the interconnecting ducts was 56 mL. The rotation speed could be adjusted from 500 to 3000 rpm, thus producing a g-force in the cells of up to 700 g. Samples were injected through a 20 mL sample loop. The solvents were pumped through a semi-preparative 4-way binary high-pressure pump (50 mL/min maximum flow rate, 150 bar maximum pressure). The detection was performed by a UV-Vis DAD detector at 210 and 254 nm. Fractions were collected with an Armen Fraction Collector LS-5600. Chromatographic data were acquired by using the Armen Glider CPC Control Software V2.9.2.9 and then transferred to an Excel worksheet for further processing.
For hydrodynamic countercurrent chromatography (HSCCC), a TBE-300C (Tauto Biotech Co., Shanghai, People’s Republic of China) instrument was used, consisting of three multilayer coil separation columns connected in series (1.9 mm tubing i.d.) to give a 280 mL total column volume, and equipped with a 20-mL sample loop. The revolution radius or the distance between the holder axis and the central axis of the centrifuge (R) was 5 cm, and the β values of the multilayer coil varied from 0.5 at the internal terminal to 0.8 at the external terminal (β = r/R where r is the distance from the edge of the coil to the holder shaft). The rotational speed of the apparatus could be regulated with a speed controller with a range of 0–1000 rpm. A Neslab RTE7 constant temperature-circulating bath (Thermo Fisher Scientific, Newington, NH, USA) was used to control the separation temperature within the range of 5–35 °C. The HSCCC system was equipped with a Teledyne SSI (State College, PA, USA) single-piston solvent pump, a Shimadzu (Columbia, MD, USA) SPD-10A VP dual wavelength UV–Vis detector, and a Pharmacia (Peapack, NJ, USA) LKB SuperFrac fraction collector. Data were recorded on a DATAQ Instruments Model DI-1100 (Akron, OH, USA) data logger and then transferred to an Excel worksheet for further processing.
General CCS Methodology.
The CCS systems were first filled with the stationary phase (20 mL/min for CPC, 5 mL/min for HSCCC). Next, the flow rate was adjusted to the experimental value and rotation initiated. The mobile phase was then pumped in the descending or head-to-tail direction through the column (10 mL/min for CPC, 4 mL/min for HSCCC). The sample was injected either before or after column equilibration had been achieved. The stationary phase volume retention ratio (Sf value) was measured either by the void volume (injection before equilibration) or by the graduated cylinder (injection after equilibration) method. Sweep elution followed by extrusion was initiated by pumping the upper phase. Fractions were collected in 15-mL (CPC) or 12-mL (HSCCC) volumes. The solvent present in the test tubes was evaporated with a Genevac miVac centrifugal concentrator (Genevac Ltd, Ipswich, Suffolk, UK) with the vacuum pressure and temperature adjusted to the particular solvent composition.
Sample Preparation.
CCS samples were dissolved in equal volumes of upper and lower phase to a total volume of about 15 mL, sonicated, and filtered (0.45 μm Millipore glass fiber syringe filter) before introduction into the sample loop.
For (q)NMR analysis, samples were dried, weighed on an analytical balance, and dissolved in 600 μL CDCl3, precisely measured with a VICI Pressure-Lok precision analytical syringe (Valco Instruments, Baton Rouge, LA, USA). Samples were placed in 5 mm Norell NMR tubes (Morganton, NC USA) and analyzed at 298.16 K.
Thin-Layer Chromatography.
Collected fractions were dried and analyzed by TLC (mobile phase: upper phase of n-hexane/EtOAc/MeOH/H2O 9:1:9:1). TLC plates were Macherey-Nagel Alugram SIL G/UV254 10 × 20 cm, with 0.2 mm silica gel layer thickness (Easton, PA, USA). The chromatograms were visualized under visible light, and at 254 nm and 360 nm UV light without chemical derivatization. The chromatograms were then sprayed with vanillin in sulfuric acid, heated, and visualized under visible light.
Ultra-High Performance Liquid Chromatography.
UHPLC-UV analysis was performed on a Shimadzu (Kyoto, Japan) Nexera system equipped with a DAD and employed a Phenomenex 1.7 µm XB-C18 column (50 mm × 2.1 mm). A Shimadzu LabSolutions software package was used for data analysis. Cannabinoids were separated with a H2O (0.1% formic acid) and ACN (0.1% formic acid) gradient. Starting with 5% ACN, the gradient was increased to 100 % ACN over 18 minutes. Preferred detection wavelengths were 210 and 273 nm. Semipreparative HPLC was performed on a Shimadzu HPLC (Kyoto, Japan) connected to a DAD detector (Shimadzu, model SPD-20A) and equipped with a YMC-Pack ODS-AQ (250 × 10 mm, S-5, 12 nm). The mobile phase was 70% and 80% ACN for polar and nonpolar fractions respectively. The flow rate was 3.0 mL/min.
Selection of Biphasic Solvent Systems (SS).
The appropriate biphasic SS for the desired CCS separations were selected with the SS partitioning method to determine the partition coefficients (K values) of target cannabinoids. A sample containing the target cannabinoid(s) (~1 mg) was added to the pre-equilibrated two-phase SS (3 mL of each phase) at room temperature and thoroughly mixed. The upper and lower phases were separated, concentrated, and dissolved in 1 mL ACN. The resulting solutions were filtered through a 0.45 μm member and analyzed by HPLC with a 1 - 10 μL injection volume. K values were defined as K = AUCupper/AUClower, where AUC is the peak area for each analyte.
Quantitative 1H NMR (qHNMR) Spectroscopic Analysis.
The NMR spectra were acquired on a JEOL (Jeol Resonance Inc., Peabody, MA, USA) ECZ 400 MHz spectrometer. A total of 64 scans (NS) were acquired, collecting 64 k of time domain (TD) data, and using a 90-degree excitation pulse as well as a relaxation delay (D1) of 60 sec. Post-acquisition processing was performed with JEOL Delta v5.3.1 and MestReNova. Zero-filling was applied to 512 k prior to Fourier transformation of the FID. Line shape and resolution were improved with a mild Gaussian-Lorentzian window function (LB −0.1, GF 0.01). Phase correction was implemented manually, and baseline correction used a 5th order polynomial function. Integrals were used as default quantitative measures. Residual chloroform served as chemical shift reference (7.2600 ppm).
Absolute qHNMR quantitation of the cannabinoids was performed using the EC-qHNMR method with dimethyl sulfone (DMSO2) as an external calibrant.54,55 A calibration curve was constructed with DMSO2 concentrations of 5.335, 2.315, and 32.573 mM in 600 μL CDCl3 (Figure S32).
1H Iterative NMR Full Spin Analysis (HiFSA).
The QM-HiFSA calculations were carried out using CT (Cosmic Truth) NMR spin simulation software (NMR Solutions, Kuopio, Finland). The processed (referencing residual chloroform, zero fill, manual phasing, and baseline correction) and resolution-enhanced 1H NMR spectra were imported into CT as JCAMP-DX files. A three-dimensional model of each molecule was imported into CT as a *.mol file after being built and geometry optimized in ChemDraw 3D. The 1H NMR parameters in CDCl3 were predicted and matched to the experimental spectrum. After a manual examination of the 1H NMR assignments, the calculated 1H NMR chemical shifts, signal line widths, and J-couplings were refined until an agreement between the observed and simulated spectra was reached (iteration convergence) to yield the HiFSA fingerprint (Table S33 to S39).
Supplementary Material
ACKNOWLEDGMENTS
This research was partially supported by NCCIH and ODS of the NIH through grant U41 AT008706. The authors are grateful to the greater CENAPT team for valuable discussions and general help with laboratory procedures. The authors also wish to acknowledge the excellent CPC support from Gregoire Audo, of Armen Instruments, Saint Ave, France and Gilson Inc., Middleton (WI); the extensive technical and CCS knowledge provided by Samuel Pro of Wrightwood Technologies Inc., Chicago (IL); the kind technical support by Tommy Li Deng of Tauto Biotech, Shanghai, People’s Republic of China; the expert NMR operational support from Ashok Krishnaswami, JEOL Resonance Inc., Peabody (MA), as well as the valuable JEOL hardware support; the advice regarding quantum mechanical NMR analysis from Matthias Niemitz of NMR Solutions, Kuopio, Finland. Finally, we are grateful to Jonathan Bisson (UIC), Anton Bzhelyansky (USP), Jayme Dahlin (NIH), James Graham (UIC), Kathryn Nelson (UofMN), Charlotte Simmler (UIC), and Michael Walters (UofMN) for fruitful and inspiring discussions of the extended “cannabinoid” topic.
Footnotes
Supporting Information
The Supporting Information is available free of charge at the ACS Publications website at DOI: [ACS will insert]
The original NMR data (FIDs) of the spectra in the figures are made available at DOI:10.7910/DVN/EYIWJQ. [activation pending manuscript acceptance; private access for editors and reviewers provided at https://dataverse.harvard.edu/privateurl.xhtml?token=4baa2577-2170-4d5b-92b0-b77c3f1c9775]
The authors declare no competing financial interests.
Contributor Information
Takashi Ohtsuki, Pharmacognosy Institute, Center for Natural Product Technologies (CENAPT), and Department of Pharmaceutical Sciences, College of Pharmacy, University of Illinois at Chicago, Chicago, Illinois 60612, United States; and Department of Food Bioscience and Biotechnology, College of Bioresource Sciences, Nihon University, Fujisawa, Kanagawa, Japan.
J. Brent Friesen, Pharmacognosy Institute, Center for Natural Product Technologies (CENAPT), and Department of Pharmaceutical Sciences, College of Pharmacy, University of Illinois at Chicago, Chicago, Illinois 60612, United States; and Department of Physical Sciences, Rosary College of Arts and Sciences, Dominican University, River Forest, Illinois 60305, United States.
Shao-Nong Chen, Pharmacognosy Institute, Center for Natural Product Technologies (CENAPT), and Department of Pharmaceutical Sciences, College of Pharmacy, University of Illinois at Chicago, Chicago, Illinois 60612, United States.
James B. McAlpine, Pharmacognosy Institute, Center for Natural Product Technologies (CENAPT), and Department of Pharmaceutical Sciences, College of Pharmacy, University of Illinois at Chicago, Chicago, Illinois 60612, United States.
Guido F. Pauli, Pharmacognosy Institute, Center for Natural Product Technologies (CENAPT), and Department of Pharmaceutical Sciences, College of Pharmacy, University of Illinois at Chicago, Chicago, Illinois 60612, United States.
REFERENCES
- (1).Whiting PF; Wolff RF; Deshpande S; Di Nisio M; Duffy S; Hernandez AV; Keurentjes JC; Lang S; Misso K; Ryder S; Schmidlkofer S; Westwood M; Kleijnen J Cannabinoids for Medical Use: A Systematic Review and Meta-Analysis. JAMA 2015, 313 (24), 2456–2473. [DOI] [PubMed] [Google Scholar]
- (2).Nelson KM; Bisson J; Singh G; Graham JG; Chen S-N; Friesen JB; Dahlin JL; Niemitz M; Walters MA; Pauli GF The Essential Medicinal Chemistry of Cannabidiol (CBD). J. Med. Chem 2020, 63 (21), 12137–12155. [DOI] [PMC free article] [PubMed] [Google Scholar]
- (3).Brunetti P; Lo Faro AF; Pirani F; Berretta P; Pacifici R; Pichini S; Busardò FP Pharmacology and Legal Status of Cannabidiol. Ann. Ist. Super. Sanita 2020, 56 (3), 285–291. [DOI] [PubMed] [Google Scholar]
- (4).Sarma ND; Waye A; ElSohly MA; Brown PN; Elzinga S; Johnson HE; Marles RJ; Melanson JE; Russo E; Deyton L; Hudalla C; Vrdoljak GA; Wurzer JH; Khan IA; Kim N-C; Giancaspro GI Cannabis Inflorescence for Medical Purposes: USP Considerations for Quality Attributes. J. Nat. Prod 2020, 83 (4), 1334–1351. [DOI] [PubMed] [Google Scholar]
- (5).Mechoulam R; Gaoni Y Recent Advances in the Chemistry of Hashish. Fortschr. Chem. Org. Naturst 1967, 25, 175–213. [DOI] [PubMed] [Google Scholar]
- (6).Mechoulam R; Shvo Y Hashish. I. The Structure of Cannabidiol. Tetrahedron 1963, 19 (12), 2073–2078. [DOI] [PubMed] [Google Scholar]
- (7).Citti C; Pacchetti B; Vandelli MA; Forni F; Cannazza G Analysis of Cannabinoids in Commercial Hemp Seed Oil and Decarboxylation Kinetics Studies of Cannabidiolic Acid (CBDA). J. Pharm. Biomed. Anal 2018, 149, 532–540. [DOI] [PubMed] [Google Scholar]
- (8).Citti C; Linciano P; Panseri S; Vezzalini F; Forni F; Vandelli MA; Cannazza G Cannabinoid Profiling of Hemp Seed Oil by Liquid Chromatography Coupled to High-Resolution Mass Spectrometry. Front. Plant Sci 2019, 10, 120. [DOI] [PMC free article] [PubMed] [Google Scholar]
- (9).Ross SA; Mehmedic Z; Murphy TP; Elsohly MA GC-MS Analysis of the Total delta9-THC Content of Both Drug- and Fiber-Type Cannabis Seeds. J. Anal. Toxicol 2000, 24 (8), 715–717. [DOI] [PubMed] [Google Scholar]
- (10).Ramirez CL; Fanovich MA; Churio MS Cannabinoids: Extraction Methods, Analysis, and Physicochemical Characterization; Studies in Natural Products Chemistry; Elsevier, 2019; Vol. 61, pp 143–173. [Google Scholar]
- (11).Addo PW; Desaulniers Brousseau V; Morello V; MacPherson S; Paris M; Lefsrud M Cannabis Chemistry, Post-Harvest Processing Methods and Secondary Metabolite Profiling: A Review. Ind. Crops Prod 2021, 170 (113743), 113743. [Google Scholar]
- (12).Rovetto LJ; Aieta NV Supercritical Carbon Dioxide Extraction of Cannabinoids from Cannabis sativa L. J. Supercrit. Fluids 2017, 129, 16–27. [Google Scholar]
- (13).Paul. How to Crystallize CBD - Make CBD Isolate https://brinstrument.com/blog/cannabis-distillation/how-to-crystallize-cbd-make-cbd-isolate/ (accessed Feb 27, 2020).
- (14).Ko RD Cannabinoid Extraction Process and System. 9987567, June 5, 2018. [Google Scholar]
- (15).Adams R; Cain CK; McPhee WD; Wearn RB Structure of Cannabidiol. XII. Isomerization to Tetrahydrocannabinols1. J. Am. Chem. Soc 1941, 63 (8), 2209–2213. [Google Scholar]
- (16).Mechoulam R; Hanuš L Cannabidiol: An Overview of Some Chemical and Pharmacological Aspects. Part I: Chemical Aspects. Chem. Phys. Lipids 2002, 121 (1-2), 35–43. [DOI] [PubMed] [Google Scholar]
- (17).Citti C; Russo F; Linciano P; Strallhofer SS; Tolomeo F; Forni F; Vandelli MA; Gigli G; Cannazza G Origin of Δ-Tetrahydrocannabinol Impurity in Synthetic Cannabidiol. Cannabis Cannabinoid Res 2021, 6 (1), 28–39. [DOI] [PMC free article] [PubMed] [Google Scholar]
- (18).Popovic A; Morelato M; Roux C; Beavis A Review of the Most Common Chemometric Techniques in Illicit Drug Profiling. Forensic Sci. Int 2019, 302, 109911. [DOI] [PubMed] [Google Scholar]
- (19).Pacifici R; Marchei E; Salvatore F; Guandalini L; Busardò FP; Pichini S Evaluation of Cannabinoids Concentration and Stability in Standardized Preparations of Cannabis Tea and Cannabis Oil by Ultra-High Performance Liquid Chromatography Tandem Mass Spectrometry. Clin. Chem. Lab. Med 2017, 55 (10), 1555–1563. [DOI] [PubMed] [Google Scholar]
- (20).Pacifici R; Marchei E; Salvatore F; Guandalini L; Busardò FP; Pichini S Stability of Cannabinoids in Cannabis FM1 Flowering Tops and Oil Preparation Evaluated by Ultra-High Performance Liquid Chromatography Tandem Mass Spectrometry. Clin. Chem. Lab. Med 2019, 57 (7), e165–e168. [DOI] [PubMed] [Google Scholar]
- (21).Seccamani P; Franco C; Protti S; Porta A; Profumo A; Caprioglio D; Salamone S; Mannucci B; Merli D Photochemistry of Cannabidiol (CBD) Revised. A Combined Preparative and Spectrometric Investigation. J. Nat. Prod 2021, 84 (11), 2858–2865. [DOI] [PMC free article] [PubMed] [Google Scholar]
- (22).Chadwick LR; Fong HHS; Farnsworth NR; Pauli GF CCC Sample Cutting for Isolation of Prenylated Phenolics from Hops. J. Liq. Chromatogr. Relat. Technol 2005, 28 (12-13), 1959–1969. [Google Scholar]
- (23).Peschel W; Politi M 1H NMR and HPLC/DAD for Cannabis sativa L. Chemotype Distinction, Extract Profiling and Specification. Talanta 2015, 140, 150–165. [DOI] [PubMed] [Google Scholar]
- (24).Choi YH; Kim HK; Hazekamp A; Erkelens C; Lefeber AWM; Verpoorte R Metabolomic Differentiation of Cannabis sativa Cultivars Using 1H NMR Spectroscopy and Principal Component Analysis. J. Nat. Prod 2004, 67 (6), 953–957. [DOI] [PubMed] [Google Scholar]
- (25).Nagy DU; Cianfaglione K; Maggi F; Sut S; Dall’Acqua S Chemical Characterization of Leaves, Male and Female Flowers from Spontaneous Cannabis (Cannabis sativa L.) Growing in Hungary. Chem. Biodivers 2019, 16 (3), e1800562. [DOI] [PubMed] [Google Scholar]
- (26).Barthlott I; Scharinger A; Golombek P; Kuballa T; Lachenmeier DW A Quantitative 1H NMR Method for Screening Cannabinoids in CBD Oils. Toxics 2021, 9 (6), 136. [DOI] [PMC free article] [PubMed] [Google Scholar]
- (27).Siciliano C; Bartella L; Mazzotti F; Aiello D; Napoli A; De Luca P; Temperini A 1H NMR Quantification of Cannabidiol (CBD) in Industrial Products Derived from Cannabis Sativa L. (hemp) Seeds. IOP Conf. Ser. Mater. Sci. Eng 2019, 572, 012010. [Google Scholar]
- (28).Wang X; Harrington P. de B.; Baugh SF Comparative Study of NMR Spectral Profiling for the Characterization and Authentication of. J. AOAC Int 2017, 100 (5), 1356–1364. [DOI] [PubMed] [Google Scholar]
- (29).Marchetti L; Brighenti V; Rossi MC; Sperlea J; Pellati F; Bertelli D Use of C-qNMR Spectroscopy for the Analysis of Non-Psychoactive Cannabinoids in Fibre-Type Cannabis sativa L. (Hemp). Molecules 2019, 24 (6), 1138. [DOI] [PMC free article] [PubMed] [Google Scholar]
- (30).Phansalkar RS; Simmler C; Bisson J; Chen S-N; Lankin DC; McAlpine JB; Niemitz M; Pauli GF Evolution of Quantitative Measures in NMR: Quantum Mechanical qHNMR Advances Chemical Standardization of a Red Clover (Trifolium pratense) Extract. J. Nat. Prod 2017, 80 (3), 634–647. [DOI] [PMC free article] [PubMed] [Google Scholar]
- (31).Full-Spectrum CBD Oil for Sale | Bluebird Botanicals Hemp Classic 6x https://bluebirdbotanicals.com/products/hemp-classic-6x (accessed Mar 11, 2020).
- (32).Korte F; Sieper H Zur Chemischen Klassifizierung von Pflanzen, XX Isolierung von Haschisch-Inhaltsstoffen Aus Cannabis sativa non indica. Justus Liebigs Ann. Chem 1960, 630 (1), 71–83. [Google Scholar]
- (33).Hazekamp A; Simons R; Peltenburg-Looman A; Sengers M; van Zweden R; Verpoorte R Preparative Isolation of Cannabinoids from Cannabis sativa by Centrifugal Partition Chromatography. J. Liq. Chromatogr. Relat. Technol 2004, 27 (15), 2421–2439. [Google Scholar]
- (34).Popp JR; Petrakis EA; Angelis A; Halabalaki M; Bonn GK; Stuppner H; Skaltsounis LA Rapid Isolation of Acidic Cannabinoids from Cannabis sativa L. Using pH-Zone-Refining Centrifugal Partition Chromatography. J. Chromatogr. A 2019, 1599, 196–202. [DOI] [PubMed] [Google Scholar]
- (35).Approach for Simultaneous Cannabidiol Isolation and Pesticide Removal from Hemp Extracts with Liquid-Liquid Chromatography. Ind. Crops Prod 2020, 155, 112726. [Google Scholar]
- (36).Nieva-Echevarría B; Goicoechea E; Manzanos MJ; Guillén MD A Method Based on 1H NMR Spectral Data Useful to Evaluate the Hydrolysis Level in Complex Lipid Mixtures. Food Res. Int 2014, 66, 379–387. [Google Scholar]
- (37).Leizer C; Ribnicky D; Poulev A; Dushenkov S; Raskin I The Composition of Hemp Seed Oil and Its Potential as an Important Source of Nutrition. J. Nutraceut. Funct. Med. Foods 2000, 2 (4), 35–53. [Google Scholar]
- (38).Schafroth MA; Zuccarello G; Krautwald S; Sarlah D; Carreira EM Stereodivergent Total Synthesis of Δ9-Tetrahydrocannabinols. Angew. Chem. Int. Ed Engl 2014, 53 (50), 13898–13901. [DOI] [PubMed] [Google Scholar]
- (39).Hazekamp A; Choi YH; Verpoorte R Quantitative Analysis of Cannabinoids from Cannabis Sativa Using 1H-NMR. Chem. Pharm. Bull 2004, 52 (6), 718–721. [DOI] [PubMed] [Google Scholar]
- (40).Choi YH; Hazekamp A; Peltenburg-Looman AMG; Frédérich M; Erkelens C; Lefeber AWM; Verpoorte R NMR Assignments of the Major Cannabinoids and Cannabiflavonoids Isolated from Flowers of Cannabis sativa. Phytochem. Anal 2004, 15 (6), 345–354. [DOI] [PubMed] [Google Scholar]
- (41).Happyana N; Kayser O Monitoring Metabolite Profiles of Cannabis Sativa L. Trichomes during Flowering Period Using 1H NMR-Based Metabolomics and Real-Time PCR. Planta Med. 2016, 82 (13), 1217–1223. [DOI] [PubMed] [Google Scholar]
- (42).Gaoni Y; Mechoulam R Cannabichromene, a New Active Principle in Hashish. Chem. Commun 1966, No. 1, 20. [Google Scholar]
- (43).Kane VV; Martin AR; Peters JA; Crews P Carbon-13 Nuclear Magnetic Resonance Spectra of Cannabichromene, Cannabicitran, and Cannabicyclol and Their Analogs. J. Org. Chem 1984, 49 (10), 1793–1796. [Google Scholar]
- (44).Cardillo G; Cricchio R; Merlini L Synthesis of D,l-Cannabichromene, Franklinone and Other Natural Chromenes. Tetrahedron 1968, 24 (13), 4825–4831. [Google Scholar]
- (45).Lee YR; Wang X Concise Synthesis of Biologically Interesting (.+−.)-Cannabichromene, (.+−.)-Cannabichromenic Acid, and (.+−.)-Daurichromenic Acid. ChemInform 2006, 37 (16). 10.1002/chin.200616210. [DOI] [Google Scholar]
- (46).Malca-Garcia GR; Liu Y; Nikolić D; Friesen JB; Lankin DC; McAlpine JB; Chen S-N; Pauli GF Investigation of Red Clover (Trifolium pratense) Isoflavonoid Residual Complexity by off-Line CCS-qHNMR. Fitoterapia 2021, 105016. [DOI] [PMC free article] [PubMed] [Google Scholar]
- (47).Yu Y; Simmler C; Kuhn P; Poulev A; Raskin I; Ribnicky D; Floyd ZE; Pauli GF The DESIGNER Approach Helps Decipher the Hypoglycemic Bioactive Principles of (Russian Tarragon). J. Nat. Prod 2019, 82 (12), 3321–3329. [DOI] [PMC free article] [PubMed] [Google Scholar]
- (48).Dietz BM; Chen S-N; Alvarenga RFR; Dong H; Nikolić D; Biendl M; van Breemen RB; Bolton JL; Pauli GF DESIGNER Extracts as Tools to Balance Estrogenic and Chemopreventive Activities of Botanicals for Women’s Health. J. Nat. Prod 2017, 80 (8), 2284–2294. [DOI] [PMC free article] [PubMed] [Google Scholar]
- (49).Chen S-N; Turner A; Jaki BU; Nikolic D; van Breemen RB; Friesen JB; Pauli GF An Experimental Implementation of Chemical Subtraction. J. Pharm. Biomed. Anal 2008, 46 (4), 692–698. [DOI] [PMC free article] [PubMed] [Google Scholar]
- (50).Malca Garcia GR; Friesen JB; Liu Y; Nikolić D; Lankin DC; McAlpine JB; Chen S-N; Pauli GF Preparation of DESIGNER Extracts of Red Clover (Trifolium pratense L.) by Centrifugal Partition Chromatography. J. Chromatogr. A 2019, 1605, 360277. [DOI] [PMC free article] [PubMed] [Google Scholar]
- (51).Ramos Alvarenga RF; Friesen JB; Nikolić D; Simmler C; Napolitano JG; van Breemen R; Lankin DC; McAlpine JB; Pauli GF; Chen S-N K-Targeted Metabolomic Analysis Extends Chemical Subtraction to DESIGNER Extracts: Selective Depletion of Extracts of Hops (Humulus Lupulus). J. Nat. Prod 2014, 77 (12), 2595–2604. [DOI] [PMC free article] [PubMed] [Google Scholar]
- (52).Friesen JB; Brent Friesen J; Liu Y; Chen S-N; McAlpine JB; Pauli GF Selective Depletion and Enrichment of Constituents in “Curcumin” and Other Curcuma longa Preparations. J. Nat. Prod 2019, 82 (3), 621–630. [DOI] [PMC free article] [PubMed] [Google Scholar]
- (53).Nguyen LC; Yang D; Nicolaescu V; Best TJ; Ohtsuki T; Chen S-N; Friesen JB; Drayman N; Mohamed A; Dann C; Silva D; Gula H; Jones KA; Millis JM; Dickinson BC; Tay S; Oakes SA; Pauli GF; Meltzer DO; Randall G; Rosner MR Cannabidiol Inhibits SARS-CoV-2 Replication and Promotes the Host Innate Immune Response. bioRxiv 2021. 10.1101/2021.03.10.432967. [DOI] [Google Scholar]
- (54).Nishizaki Y; Lankin DC; Chen S-N; Pauli GF Accurate and Precise External Calibration Enhances the Versatility of Quantitative NMR (qNMR). Anal. Chem 2021, 93 (5), 2733–2741. [DOI] [PMC free article] [PubMed] [Google Scholar]
- (55).Pauli GF; Chen S-N; Simmler C; Lankin DC; Gödecke T; Jaki BU; Friesen JB; McAlpine JB; Napolitano JG Importance of Purity Evaluation and the Potential of Quantitative 1H NMR as a Purity Assay. J. Med. Chem 2014, 57 (22), 9220–9231. [DOI] [PMC free article] [PubMed] [Google Scholar]
Associated Data
This section collects any data citations, data availability statements, or supplementary materials included in this article.