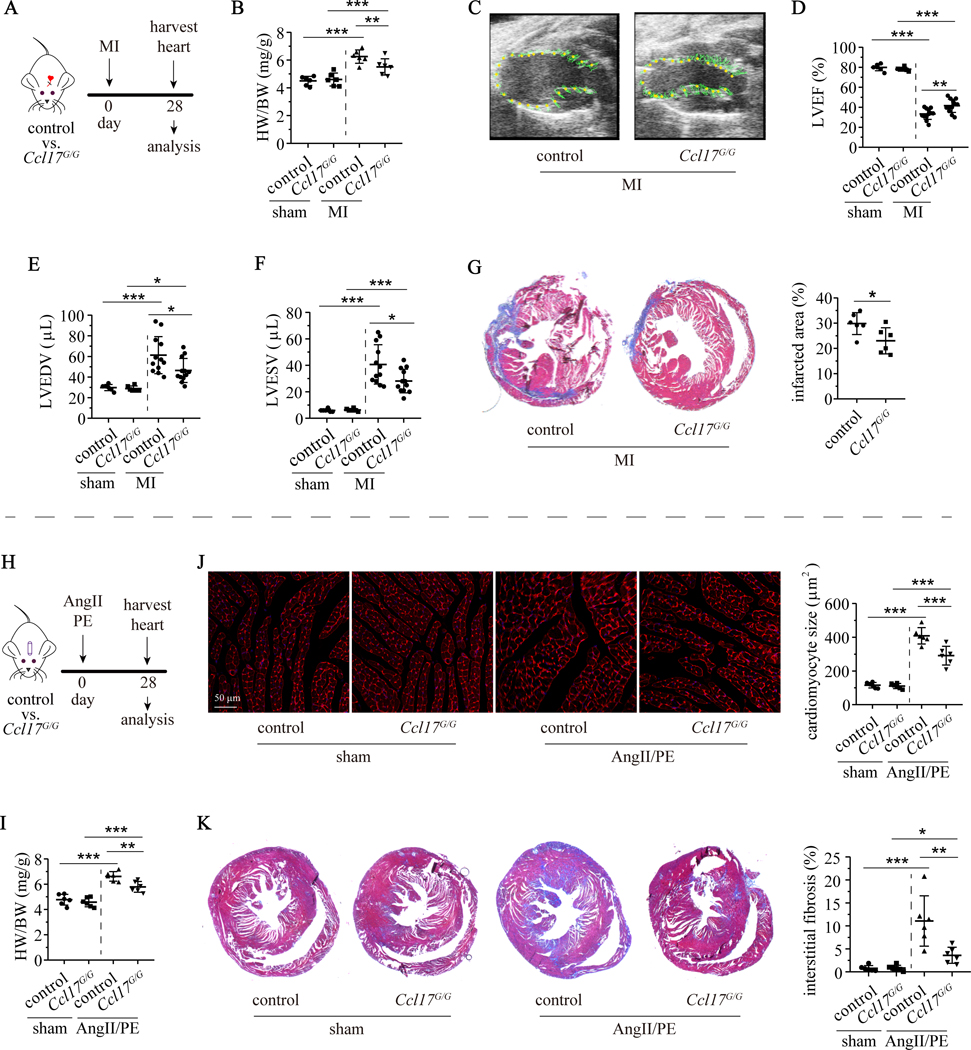
Figure 4. Deficiency of Ccl17 attenuates LV remodeling following MI and AngII/PE infusion.
A, Control (Ccl17+/+) mice and Ccl17 knockout (Ccl17GFP/GFP, abbreviated as Ccl17G/G) mice were subjected to closed-chest IR injury or sham surgery on day 0. Hearts were harvested on day 28 after MI. B, Measurement of heart weight to body weight ratio (HW/BW) in control and Ccl17G/G mice following sham surgery (n=6) or MI (n=12). C, Representative end systolic echocardiographic images of control and Ccl17G/G hearts 28 days after MI. Regional LV displacement throughout the cardiac cycle is displayed. D-F, Quantification of LV ejection fraction (LVEF), LV end-diastolic volume (LVEDV) and LV end-systolic volume (LVESV) 28 days after IR surgery. G, Representative images of infarct area identified by trichrome staining (left panel). Quantification of infarct area (right panel). H, Control and Ccl17G/G mice were implanted with osmotic minipumps containing AngII/PE (n=6) or normal saline (sham, n=6) on day 0. Hearts were harvested on day 28 for analysis. I, Measurement of heart weight to body weight ratio (HW/BW) in control and Ccl17G/G mice implanted with osmotic minipumps containing AngII/PE or saline (sham). J, Represent WGA stained images (mid-LV) showing cardiomyocytes in cross-section (red, left panel) and quantification of cardiomyocyte cross-sectional area (right panel). K, Representative low magnification trichrome staining images to visualize interstitial fibrosis (left panel). Quantification of fibrotic area based on trichrome staining (right panel). All data are mean ± SD. For comparisons between two groups, unpaired t test was performed. For multiple comparisons, two-way ANOVA with Geisser-Greenhouse correction followed by Sidak test was performed. *P< 0.05, **P< 0.01, ***P< 0.001.

