

Abstract
The organization of microtubules (MTs) is critical for cells during interphase and mitosis. During mitotic spindle assembly, MTs are made and organized around chromosomes in a process regulated by RanGTP. The role of RanGTP has been explored in Xenopus egg extracts, which are not limited by a cell membrane. Here, we investigated whether cell-sized confinements affect the assembly of RanGTP-induced MT networks in Xenopus egg extracts. We used microfluidics to encapsulate extracts within monodisperse extract-in-oil droplets. Importantly, we find that the architecture of Ran-induced MT networks depends on the droplet diameter and the Ran concentration, and differs from structures formed in bulk extracts. Our results highlight that both MT nucleation and physical confinement play critical roles in determining the spatial organization of the MT cytoskeleton.
Introduction
In the course of the cell cycle, a variety of morphological events occur, which are guided by cytoskeletal filaments confined within the cell. A key event in the proliferation of eukaryotic cells is the assembly of the mitotic spindle, which ensures the equal partitioning of chromosomes during cell division.1 Central to spindle assembly is the formation and spatial organization of MTs. Chromosomal MT generation is important in centrosomal spindle formation and even more critical in cells that do not contain centrosomes, such as plant cells and meiotic egg cells in animals.2,3 A key regulator of chromosomal MT nucleation is the protein RanGTP,4–9 which surrounds chromosomes in the form of a gradient.1,10 The RanGTP gradient is generated by the chromatin-bound guanine nucleotide exchange factor RCC1 and the GTPase-activating protein RanGAP residing in the cytoplasm.5,7 RanGTP releases spindle-assembly factors from their sequestration and inhibition by importins. Spindle assembly factors subsequently facilitate MT formation and spindle organization. A direct connection between RanGTP and MT nucleation could be established via the spindle-assembly factor TPX2, which stimulates branching MT nucleation and generates spindle MTs.1,11,12 RanGTP’s role as an upstream regulator of spindle assembly is apparent. Upon its addition to metaphase-arrested Xenopus egg extracts, RanGTP drives the MT assembly into polar MT networks.5,7 Some of these MT networks have been described as “Ran mini spindles,” although their exact architecture shows a large variation across previous studies.4–8 This motivated us to examine how the architecture of Ran-induced MT networks is determined.
While studies in Xenopus egg extracts are often conducted in bulk, the influence of extract confinement has mostly been studied with MTs stabilized with Taxol. The addition of Taxol to bulk Xenopus egg extracts induces the formation of MT asters.13,14 Further enclosure by droplets of increasing sizes changed the final architecture of taxol MT networks to contractile networks, cortical bundles, vortices, and asters.15,16 For example, encapsulated Taxol-containing extract with a droplet diameter of 100 μm drove the formation of MT networks with a vortex structure.17 When confined in a rectangular microfluidic channel with a minimum length scale of 100 μm, MT asters in the presence of Taxol can merge and assemble into a contractile network.18
Independently, physical confinement also affects the organization of MTs with purified components. Encapsulating purified tubulin in the presence of GTP and motors in either microchambers or droplets leads to different MT structures depending on confinement size: at a small confinement size, MTs bent and formed bundles close to the confinement periphery; at a larger confinement size, MTs formed asters by clustering MT ends under the action of motors.16,19,20 Most prior studies described above focused on stabilized MTs or MTs that were made from purified tubulin and dissected how they interacted in the presence of motors and within confinement. Yet, in a cell, MTs are neither stabilized nor generated spontaneously. Instead, they are nucleated from precise locations at the correct cell cycle stage and exhibit dynamic instability during their lifetime. Recently, a novel strategy was developed to locally induce MT nucleation via the aggregation of magnetic RanGTP nanoparticles in extract within droplets.21 This work inspired us to investigate how well-controlled confinement size and RanGTP concentration affect the assembly of MT networks.
Here, we examine the architecture of MT networks that nucleate dynamic MTs via the RanGTP nucleation pathway within cell-sized compartments, generated by encapsulating extract in monodisperse droplets via microfluidics. We reveal how confinement size and the concentration of the dominant active form of Ran, RanQ69L, regulates the assembly of MT networks. Our work highlights the prominent role of MT nucleation combined with cell-sized confinement during the self-organization of MTs.
Materials and methods
Xenopus egg extract preparation
Cytoplasmic extracts were prepared from unfertilized Xenopus laevis oocytes arrested in metaphase of Meiosis II, as previously described.22,23 The egg extracts were used within three hours of preparation.
RanQ69L expression and purification
N-Terminal strep-6xHis-TEV mTagBFP2 RanQ69L was cloned into the pST50 vector via Gibson Assembly (New England Biolabs). The plasmid was transformed into E. coli Rosetta2 cells (EMD Millipore) for protein expression. Cells (4 L) were grown until OD600 = 0.8 at 37 °C in LB media, and then protein expression was induced using 500 mM IPTG for 18 hours at 16 °C before cells were pelleted. RanQ69L was purified in the following manner:24,25 we lysed cells by using an Emulsiflex french press (Avestin) in binding buffer (100 mM Tris–HCl, 450 mM NaCl, 1 mM MgCl2, 1 mM EDTA, 2.5 mM PMSF, 6 mM BME, pH 8.75). We centrifuged the lysate at 20 000 × g and loaded the supernatant onto a StrepTrap HP column (GE Healthcare, 5 ml). Protein was eluted in binding buffer with 2.5 mM d-desthiobiotin, and dialyzed overnight into CSF-XB buffer (10 mM HEPES, 100 mM KCl, 1 mM MgCl2, 5 mM EGTA, 10% sucrose w/v, pH 7.7). We included 200 μM GTP in lysis and elution buffers and obtained about 0.5 ml of 200 μM RanQ69L.
Bulk assay preparation
In a 4 °C cold room, fresh metaphase-arrested egg extracts were supplemented with Alexa-647 labeled tubulin at 0.3 μM final concentration for all the experiments (PurSolutions, VA), and RanQ69L concentrations ([Ran]) of 5 μM, 10 μM, and 20 μM. We chose the minimum Ran concentration to be 5 μM, such that MT nucleation within a time course of 20 min would be observed, consistent with previous work.21
Experiments with unconfined extracts
We pipetted 10–15 μl of the bulk assay reaction mixture into a custom-made flow cell in a 4 °C cold room. We made the flow cell with a glass coverslip, two stripes of double-sided tape, and a glass slide. The length and width of the flow cell were about 2 cm and 0.5 cm, respectively. We estimated the height of the flow cell to be 200 μm based on the tape thickness. To image the unconfined extracts, we mounted the flow cell onto a confocal microscope at room temperature (20 °C). We set t =0 min when we transferred the flow cell (or microchannels) to room temperature. This time refers to reaction onset. Each figure indicates the time after reaction onset.
Microfluidic channel fabrication and droplet generation
To confine a cell-free extract, we used droplet microfluidics (Fig. 1a). We used standard soft lithographic techniques to fabricate the microchannel in poly(dimethylsiloxane) (PDMS).26 The microchannel was rendered hydrophobic by treatment with Aquapel (Pittsburgh, PA) to avoid the droplets wetting channel walls. We used Aquapel as provided. After bonding the microchannels, we filled the microchannels with Aquapel, let it sit for 1 min, and then flushed with air. This washing process left a thin hydrophobic coating on the microchannels’ interior surfaces.27 To further dry out excessive Aquapel and increase the channels’ bonding strength, we stored all Aquapel-treated microchannels in a 65 °C heated oven for at least 24 h before any experiments. After this step, the microchannels remained hydrophobic within their lifetime, i.e., until microchannel breakdown due to normal usage. The microchannel consists of two major parts: an upstream flow-focusing nozzle for generating monodisperse extract-in-oil droplets (Fig. 1b),28 a downstream chamber for collecting the droplets (Fig. 1c). The dispersed phase consisted of a mixture of fresh extracts, labeled tubulin, and Ran (see Bulk assay preparation).
Fig. 1.

Experimental setup. (a) A snapshot of the microchannel design. The blue dashed boxes in (a) highlight: (b) the upstream flow-focusing channel for generating monodisperse, extract-in-oil droplets; (c) the downstream chamber for collecting and imaging the droplets. (c) This wide-field image depicts the MT network architecture for D = 60 μm and [Ran] = 20 μM (same conditions as Fig. 4c) at time t = 14 min. (d) Schematics of a droplet confined in the microchannel, the definition of droplet diameter D calculated when the droplet is spherical, and the channel height H.
The continuous phase was hydrofluoroether HFE-7500 (3 M, St. Paul, MN) containing the non-ionic, PEG-based 008-FluoroSurfactant (2% w/w, RanBiotechnologies, USA). The surfactant prevents droplet coalescence by coating the droplet interface with a PEG layer, commonly used in droplet-based applications to minimize interactions between proteins and interfaces.20,29,30 We used syringe pumps (NewEra, NJ) to drive the flows in the microchannel. To vary the droplet size, we changed the volumetric flow rates of the dispersed and continuous phases. We characterized the droplet size by their diameter D, calculated when the droplets were spherical (Fig. 1d and ESI,† Note S1). The dispersity of the generated droplets was o5% by volume. We fabricated microchannels with various depths H, which was always smaller than the droplet diameter D. The droplets were thus entirely confined by the top and bottom walls of the microchannels and appeared in a disc shape (Fig. 1d). We summarized the detailed droplet sizes D, constriction widths W, microchannel depths H, and flow rates used for the droplet generation in ESI,† Table S1. For most droplet results (Fig. 1 to 4), the H/D ratio was kept constant at H/D ~ 0.8. To test the effect of droplet deformation on the MT networks (Fig. 5), we also tested H/D ~ 0.4 by reinjecting droplets with D = 110 μm into a shallow microchannel with H = 40 μm. We chilled all equipment and microchannels overnight before the experiments. We monitored the droplet generation process using a stereoscope in the 4 °C cold room. After sufficient droplets accumulated in the downstream chamber, we stopped the droplet generation immediately by unplugging the inlet tubing. We waited for 10 minutes in the 4 °C cold room until the flow ceased in the microchannel. We then moved the microchannel to the confocal microscope at room temperature (20 °C) for high-resolution imaging. We set t = 0 min when we transferred the microchannels to room temperature. This time refers to reaction onset. Each figure indicates the time after reaction onset. We took all confocal images at the midplane in the z-direction.
Fig. 4.

Aster MT networks. (a–d) Time-lapse confocal images showing the assembly of asters inside droplets. (e) Schematics showing the assembly of the asters. (f) Radon transform of the architectures at t = 7 min (top row) and t = 14 min (bottom row), respectively. (g) Frequency of occurrence of different architectures. We tracked 110 droplets to make the bar plot. Each color represents a specific MT network architecture shown below.
Fig. 5.

Using EB1 to interrogate MT densities in droplets. Ran concentrations drive MT numbers. (a and b) Representative confocal images in grayscale that show EB1 signals. The images were taken at t = 7 min for droplets with D = 60 μm. The Ran concentrations are: (a) [Ran] = 5 μM and (b) [Ran] = 10 μM. The bright spots correspond to the EB1 signal. The top panel is raw images, and the bottom panel is enhanced images after processing. At [Ran] = 10 μM, rather than uniformly distributed inside the droplet, most EB1 dots are localized, as highlighted by the white dashed circles. (c) The number of EB1 spots counted at t = 7 min. The error bars represent one standard deviation, each constructed by at least six different sets of experiments at the given test condition.
For the experiments in which motor activities were inhibited, we added either vanadate (NEB) or ciliobrevine (Sigma) in the bulk assay with [Ran] = 10 μM and generated droplets with D = 110 μm. The final concentrations of vanadate and ciliobrevin in those assays were 500 nM and 5 μM, respectively, which is also indicated in the caption of Fig. 6. The imaging methods and incubation times/time points for these motor inhibition experiments remained the same as in the other experiments and are indicated in the images and movies.
Fig. 6.

Effect of inhibiting motor activities and droplet deformation. (a and b) Effect of inhibiting motor proteins in confined extracts. The droplets have a diameter of 110 μm. (a) The concentration of vanadate in the droplets is 500 nM. (b) The concentration of ciliobrevin is 5 μM. (c–e) Time-lapse confocal images showing the assembly of MT networks in compressed droplets at three Ran concentrations: (c) 5 μM, (d) 10 μM, and (e) 20 μM. For the compressed droplet, H/D ~ 0.4. The grey background highlights the compressed-droplet cases. The size of the compressed droplets in (c–e) is the same as an uncompressed droplet with D = 110 μm.
Experiments with EB1
We added end-binding protein 1 (EB1) in bulk extract assays with [Ran] = 5 μM and [Ran] = 10 μM. We set the final concentration of EB1 to be 200 nM for all EB1 experiments. EB1 saturated at this concentration, ensuring all MTs were labeled. We proceeded to generate droplets with D = 60 μm and conducted imaging. With a spinning-disc confocal microscope, we took multiple time-lapse single-plane images. The data for counting EB1 consisted of 200 frames from multiple imaging sessions, where each session corresponded to one sample preparation at a specific test condition (Ran concentration and droplet size) and was imaged at a ~1 fps frame rate for 30 seconds from t = 7 min (see the “Experiments with unconfined extracts” section for the definition of t = 0).
To count the EB1 spots, we used ImageJ. We first conducted a rolling-ball background subtraction to remove background, suppress noise, and highlight EB1 signals. With the ImageJ TrackMate package, we then identified EB1 spots based on image intensity. We extracted the number of EB1 spots frame by frame for each test condition, which was used to calculated the average number of EB1 spots. For this analysis, we excluded any bright areas in which EB1 spots could not be resolved from one another. Thus, the total number of EB1 spots counted is an underestimate. Nevertheless, the trend of the measurable number of EB1 spots are useful to drive insights into the effect Ran concentration, as we shall discuss later.
Results
The architecture of MT networks differs when confined in a cell-shaped droplet
We sought to investigate the architecture, i.e., the 3D structure, of RanGTP-induced MT networks. We added RanQ69L, loaded with GTP that can no longer be hydrolyzed, to Xenopus egg extracts. We visualized the formation of MT networks via the addition of fluorescently labeled tubulin. Within 15 minutes, MTs self-organized into polar networks consisting of interconnected poles and MT bundles for the tested Ran concentrations ([Ran] = 5–20 μM Fig. 2a), as reported previously.5–7 Although the number and spatial distribution of the poles seemed to vary with Ran concentration, the MTs generally remained in polar networks for up to 40 minutes (ESI,† Fig. S1).
Fig. 2.

Unconfined MT networks and ring structure at small droplet size. (a) Confocal images showing MT networks (red) in unconfined extracts for Ran concentrations: 0 μM as a control, 5 μM, 10 μM, and 20 μM. The images were taken at time t = 14 min. The scale bar is associated with (a) only. (b and d) The assembly of ring-shaped MT networks in droplets with a diameter of D = 20 μm. The Ran concentration [Ran] ranges from (b) 5 μM, (c) 10 μM, to (d) 20 μM. (e) A schematic representing the assembly processes of the ring architecture. (f) Frequency of occurrence of different architectures. We tracked 107 droplets to generate the plot. Each color represents a specific architecture as indicated below.
Next, we used time-lapse confocal microscopy to examine the assembly of Ran-induced MT networks in droplets. We generated the droplets via microfluidics (see Methods and Fig. 1), ranging from small to large droplet sizes (20–110 μM) that have previously been described for Xenopus cells.31,32 To our surprise, the Ran-induced MT networks differed significantly from the ones formed in bulk extracts when encapsulated in the round, finite droplets (Fig. 2b–d, 3a, b, and 4a–d, also see ESI,† Movies S1–S3). Interestingly, the architecture of primary MT networks formed within 15 minutes and remained unchanged overall. Beyond 15 minutes, we additionally observed the formation of independent, polar MT structures, which were a few orders of magnitude smaller than the primary MT networks and scattered throughout the droplets with D = 110 μm and ([Ran] = 10 μM) (ESI,† Fig. S2). Upon varying the droplet diameter and Ran concentration, most changes occurred in the larger, primary MT structures within the first 15 minutes. We thus define the “steady-state” (t = 14 minutes) as the time when MT networks have mostly completed the gross assembly and exhibited an architecture specific to their droplet size and droplet content, as reported below.
Fig. 3.
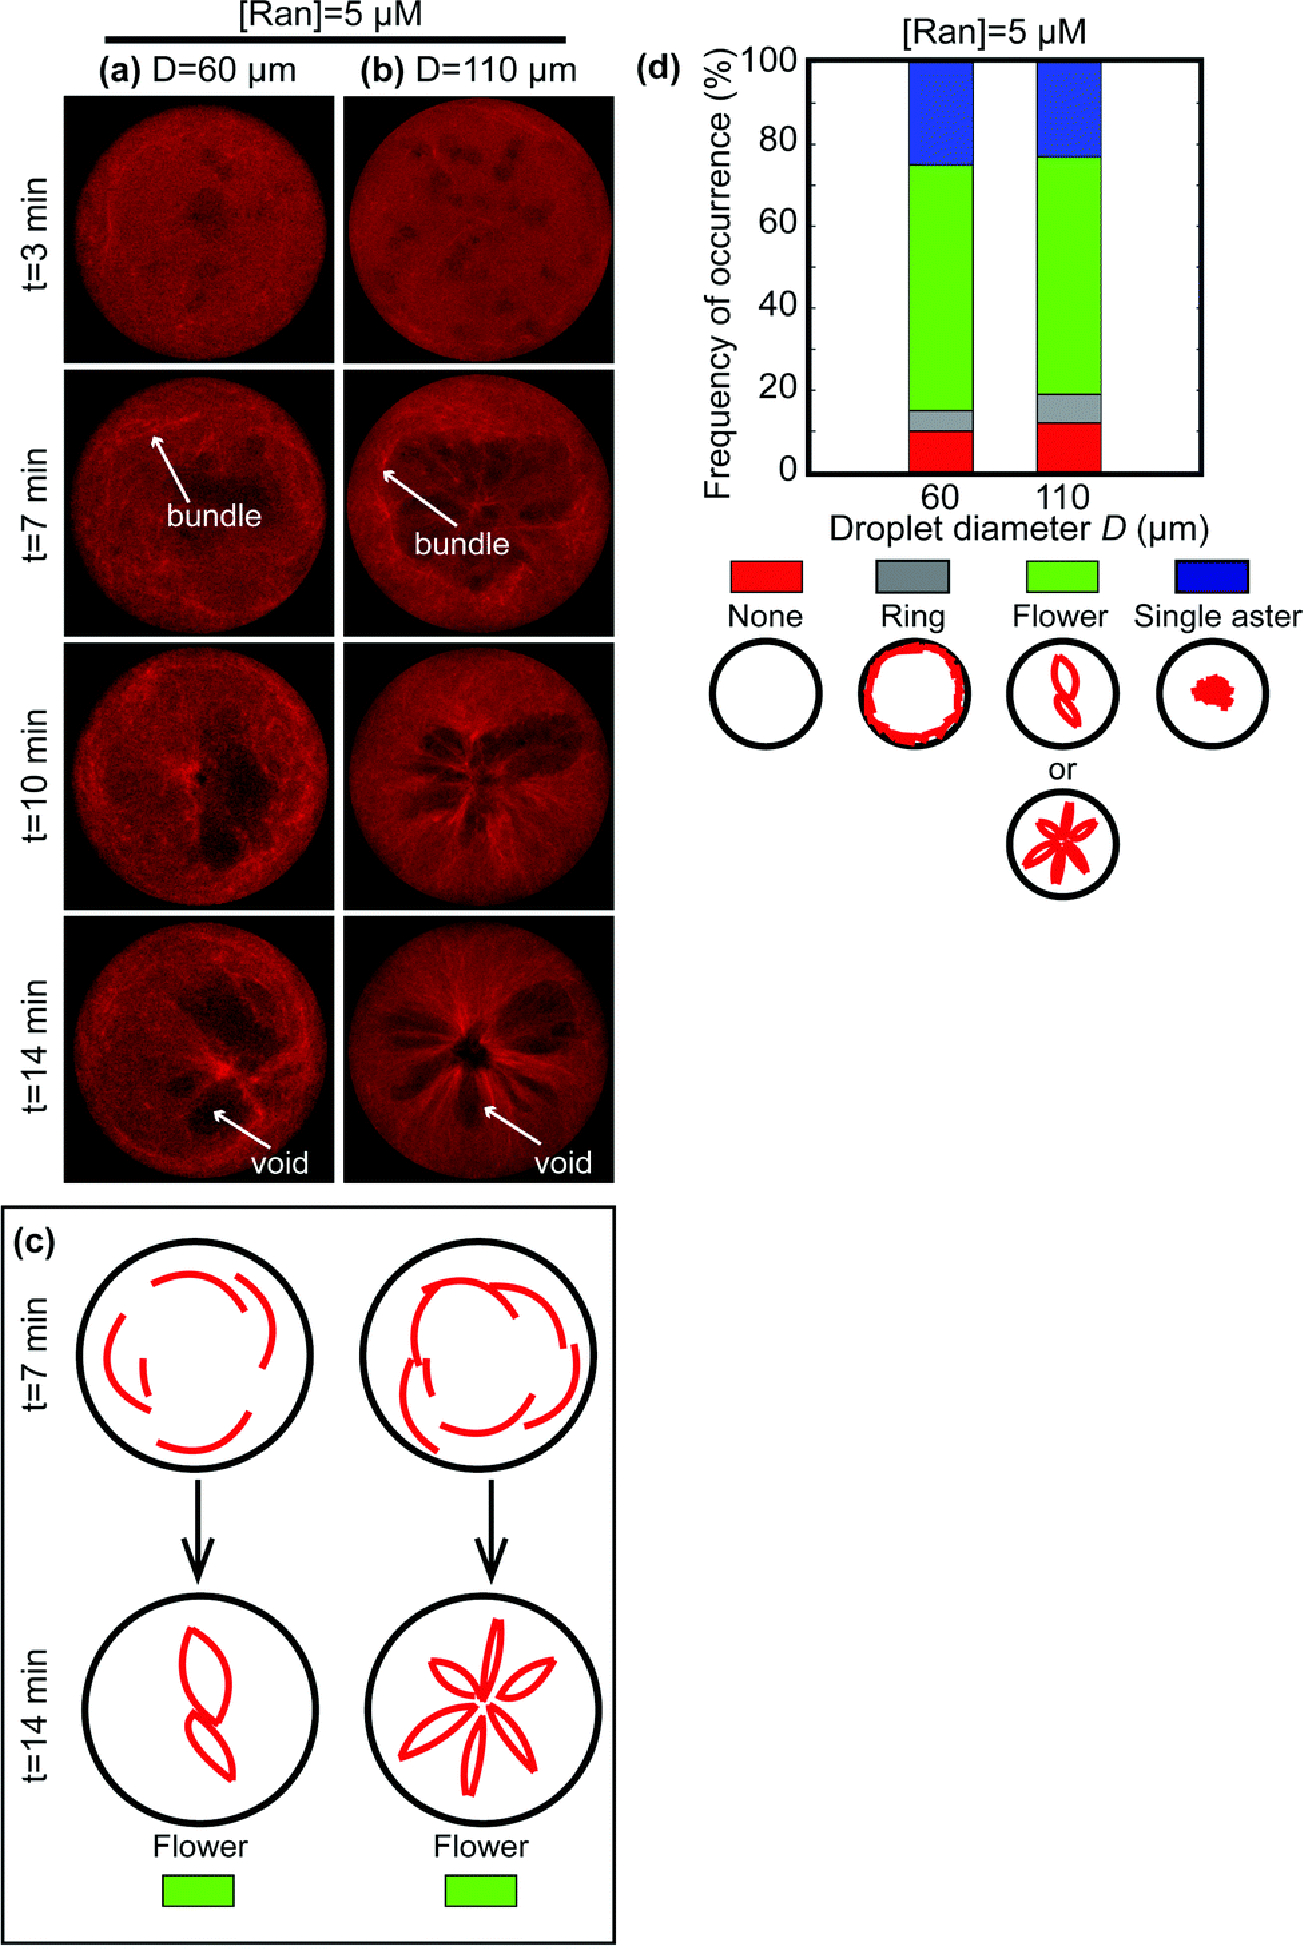
Flower structure at [Ran] = 5 μM for D = 60 μm and D = 110 μm. (a and b) Confocal images showing the assembly of flower-shaped MT networks inside droplets. The Ran concentration is 5 μM, and the droplet diameters are (a) D = 60 μm and (b) D = 110 μm, respectively. (c) Schematics showing the assembly of the flower-shaped MT networks. (d) Frequency of occurrence of different architectures. We tracked 82 droplets to make the bar plot. Each color represents a specific MT network architecture below.
Small droplet size (D = 20 μm) leads to a ring-shaped architecture of MT networks
At a droplet diameter D = 20 μm, MTs assembled into a ring near the droplet boundary (Fig. 2b–d). At t = 7 min, a ring of MTs appeared near the droplet boundary and became more visible after that (Fig. 2e). The ring-shaped architecture is consistent with previous studies, in which Taxol-stabilized MTs formed cortical arrays close to the confinement boundary. The cortical arrays stemmed from MTs bending along the boundary when the length of the MTs became comparable to the dimension of confining space.15,16 For droplets with a diameter of D = 20 μm, the ring-shaped architecture is insensitive to changes in Ran concentration (Fig. 2b–d), and robust (>55%) over dozens of droplets (ESI,† Fig. S3). Thus, the formation of the ring-shaped architecture is determined mainly by confinement size rather than the nucleation activity of MTs for small droplet diameters. Across all Ran concentrations, a minor percentage of droplets displayed other MT structures (Fig. 2f and ESI,† Fig. S3). Nevertheless, at the tested conditions, over 55% of the interrogated droplets showed the ring structure. In Fig. 2f, the “single aster” droplets (the blue bars) refer to those that displayed only the single aster architecture. For a droplet that contained both an aster and a ring (accounted for 75% of the “ring structure droplets”), we categorized it as the “ring” structure (the gray bar). Notably, the MT architecture in confined small droplets differs significantly from the same sample in an unconfined sample chamber.
Droplet size affects MT network architecture at low Ran concentrations
During spindle assembly, a gradient of Ran concentration exists in the vicinity of the chromosomes.1,10 Based on this, we hypothesized that, in addition to the droplet size, the variation of Ran concentration regulates the architecture of MT networks for larger droplet sizes. To test our hypothesis, we varied the Ran concentration in droplets with D = 60 μm and D = 110 μm.
At [Ran] = 5 μM, and D = 60 μm and D = 110 μm (Fig. 3a and b; also see ESI,† Movie S2), MTs assembled into a network partitioned by “void areas” (white arrows in Fig. 3a and b at t = 14 min). These areas exhibited a low MT density and precluded the assembly of MTs. The architecture of the network resembled the shape of a flower. The number of partitions, or void areas, scaled with the droplet size and was robust (>60%) over dozens of droplets (Fig. 3c, d; see ESI,† Fig. S4, S5 and Movie S4). On average, droplets with D = 60 μm have two or three partitions, and the larger droplets with D = 110 μm have five to seven partitions (Fig. 3c). The assembly of the flower-shaped architecture was through the contraction of the MT network. From t = 3 min to t = 7 min, most MTs nucleated close to the droplets’ boundary, rather than homogeneously inside the droplets, and formed bundled MTs (white arrows in Fig. 3a and b at t = 7 min). As a result, we observed a brighter region with a higher MT density surrounding a darker region with a lower MT density. Subsequently, the perimeter of MTs contracted asymmetrically, such that the MT network became partitioned by the darker void areas into a flower-shaped architecture (Fig. 3c). Flower-shaped MT architectures require MT dynamics, as they don’t form in the presence of Taxol (Fig. S6, ESI†).
Ran concentration affects MT network architecture at medium and large droplet sizes
When increasing the Ran concentration to 10 μM and 20 μM within droplet diameters of 60 and 110 μm, MTs primarily assembled into asters, i.e., a radial array of MTs close to the droplet center. However, the detailed characteristics of the assembly process depended on both droplet diameter D and Ran concentration. To illustrate the assembly process, we focus on comparing the morphologies of MT networks formed at two times: an intermediate state at t = 7 min characterized by spatially separated ‘clusters’ of MTs; a steady-state at t = 14 min characterized by asters of MTs (Fig. 4a–d). We define the ‘cluster’ as the subset of an astral MT network that is still undergoing transient spatial movements and morphological changes at t = 7 min, leading eventually to the steady-state MT aster at t = 14 min.
At a Ran concentration of 10 μM and in droplets with diameters of 60 μm and 110 μm (Fig. 4a and b; also see ESI,† Movie S3), MTs first bundled into a few spatially-separate clusters at t = 7 min. They subsequently aggregated to the center of droplets and formed radial asters at t = 14 min.
At a Ran concentration of 20 μM and a droplet diameter of 60 μm (Fig. 4c), in contrast to the relatively separate clusters (Fig. 4a and b at t = 7 min) at [Ran] = 10 μM, MTs formed an increased number of clusters packing densely and appearing to be interconnected at t = 7 min, likely due to enhanced MT nucleation activities at a higher Ran concentration. The difference between the separate and interconnected clusters at t = 7 min is further supported by the Radon transform of the images (Fig. 4f, top row; also see ESI,† Note S2). The separated clusters show sinusoidal wave patterns, and the interconnected clusters show a homogeneous stripe. With time, the entire network of interconnected clusters contracted radially, leading to a single aster at t = 14 min.
At D = 110 μm and [Ran] = 20 μM (Fig. 4d), the clusters again became separate at t = 7 min (Fig. 4d), supported by the sinusoidal wave in their Radon transform at t = 7 min (Fig. 4g). Subsequently, the separate clusters moved towards the center of the droplet. Rather than forming a single aster as in the previous cases (Fig. 4a–c at t = 14 min), they did not collapse, giving rise to a network of multiple asters coexisting inside the droplet. The contrast between the single-aster droplets and the multi-aster droplets is also evident in their Radon transforms at t = 14 min (Fig. 4f, bottom row). Compared to the uniform stripe of the single aster, the multi-aster case shows a clear sinusoidal wave. The aster assembly inside droplets is robust (>60%) over dozens of droplets (Fig. 4g, ESI,† Fig. S7; also see Movie S5).
Ran concentrations modulate the number of MTs in droplets
To assess whether the effect of Ran concentration on the resulting MT architectures is the result of the increased number of MTs, we used fluorescently labeled end binding protein 1 (EB1) to estimate the MT number. Because each EB1 spot marks one MT, we counted EB1 spots (see Materials and methods) in order to determine the number of MTs within each field of view. Comparing droplets with D = 60 μm at [Ran] = 5 μM and [Ran] = 10 μM (Fig. 5a and b), we found that a 5 μM increase in Ran concentration led to an EB1 number increase by at least 400% (Fig. 5c). In contrast, varying the Ran concentration in these conditions did not affect the MT growth velocities (see ESI,† Note S3). Thus, MT network architectures are related to MT numbers in the confined extracts.
Effect of motor activity and droplet deformation
To test whether molecular motors are required for the assembly of MT networks in our system, we inhibited motor activities by adding the ATPase inhibitor vanadate (Fig. 6a and ESI,† Fig. S8, Movie S7).25 MTs formed but failed to assemble into a more extensive network with a defined architecture inside the droplets, in conditions that normally would form asters (Fig. 6a), ring or flower assemblies (ESI,† Fig. S8). Instead, we observed small, scattered MT bundles upon treatment with vanadate reminiscent of branched MT networks originating from branching MT nucleation.25,33 We hypothesized that dynein is the key motor responsible for merging MT bundles into a single MT network. To test this hypothesis, we replaced vanadate with ciliobrevin to specifically inhibit dynein (Fig. 6b). With ciliobrevin, we observed MTs forming shallow bundles scattered throughout the droplets, similar to vanadate. This observation supports that dynein is the primary type of motor that drives the spatial organization of MTs in our system, consistent with previous studies.6,7,15–18,21 Therefore, in wild-type extract and within sufficiently large confinement that allows MTs to grow freely without boundary compression, dynein pulls separate nucleation centers together to assemble them into Ran-induced MT networks.
To understand how droplet shape affects the MT network assembly, we deformed the droplets without changing their volume by reinjecting the droplets into a chamber with a small depth, such that the channel depth-to-droplet-diameter ratio became H/D ~ 0.4 (see Materials and methods). The droplets deformed into a pancake shape while maintaining their volume. At the same droplet size and Ran concentration, compressed droplets (Fig. 6c–e) exhibited assembly processes and steady-state architectures consistent with the uncompressed droplets (Fig. 3b and 4b, d). This observation agrees with the prior study,34 which reported the confinement volume, rather than the confinement shape, drives the spindle scaling as limited cytoplasmic components affect the MT network assembly.
Discussion
Here, we found that MT architecture depends on cytoplasmic volume, MT nucleation, and motor activity. Specifically, all MT architectures differ from the ones formed in bulk extracts. Thus, we summarize the steady-state (t = 14 min) architecture of Ran-induced MT networks as a function of droplet size D and Ran concentration [Ran] in a regime map (Fig. 7). We have identified four types of architectures: rings, flowers, single asters, and multiple asters. The assembly of the architecture is robust (>55%) across many droplets given the same droplet size and Ran concentration.
Fig. 7.

Regime maps summarizing our results. Regime maps summarizing the assembly of MT networks at steady state t = 14 min. The horizontal axis denotes the droplet diameter, and the vertical axis denotes the Ran concentration. The colored dashed boxes highlight different MT network architectures. Each MT architecture shown is the dominant one within the tested condition.
From rings to asters as D increases: pure confinement effect
The ring architecture formation may primarily be due to a high degree of confinement imposed by the small droplet size. At D = 20 μm, the length scale of the confining space is close to the reported length scale of Ran-induced MTs during spindle assembly.35,36 When the MTs grow within the small droplet, their ends eventually touch the droplet boundary. As the growth continues, the MTs buckle and bend along the droplet boundary under the compressive force exerted by the droplet interfacial tension, leading to the ring structure formation. A similar ring-assembly process has also been observed in prior studies with confined, stabilized MTs.15,16
At D = 60 μm and D = 110 μm, more space is available for MT growth and motor-mediated transport of MTs. When the confining space is sufficiently large (D = 60 μm or D = 110 μm), molecular motors organize MTs through MT bundling and directed MT transport along MTs.15,16,19,37 Detailed mechanisms of motor activities are beyond the scope of our study and reported in other studies.1,19,37–39 Specifically, dynein is necessary to organize smaller bundles into larger-scale MT networks, whose architectures range from flowers, to asters, to multipolar arrays.
An architecture that has not been observed before is the flower-like network architecture. The interaction between lipids and MTs, which is well known and has been proposed to help partition membrane systems during cell division,40 most likely drove the formation of the void areas at [Ran] = 5 μM. Comparing the conditions of [Ran] = 5 μM with [Ran] = 10 or 20 μM, we hypothesize that in lower Ran concentrations, fewer MTs were nucleated, and the MTs were on average longer. As a result, the fewer and longer MTs may buckle along the edge of lipid droplets or vesicles, creating the flower-like architecture. Whether this hypothesis is correct and whether lipids can affect MT architecture in a cell will require more sophisticated tests to label lipids or remove all lipids in extracts. These questions constitute an interesting future area of research.
The observed MT networks are prevalent in cells. MT asters are common in many interphases and mitotic cells, such as zygotes and early blastomeres of Xenopus laevis and Zebrafish, and human fibroblasts.16,41 In these cells, either centrosomes or minus-end directed motor proteins drive the assembly of the asters, which underlies wide-ranging cellular functions, including cell division.1,7,41 On the other hand, the ring-shaped MT architecture resembles the cortical MTs typically seen in plant cells,42–44 which is essential for plant cell morphologies.43–45
MT nucleation with limited resources can lead to different MT architectures
A possible explanation for the variation from flowers, to asters, to multipolar arrays at larger droplet sizes and increasing Ran concentrations can be the competition between MT nucleation and limited resources. The higher the Ran concentration, the more MT nucleation is induced, while the limited resources are a consequence of confinement. Prior studies have suggested that the limited tubulin of confined extracts is the primary determinant of the size scaling of mitotic spindles.34,46 We thus focus our discussion of limited resources on tubulin, the basic structural unit of microtubules.
At a low Ran concentration, there are fewer MT nucleation events. Each MT has sufficient tubulin that guarantees its maximum growth. Thus, MTs with a longer average length favor the formation of long, bundled filaments, which is consistent with our observation at [Ran] = 5 μM (Fig. 3a and b). As the Ran concentration increases, a higher rate of MT nucleation leads to more MTs during the same amount of time. The tubulin available in confined extracts could limit the full growth of all nucleated MTs. Consequently, the average length of the MTs becomes shorter than that at a lower Ran concentration. In these conditions, motors efficiently pack the shorter MTs into a single aster,15,16,37,47,48 which is also consistent with our observation at [Ran] = 10 μM (Fig. 4a and b). At [Ran] = 20 μM, MTs assembled into multiple asters coexisting in a droplet (Fig. 4d). This phenomenon could be due to steric interactions among MTs that prevent excess MTs from packing into a single aster.
The experiment of deformed droplets (Fig. 6b and d) and counting EB1 spots (Fig. 5 and ESI,† Movie S6) support the hypothesis of limited resources. First, given the same droplet volume and Ran concentration, the MT networks exhibited almost identical architectures, despite having a more ovoid shape. A prior study reported similar observations,34 where confinement volume, not confinement shape, drives the spindle scaling due to the limiting pool of cytoplasmic components. Second, by counting EB1 spots at the same droplet size, we found more MTs nucleated at a higher Ran concentration. This finding is in line with the previous work, which showed that the activity of MT nucleation from MT organizing centers increases with Ran-GTP concentration.8
One particularly intriguing observation is the similar assembly process of single aster and multi-aster cases (Fig. 4a and d). This similarity suggests that scaling laws driven by MT nucleation rates could potentially map the assembly processes across different Ran concentrations. Despite some similarities, we also observed that the multi-aster network (Fig. 4d) remained up to t = 40 min rather than collapsed into one aster (ESI,† Fig. S2). After 40 minutes, the network started to disassemble, possibly caused by extracts losing the interphase activities. This observation suggested that the scaling could involve multiple factors in addition to the nucleation rate.
In conclusion, our results highlight the critical role of confinement in regulating MT network assembly. Most importantly, we show that MT nucleation is a major determinant of the resulting MT architecture in confined space. This factor has not been taken into account when working with stabilized MTs and motors. Our work suggests that more studies are needed to understand further how MT nucleation from defined locations and at precise times in a cell leads to a functional MT architecture. An interesting question to address in the future is also how MTs interact with confinement surfaces that are relevant in biology. Future research is necessary to understand how biologically relevant surface properties, e.g., surface stiffness, affect the MT network assembly. Last, our work illustrates a rather simple strategy to tune the architecture of MT networks by changing the confinement (droplet) size and nucleation stimulator (Ran) concentration. This strategy might have broader implications for soft material processing, where crystallization, driven by nucleation, determines many soft materials’ properties, such as orientation, grain size, and defect morphology.49–51 Our findings provide insights into how the control of this nucleation-driven process can guide the materials’ mechanical, electrical, and optical properties.
Supplementary Material
Acknowledgements
We are grateful to all members of the Petry Lab and the Stone Lab for insightful discussions. We thank Princeton Confocal Microscopy Core Facility for providing imaging equipment that enabled this study. We are grateful to Gary Laevsky for discussions about imaging techniques and analysis. This work was supported by the Princeton Catalysis Initiative (to H. A. S. and S. P.), the NIH New Innovator Award (1DP2GM123493-01), and the David and Lucile Packard Foundation (2014-40376) (all to S. P.).
Footnotes
Conflicts of interest
There are no conflicts to declare.
Electronic supplementary information (ESI) available. See DOI: 10.1039/d1sm00045d
Data availability
Imaging files and data are available upon request.
References
- 1.Petry S, Annu. Rev. Biochem, 2016, 85, 659–683. [DOI] [PMC free article] [PubMed] [Google Scholar]
- 2.Dumont J and Desai A, J. Trends Cell Biol, 2012, 22, 241–249. [DOI] [PMC free article] [PubMed] [Google Scholar]
- 3.Zhang H and Dawe RK, J. Chromosome Res, 2011, 19, 335–344. [DOI] [PubMed] [Google Scholar]
- 4.Zhang C, Hughes M and Clarke PR, J. Cell Sci, 1999, 112, 2453–2461. [DOI] [PubMed] [Google Scholar]
- 5.Carazo-Salas RE, Guarguaglini G, Gruss OJ, Segref A, Karsenti E and Mattaj IW, Nature, 1999, 400, 178. [DOI] [PubMed] [Google Scholar]
- 6.Ohba T, Nakamura M, Nishitani H and Nishimoto T, Science, 1999, 284, 1356–1358. [DOI] [PubMed] [Google Scholar]
- 7.Wilde A and Zheng Y, Science, 1999, 284, 1359–1362. [DOI] [PubMed] [Google Scholar]
- 8.Carazo-Salas RE, Gruss OJ, Mattaj IW and Karsenti E, Nat. Cell Biol, 2001, 3, 228. [DOI] [PubMed] [Google Scholar]
- 9.Desai A and Mitchison TJ, Annu. Rev. Cell Dev. Biol, 1997, 13, 83–117. [DOI] [PubMed] [Google Scholar]
- 10.Kalab P, Weis K and Heald R, Science, 2002, 295, 2452–2456. [DOI] [PubMed] [Google Scholar]
- 11.Alfaro-Aco R, Thawani A and Petry S, J. Cell Biol, 2017, 216, 983–997. [DOI] [PMC free article] [PubMed] [Google Scholar]
- 12.Gruss OJ, Carazo-Salas RE, Schatz CA, Guarguaglini G, Kast J, Wilm M, Le Bot N, Vernos I, Karsenti E and Mattaj IW, Cell, 2001, 104, 83–93. [DOI] [PubMed] [Google Scholar]
- 13.Verde F, Berrez J-M, Antony C and Karsenti E, J. Cell Biol, 1991, 112, 1177–1187. [DOI] [PMC free article] [PubMed] [Google Scholar]
- 14.Buendia B, Antony C, Verde F, Bornens M and Karsenti E, J. Cell Sci, 1990, 97, 259–271. [DOI] [PubMed] [Google Scholar]
- 15.Pinot M, Chesnel F, Kubiak J, Arnal I, Nedelec F and Gueroui Z, Curr. Biol, 2009, 19, 954–960. [DOI] [PubMed] [Google Scholar]
- 16.Baumann H and Surrey T, J. Biol. Chem, 2014, 289, 22524–22535. [DOI] [PMC free article] [PubMed] [Google Scholar]
- 17.Suzuki K, Miyazaki M, Takagi J, Itabashi T and Ishiwata S. i., Proc. Natl. Acad. Sci. U. S. A, 2017, 114, 2922–2927. [DOI] [PMC free article] [PubMed] [Google Scholar]
- 18.Foster PJ, Fürthauer S, Shelley MJ and Needleman DJ, eLife, 2015, 4, e10837. [DOI] [PMC free article] [PubMed] [Google Scholar]
- 19.Nedelec F, Surrey T, Maggs AC and Leibler S, Nature, 1997, 389, 305. [DOI] [PubMed] [Google Scholar]
- 20.Juniper MP, Weiss M, Platzman I, Spatz JP and Surrey T, Soft Matter, 2018, 14, 901–909. [DOI] [PubMed] [Google Scholar]
- 21.Hoffmann C, Mazari E, Lallet S, Le Borgne R, Marchi V, Gosse C and Gueroui Z, Nat. Nanotechnol, 2013, 8, 199. [DOI] [PubMed] [Google Scholar]
- 22.Hannak E and Heald R, Nat. Protoc, 2006, 1, 2305. [DOI] [PubMed] [Google Scholar]
- 23.Good MC, The Mitotic Spindle, Springer, 2016, pp. 87–108. [Google Scholar]
- 24.Weis K, Dingwall C and Lamond AI, EMBO J, 1996, 15, 7120–7128. [PMC free article] [PubMed] [Google Scholar]
- 25.Petry S, Groen AC, Ishihara K, Mitchison TJ and Vale RD, Cell, 2013, 152, 768–777. [DOI] [PMC free article] [PubMed] [Google Scholar]
- 26.Tang SK and Whitesides GM, Basic microfluidic and soft lithographic techniques, McGraw-Hill, 2010. [Google Scholar]
- 27.Abate AR, Lee D, Do T, Holtze C and Weitz DA, Lab Chip, 2008, 8, 516–518. [DOI] [PubMed] [Google Scholar]
- 28.Anna SL, Bontoux N and Stone HA, Appl. Phys. Lett, 2003, 82, 364–366. [Google Scholar]
- 29.Oakey J and Gatlin JC, Cold Spring Harb. Protoc, 2018, vol. 2018, pdb-prot102913. [DOI] [PubMed] [Google Scholar]
- 30.Guan Y, Li Z, Wang S, Barnes PM, Liu X, Xu H, Jin M, Liu AP and Yang Q, eLife, 2018, 7, e33549. [DOI] [PMC free article] [PubMed] [Google Scholar]
- 31.Wühr M, Chen Y, Dumont S, Groen AC, Needleman DJ, Salic A and Mitchison TJ, Curr. Biol, 2008, 18, 1256–1261. [DOI] [PMC free article] [PubMed] [Google Scholar]
- 32.Montorzi M, Burgos MH and Falchuk KH, Mol. Reprod. Dev, 2000, 55, 75–82. [DOI] [PubMed] [Google Scholar]
- 33.Thawani A, Stone HA, Shaevitz JW and Petry S, eLife, 2019, 8, e43890. [DOI] [PMC free article] [PubMed] [Google Scholar]
- 34.Hazel J, Krutkramelis K, Mooney P, Tomschik M, Gerow K, Oakey J and Gatlin J, Science, 2013, 342, 853–856. [DOI] [PMC free article] [PubMed] [Google Scholar]
- 35.Brugués J, Nuzzo V, Mazur E and Needleman DJ, Cell, 2012, 149, 554–564. [DOI] [PubMed] [Google Scholar]
- 36.Decker F, Oriola D, Dalton B and Brugués J, eLife, 2018, 7, e31149. [DOI] [PMC free article] [PubMed] [Google Scholar]
- 37.Surrey T, Nédélec F, Leibler S and Karsenti E, Science, 2001, 292, 1167–1171. [DOI] [PubMed] [Google Scholar]
- 38.Roostalu J, Rickman J, Thomas C, Nédélec F and Surrey T, Cell, 2018, 175, 796–808. [DOI] [PMC free article] [PubMed] [Google Scholar]
- 39.Wittmann T, Hyman A and Desai A, Nat. Cell Biol, 2001, 3, E28–E34. [DOI] [PubMed] [Google Scholar]
- 40.Zheng Y and Tsai M-Y, Cell Cycle, 2006, 5, 2345–2347. [DOI] [PubMed] [Google Scholar]
- 41.Mitchison T, Wühr M, Nguyen P, Ishihara K, Groen A and Field CM, Cytoskeleton, 2012, 69, 738–750. [DOI] [PMC free article] [PubMed] [Google Scholar]
- 42.Lagomarsino MC, Tanase C, Vos JW, Emons AMC, Mulder BM and Dogterom M, Biophys. J, 2007, 92, 1046–1057. [DOI] [PMC free article] [PubMed] [Google Scholar]
- 43.Wasteneys GO and Ambrose JC, Trends Cell Biol, 2009, 19, 62–71. [DOI] [PubMed] [Google Scholar]
- 44.Dixit R and Cyr R, Plant Cell, 2004, 16, 2546–2552. [DOI] [PMC free article] [PubMed] [Google Scholar]
- 45.Cyr RJ and Palevitz BA, Curr. Opin. Cell Biol, 1995, 7, 65–71. [DOI] [PubMed] [Google Scholar]
- 46.Good MC, Vahey MD, Skandarajah A, Fletcher DA and Heald R, Science, 2013, 342, 856–860. [DOI] [PMC free article] [PubMed] [Google Scholar]
- 47.Heald R, Tournebize R, Blank T, Sandaltzopoulos R, Becker P, Hyman A and Karsenti E, Nature, 1996, 382, 420. [DOI] [PubMed] [Google Scholar]
- 48.Cai S, Weaver LN, Ems-McClung SC and Walczak CE, Mol. Biol. Cell, 2009, 20, 1348–1359. [DOI] [PMC free article] [PubMed] [Google Scholar]
- 49.Hermes M, Vermolen E, Leunissen M, Vossen D, van Oostrum P, Dijkstra M and van Blaaderen A, Soft Matter, 2011, 7, 4623–4628. [Google Scholar]
- 50.Xu X, Ting CL, Kusaka I and Wang Z-G, Annu. Rev. Phys. Chem, 2014, 65, 449–475. [DOI] [PubMed] [Google Scholar]
- 51.Dai X, Li H, Ren Z, Russell TP, Yan S and Sun X, Macromolecules, 2018, 51, 5732–5741. [Google Scholar]
Associated Data
This section collects any data citations, data availability statements, or supplementary materials included in this article.
Supplementary Materials
Data Availability Statement
Imaging files and data are available upon request.