Abstract
COVID-19 is a viral disease that in the form of a pandemic has spread in the entire world, causing a severe impact on people’s well being. In fighting against this deadly disease, a pivotal step can prove to be an effective screening and diagnosing step to treat infected patients. This can be made possible through the use of chest X-ray images. Early detection using the chest X-ray images can prove to be a key solution in fighting COVID-19. Many computer-aided diagnostic (CAD) techniques have sprung up to aid radiologists and provide them a secondary suggestion for the same. In this study, we have proposed the notion of Pearson Correlation Coefficient (PCC) along with variance thresholding to optimally reduce the feature space of extracted features from the conventional deep learning architectures, ResNet152 and GoogLeNet. Further, these features are classified using machine learning (ML) predictive classifiers for multi-class classification among COVID-19, Pneumonia and Normal. The proposed model is validated and tested on publicly available COVID-19 and Pneumonia and Normal dataset containing an extensive set of 768 images of COVID-19 with 5216 training images of Pneumonia and Normal patients. Experimental results reveal that the proposed model outperforms other previous related works. While the achieved results are encouraging, further analysis on the COVID-19 images can prove to be more reliable for effective classification.
Keywords: COVID-19, X-ray images, Feature extraction, Deep learning, Feature selection, Pearson correlation coefficient, Machine learning
Introduction
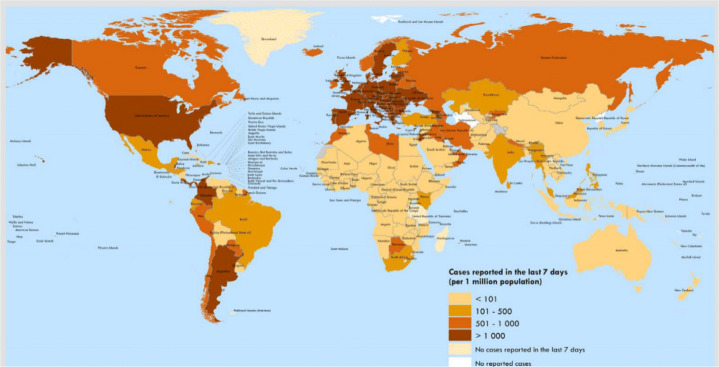
Coronavirus disease-19 (COVID-19) has surfaced as a fatal Severe Acute Respiratory Syndrome (SARS) infection [65] since December 2019. First instance of the disease was reported in the province of Wuhan, China, which soon after spread to the world like wild fire. The disease is now declared as ‘pandemic’ by the WHO [15, 34]. The statistics for the COVID-19 affected population in state of the pandemic is as depicted in Fig. 1. A viral or respiratory infection with an incubation duration of 2 − 14 days is a typical symptom of the disease. However, the afflicted suffers shortness of breath, nausea resulting in pneumonia and numerous organ defects as this condition progresses [34, 66].
Fig. 1.
Per million COVID-19 cases on world population as reported in the last seven days by countries, territories and areas, October 2 to November 8, 2020 [64]
For respiratory or blood specimens, reverse transcription-polymerase chain reaction (RT-PCR), or gene decoding are declared as the screening methods for suspicious COVID-19 check. However, the RT-PCR test sample’s overall positive rate for throat swab specimens is estimated to be 30 to 60%, which can deduce a suspicious person with symptoms as unaffected, which in turn can lead to the spreading of the disease to masses [3]. In the COVID-19 pandemic, imaging techniques are critical for determining reported cases and the outbreak’s path. We consider the role of X-ray imaging in the current situation [37] to be effective for productive analysis of the COVID-19 disease.
The diagnosis and medication of COVID-19 usually linked with both signs of pneumonia and chest X-ray examinations. Chest X-ray became the first screening technique to play a significant role in the diagnosis of COVID-19 infection. Figure 2 shows sample images of chest X-ray for COVID-19, Normal and Pneumonia patients. Previously, many classical machine and deep learning methods have been used for automated detection of chest radiography X-ray images. One technique commonly used with deep learning is transfer learning that re-uses the information learned from trained models, such as solving one problem and applying it to similar problems.
Fig. 2.
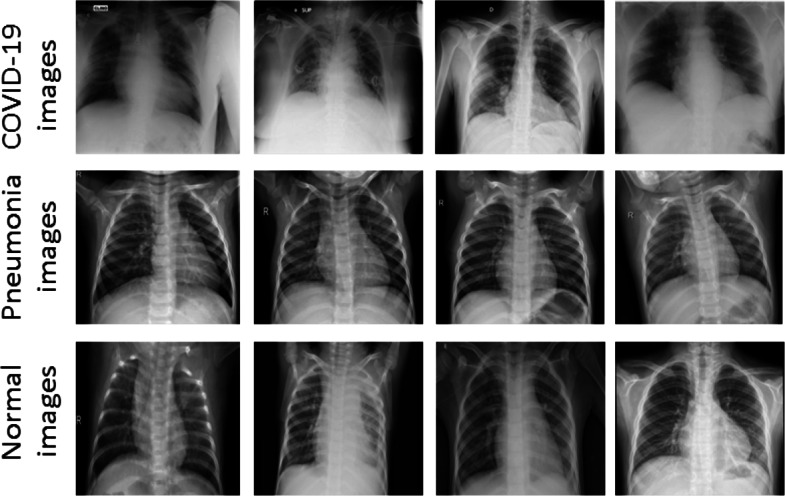
Some sample chest X-ray images from the acquired datasets containing COVID-19, Pneumonia and Normal cases
These models are trained on million images to classify objects in multiple classes, as demonstrated by ImageNet dataset [39]. The ImageNet dataset contained different usual and unusual classes like animals, buildings, fabrics and geological formations. For image classification processes, transfer learning models involves convolutional neural network (CNN) which can include, (i) “shallow tuning”, which adopts the ways of only changing the last layers to cope with the new input set of images, (ii) “deep tuning”, which retains all the parameters of the model in an end-to-end fashion and (iii) “fine-tuning”, whose goal is to train the added layers with the re-trained parameters until adequate accuracy is achieved. However, “Fine-tuning” based models have shown promising results [7, 23, 56, 62] for the aforementioned processes. Artificial intelligence (AI) is also essential in developing solutions to facilitate diagnosis [42]. Many AI-based solutions have been proposed to build an end-to-end integrated system for COVID-19 detection [4, 40, 53]. These methods can never replace the manual processes of diagnosis, but in turn, can provide significant help to the expert radiologists in precise annotation of the disease.
In recent studies, many deep learning approaches have been investigated for the purpose of COVID-19 classification from chest X-ray images. Different lung diseases have been identified by deep learning approaches in the past with many automated and semi-automatic techniques, that identify anomalies in the patient’s body. Still, the lack of adequate and accurate methods may lead to variability in the classification task. Continuing the legacy of the automatic classification method, this work demonstrates the process of three-class classification among the COVID-19, Normal, and Pneumonia images. The model makes use of ML predictive classifiers at the end for the classification purpose. The framework includes CNN-based feature extractors pre-trained on chest X-ray Pneumonia dataset. The pre-trained model is used as a features extractor, and then PCC and variational thresholding techniques are used for features selection, which optimally reduces feature space’s size to make it efficient for image classification. Lastly, the selected features are fed to a list of ML-based predictive classifiers for final classification.
- Major contributions:
- The major contributions of the paper are as follows:
- We have prepared a large set of COVID-19 chest X-ray image dataset, containing 768 images with their corresponding binary labels. The rich collection of the Chest X-ray images with a clear sign of the disease are used for further classification.
- A three-step hybrid model involving deep learning, extensive feature selection and ML classifiers is designed for detection of COVID-19 using chest X-ray images.
- The deep models pre-trained on the Chest X-ray Pneumonia dataset act as feature extractors, followed by the feature selection using PCC and variance thresholding. The selected features are classified using ML-based predictive classifiers which showed high sensitivity to the optimally selected features.
- We also provided the correlation analysis on features, depicting feature pair count per correlation coefficient and corresponding heat map for selected features.
- Extensive experimental analysis with comparative study using mRMR, Relief-f and QPFS techniques on the proposed model is performed using five-fold stratified cross-validation.
Remainder of the paper is organized as follows: Section 2 introduces the related work for COVID-19 detection, Section 3 representing the dataset and pre-processing. Section 4 describes the detailed methodology for COVID-19 classification among COVID-19, Normal and Pneumonia images, Section 5 representing the results and discussion. Finally, Section 6 concludes this study.
Related work
Despite being many technological advancements in the domain of medical imaging, COVID-19 is a highly contagious disease that has undoubtedly marked its place in the world’s history that a virus has made even the big countries to bow down to knees. For effective and efficient diagnoses of the disease, several machine and deep learning approaches have been implemented. These methods have been used to detect and classify the disease with radiologist medical image dataset. Different types of medical images were used extensively for detection and classification of COVID-19. Randhawa et al. introduced machine learning with digital signal processing (MLDSP) for genome analyses, with a supervised learning approach of decision tree and a Spearman’s rank correlation coefficient analysis for final result validation [54]. Karim et al. investigates deep learning methods for automatically analyzing query chest X-ray images to detect COVID-19 and diagnose confirmed patients [28] positively. Another work on X-ray images, called Decompose, Transfer, and Compose (DeTraC), is introduced by Asmaa et al. in [1]. DeTraC used class decomposition mechanism to deal with class boundaries leading to an accuracy of 93.1% and sensitivity of 100%. Bukhari et al. used the ResNet-50 convolutional neural network concept on chest X-ray images divided into three groups: normal, pneumonia, and COVID-19 [13]. Yujin et al. presented a statistical approach for chest X-ray image patches which used the small number of trainable CNN parameters for COVID-19 diagnosis [49].
Image-based features comprising Grey Level Co-occurrence Matrix (GLCM), Local Directional Pattern (LDP), Grey Level Run Length Matrix (GLRLM), Grey-Level Size Zone Matrix (GLSZM), and Discrete Wavelet Transform (DWT) algorithms are used by Mucahid et al. in their work on COVID-19 detection [8]. Another work of YOLO-based object classification in the input images using DarkNet for COVID-19 classification among the chest X-ray images is introduced by Tulin et al. in [50]. Xiaocong et al. performed contrastive learning with few-shot learning framework to make an accurate prediction with minimal training [17]. To boost up the performance, building a performance key and query lookup is performed. They also used the momentum mechanism to mitigate the noise in keys by updating key encoder and query encoder in different scales. Xin Li et al. presented COVID-MobileXpert, a lightweight mobile app based on deep neural network (DNN) that use chest X-ray for COVID-19 screening and radiological trajectory prediction [44]. Ali et al. diagnosed COVID-19 disease through a different trajectory, via the common respiratory symptom; cough. They investigated the distinctness of pathomorphological alterations in the respiratory system induced by COVID-19 infection and developed AI4COVID-19 [35]. Transfer learning is applied to cope with COVID-19 cough training data. Also, a multi-pronged mediator centered risk-averse AI architecture is leveraged to reduce the misdiagnosis risk in computations. A comparative analysis among the deep learning architectures, namely VGG16, VGG19, DenseNet201, Inception ResNetV2, InceptionV3, Resnet50, and MobileNetV2 on chest X-ray & CT image dataset is conducted by Khalid El Asnaoui and Youness Chawki in [22]. Ioannis et al. studies the use of various deep learning architectures over-collected dataset of 1427 chest X-ray images which yielded them the performance accuracy, sensitivity, and specificity of 96.78%, 98.66%, and 96.46%, respectively [6]. COVID-CAPS: a capsule network-based architecture for COVID-19 detection from X-ray images is proposed by Pernian et al [2]. The achieved accuracy of 95.7%, sensitivity of 90%, specificity of 95.8%, and Area Under the Curve (AUC) of 97% with very less of trainable parameters from the state-of-the-art deep models.
A neural network based on the combination of Xception and ResNet50V2 architectures is proposed by Mohammad Rahimzadeh and Abolfazl Attar, where they worked upon 11302 chest X-ray images and achieved an overall average accuracy for all classes is 91.4% [52]. Another transfer learning model on limited available COVID-19 dataset was proposed by Apostolopoulos ID and Mpesiana TA [6] where a bigger dataset (with the COVID-19, Pneumonia, and Normal cases) is created that geared up to achieve an ACC up to 98.75% for binary (COVID-19 and Normal) with the three class (with pneumonia being the third) classification up to 93.48%. Adding up the list, GANs have been used to produce synthetic COVID-19 images to gear up for high accuracy of 99.9% [46]. Tej Bahadur et al. proposed a two-phase (normal vs. abnormal and nCOVID-19 vs. pneumonia) classification approach using the concept of majority voting among the classifier ensemble of five benchmark supervised classification algorithms [14]. The obtained accuracy and AUC for the phase-1 validation results were 98.06% and 95% with phase-II validation results of accuracy and AUC were 91.32% and 83%, respectively. Rank-based average pooling and multiple-way data augmentation approach is used by Shui Hua et al. along with the graph convolutional network (GCN) for image level features [63]. A work eliminating the inadequacy of COVID-19 datasets introduced domain extension transfer learning (DETL) for multi-class classification among normal, pneumonia, other disease, and COVID-19 [9]. Multi-model deep learning approach for COVID-19 diagnosis is introduced by Soumya Ranjan et al. [48]. Another work on using the pre-trained deep learning architectures; ResNet18, ResNet50, ResNet101, VGG16, and VGG19 was used by Aras M.Ismael and Abdulkadir Sengur in their work for the chest X-ray image classification among COVID-19 and Normal (healthy) patient images [36].
Dataset and pre-processing
The proposed methodology is validated using two datasets available in public domain: COVID-19 dataset [19, 20] and Pneumonia chest X-ray images [18], referred to as dataset and dataset , respectively. The Pneumonia dataset is given in the form of training and test sets with 5216 and 624 images, respectively.
Training images consists of 1341 images for Normal cases and 3875 images for Pneumonia. In the test set, 234 images are Normal cases with 390 images for Pneumonia cases. In the proposed model, the deep architectures; ResNet152 [31] and GoogLeNet [58] are trained with only the training set of images. For the COVID-19 dataset , a substantial amount of images are extricated from the public medical repositories [19, 20]. The dataset contains a total of 768 images with clear signs of COVID-19 indications. To make the number of images equal in every class for unbiased experimentation, a random number of 800 images from both Normal and Pneumonia case are taken. Finally, the proposed methodology’s deep feature-based image classification task with ML classifiers uses chest X-ray image dataset . Both the datasets with image label pair and with image label pair contain different number of images which are tabulated in Tables 1 and 2, respectively.
Table 1.
COVID-19 dataset with equivalent amount of images for each class of COVID-19, Normal and Pneumonia cases [19, 20]
| Classes | # of Images |
|---|---|
| COVID-19 | 768 |
| Normal | 800 |
| Pneumonia | 800 |
Table 2.
Training and testing set of Pneumonia and Normal images from the Pneumonia chest X-ray image dataset [18]
| Dataset/Classes | Normal | Pneumonia | Total |
|---|---|---|---|
| # of Images in Training set | 1341 | 3875 | 5216 |
| # of Images in Test set | 234 | 390 | 624 |
| Total | 1575 | 4265 | 5840 |
In the acquired dataset, it is observed that the images are of different dimensions, which presented a difficulty in effective image classification. Since, X-ray are low-resolution images with a shifting length to breadth ratio, a seamless and efficient image pre-processing is applied. Pre-processing such as image cropping and resizing are done using Bilinear Interpolation [25] to enable training and testing for the proposed deep network architecture. The standard architectures of ResNet152 and GoogleNet are designed for an input image of size 224 × 224. Therefore, to ease the dataset usage, the images are resized to make a the size of 224 × 224.
Methodology
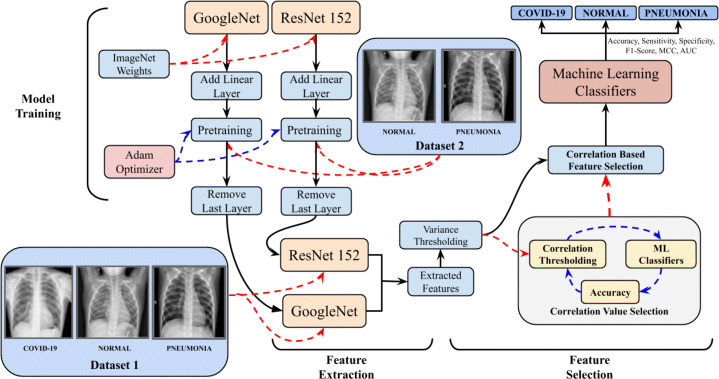
The proposed methodology for classification among COVID-19, Normal and Pneumonia cases consists of the three different steps: (i) feature extraction with the training of the deep architectures; ResNet152 and GoogLeNet, (ii) Correlation-based feature selection with thresholding and (iii) ML-based classification to detect the presence of COVID-19 among Pneumonia and Normal cases from the acquired dataset. To further enhance the understanding of the proposed framework, the schematic illustration of model workflow is shown in Fig. 3 with the pseudo-code as Algorithm 1.
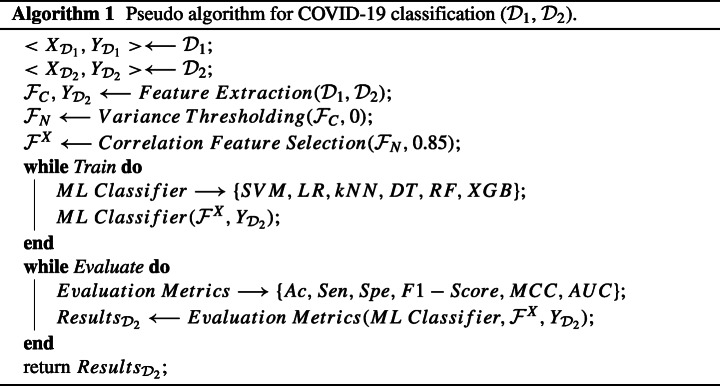
Fig. 3.
Illustration of the flow of information and data in the proposed framework for the accurate prediction of the COVID-19 v/s Pneumonia v/s Normal patients. Bold black arrows (→) represent the flow of data in the network. Red dashed arrow () represent the input entity to the module being pointed to with blue dashed arrow () representing the iterations on the module on the left side of the dashed arrow by the module on the right side of the dashed arrow
CNN-based deep feature extraction
The proposed methodology uses two deep feature extraction models: ResNet152 and GoogLeNet, for producing representation vectors for the input images. GoogLeNet, a deep learning network that considers how readily accessible dense segments can approximate and enforce an appropriate optimal sparse structure of a CNN. The model consists of an initial module of 4 parallel paths. Initially, convolution of 1 × 1 is followed by convolutions of 3 × 3 and 5 × 5 which in turn is progressed by 3 × 3 max-pooling process and 1 × 1 convolutions. To obtain the input for the subsequent layer, the data from all the previous filters is concatenated. The last convolution layer linked to two FC layers is built to contain a total of 1024 hidden neurons followed by non-linear rectified linear activation unit (ReLU). Softmax function in the last layer convert the extracted features into the classes’ predictions.
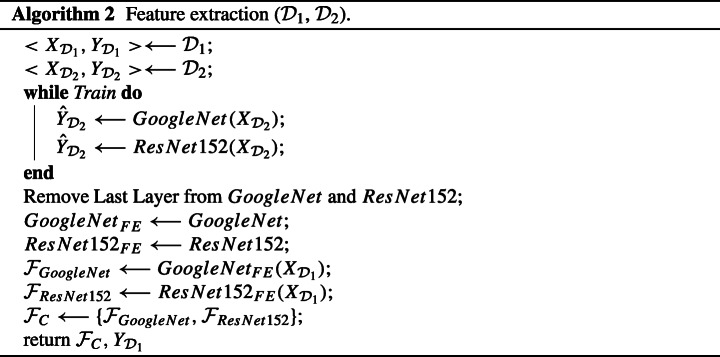
ResNet152, the other considered network is also optimized to make the proposed model more robust and achieve better accuracy. The network’s last layers are tweaked similarly to GoogLeNet for effective feature extraction. The aforementioned modified models use ImageNet as pre-trained weights and are trained using dataset , making them ResNet152FE and GoogLeNetFE, to acquaint them with the features of Pneumonia and Normal class images. The main benefit of getting the trained model with the dataset is that they will be able to identify basic image features like shapes and edges. Learning these representations will help the model to behave robustly in further analysis. The trained models, ResNet152FE and GoogLeNetFE, are then fed with the images of dataset , to extract the representation vectors from images with their corresponding labels . The individual representation vectors are concatenated to form a combined feature space, . The corresponding algorithm for feature extraction process is as depicted in Algorithm 2.
The trained models, ResNet152FE and GoogLeNetFE, are then fed with the images of dataset , to generate features and . These features are used as representation vectors for images with their corresponding labels . The individual representation vectors are concatenated to form a combined feature space, consisting of 2048 features. The Algorithm 2 shows the complete feature extraction process with Dataset and as inputs and
i.e., extracted features and there respective labels as output.
Feature selection
Feature selection involves selecting a subset of relevant features with shorter dimensions, training times and reduced overfitting. To accomplish this, the previously extracted features from ResNet152 [31] and GoogleNet [58], represent the same image features extracted from two parallel paths of the deep models. The features extracted from ResNet152 and GoogLeNet contain some different sets of information in the input images due to the structural difference between the two networks. After that, the features extracted correlate with each other spatially with some semantic discrepancies among them. Simple concatenation could lead to overfitting. Therefore, an extensive feature selection is performed using variance thresholding and correlation-based feature removal [27].
Variance thresholding
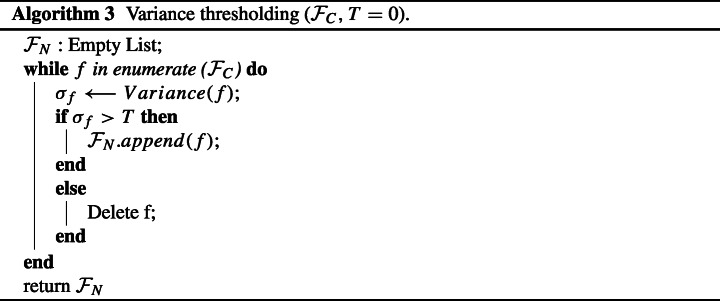
The notion of threshold lies in removing the power of some non-active neurons in the process which does not vary much within itself [27]. Variance threshold works in a similar way which removes features with the variation below a specific cutoff. In the proposed methodology, the extracted features contain some dead neurons (neurons whose value becomes zero on applying activation) with zero variance. These features have no advantage in a classification task; instead, they increase the models’ computational expense. Hence, a threshold variance of zero is applied to remove these unwanted features. Pseudo-code for the process of variance thresholding is as depicted in Algorithm 3. The extracted features and default threshold T goes as an input to function. The default value of threshold T is set to zero. Finally, the function returns the updated features , after variance filtering.
Correlation-based feature selection
Let and be two zero-mean real-valued features, among which the Pearson correlation coefficient (PCC) is defined as [10, 41]:
| 1 |
where represents the cross correlation between the feature space and , and and represents the standard deviation of the features and , respectively. The of the two features lies between a range of − 1 to 1. If the two features and are independent of each other than . On the other hand, if value closes to − 1 or 1 then the features are related to each other.
Alternatively, we can define the correlation between two features as:
| 2 |
where and represents the mean of specific features.
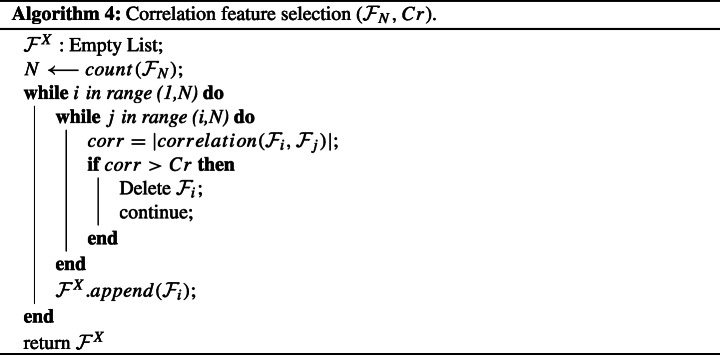
Algorithm 4 shows a complete flow of the process of feature selection using correlation. Features and correlation limit Cr are used as the input for computing the correlation between individual pair of features. A positive value of correlation signifies that an increase in the value of a given feature, the corresponding feature also increases. Similarly, a negative correlation coefficient indicates an increase in a given feature’s value; the corresponding feature decreases. Keeping this in mind, we take the absolute value of these correlation coefficients to bring values in range 0 to 1 to compare it with the positive threshold of Cr. If the correlation is above a certain given threshold, Cr, the corresponding feature is removed; otherwise, the useful features are saved in . This was performed because the features with high correlation can harm the model’s accuracy, as features with high correlation are more linearly dependent and hence have almost the same effect on the dependent variable. So, when two features have high correlation, we can drop one of the two features. The use of highly correlated features can make it difficult for our machine learning model to optimize and, in turn, impact its accuracy. This approach of selecting features makes our model computationally efficient in testing stages. We performed extensive experiments on a range of correlation thresholds with a comparison based on accuracy achieved on Machine Learning classifiers.
Additional feature selection techniques
Apart from the above feature selection techniques, we have also used some additional feature selection techniques in the experiment to check the classification task. The experiments were performed using the state-of-the-art feature selection techniques as follows:
- Maximun Relevance Minimum Redundancy (mRMR):
mRMR-based feature selection technique, is used to select a subset of features having the most correlation with a class (relevance) and the least correlation between themselves (redundancy). It is used in the proposed approach to select more informative feature set. The detailed description of the feature selection technique mRMR can be found in [29].
- Relief-based Feature Selection:
Relief-based feature selection technique is used as it ranks each feature based on the score and helps the model to select best features based on score for classification. The detailed description of the Relief-based feature selection technique can be found in [59].
- Quadratic Programming Feature Selection (QPFS):
QPFS is based on optimizing a quadratic function that is redesigned in a lower-dimensional space using the Nystrom approximation. It either uses PCC or mutual information as the underlying measure of similarity. It is computationally more efficient. The detailed description of the QPFS-based feature selection technique can be found in [55].
Machine learning classifier
The proposed methodology’s performance for each classifier is evaluated on the metrics defined in Section 5.2. After Feature extraction and selection, the final features are then utilized for training various machine learning classifiers. The classifiers used in the experiments include: Support Vector Machines (SVM) [21], Logistic Regression (LR) [32], k-Nearest Neighbor (kNN) [5], Decision Trees (DT) [51], Random Forest (RF) [12] and XGBoost (XGB) [16]. All these algorithms are evaluated by employing five-fold stratified cross-validation using evaluation metrics: accuracy (Ac), sensitivity (Sen), specificity (Spe), F1-Score, matthews correlation coefficient (MCC) and area under the curve for ROC curve.
Result analysis and discussion
Implementation details and hyper-parameter settings
The experimentation of the proposed methodology is implemented using Python 3.8 programming language with a processor of Intel®; Core i5-8300H CPU @ 2.30GHz with 8GB RAM on Windows 10 with NVIDIA GeForce GTX 1050 with 4GB Graphics. The model on the above configuration is fine-tuned for 60 epochs with a batch size of 32. For optimization, Adam optimizer [38] is used to optimize the loss function. For the ML classifiers, the parameters and hyper-parameters used for different classifiers are listed in Table 3 [11]. As every pre-trained model accepts input in a pre-defined input size, the input image are resized to 224 × 224.
Table 3.
Selected hyper-parameters for various ML classifiers
| Classifier | Hyper-parameter(s) | Value |
|---|---|---|
| SVM | Regularization Constant (C) | 1.0 |
| Decision function shape | One versus rest | |
| Gamma | Scale | |
| Kernel | Radial basis function | |
| Tolerance | 0.001 | |
| LogisticRegression | regularization constant (C) | 1.0 |
| Penalty | l2 | |
| Tolerance | 0.0001 | |
| KNeighborsClassifier | Metric | Minkowski Distance |
| # of Neighbors | 3 | |
| Weights | Uniform | |
| DecisionTreeClassifier | Criterion | Gini |
| Max Depth | 5 | |
| Min Samples Leaf | 1 | |
| Min Samples Split | 2 | |
| Splitter | Best | |
| RandomForestClassifier | Bootstrap | True |
| Criterion | Gini | |
| Max Depth | 20 | |
| Max Features | 10 | |
| N Estimators | 1000 | |
| XGBClassifier | Base Score | 0.97 |
| Booster | Gradient Boosting Tree | |
| Max Depth | 3 | |
| N Estimators | 1000 | |
| Objective | Logistic Regression |
Performance metrics
To evaluate the efficiency of the proposed framework, the confusion matrix 〈TP,TN,FP, FN〉 are exploited [26] along with the area under curve (AUC) [30, 67] property. AUC for ROC curve helps to check how well a classifier is able to distinguish in between various classes.
Performance metrics given below with five-fold stratified cross validation are used to test the model’s usefulness and productivity. Accuracy (Ac), as measured using (3) is the measure of correctly classified samples from the total samples. Sensitivity (Sen) as measured using (4) is the rate of correctly identifying the actual positives from the samples. Specificity (Spe), in (5) measures the rate of correctly identifying the actual negatives from the samples.
| 3 |
| 4 |
| 5 |
where TP, TN, FP and FN are true positive, true negative, false positive and false negative, respectively.
F1-score as given in (6) is a measure that reports the balance between precision and recall.
| 6 |
MCC: MCC as given in (5) stands for Matthews Correlation Coefficient which takes into account TP, TN, FP and FN to form a balanced measure which can even be used for classes of different sizes [47].
| 7 |
Performance evaluation of the proposed methodology
As per the previous works, the number of publically available COVID-19 images are very scarce and, therefore, for evaluating the robustness of any approach, extensive experimentation must be performed.
Correlation-based feature classification
The proposed methodology for the prediction of COVID-19, inputs the chest X-ray image dataset as explained in Section 3. The entire dataset contains two different datasets and , wherein contains three different classes, namely, COVID-19, Pneumonia and Normal while dataset consists of two classes, namely, Pneumonia and Normal which are further be used to train the aforementioned CNNs for feature extraction process.
Correlation-based selected features are input to the ML classifiers which accurately predict the feature vectors and produce accurate multi-class classification results. Extensive experimentation among the correlation thresholds (from 0.75 to 0.95) are carried out in order to identify the best results. From the experiments it is observed that the threshold corresponding to the value of 0.85 yields better results than other thresholds. Thereafter, ML approaches, namely 〈SVM, LR, kNN, DT, RF and XGB〉 are used with the performance metrics 〈Ac, Sen, Spe, F1-score, MCC and AUC〉. Among them the most concerned performance metric is Ac, Sen and Spe for performance comparison with previous related works. The obtained results are the average of five-fold stratified cross validation results. It can be observed that the best overall Ac achieved is 97.87% by XGB classifier with a Sen, Spe and F1-score value of 97.87%, 98.83% and 97.87%, respectively. The second best performance is achieved by LR classifier with a marginal difference in performance with the XGB classifier. The comparison among different classifiers over the dataset for the classification is depicted in Table 4. After XGB, SVM classifier with an Ac96.7%, Sen96.70%, Spe98.35% and F1-score96.60% occupies the third place in the performance graph of ML classifiers. Further in the row, RF with Ac94.70%, Sen94.70%, Spe97.35% and F1-score94.68%, kNN with Ac94.62%, Sen94.62%, Spe 97.31% and F1-score94.59% and DT with Ac 89.83%, Sen89.83%, Spe94.91% and F1-score89.84% performed in descending order of metrics evaluation. The visual representation of the results are illustrated using confusion matrix in Fig. 4 by each of the ML classifiers for COVID-19 classification.
Table 4.
Performance metrics using proposed methodology based on PCC feature selection with ML classifiers using five-fold stratified cross-validation
| ML Classifier | Ac (in %) | Sen (in %) | Spe (in %) | F1-score (in %) | MCC (in %) | AUC (in %) |
|---|---|---|---|---|---|---|
| SVM | 96.70 | 96.70 | 98.35 | 96.70 | 95.09 | 99.71 |
| LR | 97.83 | 97.83 | 98.91 | 97.83 | 96.75 | 99.84 |
| kNN | 94.62 | 94.62 | 97.31 | 94.59 | 92.00 | 98.30 |
| DT | 89.83 | 89.83 | 94.91 | 89.84 | 84.77 | 95.28 |
| RF | 94.70 | 94.70 | 97.35 | 94.68 | 92.08 | 99.38 |
| XGB | 97.87 | 97.87 | 98.93 | 97.87 | 96.82 | 99.89 |
Fig. 4.
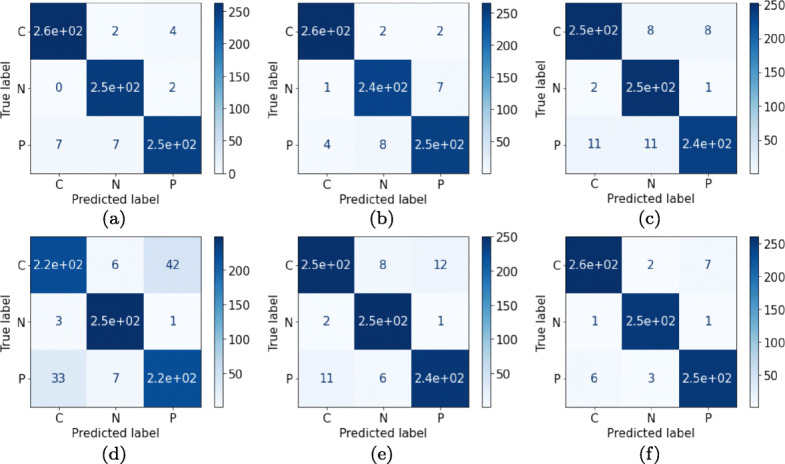
Confusion matrices for the features obtained by correlation phenomenon over respective classifiers for the validation dataset: (a) SVM (b) LR (c) kNN (d) DT (e) RF and (f) XGB with reference to COVID-19, Normal and Pneumonia patient‘s chest X-ray images
Auxiliary feature selection-based results
The results for the additional feature selection techniques are thus tabulated in Tables 5, 6 and 7.
Table 5.
Performance metrics based on mRMR feature selection technique with ML classifiers using five-fold stratified cross-validation
| ML Classifier | Ac (in %) | Sen (in %) | Spe (in %) | F1-score (in %) | MCC (in %) | AUC (in %) |
|---|---|---|---|---|---|---|
| SVM | 94.95 | 94.95 | 97.47 | 94.94 | 92.45 | 99.44 |
| LR | 97.50 | 97.50 | 98.75 | 97.49 | 96.26 | 99.81 |
| kNN | 91.20 | 91.20 | 95.60 | 91.18 | 86.83 | 96.96 |
| DT | 86.33 | 86.33 | 93.16 | 86.33 | 79.61 | 94.27 |
| RF | 89.20 | 89.20 | 94.60 | 89.15 | 83.82 | 97.79 |
| XGB | 96.66 | 96.66 | 98.33 | 96.65 | 95.01 | 99.79 |
Table 6.
Performance metrics based on Relief-f feature selection technique with ML classifiers using five-fold stratified cross-validation
| ML Classifier | Ac (in %) | Sen (in %) | Spe (in %) | F1-score (in %) | MCC (in %) | AUC (in %) |
|---|---|---|---|---|---|---|
| SVM | 91.83 | 91.83 | 95.91 | 91.80 | 87.76 | 98.63 |
| LR | 92.20 | 92.20 | 96.10 | 92.19 | 88.32 | 98.63 |
| kNN | 87.83 | 87.83 | 93.91 | 87.79 | 81.76 | 95.27 |
| DT | 87.16 | 87.16 | 93.58 | 87.14 | 80.80 | 94.43 |
| RF | 88.25 | 88.25 | 94.12 | 88.18 | 82.46 | 97.17 |
| XGB | 93.79 | 93.79 | 96.89 | 93.77 | 90.71 | 99.05 |
Table 7.
Performance metrics based on QPFS feature selection technique with ML classifiers using five-fold stratified cross-validation
| ML Classifier | Ac (in %) | Sen (in %) | Spe (in %) | F1-score (in %) | MCC (in %) | AUC (in %) |
|---|---|---|---|---|---|---|
| SVM | 95.37 | 95.37 | 97.68 | 95.34 | 93.10 | 99.54 |
| LR | 94.91 | 94.91 | 97.45 | 94.90 | 92.39 | 99.47 |
| kNN | 92.87 | 92.87 | 96.43 | 92.79 | 89.46 | 97.61 |
| DT | 86.12 | 86.12 | 93.06 | 86.05 | 79.40 | 93.67 |
| RF | 93.62 | 93.62 | 96.81 | 93.60 | 90.46 | 99.06 |
| XGB | 95.75 | 95.75 | 97.87 | 95.74 | 93.63 | 99.56 |
Table 5 infers that LR gave the best results out of all the classifiers with an Ac, Sen, Spe, and F1-Score of 97.50%, 97.50%, 98.75%, and 97.49%, respectively. When compared with the performance of the correlation-based results, it outputs lower accuracy content (as shown in Table 4). Table 6 shows the results of the Relief-based extracted feature classification by the ML classifiers. XGBoost, among all the used classifiers, gave the best results with an Ac, Sen, Spe, and F1-Score, 93.79%, 93.79%, 96.89%, and 93.77%, respectively. It can be inferred that the obtained results from the relief-based features are less when compared to the results obtained from correlation-based feature selection as shown in Table 4. Similarly, Table 7 shows the additional results for the QPFS-based extracted feature classification through ML classifiers. XGBoost Classifier (XGB) gave the best results with an Ac, Sen, Spe, and F1-Score, 95.75%, 95.75%, 97.87%, and 95.74%, respectively. The results obtained from using QPFS-based feature selection are quite less than the results obtained from correlation-based feature selection as shown in Table 4.
Deep feature-based classification
To validate the efficacy of the classification on the dataset and , an additional set of experiments utilizing the deep architectures, ResNet152 and GoogLeNet for deep feature extraction with ML classification are performed. Each network model generates representation vectors from images using the dataset . These vectors are then fed as input to the ML classifiers which infer if the image is COVID-19 or not. Predictions on the performance metrics as explained in Section 5.2 are obtained by each model. Corresponding results for each model’s prediction are summarized in Tables 8 and 9, respectively, confirming the robustness and effectiveness of the extracted features when used with pre-trained ImageNet CNN models. In total, 5216 images are used for training the deep models and the performance metrics in form of Ac, Sen, Spe, F1-score and MCC are presented for each class.
Table 8.
Performance metrics using the deep extracted feature with ResNet152 architecture for classification by ML classifiers with five-fold stratified cross validation
| ML Classifier | Ac (in %) | Sen (in %) | Spe (in %) | F1-Score (in %) | MCC (in %) | AUC (in %) |
|---|---|---|---|---|---|---|
| SVM | 96.62 | 96.62 | 98.31 | 96.61 | 94.96 | 99.69 |
| LR | 96.87 | 96.87 | 98.43 | 96.87 | 95.32 | 99.61 |
| kNN | 94.41 | 94.41 | 97.20 | 94.37 | 91.71 | 98.22 |
| DT | 88.37 | 88.37 | 94.18 | 88.38 | 82.57 | 93.77 |
| RF | 84.62 | 84.62 | 97.31 | 94.60 | 91.95 | 99.22 |
| XGB | 96.83 | 96.83 | 98.41 | 96.83 | 95.27 | 99.73 |
Table 9.
Performance metrics using the deep extracted feature with GoogLeNet architecture for classification by ML classifiers with five-fold stratified cross-validation
| ML Classifier | Ac (in %) | Sen (in %) | Spe (in %) | F1-Score (in %) | MCC (in %) | AUC (in %) |
|---|---|---|---|---|---|---|
| SVM | 96.62 | 96.62 | 98.31 | 96.61 | 94.96 | 99.69 |
| LR | 96.87 | 96.87 | 98.43 | 96.87 | 95.32 | 99.61 |
| kNN | 77.12 | 77.12 | 88.56 | 76.89 | 65.81 | 88.85 |
| DT | 80.79 | 80.79 | 90.39 | 80.71 | 71.32 | 91.61 |
| RF | 84.00 | 84.00 | 92.00 | 87.97 | 76.07 | 95.42 |
| XGB | 87.83 | 87.83 | 93.91 | 87.80 | 81.79 | 96.98 |
It is inferred that the model ResNet152 behaved much better than its GoogLeNet counterpart. The higher values for the performance is achieved by LR classifier with Ac of 96.87%, Sen96.87%, Spe98.43% and F1-score96.87% with second best performance of XGB with Ac of 96.83%, Sen96.83%, Spe98.41% and F1-score96.83%. The third best performance of Ac of 96.62%, Sen96.62%, Spe98.31% and F1-score96.61% are obtained by SVM. It can clearly be analysed that the model has produced consistent results with different ML predictive classifiers. Similar behaviour is seen in the results produced by the GoogLeNet architecture wherein the LR architecture performed with best results yielding an Ac of 96.87%, Sen96.87%, Spe98.43% and F1-score96.87% with second best performance of SVM with Ac of 96.62%, Sen96.62%, Spe98.31% and F1-score96.61%. The third best performance by XGB has Ac, Sen, Spe and F1-score of 87.83%, 87.83%, 98.41% and 96.83%, respectively.
In order to get further insight about the features of ResNet152 and GoogLeNet, feature visualization is employed using Grad-CAM technique. Grad-CAM plots the gradient weighted class activation mapping for providing the explainable view of deep learning models used. Figure 5 shows the concerned class activation mappings of the regions of potential features identified by ResNet152 and GoogLeNet on COVID-19, Normal and Pneumonia images.
Fig. 5.
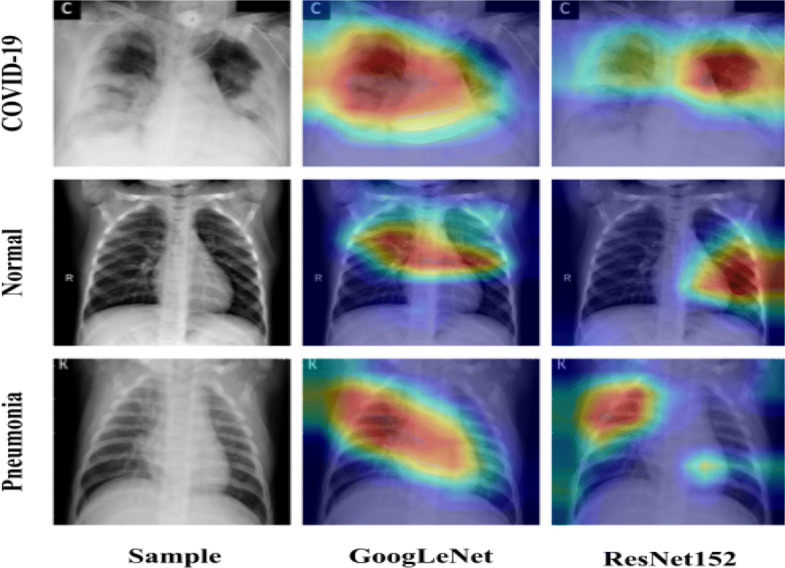
Grad-CAM images from the deep learning models identifying COVID-19, Normal and Pneumonia region
From Fig. 5, it is observed that ResNet152 is able to focus on more specific areas than GoogLeNet in a way that it has better understanding of the feature region. The class activation maps by ResNet152 signifies better quantitative results as tabulated in Table 8. Though GoogLeNet has also identified the features effectively, but has performed quantitatively less than ResNet152 as tabulated in Table 9. Similarly, visualization graph in the form of t-SNE [60] graphs are plotted for the extracted features from ResNet152, GoogLeNet and their combined features using PCC as shown in Fig. 6. Figure 6c shows that the Normal class features are accurately segregated from the other two classes. On the other hand, Pneumonia and COVID-19 classes have visibly distinct regions. However, GoogLeNet has also a similar pattern of features, they have a more intermix of the features among Pneumonia and COVID-19 classes than PCC based features. On the other hand, ResNet152 has a rather complex intermix of features from Pneumonia and COVID-19.
Fig. 6.
t-SNE Plot for features extracted from (a) ResNet152, (b) GoogLeNet and (c) Combined features of ResNet152 and GoogLeNet with PCC
Further, to analyze the possibility of using a light-weight feature extractor, we validated the proposed model with MobileNet [33] model architecture. Table 10 shows the additional results of the MobileNet-based extracted feature for classification with ML classifiers. Of all, LR gave the best results with an Ac, Sen and Spe and F1-Score of 96.41%, 96.41%, 98.20%, and 96.41%, respectively. The MobileNet has under-performed with respect to GoogLeNet and ResNet152 in classification tasks as were shown in Tables 9 and 8, respectively.
Table 10.
Performance metrics using the deep extracted feature with MobileNet architecture for classification by ML classifiers with five-fold stratified cross-validation
| ML Classifier | Ac (in %) | Sen (in %) | Spe (in %) | F1-Score (in %) | MCC (in %) | AUC (in %) |
|---|---|---|---|---|---|---|
| SVM | 95.62 | 95.62 | 97.81 | 95.60 | 93.49 | 99.34 |
| LR | 96.41 | 96.41 | 98.20 | 96.41 | 94.64 | 99.63 |
| kNN | 93.75 | 93.75 | 96.87 | 93.74 | 90.67 | 97.48 |
| DT | 87.20 | 87.20 | 93.60 | 87.14 | 80.95 | 91.45 |
| RF | 94.41 | 94.41 | 97.20 | 94.40 | 91.66 | 98.87 |
| XGB | 96.00 | 96.00 | 98.00 | 95.99 | 94.02 | 99.40 |
The visual representation of the results are illustrated using confusion matrix in Figs. 7 and 8 by each of the ML classifiers for COVID-19 classification. They explicitly show the output of a classification model on a collection of test data on which the true values are known. Figure 7 presents the confusion matrix for the pre-trained ResNet152 model. As can be seen from Fig. 7, most of the COVID-19 image samples are correctly classified with the minimal of COVID-19 samples as mis-classified. The rate of correct classification make this model appropriate for multi-class image classification among COVID-19, Normal and Pneumonia.
Fig. 7.
Confusion matrices for the features obtained by ResNet152 architecture over respective classifiers for the validation dataset: (a) SVM (b) LR and (c) XGB with reference to COVID-19, Normal and Pneumonia patient’s chest X-ray images
Fig. 8.
Confusion matrices for the features obtained by GoogLeNet architecture over respective classifiers for the validation dataset: (a) SVM (b) LR and (c) XGB with reference to COVID-19, Normal and Pneumonia patient‘s chest X-ray images
Similar is the case with the GoogLeNet architecture whose corresponding confusion matrix-based performance by each of the predictive classifiers are shown in Fig. 8.
A statistical indicator that measures the linear association between variables is the Pearson correlation coefficient (PCC) [45]. It can take values from − 1 to + 1. A value of + 1 is the total positive linear correlation with 0 not being a linear correlation, and the total negative linear correlation is − 1. In this study, in order to minimise the size of the feature space to an optimum number of features, we used PCC for the feature analysis scheme. For each pairwise function combination, the PCC results in a matrix (Fig. 9). Analysis of the histogram of the feature pool of the correlated features depicted in Fig. 10 show that more than 7000 features have zero correlation coefficient with the features are decreasing as the per the increasing correlation coefficient. It indicates that comprehensive feature pool is created in this study which contain relatively less redundancy.
Fig. 9.
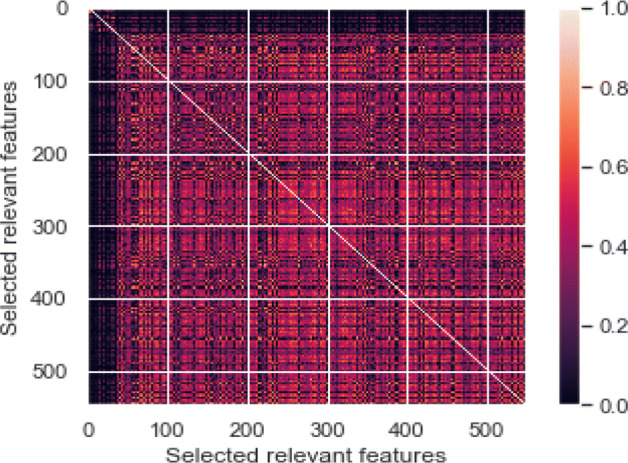
Heatmap of the selected features derived using PCC
Fig. 10.
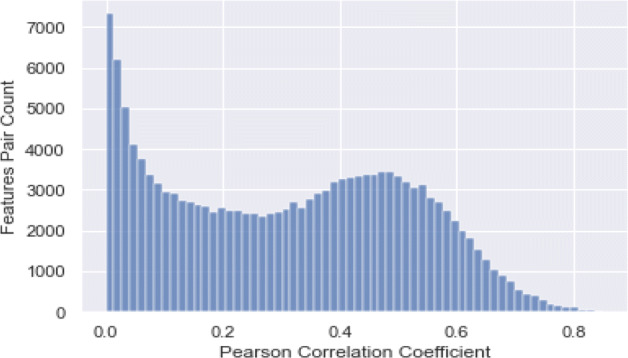
Distribution of selected feature pairs over PCC
The ROC and the bar graphs
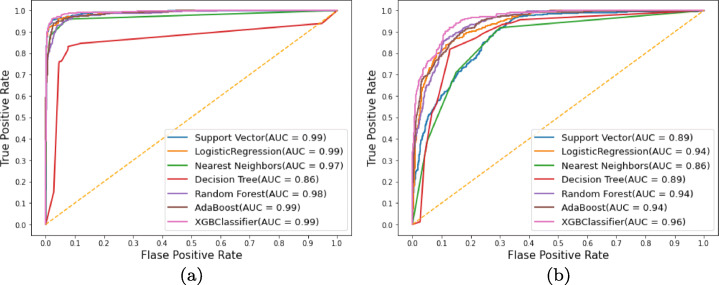
To further examine the efficacy of the proposed approach, we evaluated the overall comparison between the models for all the threshold values. For this, receiver operating characteristics (ROC) curves are used to demonstrate the diagnostic potential of a classifier system when the threshold for discrimination is varied. They provide the true positive rate as a function of false positive rate and plot a graph between the two. The ROC curves for the feature extraction followed by ML-based classification using the deep models: ResNet152 and GoogLeNet, are as shown in Fig. 11a and b.
Fig. 11.
ROC curves using (a) ResNet152 and (b) GoogleNet with various machine learning classifiers
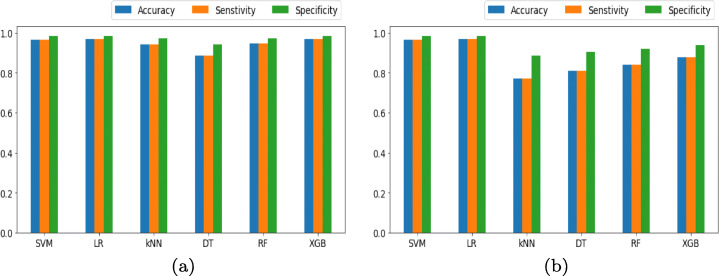
Striking performance of the ML classifiers in accurately understanding the ResNet152 architecture-based features is seen. Figure 12 shows the comparison between the achieved Ac, Sen and Spe for the ResNet152 and GoogLeNet based deep features with ML-based classification.
Fig. 12.
Bar plots using (a) ResNet152 and (b) GoogleNet with various machine learning classifiers comparing accuracy, senstivity and specificity
Every classifier in Fig. 12a classifying the deep model ResNet152 based features, have a higher AUC (near to 1) which is better when compared to Fig. 12b, which has the classification based on the GoogLeNet based extracted features. Classifier DT for the ResNet152 based feature classification performed lowest among all the classifiers while every classifier in the case of GoogLeNet based feature classification case performed equally but less when compared to ResNet152.
Similarly, the performance for correlation-based feature selection with the ML based classification approach is shown in the Fig. 13. The best performance in terms of the AUC for ROC curves is depicted by XGB classifier with a value of 1 while all the other classifiers achieving values close to 1. Figure 14 shows the comparison among the achieved Ac, Sen and Spe for the combined features (ResNet152+GoogLeNet) based deep features with ML based classification.
Fig. 13.
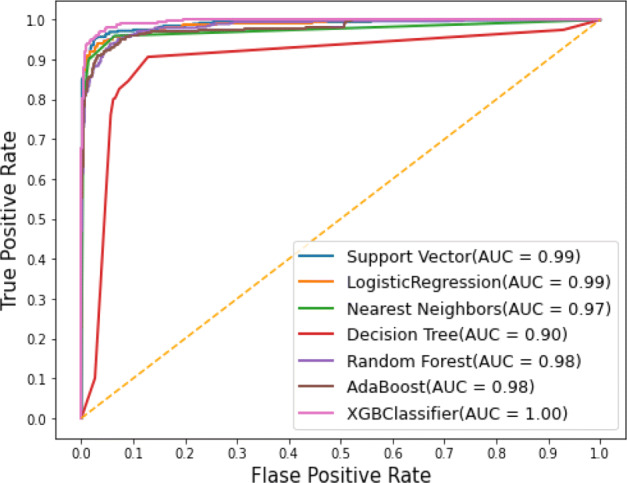
ROC curves using correlation-based feature selection with various ML classifiers
Fig. 14.
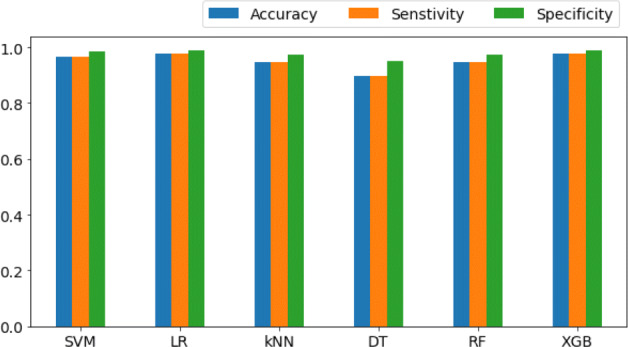
Bar plots using correlation-based feature selection with various ML classifiers comparing Ac, Sen and Spe
A detailed comparison of the proposed approach with the state-of-the-art methodologies is presented in Table 11 which infers successful and better results for the proposed framework. Wang et al. [61] introduced COVID-Net architecture for the diagnosis of COVID-19 over X-ray dataset using tailored CNN and reported an accuracy of 92.6% for the disease classification. Similarly, Afshar et al. [2] suggested a deep learning method focused on a capsule network, to detect the COVID-19 using chest X-ray images and achieved classification accuracy 95.17%, which is less than our proposed methods for COVID-19 and other classes. In another study, Ghoshal et al. [24] introduced a deep model based on Bayesian Convolutionary Neural Networks to classify COVID-19 over chest X-ray images. In their findings, they reported an accuracy of 88.39% to classify the disease accurately. For the detection of COVID-19, Li et al. [43] suggested a discriminative cost-sensitive learning based model and reported an accuracy of 97.01% over chest X-ray images. Sethy et al. [57] presented a deep CNNs architecture using the ResNet50 model with SVM for the detection of COVID-19 and reported an accuracy of 95.38% to classifier infected patients with X-ray images. In order to quantify the effects of five separate deep architectures, Apostolopoulos et al. [6] suggested a transfer learning method for the detection of COVID-19 infected patients and reported an overall accuracy of 93.48% over X-ray images.
Table 11.
Comparison of different models against the same dataset using three metrics
| Study | Methodology | Ac (in %) | Sen (in %) | Spe (in %) |
|---|---|---|---|---|
| Wang et al. [61] | Tailored CNN | 92.60 | – | – |
| Afsharet al. [2] | CNN-based Capsule Networks | 95.70 | 80.0 | 98.6 |
| Ghoshal et al. [24] | Bayesian CNN (ResNet50) | 88.39 | – | – |
| Li et al. [43] | Discriminative cost-sensitive learning | 97.01 | 97.21 | – |
| Sethy et al. [57] | ResNet50+SVM | 95.38 | 97.29 | 93.47 |
| Apostolopoulos et al. [6] | VGG19 | 93.48 | 92.85 | 98.75 |
| Proposed methodology | CNN+PCC+ML-classifier | 97.87 | 97.87 | 98.93 |
Conclusion
We presented a framework combining ML and DL techniques for COVID-19 detection using chest X-ray images, by correlating deep features from pre-trained ResNet152 and GoogLeNet with the ML-based classifiers. We extracted the rich set of COVID-19 images from the public logging domain and used as a source of extracting features. A detailed analysis on the feature correlation has been performed in terms of Ac, Sen, Spe, F1-score, MCC and ROC. ML-based classifiers have accurately identified the extracted features and performed better than the previous related works for COVID-19 feature detection. XGBoost (XGB) has outperformed among all the classifiers with an Ac, Sen, Spe and F1-score of 97.87%, 97.87%, 98.93% and 97.87%, respectively. It is highly encouraging that the proposed model assured that the X-ray images can effectively be used for COVID-19 diagnosis. The dataset contains 768 COVID-19 images with 800 Normal and 800 Pneumonia images. Combining many COVID-19images with less Pneumonia and Normal images have encouraged us in analysing the efficacy of the approach used. The work presented here, has been a structured attempt in classifying the dataset in time-bound manner. However, many more experiments can be performed on account of more COVID-19 images for reliable estimation of the deep learning architectures used. The major limitation of the proposed work is the unavailability of a large number of images for COVID-19 which could have helped the authors for scratch training of the pre-trained network architectures used. For the future works, the radiological expertise can also be incorporated for removing the irregularities in annotated dataset. For the protection of health line workers in the front-end of the process, we are aimed to develop contact-less diagnostic methods for image capture.
Funding Information
There is no funding provided in the course of this study.
Footnotes
Rahul Kumar, Ridhi Arora, Vipul Bansal and Narayanan Narayanan contributed equally to the manuscript.
Publisher’s note
Springer Nature remains neutral with regard to jurisdictional claims in published maps and institutional affiliations.
Contributor Information
Rahul Kumar, Email: rkumar9@cs.iitr.ac.in.
Ridhi Arora, Email: rarora@cs.iitr.ac.in.
Vipul Bansal, Email: vbansal@me.iitr.ac.in.
Vinodh J Sahayasheela, Email: vinodh@chemb.kuchem.kyoto-u.ac.jp.
Himanshu Buckchash, Email: hbuckchash@cs.iitr.ac.in.
Javed Imran, Email: javed.imran@ddn.upes.ac.in.
Narayanan Narayanan, Email: nn@annalakshmi.net.
Ganesh N Pandian, Email: ganesh@kuchem.kyoto-u.ac.jp.
Balasubramanian Raman, Email: bala@cs.iitr.ac.in.
References
- 1.Abbas A, Abdelsamea M M, Gaber M M (2020) Classification of covid-19 in chest x-ray images using detrac deep convolutional neural network. arXiv preprint arXiv:2003.13815 [DOI] [PMC free article] [PubMed]
- 2.Afshar P, Heidarian S, Naderkhani F, Oikonomou A, Plataniotis KN, Mohammadi A. Covid-caps: A capsule network-based framework for identification of covid-19 cases from x-ray images. Pattern Recogn Lett. 2020;138:638–643. doi: 10.1016/j.patrec.2020.09.010. [DOI] [PMC free article] [PubMed] [Google Scholar]
- 3.Ai T, Yang Z, Hou H, Zhan C, Chen C, Lv W, Tao Q, Sun Z, Xia L (2020) Correlation of chest ct and rt- pcr testing in coronavirus disease 2019 (covid-19) in china: a report of 1014 cases. Radiology, pp 200642 [DOI] [PMC free article] [PubMed]
- 4.Alimadadi A, Aryal S, Manandhar I, Munroe PB, Joe B, Cheng X (2020) Artificial intelligence and machine learning to fight covid-19 [DOI] [PMC free article] [PubMed]
- 5.Altman NS. An introduction to kernel and nearest-neighbor non parametric regression. The American Statistician. 1992;46(3):175–185. [Google Scholar]
- 6.Apostolopoulos ID, Mpesiana TA. Covid-19: Automatic detection from x-ray images utilizing transfer learning with convolutional neural networks. Physical and Engineering Sciences in Medicine. 2020;43(2):635–640. doi: 10.1007/s13246-020-00865-4. [DOI] [PMC free article] [PubMed] [Google Scholar]
- 7.Arora R, Bansal V, Buckchash H, Kumar R, Sahayasheela V J, Narayanan N, Pandian G N, Raman B (2020) Ai-based diagnosis of covid-19 patients using x-ray scans with stochastic ensemble of cnns. TechRxiv [DOI] [PMC free article] [PubMed]
- 8.Barstugan M, Ozkaya U, Ozturk S (2020) Coronavirus (covid-19) classification using ct images by machine learning methods. arXiv preprint arXiv:2003.09424
- 9.Basu S, Mitra S, Saha N (2020) Deep learning for screening covid-19 using chest x-ray images. In: 2020 IEEE symposium series on computational intelligence (SSCI). IEEE, pp 2521–2527
- 10.Benesty J, Chen J, Huang Y, Cohen I (2009) Pearson correlation coefficient. In: Noise reduction in speech processing. Springer, pp 1–4
- 11.Bergstra J, Bengio Y (2012) Random search for hyper-parameter optimization. Journal of machine learning research, 13(2)
- 12.Breiman L. Random forests. Mach Learn. 2001;45(1):5–32. doi: 10.1023/A:1010933404324. [DOI] [Google Scholar]
- 13.Bukhari SUK, Bukhari SSK, Syed A, Shah SSH (2020) The diagnostic evaluation of convolutional neural network (cnn) for the assessment of chest x-ray of patients infected with covid-19. medRxiv
- 14.Chandra TB, Verma K, Singh BK, Jain D, Netam SS. Coronavirus disease (covid-19) detection in chest x-ray images using majority voting based classifier ensemble. Expert Systems with Applications. 2020;165:113909. doi: 10.1016/j.eswa.2020.113909. [DOI] [PMC free article] [PubMed] [Google Scholar]
- 15.Chen N, Zhou M, Dong X, Qu J, Gong F, Han Y, Qiu Y, Wang J, Liu Y, Wei Y, et al. Epidemiological and clinical characteristics of 99 cases of 2019 novel coronavirus pneumonia in Wuhan, China: a descriptive study. The Lancet. 2020;395(10223):507–513. doi: 10.1016/S0140-6736(20)30211-7. [DOI] [PMC free article] [PubMed] [Google Scholar]
- 16.Chen T, Guestrin C (2016) Xgboost: A scalable tree boosting system. In: Proceedings of the 22nd acm sigkdd international conference on knowledge discovery and data mining, pp 785–794
- 17.Chen X, Yao L, Zhou T, Dong J, Zhang Y (2020) Momentum contrastive learning for few-shot covid-19 diagnosis from chest ct images. arXiv preprint arXiv:2006.13276 [DOI] [PMC free article] [PubMed]
- 18.Chest X-Ray Images (Pneumonia). Accessed on : May 7, 2020, https://www.kaggle.com/paultimothymooney/chest-xray-pneumoniahttps://www.kaggle.com/ https://www.kaggle.com/paultimothymooney/chest-xray-pneumoniapaultimothymooney/chest-xray-pneumonia
- 19.Cohen JP, Morrison P, Dao L (2020) Covid-19 image data collection. arXiv:2003.11597
- 20.Cohen JP, Morrison P, Dao L, Roth K, Duong TQ, Ghassemi M (2020) Covid-19 image data collection: Prospective predictions are the future. arXiv:2006.11988
- 21.Cortes C, Vapnik V. Support-vector networks. Mach Learn. 1995;20(3):273–297. [Google Scholar]
- 22.El Asnaoui K, Chawki Y (2020) Using x-ray images and deep learning for automated detection of coronavirus disease. Journal of Biomolecular Structure and Dynamics, pp 1–12 [DOI] [PMC free article] [PubMed]
- 23.Farooq M, Hafeez A (2020) Covid-resnet: a deep learning framework for screening of covid19 from radiographs. arXiv preprint arXiv:2003.14395
- 24.Ghoshal B, Tucker A (2020) Estimating uncertainty and interpretability in deep learning for coronavirus (covid-19) detection. arXiv preprint arXiv:2003.10769
- 25.Gribbon KT, Bailey DG (2004) A novel approach to real-time bilinear interpolation. In: Proceedings. DELTA 2004. Second IEEE international workshop on electronic design, test and applications. IEEE, pp 126–131
- 26.Gupta A, Kumar R, Singh Arora H, Raman B. MIFH: A machine intelligence framework for heart disease diagnosis. IEEE Access. 2020;8:14659–14674. doi: 10.1109/ACCESS.2019.2962755. [DOI] [Google Scholar]
- 27.Guyon I, Elisseeff A. An introduction to variable and feature selection. J Mach Learn Res. 2003;3(Mar):1157–1182. [Google Scholar]
- 28.Hammoudi K, Benhabiles H, Melkemi M, Dornaika F, Arganda-Carreras I, Collard D, Scherpereel A (2020) Deep learning on chest x-ray images to detect and evaluate pneumonia cases at the era of covid-19. arXiv preprint arXiv:2004.03399 [DOI] [PMC free article] [PubMed]
- 29.Peng H, Long F, Ding C. Feature selection based on mutual information criteria of max-dependency, max-relevance, and min-redundancy. IEEE Trans Pattern Anal Mach Intell. 2005;27(8):1226–1238. doi: 10.1109/TPAMI.2005.159. [DOI] [PubMed] [Google Scholar]
- 30.Hanley JA, McNeil BJ. The meaning and use of the area under a receiver operating characteristic (ROC) curve. Radiology. 1982;143(1):29–36. doi: 10.1148/radiology.143.1.7063747. [DOI] [PubMed] [Google Scholar]
- 31.He K, Zhang X, Ren S, Sun J (2016) Deep residual learning for image recognition. In: Proceedings of the IEEE conference on computer vision and pattern recognition, pp 770–778
- 32.Hosmer DW, Lemeshow S. Applied logistic regression. New York: John Wiley & Sons; 2000. [Google Scholar]
- 33.Howard A, Zhu M, Chen B, Kalenichenko D, Wang W, Weyand T, Andreetto M, Adam H (2017) Mobilenets: Efficient convolutional neural networks for mobile vision applications. arXiv:1704.04861
- 34.Hui DS, I Azhar E, Madani TA, Ntoumi F, Kock R, Dar O, Ippolito G, Mchugh TD, Memish ZA, Drosten C, et al. The continuing 2019-ncov epidemic threat of novel coronaviruses to global health—the latest 2019 novel coronavirus outbreak in wuhan, china. International Journal of Infectious Diseases. 2020;91:264–266. doi: 10.1016/j.ijid.2020.01.009. [DOI] [PMC free article] [PubMed] [Google Scholar]
- 35.Imran A, Posokhova I, Qureshi HN, Masood U, Riaz S, Ali K, John CN, Nabeel M (2020) Ai4covid-19: Ai enabled preliminary diagnosis for covid-19 from cough samples via an app. arXiv preprint arXiv:2004.01275 [DOI] [PMC free article] [PubMed]
- 36.Ismael AM, Şengür A. Deep learning approaches for covid-19 detection based on chest x-ray images. Expert Syst Appl. 2020;164:114054. doi: 10.1016/j.eswa.2020.114054. [DOI] [PMC free article] [PubMed] [Google Scholar]
- 37.Kanne JP, Little BP, Chung JH, Elicker BM, Ketai LH (2020) Essentials for radiologists on covid-19: an update—radiology scientific expert panel [DOI] [PMC free article] [PubMed]
- 38.Kingma DP, Ba J (2015) Adam: A method for stochastic optimization. CoRR, arXiv:abs/1412.6980
- 39.Krizhevsky A, Sutskever I, Hinton GE. Imagenet classification with deep convolutional neural networks. Commun ACM. 2017;60(6):84–90. doi: 10.1145/3065386. [DOI] [Google Scholar]
- 40.Kumar R, Arora R, Bansal V, Sahayasheela VJ, Buckchash H, Imran J, Narayanan N, Pandian GN, Raman B (2020) Accurate prediction of covid-19 using chest x-ray images through deep feature learning model with smote and machine learning classifiers. medRxiv
- 41.Lee Rodgers J, Nicewander WA. Thirteen ways to look at the correlation coefficient. The American Statistician. 1988;42(1):59–66. doi: 10.1080/00031305.1988.10475524. [DOI] [Google Scholar]
- 42.Li L, Qin L, Xu Z, Yin Y, Wang X, Kong B, Bai J, Lu Y, Fang Z, Song Q et al (2020) Artificial intelligence distinguishes covid-19 from community acquired pneumonia on chest ct. Radiology, pp 200905 [DOI] [PMC free article] [PubMed]
- 43.Li T, Han Z, Wei B, Zheng Y, Hong Y, Cong J (2020) Robust screening of covid-19 from chest x-ray via discriminative cost-sensitive learning. arXiv preprint arXiv:2004.12592
- 44.Li X, Li C, Zhu D (2020) Covid-mobilexpert: On-device covid-19 patient triage and follow-up using chest x-rays. arXiv preprint arXiv:2004.03042
- 45.Liu H, Li J, Wong L. A comparative study on feature selection and classification methods using gene expression profiles and proteomic patterns. Genome Informatics. 2002;13:51–60. [PubMed] [Google Scholar]
- 46.Loey M, Smarandache F, M Khalifa NE. Within the lack of chest covid-19 x-ray dataset: a novel detection model based on gan and deep transfer learning. Symmetry. 2020;12(4):651. doi: 10.3390/sym12040651. [DOI] [Google Scholar]
- 47.Matthews BW. Comparison of the predicted and observed secondary structure of T4 phage lysozyme. Biochimica et Biophysica Acta (BBA)-Protein Structure. 1975;405(2):442–451. doi: 10.1016/0005-2795(75)90109-9. [DOI] [PubMed] [Google Scholar]
- 48.Nayak SR, Nayak DR, Sinha U, Arora V, Pachori RB. Application of deep learning techniques for detection of covid-19 cases using chest x-ray images: A comprehensive study. Biomedical Signal Processing and Control. 2020;64:102365. doi: 10.1016/j.bspc.2020.102365. [DOI] [PMC free article] [PubMed] [Google Scholar]
- 49.Oh Y, Park S, Ye JC (2020) Deep learning covid-19 features on cxr using limited training data sets. IEEE Transactions on Medical Imaging [DOI] [PubMed]
- 50.Ozturk T, Talo M, Yildirim E A, Baloglu U B, Yildirim O, Acharya U R (2020) Automated detection of covid-19 cases using deep neural networks with x-ray images. Computers in Biology and Medicine, pp 103792 [DOI] [PMC free article] [PubMed]
- 51.Quinlan JR. Induction of decision trees. Mach Learn. 1986;1(1):81–106. [Google Scholar]
- 52.Rahimzadeh M, Attar A. A modified deep convolutional neural network for detecting covid-19 and pneumonia from chest x-ray images based on the concatenation of xception and resnet50v2. Informatics in Medicine Unlocked. 2020;19:100360. doi: 10.1016/j.imu.2020.100360. [DOI] [PMC free article] [PubMed] [Google Scholar]
- 53.Rahmatizadeh S, Valizadeh-Haghi S, Dabbagh A. The role of artificial intelligence in management of critical covid-19 patients. Journal of Cellular & Molecular Anesthesia. 2020;5(1):16–22. [Google Scholar]
- 54.Randhawa GS, Soltysiak MPM, El Roz H, de Souza CPE, Hill KA, Kari L. Machine learning using intrinsic genomic signatures for rapid classification of novel pathogens: Covid-19 case study. Plos One. 2020;15(4):e0232391. doi: 10.1371/journal.pone.0232391. [DOI] [PMC free article] [PubMed] [Google Scholar]
- 55.Rodriguez-Lujan I, Huerta R, Elkan C, Cruz CS. Quadratic programming feature selection. J Mach Learn Res. 2010;11(49):1491–1516. [Google Scholar]
- 56.Sethy PK, Behera SK (2020) Detection of coronavirus disease (covid-19) based on deep features
- 57.Sethy PK, Behera SK, Ratha PK, Biswas P (2020) Detection of coronavirus disease (covid-19) based on deep features and support vector machine
- 58.Szegedy C, Liu W, Jia Y, Sermanet P, Reed S, Anguelov D, Erhan D, Vanhoucke V, Rabinovich A (2015) Going deeper with convolutions. In: Proceedings of the IEEE conference on computer vision and pattern recognition, pp 1–9
- 59.Urbanowicz RJ, Meeker M, La Cava W, Olson RS, Moore JH. Relief-based feature selection: Introduction and review. J Biomed Inform. 2018;85:189–203. doi: 10.1016/j.jbi.2018.07.014. [DOI] [PMC free article] [PubMed] [Google Scholar]
- 60.van der Maaten L, Hinton G. Visualizing data using t-sne. J Mach Learn Res. 2008;9(86):2579–2605. [Google Scholar]
- 61.Wang L, Lin ZQ, Wong A. Covid-net: A tailored deep convolutional neural network design for detection of covid-19 cases from chest x-ray images. Scientific Reports. 2020;10(1):1–12. doi: 10.1038/s41598-019-56847-4. [DOI] [PMC free article] [PubMed] [Google Scholar]
- 62.Wang L, Wong A (2020) Covid-net: A tailored deep convolutional neural network design for detection of covid-19 cases from chest radiography images. arXiv preprint arXiv:2003.09871 [DOI] [PMC free article] [PubMed]
- 63.Wang S-H, Govindaraj VV, Górriz JM, Zhang X, Zhang Y-D. Covid-19 classification by fgcnet with deep feature fusion from graph convolutional network and convolutional neural network. Inform Fusion. 2020;67:208–229. doi: 10.1016/j.inffus.2020.10.004. [DOI] [PMC free article] [PubMed] [Google Scholar]
- 64.World Health Organization; COVID-19 Weekly Epidemiological Update. Accessed on : Nov 10, 2020, https://www.who.int/publications/m/item/weekly-epidemiological-update---10-november-2020
- 65.World Health Organization; Naming the coronavirus disease (covid-19) and the virus that causes it. 2020. Accessed on : May 7, 2020, https://www.who.int/emergencies/diseases/novel-coronavirus-2019/technical-guidance/naming-the-coronavirus-disease-(covid-2019)-and-the-virus-that-causes-it
- 66.World Health Organization; Q & A on coronaviruses (COVID-19). Accessed on : May 7, 2020, https://www.who.int/news-room/q-a-detail/q-a-coronaviruses
- 67.Zweig MH, Campbell G. Receiver-operating characteristic (ROC) plots: A fundamental evaluation toolin clinical medicine. Clin Chem. 1993;39(4):561–577. doi: 10.1093/clinchem/39.4.561. [DOI] [PubMed] [Google Scholar]


