Abstract
Site-1 sodium channel blockers (S1SCBs) act as potent local anaesthetics, but they can cause severe systemic toxicity. Delivery systems can be used to reduce the toxicity, but the hydrophilicity of S1SCBs makes their encapsulation challenging. Here, we report a self-assembling delivery system for S1SCBs whose design is inspired by the specific interactions of S1SCBs with two peptide sequences on the sodium channel. Specifically, the peptides were modified with hydrophobic domains so that they could assemble into nanofibres that facilitated specific binding with the S1SCBs tetrodotoxin, saxitoxin and dicarbamoyl saxitoxin. Injection of S1SCB-carrying nanofibres at the sciatic nerves of rats led to prolonged nerve blockade and to reduced systemic toxicity, with benign local-tissue reaction. The strategy of mimicking a molecular binding site via supramolecular interactions may be applicable more broadly to the design of drug delivery systems for receptor-mediated drugs.
Formulations providing prolonged local anaesthesia could have a major impact on pain management by improving patient comfort and reducing dependence on opioids. In response to that largely unmet need, there has been considerable interest in developing drug delivery systems to prolong the duration of local anaesthetic effects1,2. In that context, site-1 sodium channel blockers (S1SCBs) are appealing as local anaesthetics due to their great potency and the fact that they do not cause the local neurotoxicity and myotoxicity seen with conventional amino-amide and amino-ester local anaesthetics3–8. However, their systemic toxicity can be severe and their therapeutic index is narrow2,3,9,10. Therefore, it is important for carriers to control their release to extend the duration of effect and minimize toxicity. We have developed many particle-based delivery systems for S1SCBs and achieved prolonged nerve blockade10–15. However, the hydrophilicity of S1SCBs makes physical encapsulation in hydrophobic vehicles challenging, such that encapsulation efficiency is low and the initial burst release can cause toxicity10,11.
Results and discussion
S1SCBs block the same sodium channel (for example, the voltage-gated sodium channel Nav1.7) as conventional local anaesthetics, but at a different site on the outer surface of the cell16,17 (Fig. 1a). We hypothesized that S1SCBs such as tetrodotoxin (TTX; Fig. 1b) and saxitoxin (STX; Fig. 1c) would have affinity for their specific binding sites on the sodium channel, and that this affinity could be used to create a sustained release system. We therefore selected two key peptide sequences—P1 (TQDYWEN) and P2 (CGEWIET) (Fig. 1d and Supplementary Tables 1 and 2)—that simultaneously bind S1SCBs at the binding site18–20 and examined whether a mixture of the two (termed P1P2) could interact specifically to bind TTX, thereby creating a controlled release system (that is, slowing its release). Release of TTX from P1P2 from 0.5 ml of P1P2 in dialysis tubing into 14 ml of PBS (the molar ratio of P1:P2:TTX was 1:1:1 at a concentration of 62.6 μM; Methods) was quantified by enzyme-linked immunosorbant assays (ELISAs)12–15 (Supplementary Information). The peptides had relatively little effect on the diffusion of TTX, even when the concentrations of P1 and P2 were increased tenfold (Supplementary Fig. 1). Transmission electron microscopy (TEM) images showed that no uniform self-assembled supramolecular structures formed in P1P2 solutions with or without added TTX (Supplementary Fig. 2a). The mean diameter of P1P2 with TTX was 3.0 ± 1.8 nm, and the polydispersity index was 0.6, as determined by dynamic light scattering (DLS) (Supplementary Fig. 2b). Moreover, when a 635-nm laser was passed through a solution of P1P2 with TTX, the beam could not be seen (Supplementary Fig. 2b; the presence of a Tyndall phenomenon would have been indicative of the presence of nanomaterials21,22). These results indicate that the system did not form nanostructures, which suggests that the distances between P1, P2 and TTX were too long to generate effective supramolecular interactions23.
Fig. 1 |. S1SCBs and peptide selection.
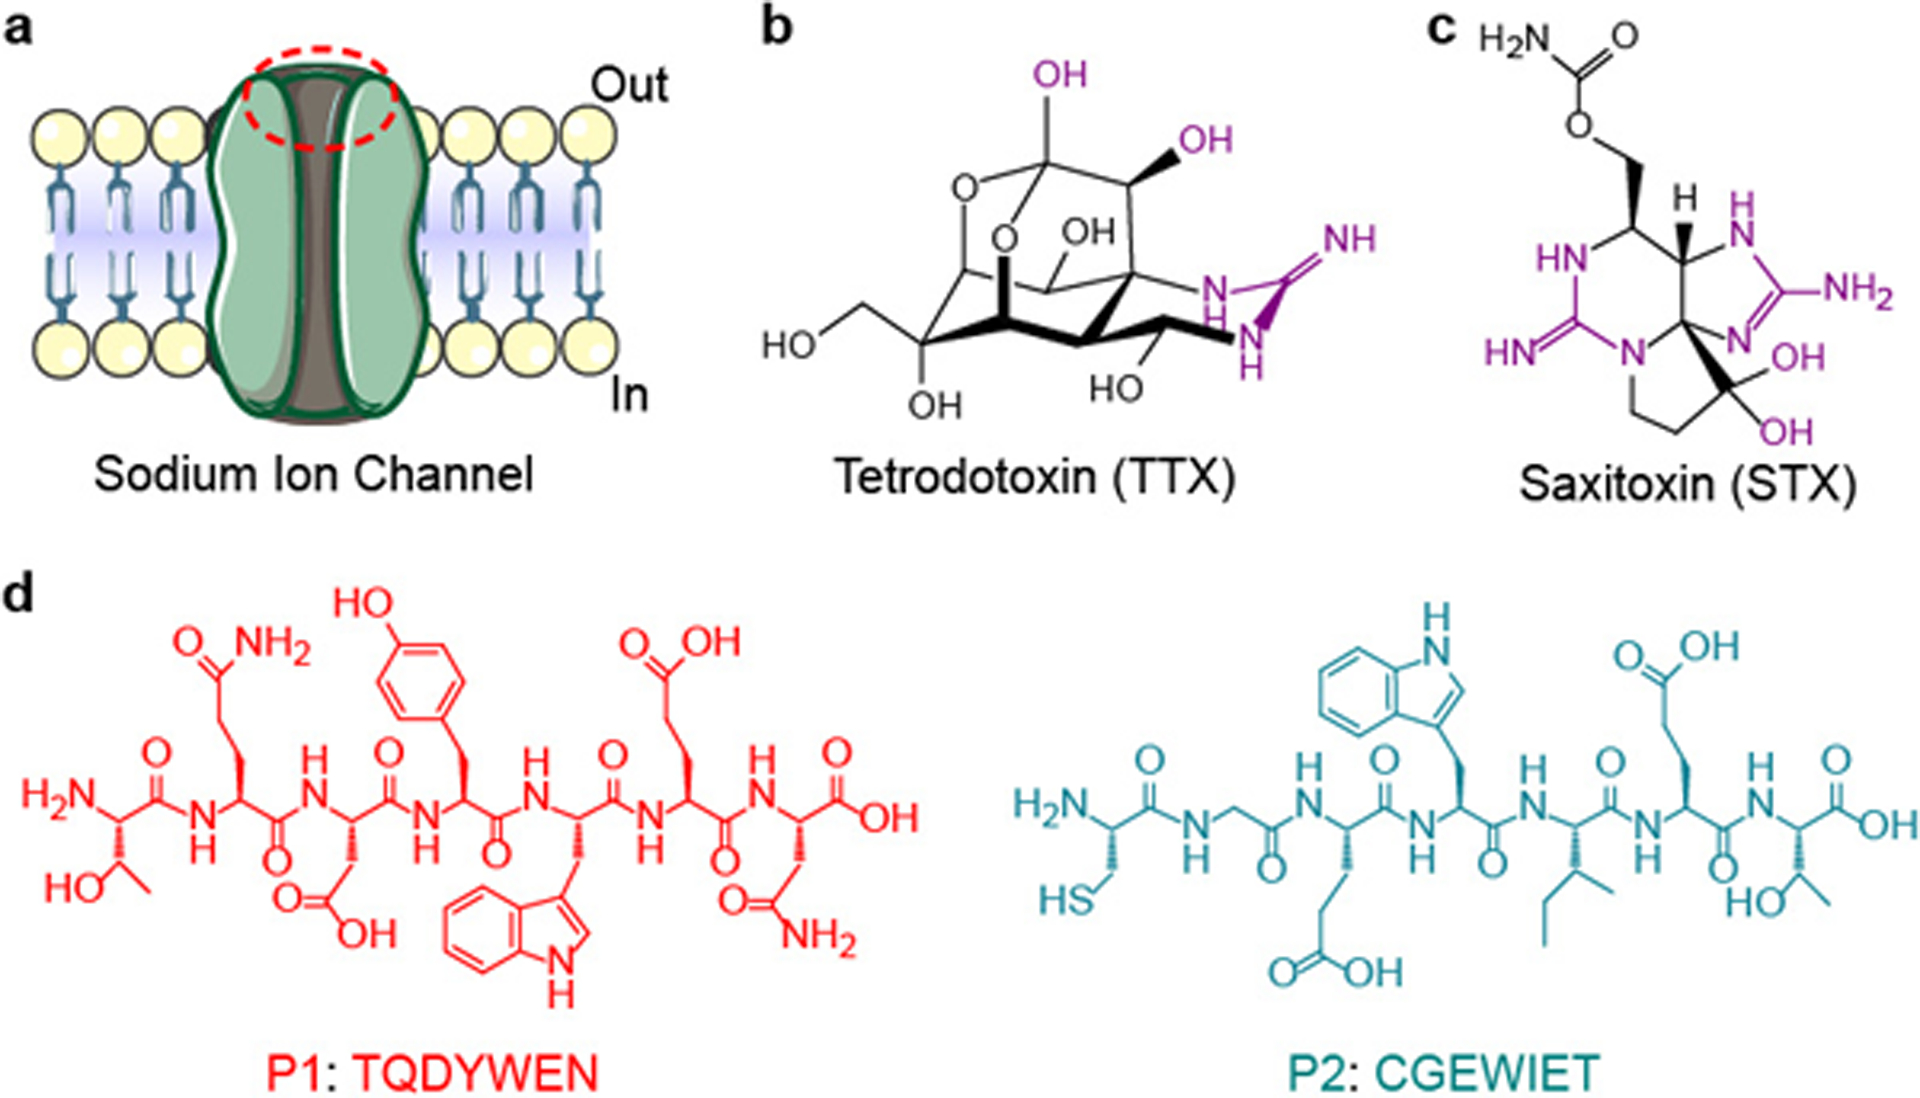
a, Schematic of the sodium ion channel. The S1SCB-binding site is labelled with a red dashed oval. b,c, The molecular structures of TTX (b) and STX (c). The key portion that interacts with the sodium channel is highlighted in purple. d, Molecular structures of the key peptide sequences from the S1SCB-binding site.
In the native sodium channel, TTX interacts with the P1 and P2 sequences through hydrogen bonds and electrostatic interactions, among others, over distances less than 5 Å (refs.24–27). We hypothesized that bringing P1 and P2 closer together would facilitate interactions with TTX and that proximity could be achieved by modifying them with hydrophobic domains, leading to modified peptides (MPs; MP1 and MP2 denote modifications of P1 and P2, respectively) that would assemble into nanostructures28–30 (Fig. 2a). The proportion by molecular weight of hydrophobic domains in the MPs can influence self-assembly31,32, which in this case could affect the binding of TTX to the P1 and P2 sequences. Consequently, we designed peptides modified with different hydrophobic domains at the amino-terminus of P1 and P2 via a glycine (G) linker. The hydrophobic domains selected (in increasing molecular weight) were dodecanoic acid (C12) and octadecanoic acid (C18), and two peptides composed of hydrophobic amino acids (phenylalanine (F), tyrosine (Y) and leucine (L)) that were conjugated at the N terminus to benzoic acid to produce Benz-FFFLL and Benz-YFYLL (Fig. 2b and Supplementary Tables 1 and 2). Such hydrophobic sequences have been used to construct self-assembling amphiphilic peptides33–36. The resulting MPs were named C12-Pn (n = 1 or 2, corresponding to the modification of P1 or P2), C18-Pn, ϕFFF-Pn and ϕYFY-Pn, respectively.
Fig. 2 |. Nanostructures of the self-assembled MP pairs.
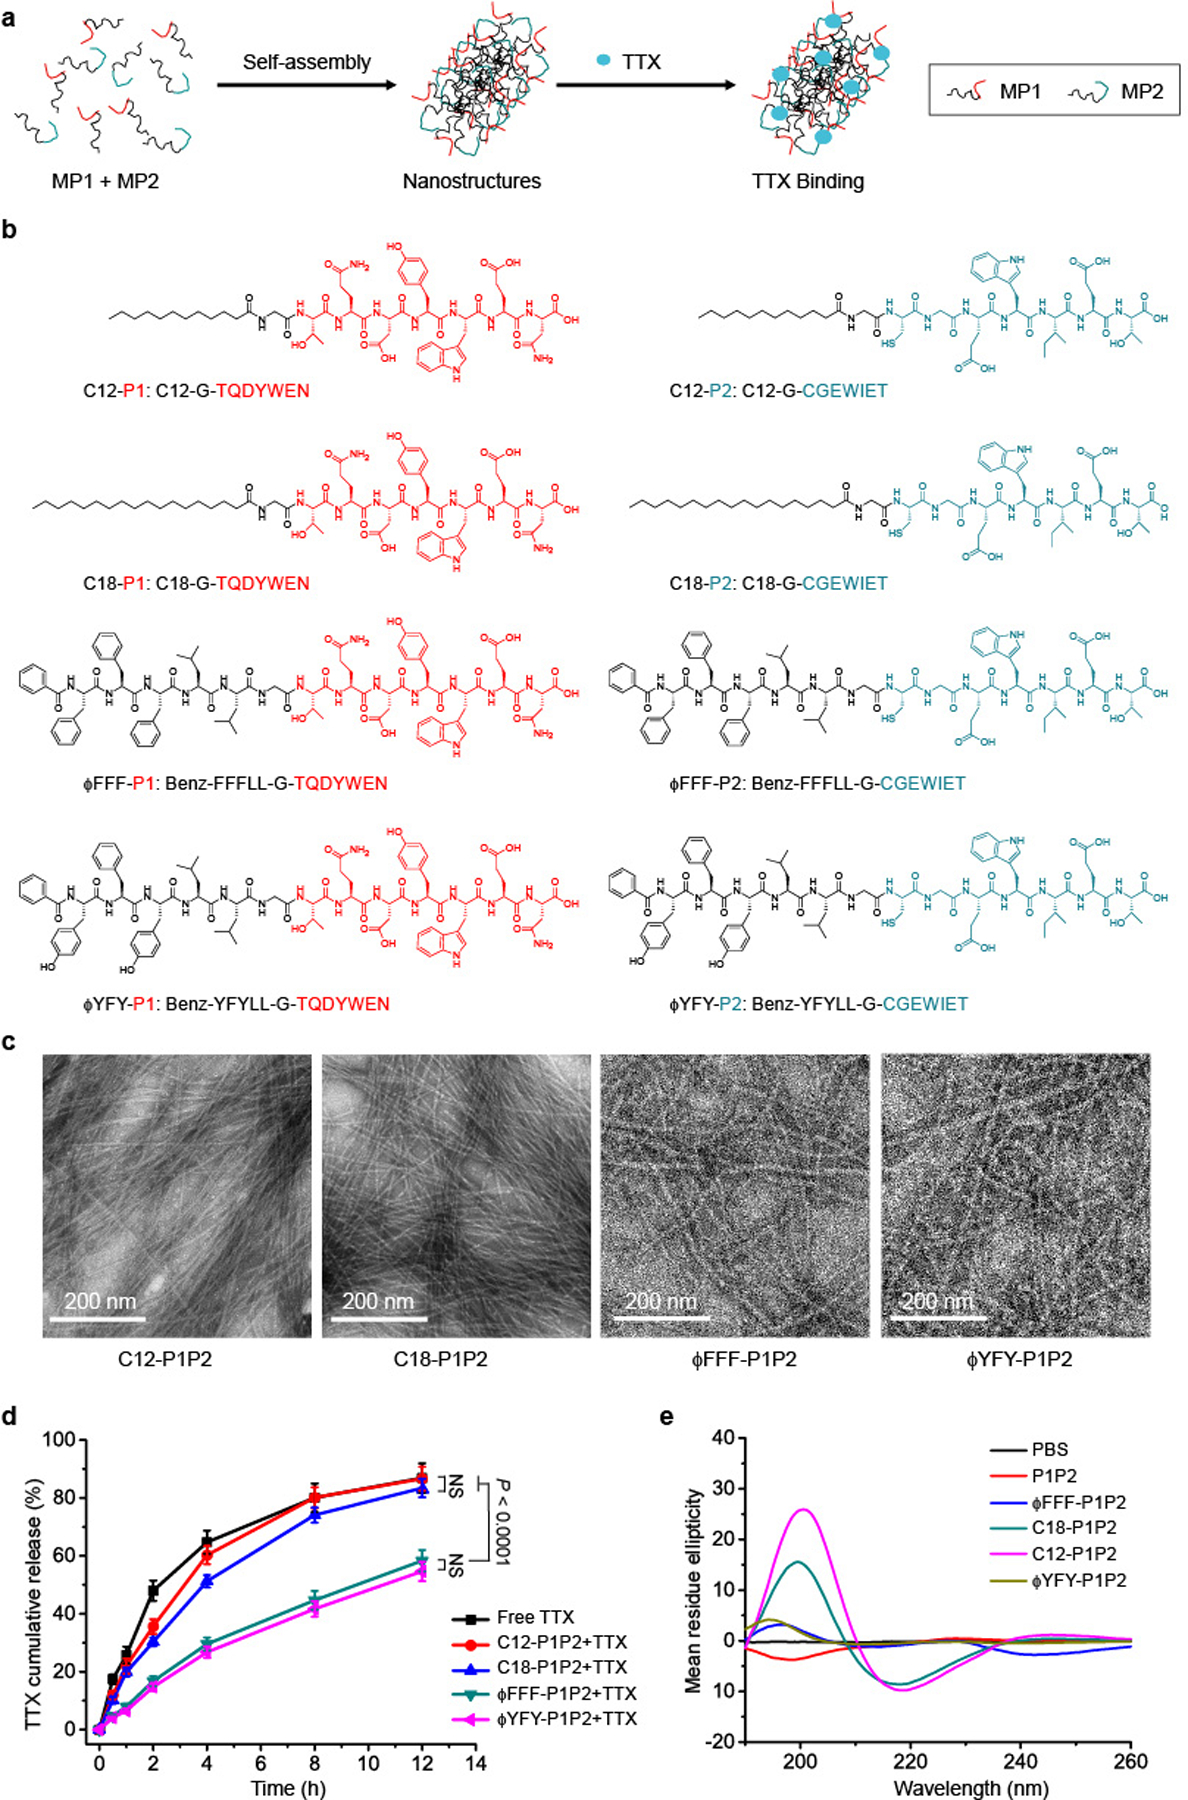
a, Schematic of TTX binding to MPs approximated by self-assembly into nanostructures. b, MPs with different hydrophobic domains. red, P1; blue, P2. c, TEM images of different pairs of MPs. In each pair, the molar ratio of MP1:MP2 was 1:1 and the concentration was 62.6 μM. d, TTX release from each formulation over 12 h. In each group, the ratio of MP1:MP2:TTX was 1:1:1 and their concentration was 62.6 μM. The release over 48 h is shown in Supplementary Fig. 6. Data are shown as the mean ± s.d. (n = 4). ϕFFF-P1P2 + TTX and ϕYFY-P1P2 + TTX groups versus free TTX group, P < 0.0001. e, CD spectrum of each MP pair. All the peptide solutions have the same concentration (20 μM).
Pairs of MPs with the same hydrophobic modification were dissolved in PBS (pH 7.4) in a 1:1 molar ratio (for example, C18-P1 + C18-P2, termed C18-P1P2), both at 62.6 μM, without TTX (see Methods for details of sample preparation). This concentration was higher than their critical micelle concentration (CMC) (Supplementary Fig. 3) to ensure that the MPs could form self-assembled structures. TEM images showed that all four MP pairs formed nanofibres (Fig. 2c). C12-P1P2 nanofibres were 5.6 ± 0.3 nm in width, thinner than C18-P1P2 (8.2 ± 0.4 nm), ϕFFF-P1P2 (8.2 ± 0.6 nm) and ϕYFY-P1P2 (8.3 ± 0.5 nm) (P < 0.0001 for each comparison; Supplementary Fig. 4a). No significant difference was observed between the last three. To verify whether the presence of TTX affected the morphology of nanostructures, TEM images of different formulations (MP1:MP2:TTX was 1:1:1 at 62.6 μM) were obtained (Supplementary Fig. 5). There was no obvious morphological difference when TTX was present or absent. The width of nanofibres, measured from TEM images, was not affected by the addition of TTX (Supplementary Fig. 4b).
To assess the ability of the nanofibres to provide sustained release of TTX, TTX was added to MP mixtures in a 1:1:1 molar ratio (MP1:MP2:TTX), to mimic the ratios at the sodium channel, and release kinetics of TTX from these formulations were evaluated. In the C12-P1P2 group, 86.6 ± 4.1% of TTX was released in 12 h (Fig. 2d and Supplementary Fig. 6), while 83.4 ± 3.2% was released in the C18-P1P2 group. These values were similar to the release of free TTX (86.9 ± 5.1%; n = 4 in all groups, no significant difference between the three groups). In comparison, ϕFFF-P1P2 + TTX and ϕYFY-P1P2 + TTX controlled the release of TTX, with 58.3 ± 3.7% and 54.6 ± 3.3% of TTX, respectively, released in 12 h (n = 4 in all groups, P < 0.0001 in comparisons with free TTX) (Fig. 2d). The fact that only ϕFFF-P1P2 and ϕYFY-P1P2 enabled sustained release of TTX even though they were comparable in width to C18-P1P2 suggests that the width of nanofibres did not play a key role in the interaction between nanofibres and TTX.
To verify that both peptides are essential for nanofibre interactions with TTX, the release kinetics of formulations with either modified P1 or modified P2 were investigated (ϕFFF-P1P1 + TTX and ϕFFF-P2P2 + TTX, where the concentrations of peptides and TTX were 125.2 μM and 62.6 μM, respectively). Both ϕFFF-P1P1 + TTX and ϕFFF-P2P2 + TTX self-assembled into nanofibres. ϕFFF-P1P1 + TTX released 65.2 ± 4.0% TTX in 12 h, whereas ϕFFF-P2P2 + TTX released 73.4 ± 2.2% in 12 h, faster than the release from ϕFFF-P1P2 + TTX (52.6 ± 3.5% in 12 h; ϕFFF-P1P1 + TTX versus ϕFFF-P1P2 + TTX, P = 0.0024; ϕFFF-P2P2 + TTX versus ϕFFF-P1P2 + TTX, P < 0.0001) (Supplementary Fig. 7). These results indicate that the presence of both the P1 and P2 sequences was important in nanofibre interactions with TTX.
Theoretically, TTX binds to the P1 and P2 sequences in ϕFFF-P1P2 and ϕYFY-P1P2, not the hydrophobic domains (ϕFFF or ϕYFY) or the linker (glycine) within them (Supplementary Tables 1 and 2). To verify this, ϕFFF-G or ϕYFY-G (without P1 or P2), which can also self-assemble into nanostructures (Supplementary Fig. 8), were combined with TTX to evaluate whether they affect TTX release kinetics. The TTX release kinetics in these two groups was similar to that for free TTX (Supplementary Fig. 8).
Interactions between the P1 and P2 sequences themselves (such as hydrogen bonds and electrostatic interactions) in the MP assemblies32 could interfere with binding to TTX and therefore their ability to control its release. To investigate interactions between the various peptide pairings, circular dichroism (CD) spectra were obtained. The combination of P1 and P2 (20 μM) yielded a random coil (as indicated by a negative peak at ~200 nm)37 (Fig. 2e). Regular β-structures (such as β-sheets and β-turns) form due to continuous hydrogen bonds between peptide backbones36,37. On CD spectra, β-structures are indicated by a positive peak at approximately 196 nm and a negative peak at 218 nm (refs.37–39). The introduction of hydrophobic domains produced β-structures, as evidenced by a positive peak at 200 nm and a negative peak at 218 nm (refs.37–39). At the same molar concentrations, the positive and negative peaks for β-structures were the strongest in C12-P1P2, followed by C18-P1P2. The positive peaks at 190–200 nm for ϕFFF-P1P2 and ϕYFY-P1P2 were much weaker, and there were almost no negative peaks at 210–220 nm (Fig. 2e). ϕFFF-P1P2 and ϕYFY-P1P2 had lesser degrees of β-structure than C12-P1P2 and C18-P1P2, which suggests that there is a weaker interaction between their P1 and P2 sequences. The greater interaction between P1 and P2 in C12-P1P2 and C18-P1P2 might have impeded interactions with TTX and might explain why they did not control the release of TTX while ϕFFF-P1P2 and ϕYFY-P1P2 did.
Since ϕFFF-P1P2 and ϕYFY-P1P2 were both similarly able to slow the release of TTX, selection between them for further work was made based on their CMC (Supplementary Fig. 3), since a lower CMC would favour maintenance of the nanostructure when the formulations are injected into the aqueous environment of the body. ϕFFF-P1P2 had a lower CMC (0.8 μM) than ϕYFY-P1P2 (2.3 μM).
Changes in individual amino acids in the peptide sequence of the TTX binding site of the sodium channel can cause TTX resistance18–20,40. For example, if the negatively charged glutamate (E) in P1 or P2 is changed to a neutral glutamine (Q), the affinity of TTX for the channel will be reduced by >10,000-fold18–20,40. Therefore, modification of the peptide binding sequences (the hydrophilic parts of the MPs) could affect interactions of the MPs with TTX. To study the effect of peptide sequence on TTX release kinetics, we constructed MPs using the TTX-resistant mutant sequences mutant P1 (MuQP1; TQDYWQN; the bold letter indicates the replaced amino acid) and mutant P2 (MuQP2; CGQWIET) to create ϕFFF-MuQP1 (Benz-FFFLLG-TQDYWQN) and ϕFFF-MuQP2 (Benz-FFFLLG-CGQWIET) (Supplementary Tables 1 and 2 and Fig. 3a). ϕFFF-MuQP1P2 (the assembly of ϕFFF-MuP1 and ϕFFF-MuP2) formed nanofibres (Supplementary Fig. 3b) but did not slow the release of TTX (Fig. 3c).
Fig. 3 |. Nanostructures and TTX release kinetics from self-assembled MPs with variations in the hydrophilic domain.
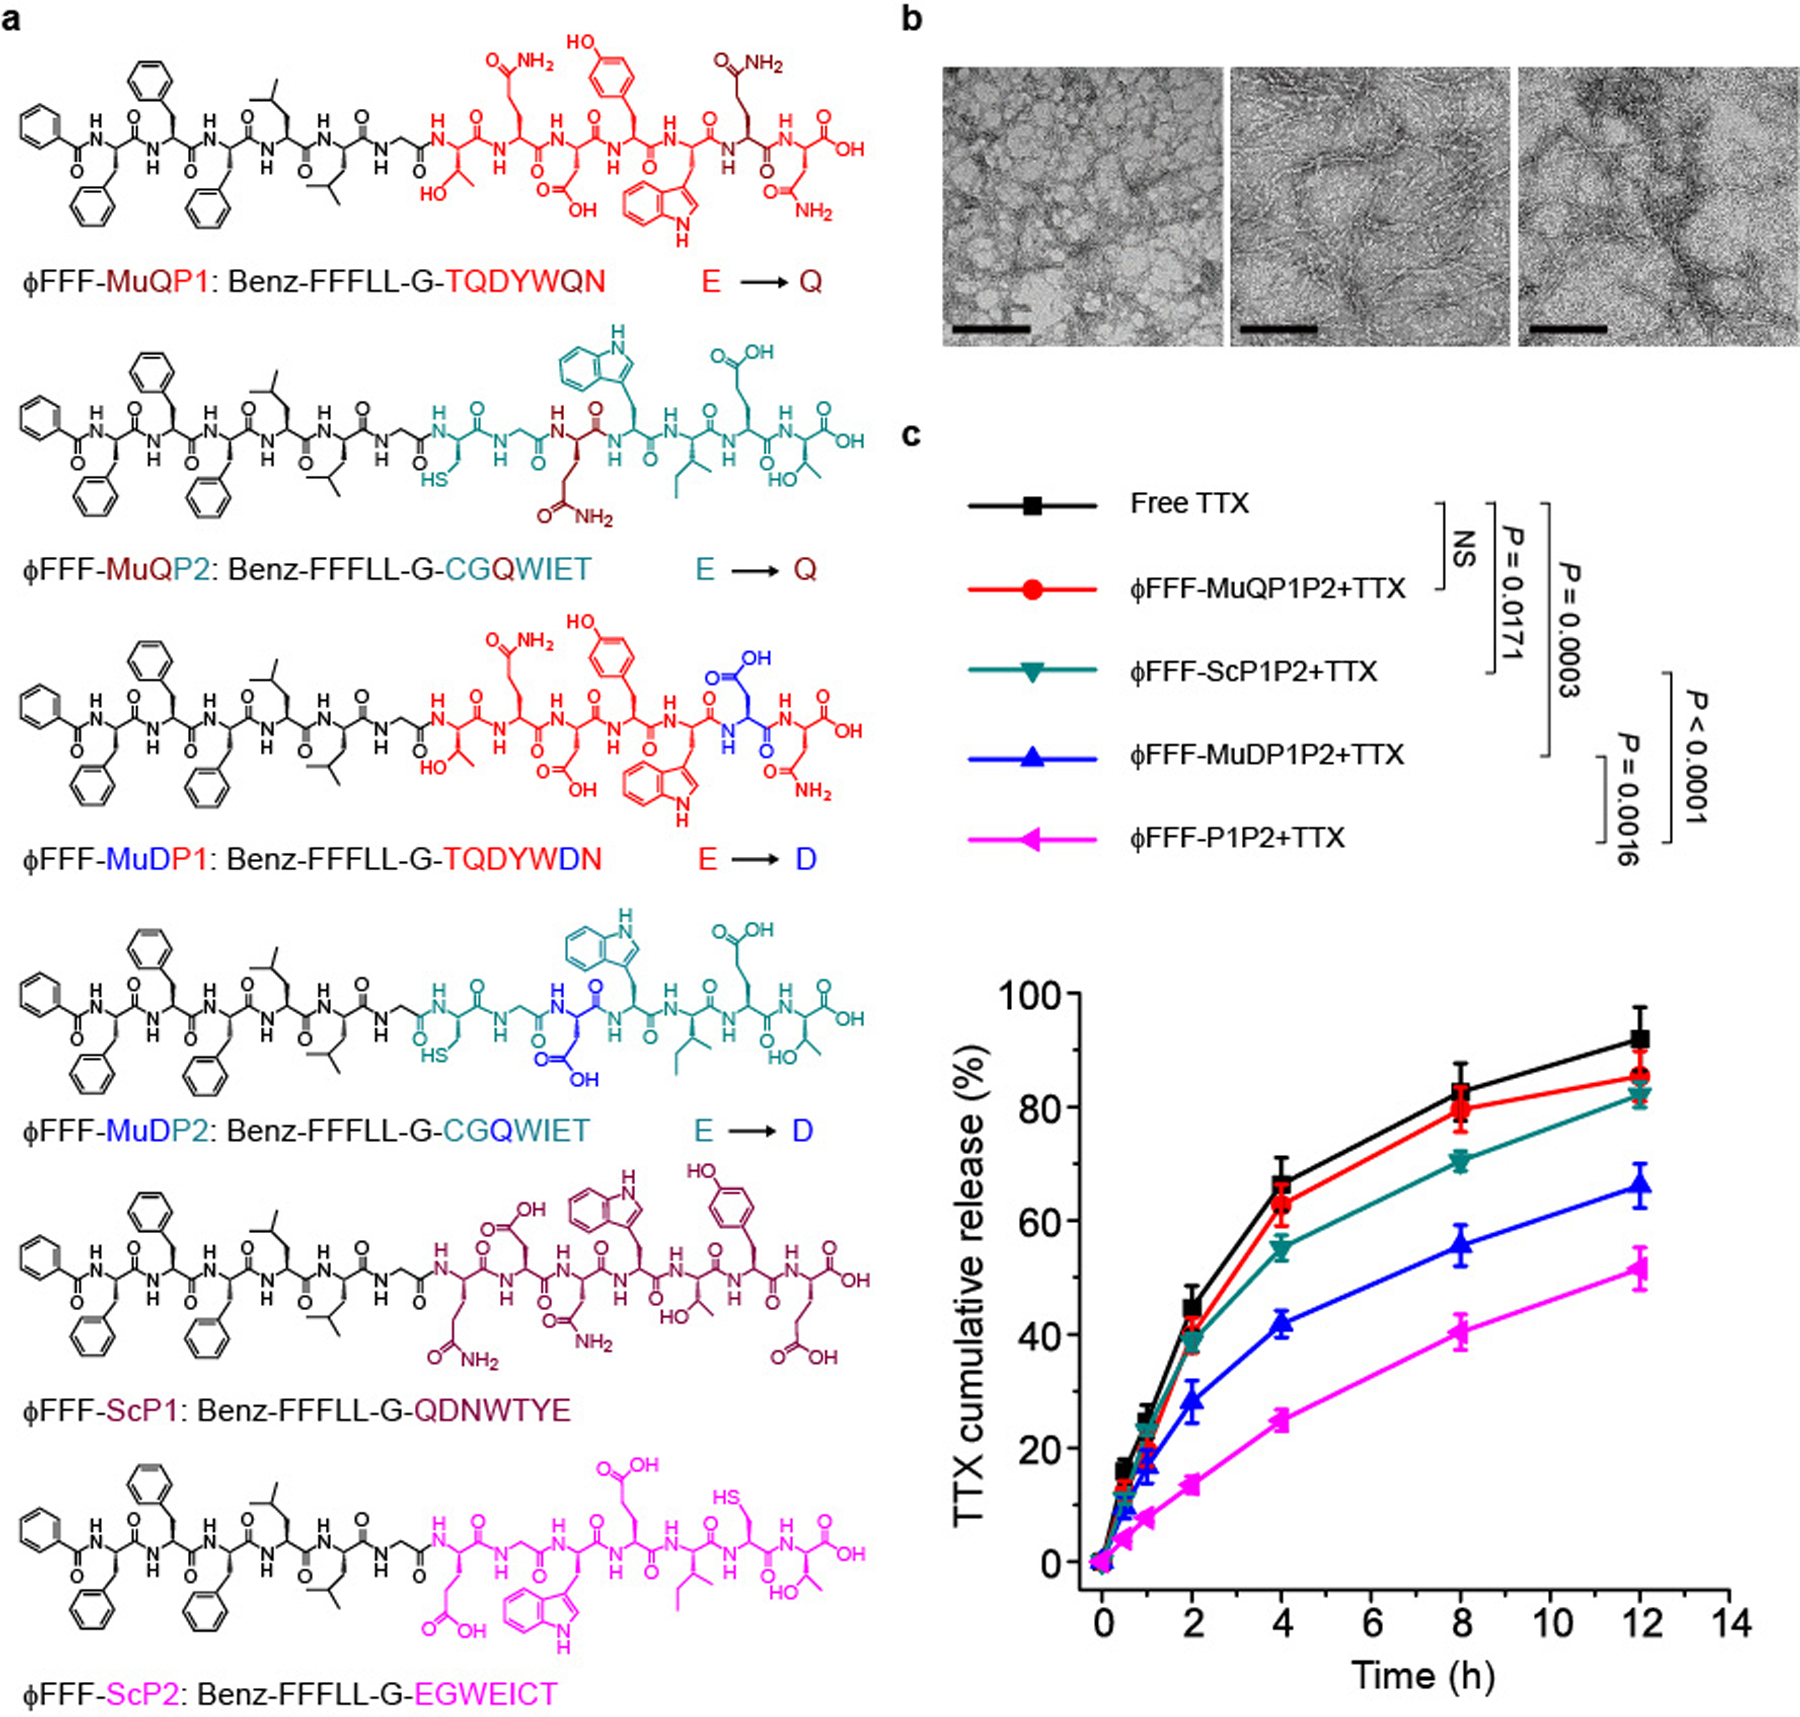
a, Structure of MPs with different hydrophilic domains. b, TEM images of different pairs of MPs (from left to right): ΦFFF-MuQP1P2, ΦFFF-MuDP1P2 and ΦFFF-ScP1P2. In each pair, the molar ratio of MP1:MP2 was 1:1 and the concentration was 62.6 μM. Scale bars, 200 nm. c, TTX release from each formulation over 12 h. In each group, the ratio of MP1:MP2:TTX was 1:1:1 and their concentration was 62.6 μM. Data are shown as the mean ± s.d. (n = 4 independent experiments). NS, not significant.
ϕFFF-MuQP1P2 altered the charge of the P1 and P2 sequence since glutamate is negatively charged and glutamine is neutral. Since electrostatic interactions can themselves affect binding18, we sought to demonstrate that a change in sequence could affect binding apart from the effect of charge. To provide a mutant sequence without a marked change in net charge, one glutamate in P1 and P2 was changed to a negatively charged aspartic acid (D; blue labelled amino acid in Fig. 3a), creating the mutants peptides of P1 and P2 MuDP1 (TQDYWDN) and MuDP2 (CGDWIET), respectively. These mutant peptides were used to make the MP pairs ϕFFF-MuDP1 (Benz-FFFLLG-TQDYWDN) and ϕFFF-MuDP2 (Benz-FFFLLG-CGDWIET) (Supplementary Tables 1 and 2 and Fig. 3a). ϕFFF-MuDP1P2 (the assembly of ϕFFF-MuDP1 and ϕFFF-MuDP2) formed nanofibres (Fig. 3b) and slowed the release of TTX (66.1 ± 3.9% released in 12 h) compared to free TTX (91.9 ± 5.6% release; P = 0.0003). However, TTX release from ϕFFF-MuDP1P2 + TTX was still faster than from the non-mutant ϕFFF-P1P2 + TTX (51.5 ± 3.7% in 12 h; P = 0.0016).
If the sequence of amino acids in P1 and P2 was scrambled (ϕFFF-ScP1: Benz-FFFLLG-QDNWTYE; ϕFFF-ScP2: Benz-FFFLLG-EGWEICT), the release of TTX (from ϕFFF-ScP1P2 + TTX) was greatly accelerated (82.1 ± 2.2% release in 12 h; ϕFFF-ScP1P2 + TTX versus ϕFFF-P1P2 + TTX, P < 0.0001; ϕFFF-ScP1P2 + TTX versus ϕFFF-MuDP1P2 + TTX, P = 0.0004; ϕFFF-ScP1P2 + TTX versus free TTX, P = 0.0171, and no significant difference versus ϕFFF-MuQP1P2 + TTX) even though nanofibres were formed (Fig. 3b). In the TTX release kinetics experiments, the concentrations of all the MP pairs with altered hydrophilic sequences were higher than their CMCs (Supplementary Fig. 9); that is, they all formed nanostructures, as shown by the TEM images (Figs. 2c and 3b). These data suggest that the interaction between TTX and nanofibres is sequence-dependent, whereby mutant peptides decreased binding with TTX whereas there was none with the scrambled peptides (Fig. 3c).
A competitive binding assay was performed to further assess the specificity of the interaction between TTX and the MPs (see Methods for a description of the competitive binding assay). In the TTX ELISA assay (Fig. 4), the bottom of each well is coated with TTX-analogue-modified carrier protein (TAMCP), which can bind TTX specifically but also acts as the antigen to the primary antibody. If the test sample does not contain TTX, the primary antibody will recognize and bind the protein. The secondary antibody and colour agent will then bind to the primary antibody, so that samples without TTX have a dark colour41 (Fig. 4). When TTX is present, it will bind specifically to the TAMCP and prevent binding of the primary antibody, so that the subsequent reactions cannot happen, thereby resulting in a light colour (Fig. 4). If the peptide solutions (P1P2, ϕFFF-P1P2 and ϕYFY-P1P2) are added to the ELISA reaction and bind TTX, more of the antigen will be free, thereby resulting in more colour (that is, reading a lower TTX concentration) (Fig. 4 and Table 1). The upper limit of the linear detection range of TTX concentrations in the ELISA kit is 0.9 μM (270 ng ml−1, from the instructions in the ELISA kit). To evaluate the competitive binding capability of peptides, 0.9 μM peptide, MP or TTX solutions (P1P2, ϕFFF-P1P2 and ϕYFY-P1P2) were used (TTX = 270 ng ml−1). As shown in Table 1, when P1 and P2 were added to TTX at a molar ratio of 1:1:1 (P1:P2:TTX), the TTX concentration detected by ELISA was 93.7 ± 3.0% of the concentration measured without peptides. That is, 6.3 ± 3.0% of TTX was bound by P1P2 (n = 4, P = 0.0148 versus samples without peptides; ratio = 0:0:1). With addition of ϕFFF-P1P2 at the same ratio, 65.6 ± 4.9% of TTX was bound (n = 4, P < 0.0001 versus samples without peptides). At the same molar ratio, ϕYFY-P1P2 bound 12.5 ± 3.5% of TTX (n = 4, P = 0.0011 versus samples without peptides), which may be because 0.9 μM was below the CMC of ϕYFY-P1P2, which therefore could not form nanostructures (Supplementary Fig. 10). When the molar ratio of ϕFFF-P1P2 or ϕYFY-P1P2 to TTX was increased to MP1:MP2:TTX = 5:5:1 (MP concentration of 4.3 μM), such that the concentrations of both ϕFFF-P1P2 and ϕYFY-P1P2 were greater than their CMCs, they bound 94.3 ± 2.5% and 92.2 ± 3.4% of TTX, respectively (n = 4, P < 0.0001 versus samples without peptides) (Table 1 and Supplementary Fig. 3). In contrast, increasing the molar ratio of unmodified P1 and P2 to TTX to 5:5:1 did not significantly increase the binding of TTX (n = 4, no significant difference versus 1:1:1 group). MPs with only P1 or P2, ϕFFF-P1P1 and ϕFFF-P2P2, at 8.6 μM (twice the molarity of MPs of other MP pairs since there is only one peptide) bound 73.3 ± 4.5% and 62.2 ± 3.6% of TTX, respectively, which was less than in the ϕFFF-P1P2 group (P < 0.0001). The modified mutant peptide 4.3 μM ϕFFF-MuDP1P2 bound more TTX than 4.3 μM ϕFFF-MuQP1P2 (74.1 ± 4.3% versus 13.5 ± 3.8%, P < 0.0001), which suggests that preserving the charge of the native sequence is important to binding of TTX. However, both mutants bound less TTX than ϕFFF-P1P2 (P < 0.0001) (Table 1). These results suggest that ϕFFF-P1P2 had the best binding to TTX; therefore, ϕFFF-P1P2 was used in subsequent experiments.
Fig. 4 |. Schematic of competitive binding of TTX by the TAMCP and by MP pairs.
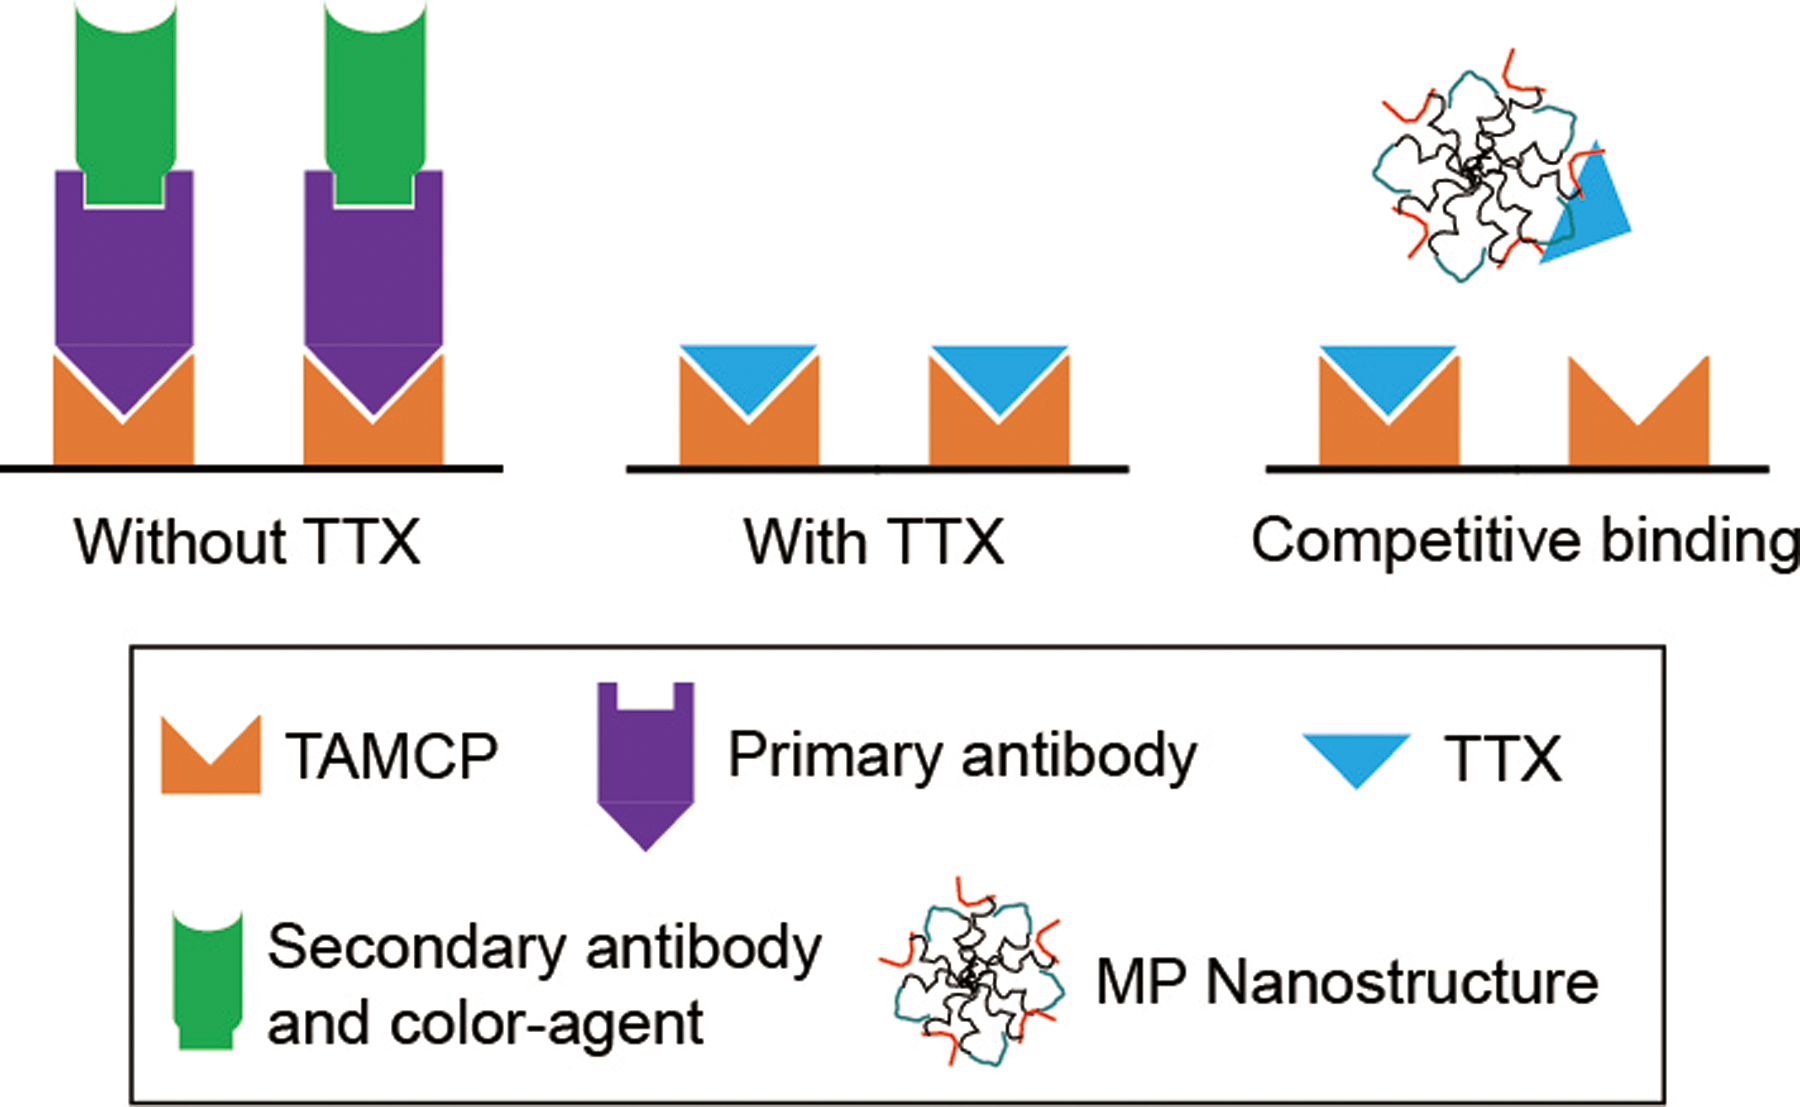
Binding was evaluated using a TTX ELISA kit. TAMCP is also the antigen recognized by the primary antibody.
Table 1 |.
Competitive binding of TTX by peptides as determined by TTX eLiSA
| Molar ratios of componentsa | Groups | TTX detected (ng ml–1) | TTX detected (%) | TTX bound by peptide (%) |
|---|---|---|---|---|
| 0:0:1 | No peptide | 270.0 ± 3.2 | 100.0 ± 1.2 | 0.0 ± 1.2 |
| 1:1:1 | P1P2 | 252.9 ± 8.2 | 93.7 ± 3.0 | 6.3 ± 3.0 |
| ϕFFF-P1P2 | 92.8 ± 13.2 | 34.4 ± 4.9 | 65.6 ± 4.9 | |
| ϕYFY-P1P2 | 236.2 ± 9.5 | 87.5 ± 3.5 | 12.5 ± 3.5 | |
| 5:5:1 | P1P2 | 242.7 ± 4.8 | 89.9 ± 1.8 | 10.1 ± 1.8 |
| ϕFFF-P1P2 | 15.4 ± 6.8 | 5.7 ± 2.5 | 94.3 ± 2.5 | |
| ϕYFY-P1P2 | 21.2 ± 9.1 | 7.8 ± 3.4 | 92.2 ± 3.4 | |
| ϕFFF-MuDP1P2 | 69.9 ± 11.7 | 25.9 ± 4.3 | 74.1 ± 4.3 | |
| ϕFFF-MuQP1P2 | 233.6 ± 10.3 | 86.5 ± 3.8 | 13.5 ± 3.8 | |
| 10:1 | ϕFFF-P1P1 | 72.1 ± 12.2 | 26.7 ± 4.5 | 73.3 ± 4.5 |
| ϕFFF-P2P2 | 102.2 ± 9.8 | 37.8 ± 3.6 | 62.2 ± 3.6 |
In all groups, the concentration of TTX added was 270 ng ml−1 (0.9 μM). n = 4 independent experiments, data are shown as the mean ± s.d.
Ratio of P1-containing peptide:P2-containing peptide:TTX (or peptide:TTX).
The competitive binding assay was not affected by potential interactions between ϕFFF-P1P2 or ϕYFY-P1P2 and TAMCP. Moreover, the sensitivity and linearity of TTX detection by the ELISA kit was not affected by pretreatment with ϕFFF-P1P2 or ϕYFY-P1P2 (Supplementary Fig. 11 and see Methods for details of the procedure).
We designed a method to calculate the dissociation constant (Kd) between nanofibres and TTX (Methods). In brief, formulations containing 20 μM peptide and 20 μM TTX were centrifuged at 15,000 r.p.m. for 5 min (Supplementary Fig. 12). The concentrations of free peptide and free TTX in the supernatant were quantified by high-performance liquid chromatography (HPLC) and ELISA, respectively. Only 0.21 μM free peptide (1% of the total peptides) could be detected in the supernatant after centrifugation. The peptide in the supernatant could not form nanostructures since its concentration was below the CMC.
The Tyndall effect, a light-scattering phenomenon occurring in a colloidal solution, has been widely used in the characterization of dispersed nanoparticle systems21. If particles in suspension are nanoscale and are smaller than the wavelength of visible light (~400 to 760 nm), then a beam of light through the solution will be scattered so that it can be discerned22. The Tyndall effect was clearly observed with a 635-nm laser passing through a ϕFFF-P1P2 + TTX solution, which indicates the presence of nanostructures. The absence of the Tyndall effect in the supernatant (Supplementary Fig. 12) further confirmed that there was no nanostructure in the supernatant.
The concentration of TTX in the supernatant was 0.34 μM. It should be noted that free TTX cannot be centrifuged to the bottom of the tube, as evidenced by the fact that (1) TTX can exist in stable solution at much higher concentrations and (2) if a TTX solution is centrifugated, the concentration of free TTX afterwards was essentially identical to the initial TTX concentration (19.98 versus 20 μM; Supplementary Table 3). These results confirmed that only TTX bound to nanofibres can be centrifuged to the bottom of the tube.
The Kd values of ϕFFF-P1P2 and ϕFFF-MuDP1P2 with TTX calculated using this approach were 2.2 ± 0.3 nM and 372.4 ± 67.5 nM, respectively (Supplementary Table 3 and Methods). The proposed approach and calculated Kd values were not intended to be used for direct comparison of the binding of TTX to the natural sodium channel proteins (Kd ≈ 1.3 nM)42, but to allow comparison of the binding of TTX by different formulations. After mixing, TTX was adsorbed by the nanofibres so that only 0.34 μM TTX could be detected in the supernatant after the centrifugation of a solution containing 20 μM ϕFFF-P1P2 and 20 μM TTX, which indicates that 98% of TTX was taken up by ϕFFF-P1P2 nanofibres. Since the two solution are equimolar, this corresponds to an efficiency of 98% on a molar basis.
Increasing the ratios of peptide to TTX above the 1:1:1 used in the preceding release experiments could further control the release of TTX in a manner analogous to increasing the proportion of polymer to drug in other systems43. At a constant TTX concentration of 62.6 μM, the release kinetics were assessed at molar ratios (ϕFFF-P1:ϕFFF-P2:TTX) of 5:5:1 and 10:10:1 (n = 4), with corresponding ϕFFF-P1P2 concentrations of 313.2 μM and 626.4 μM, respectively (Supplementary Fig. 13a). Release using the 5:5:1 ratio (with 313.2 μM ϕFFF-P1P2) was slower than in the 1:1:1 group (with 62.6 μM ϕFFF-P1P2; P = 0.0018 at the 12-h time point), and was slower yet with the 10:10:1 ratio (626.4 μM; P = 0.0190 versus 5:5:1 group at the 12-h time point) (Extended Data Fig. 1a,b). Further increasing the ϕFFF-P1:ϕFFF-P2:TTX ratio (that is, 20:20:1 with 1.3 mM and 30:30:1 with 1.9 mM) resulted in the formation of precipitate in the solution, and aggregates were observed in TEM images (Extended Data Fig. 1c). Consequently, 626.4 μM ϕFFF-P1P2 (which provided the best control of TTX release) was selected for downstream experiments.
The cytotoxicity of formulations was tested in vitro in myotubes, and the myoblast C2C12 cell line was used to assess potential myotoxicity44. The pheochromocytoma PC12 cell line was also used to assess potential neurotoxicity45 (Methods). After 96 h of incubation with test substances (PBS, TTX, ϕFFF-P1P2 and ϕFFF-P1P2 + TTX; TTX concentration of 62.6 μM and ϕFFF-P1P2 concentration of 626.4 μM), cell viabilities, as assessed using MTS assays, were >95% in all groups (Supplementary Fig. 13) (n = 4, no significant difference for all groups versus PBS group).
The ability of the formulations to extend the duration of nerve block in vivo was evaluated in a rat model of sciatic nerve block10–14. In brief, rats (n = 4 in each group) were injected at the left sciatic nerve with 0.2 ml of formulations (Supplementary Table 4). They then underwent neurobehavioural testing to determine the duration of sensory and motor nerve blockade in both hind paws3,13. Deficits on the injected (left) side reflected nerve block, whereas deficits on the uninjected right (contralateral) side reflected systemic TTX distribution. The duration of successful nerve block from TTX alone increased with increasing dose (Fig. 5a and Supplementary Table 4), but toxicity became dose-limiting (Fig. 5b and Supplementary Table 4). When 62.6 μM TTX was injected, it generated significant contralateral block (Fig. 5b), which indicates severe systemic toxicity, while 78.3 μM TTX was uniformly fatal (Supplementary Table 4). Delivery with unmodified peptides (P1P2 + TTX), or with peptides with glutamate changed to glutamine (ϕFFF-MuQP1P2 + TTX), did not improve nerve block or toxicity (no significant difference for P1P2 + TTX and ϕFFF-MuQP1P2 + TTX versus free TTX) (Supplementary Table 4). ϕFFF-MuDP1P2 + TTX prolonged the duration of nerve block to a certain degree. For example, 62.6 μM free TTX provided sensory nerve block lasting 2.2 ± 0.5 h, whereas block from the same concentration of TTX in ϕFFF-MuDP1P2 + TTX lasted 3.6 ± 0.6 h (Supplementary Table 4). However, when TTX was delivered in ϕFFF-P1P2 + TTX, the duration of nerve block was markedly prolonged. For example, nerve block from 62.6 μM TTX in ϕFFF-P1P2 + TTX lasted 3.6-fold longer (7.9 ± 0.7 h; P < 0.0001) than that of free TTX. The longest sensory block, with 109.6 μM TTX, was 15.9 ± 1.3 h.
Fig. 5 |. In vivo effects of formulations.
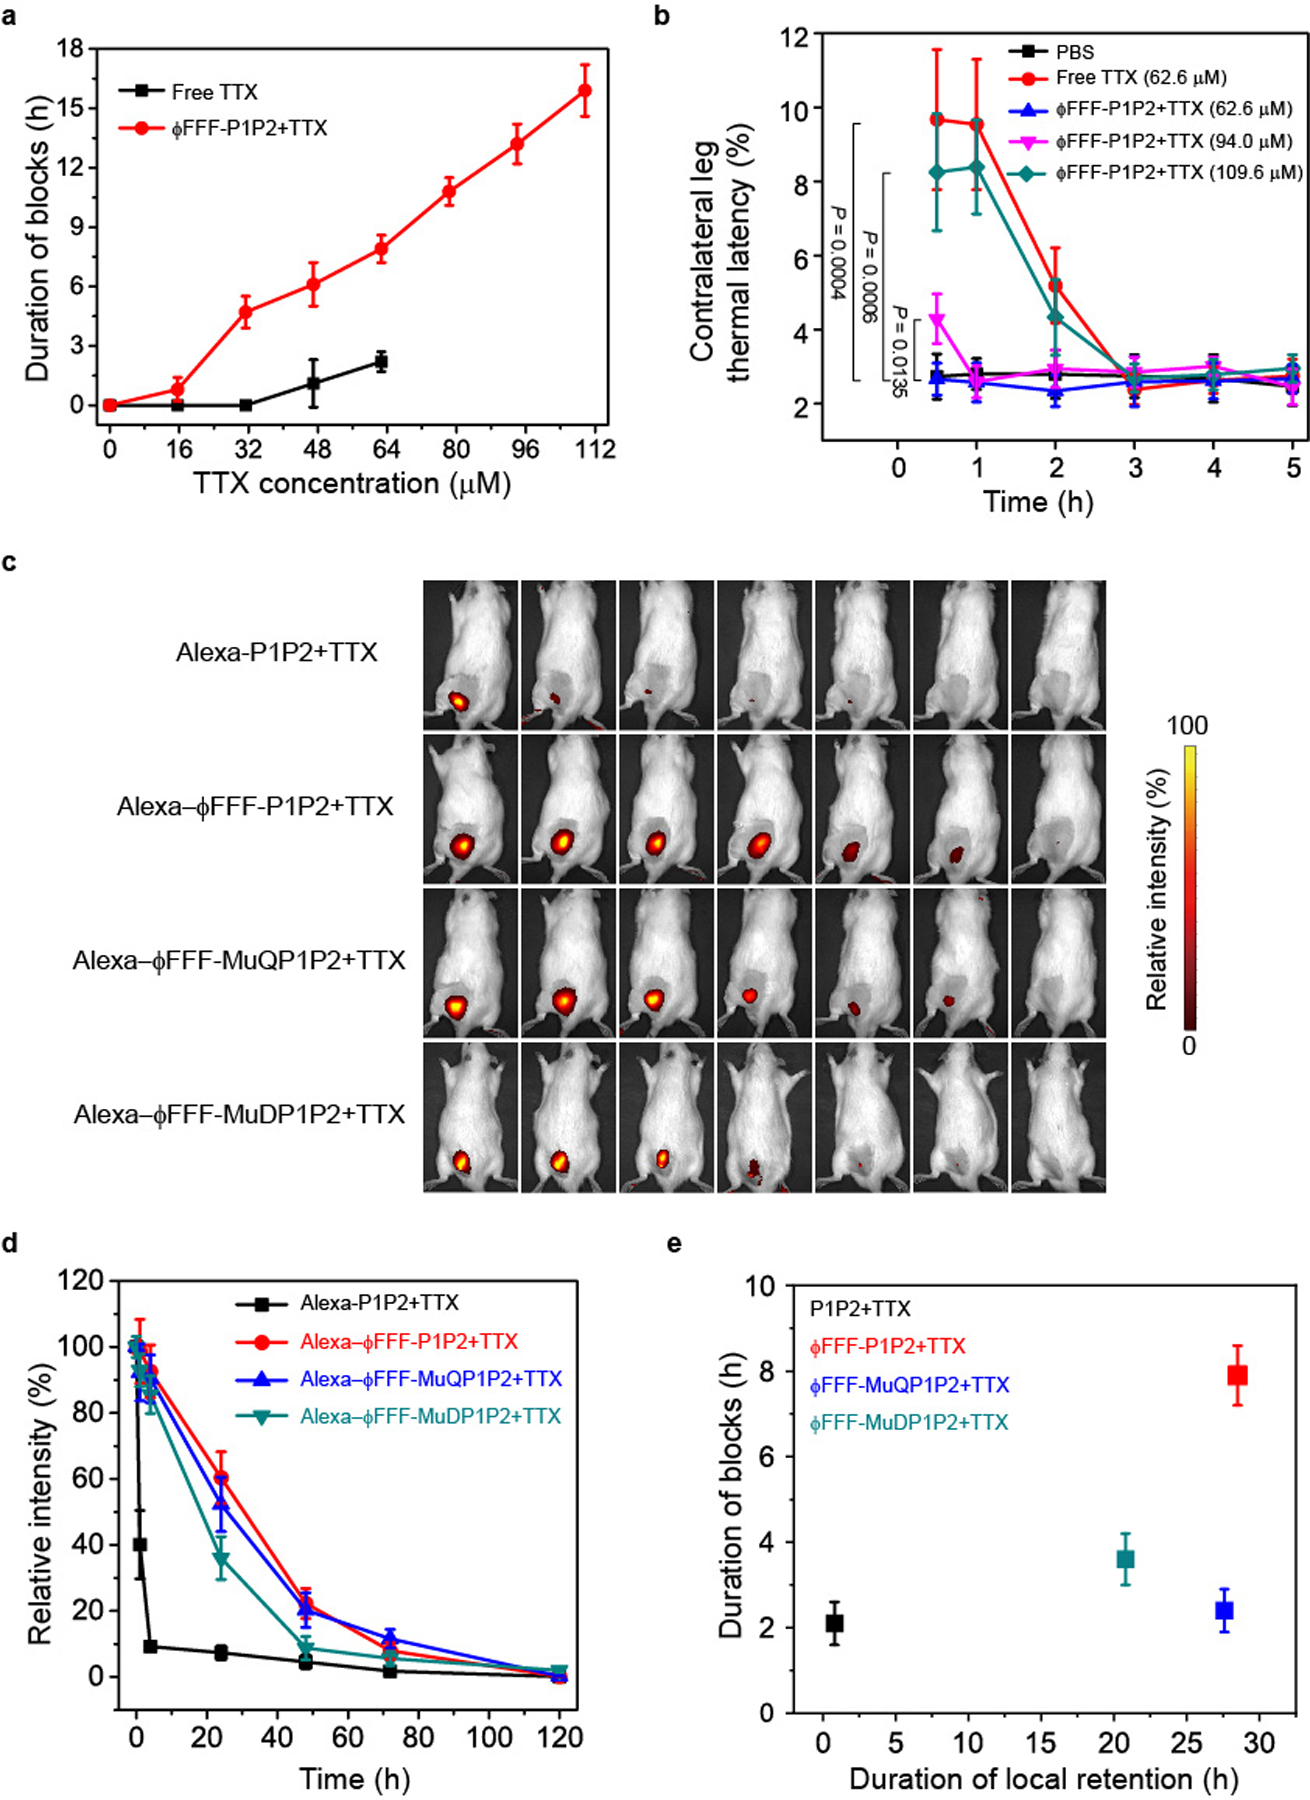
a, Duration of sensory nerve blocks. Data are shown as the mean ± s.d. (n = 4 rats per group). b, Thermal latency in the uninjected (contralateral) extremity in the first 5 h after injection. P values were calculated for the 0.5 h time point. c, representative time courses of retention of formulations at the site of injection as detected by an IVIS. d, Quantification of the fluorescence intensity over time (as a percentage of that at time = 0, immediately after injection), derived from data such as those in c. e, Comparison of tissue retention half-life and duration of nerve block of formulations. The TTX concentration was 62.6 μM in all groups. The half-life of tissue retention (the time when the fluorescence relative intensity dropped to 50%) was calculated from data in d. Mutant peptides injected with TTX had prolonged tissue retention but relatively brief durations of block, while the duration of block from ϕFFF-P1P2 + TTX was much longer, even though the tissue retention was comparable to that of the mutant peptides. For a, b, d and e, data are shown as the mean ± s.d. (n = 4 rats per group).
Systemic toxicity of TTX was decreased by delivery in ϕFFF-P1P2 + TTX. There were no deficits in the contralateral (uninjected) extremities at TTX concentrations of ≤78.3 μM in ϕFFF-P1P2 + TTX (Fig. 5b and Supplementary Table 4). When 94.0 μM TTX was used in ϕFFF-P1P2 + TTX, it caused increased contralateral thermal latency (4.3 ± 0.7 s) compared to animals injected with PBS (2.7 ± 0.6 s) (n = 4, P = 0.0135), and 109.6 μM TTX in ϕFFF-P1P2 + TTX caused contralateral latency (~8 s) comparable to that seen with 62.6 μM free TTX (Fig. 5b). In general, the durations of sensory and motor block were similar (Supplementary Table 4), with motor block being ≤15% longer, especially at higher concentrations of TTX. The peptides (ϕFFF-P1P2) alone did not produce deficits in the injected or contralateral extremity (Supplementary Table 4).
The near-infrared dye Alexa 647 was covalently conjugated to 1% of the unmodified peptides to assess the local retention of formulations injected at the sciatic nerve. Covalent conjugation of Alexa 647 did not change the morphology of nanofibres (Supplementary Fig. 14). The local fluorescence intensity was monitored at predetermined intervals after injection using an in vivo imaging system (IVIS). In animals injected with Alexa-P1P2 (626.4 μM; peptides without hydrophobic modification), fluorescence at the site of injection rapidly dropped in the first hour and was almost gone by 4 h (Fig. 5c,d). The tissue retention of formulations where peptides spontaneously formed nanofibres (ϕFFF-P1P2, ϕFFF-MuQP1P2 and ϕFFF-MuDP1P2) was significantly prolonged; that is, approximately 50% of fluorescence intensity remained after 24 h (Fig. 5d).
Laser scanning confocal microscopy (LSCM) of frozen sections of the sciatic nerve and surrounding tissues 24 h after injection confirmed that Alexa-ϕFFF-P1P2 was retained longer at the sciatic nerve than Alexa-P1P2 (Extended Data Fig. 2). This was presumably because of the nanostructure of the former, which greatly increased the complex viscosity of the solution, as determined by rheometry (Supplementary Fig. 15). ϕFFF-MuQP1P2 and ϕFFF-MuDP1P2 (at 626.4 μM, the same concentration as with ϕFFF-P1P2) also had much higher viscosity than P1P2 solution (Supplementary Fig. 15). In vivo imaging showed that Alexa-ϕFFF-MuQP1P2 and Alexa-ϕFFF-MuDP1P2 also had prolonged tissue retention (Fig. 5c,d). However, their nerve block durations were much shorter than from ϕFFF-P1P2 + TTX (ϕFFF-MuQP1P2 + TTX: 2.4 ± 0.5 h; ϕFFF-MuDP1P2 + TTX: 3.6 ± 0.6 h, P < 0.0001 versus ϕFFF-P1P2 + TTX; Supplementary Table 4). These results suggest that although complex viscosity and local retention at the injection site were both increased in nanofibrous formulations, neither of these properties was primarily responsible for the prolongation of nerve block. Mutant peptides injected with TTX had prolonged tissue retention but relatively brief durations of block, while the duration of block from ϕFFF-P1P2 + TTX was much longer, even though the tissue retention was comparable to those of the mutant peptides (Fig. 5e).
Four days (Fig. 6) and 14 days (Supplementary Fig. 16) after injection of each formulation (PBS, free TTX and ϕFFF-P1P2 + TTX), the sciatic nerves and adjacent tissues were collected, sectioned, stained with haematoxylin and eosin (H&E), and tissue reaction (inflammation and myotoxicity) was assessed (Supplementary Table 5). There was no significant difference in myotoxicity or inflammation scores (Supplementary Table 5) between any treated group and untreated animals at either time point. Since H&E staining is not very sensitive for nerve injury, nerves were prepared for staining with toluidine blue and for (Fig. 6). There was no difference between any treated group and untreated animals.
Fig. 6 |. Tissue reaction to formulations.
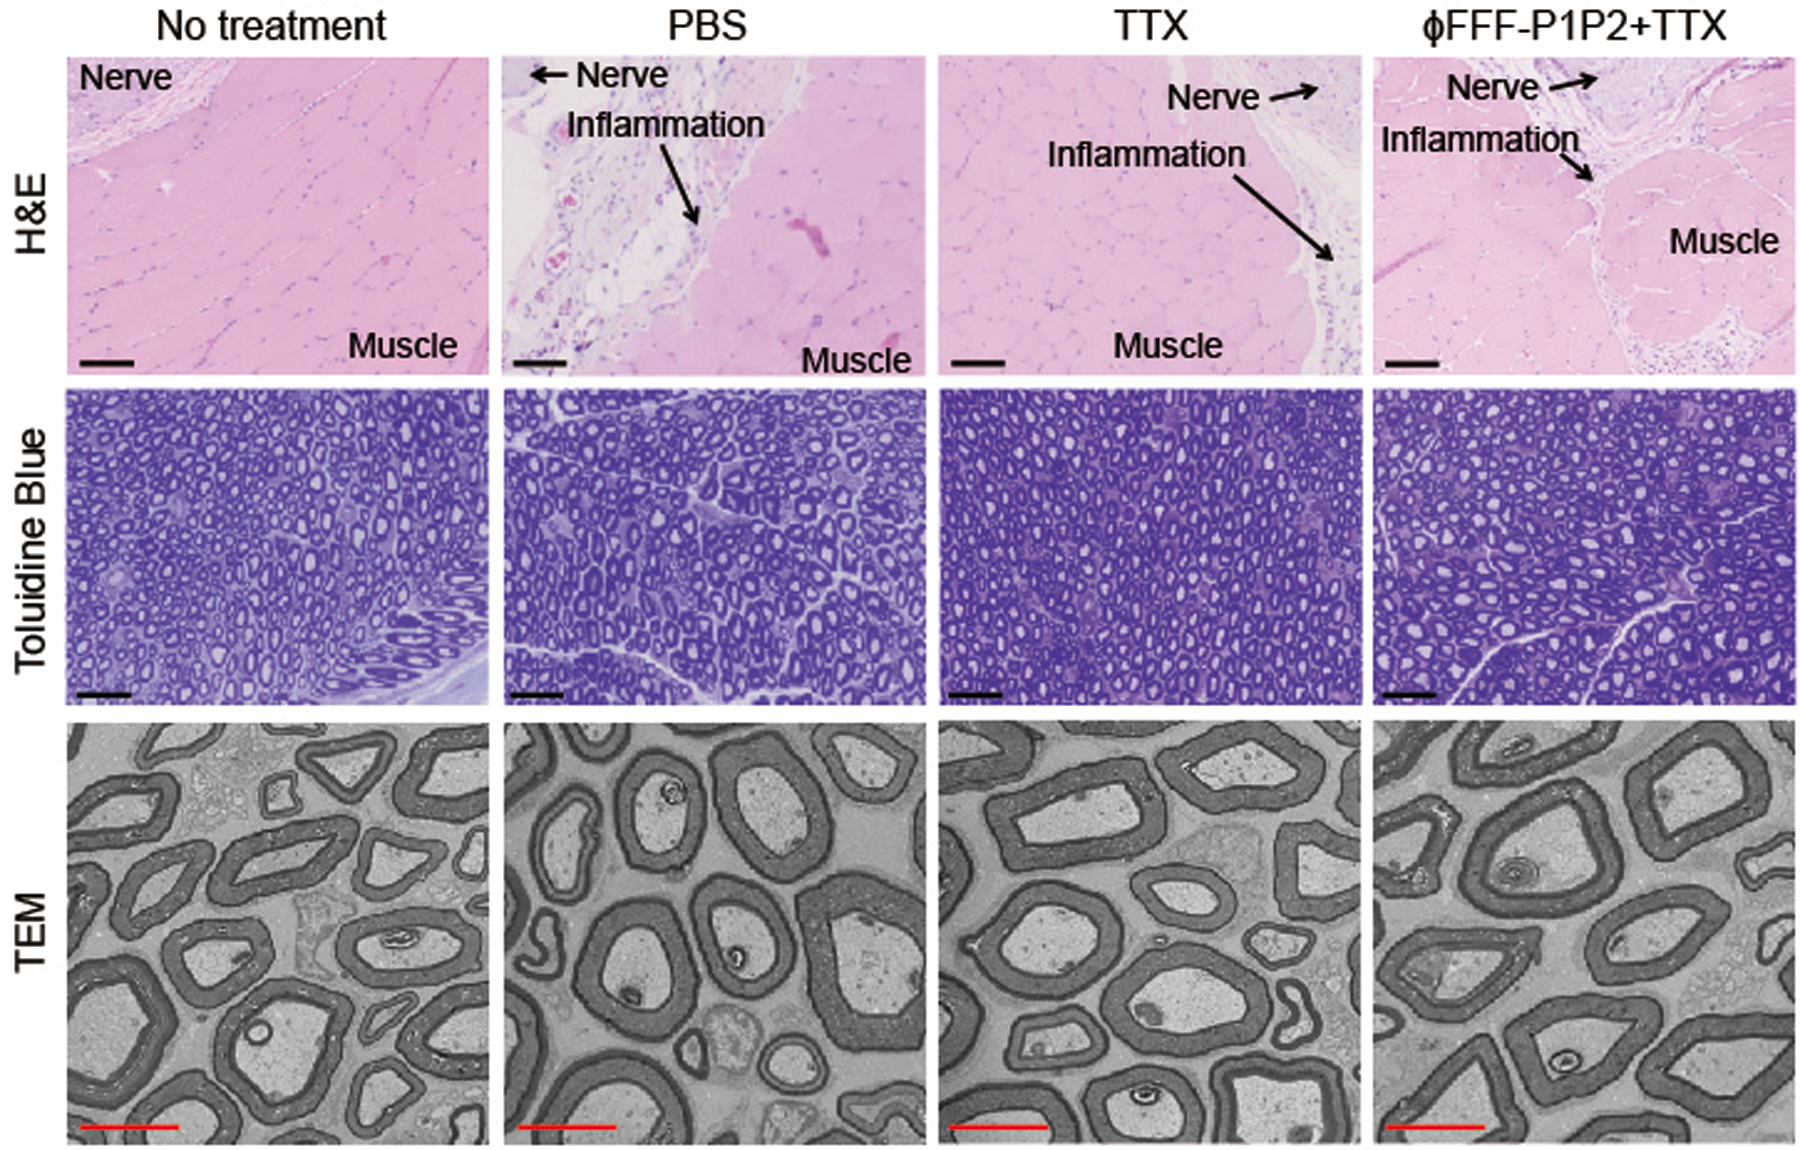
Tissue reactions were analysed 4 days after injection. Scale bars, 100 μm (H&E), 25 μm (toluidine blue) or 2 μm (TEM).
To assess whether this approach was broadly applicable to S1SCBs, we assessed their effect on block from two others: STX and dicarbamoyl saxitoxin (dcSTX)4,5. They block the same site on the sodium channel but are structurally dissimilar from TTX (Fig. 1) aside from the guanidium group18. STX and dcSTX are approximately twice and one-half the potency, respectively, of TTX in rat sciatic nerve blockade10. ϕFFF-P1P2 (ϕFFF-P1P2 + STX) controlled the release of STX compared with free STX and ϕFFF-MuQP1P2 + STX (Supplementary Fig. 17). The duration of nerve block from STX was prolonged by ϕFFF-P1P2 (Extended Data Fig. 3a). For example, the duration of sensory block from 50.1 μM STX was prolonged by 3.8-fold to 10.2 ± 0.9 h (n = 4; P < 0.0001). The maximum dose of STX that could be given was increased (100.2 μM STX in ϕFFF-P1P2 + STX versus 50.1 μM of free STX). Consequently, the maximum duration of sensory block was increased by almost 7-fold to 18.6 ± 1.6 h. As with TTX, the durations of sensory and motor block were similar (Supplementary Table 6), with motor block being ≤15% longer, especially at higher concentrations of STX. The systemic toxicity of STX was reduced when delivered in ϕFFF-P1P2, as evidenced by the decrease in contralateral block (Extended Data Fig. 3b) and mortality (Supplementary Table 6). As with TTX, ϕFFF-MuP1P2 did not prolong nerve block over that of free STX (Supplementary Table 6).
ϕFFF-P1P2 greatly prolonged the duration of nerve block from dcSTX (ϕFFF-P1P2 + dcSTX; Supplementary Fig. 18). For example, sensory nerve block from 156.1 μM dcSTX in ϕFFF-P1P2 lasted 11.0 ± 1.1 h compared with 2.3 ± 0.4 h for 8 μg of free dcSTX (4.8-fold prolongation). No myotoxicity nor neurotoxicity was observed with STX or dcSTX delivered in ϕFFF-P1P2 (Extended Data Fig. 4).
In contrast, the MPs did not enhance the effect of bupivacaine, an amino-amide local anaesthetic that binds to the same sodium channel as TTX but at a different site on the inner surface of the cell membrane17. ϕFFF-P1P2 (62.6 μM) did not affect the release kinetics of bupivacaine hydrochloride (ϕFFF-P1:ϕFFF-P2:bupivacaine of 1:1:1) (Supplementary Fig. 19a and Supplementary Information). The combination of ϕFFF-P1P2 (626.4 μM) with bupivacaine hydrochloride did not significantly prolong the duration of nerve block compared with free bupivacaine hydrochloride at the same concentration (15.4 mM; no significant difference; 3.0 ± 0.3 h with ϕFFF-P1P2 + bupivacaine versus 2.4 ± 0.3 h from free bupivacaine) (Supplementary Fig. 19b). Here, bupivacaine could not be used at the same concentration as the peptides, as it was too low to result in block. Consequently, a large excess of bupivacaine over peptide was used.
In summary, we developed hydrophobically MPs inspired by the interactions of the S1SCBs with their binding site on the sodium channel. Supramolecular assembly into nanostructures allowed S1SCB binding and sustained release, prolonged the local retention time in vivo, markedly prolonged nerve blockade with S1SCBs and reduced their toxicity. Tissue reaction to the formulation was benign. These nanostructures provided prolonged local anaesthesia, and addressed the important need to develop non-addictive (that is, opioid-sparing) methods to control pain. This approach could potentially be extended to delivery systems for other receptor-mediated drugs. Optimizing such systems would benefit from a detailed understanding of the molecular basis of drug–receptor interactions.
Methods
Materials.
All the peptides were designed by us and were synthesized by GL Biochem via Fmoc solid-phase peptide synthesis. Dimethylsulfoxide (DMSO; 99.9%), bupivacaine hydrochloride and fluorescein sodium salt were purchased from Sigma-Aldrich. PBS (pH 7.4, 0.15 M, 138 mM NaCl, 2.7 mM KCl), Alexa 647-NHS, Dulbecco’s minimum essential medium (DMEM), fetal bovine serum (FBS), horse bovine serum (HBS) and penicillin–streptomycin were purchased from Thermo Fisher Scientific. TTX was obtained from Abcam, TTX ELISA kits were purchased from Reagen and STX ELISA kits were purchased from Abraxis. STX and dcSTX were provided by the US Food and Drug Administration.
Peptide self-assembly and characterization.
Peptides (0.63 μmol) were dissolved in 5 μl DMSO and then separated in 1 ml PBS in a series of concentrations then ultrasonicated at 100 W for 1 min at 25 °C. Solutions (1 ml) were placed into a dialysis device (Float-A-LyzerG2 Dialysis Devices, Spectrum Laboratories) with a 1,000 MW cut-off and dialysed with 1 litre PBS for 48 h to remove DMSO. The resulting solutions were diluted to 62.6 μM and characterized by TEM (Tecnai G2 T20; FEI company) using a negative-staining method with uranyl acetate (1.0% w/w)26. The average width of nanofibres was calculated after measuring the thickness of ten nanofibres in TEM images via ImageJ. Samples with other concentrations or components were prepared in the same way. DLS (Delsa Nano; Beckman Coulter) was used to determine whether P1P2 with TTX (each component was 62.6 μM) contained nanoscale material.
Calculation of CMC.
A series of concentrations of C12-P1P2, C18-P1P1, ϕFFF-P1P2, ϕYFY-P1P2, ϕFFF-MuQP1P2, ϕFFF-MuDP1P2 or ϕFFF-ScP1P2 (0 to 200 μM) were incubated with a pyrene solution (24 μg per litre) for 1 h. A fluorescence spectrophotometer (Cary Eclipse fluorescence spectrophotometer, Agilent Technologies) was used to measure the fluorescence intensity of each mixture (excitation at 330 nm). The ratios between the intensities at 384 nm and 373 nm were used to calculate the CMC of the peptide in PBS, whereby the greater the ratio, the more pyrene is encapsulated. The point at which the curve in Supplementary Figs. 3 and 8 begins to rise (that is, where encapsulation increases) is the CMC.
CD measurements.
CD measurements were carried out on a Jasco J-815 CD system (Jasco International) at 25 °C in phosphate buffer. The signal at 190–260-nm wavelength was collected. Peptides at 20.0 μM were measured.
In vitro drug release and quantification.
TTX was added to peptide solutions and incubated for 30 min before being used. The TTX concentration in each solution was 62.6 μM. Drug release studies were performed by placing 500 μl of TTX-loaded peptides into a Slide-A-Lyzer MINI dialysis device (Thermo Scientific) with a 3,500 MW cut-off and dialysing against 14 ml of PBS at 37 °C on a platform shaker (New Brunswick Innova 40, Eppendorf North America) at a speed of 200 r.p.m. At predetermined intervals, the dialysis solution was exchanged with fresh, prewarmed (37 °C) PBS. The concentration of TTX was quantified by ELISA following the instructions. Reagents were provided in a kit. In brief, 50 μl of sample was added to each well and incubated for 30 min at 25 °C, and then 50 μl of primary antibody was added and incubated for another 30 min at 25 °C. The solution in each well was removed, and the well was washed four times with 300 μl 1× washing buffer. Next, 100 μl of enzyme-conjugated secondary antibody was added to each well and incubated for 30 min at 25 °C, then the well was washed four times with 300 μl 1× washing buffer. A total of 100 μl of colour solution was added and incubated for 15 min at 25 °C, followed by 50 μl of stop solution. The optical density at 450 nm of the solution was tested. In the STX release test, the STX concentration in each solution was 50.1 μM, and other procedures were the same as for TTX. The bupivacaine hydrochloride release samples were collected using the same method. The concentration of bupivacaine was determined by HPLC (Agilent 1260 Infinity, Agilent Technologies) using a C18 column (Poroshell 120 EC-C18, 4.6 × 100 mm, inner diameter of 2.7 μm, Agilent Technologies) with an acetonitrile/water (70:30) mobile phase and a flow rate of 0.5 ml min−1. Bupivacaine was detected by ultraviolet absorbance at λ = 254 nm.
Competitive binding evaluation from ELISA kits.
Immediately after loading the TTX solution (0.9 μM, 270 ng ml−1) in each well, P1P2, ϕFFF-P1P2, ϕYFY-P1P2, ϕFFF-MuP1P2, ϕFFF-DP1P2, ϕFFF-P1 or ϕFFF-P2 solutions (at varying concentrations, narrated in the body of the text) were added into the wells. In the group without peptide, the same volume of PBS was added. Other procedures were the same as for the determination of TTX concentration.
To verify whether the peptides interfered with TAMCP interactions with TTX (aside from the peptides binding TTX itself), the kit was pretreated with 4.3 μM ϕFFF-P1P2 or ϕYFY-P1P2 for 30 min, allowing potential block of TAMCP (4.3 μM was used in some of the above competitive binding experiments, and it was above the CMC of the MPs and was five times higher than the upper limit of the linear detection range of TTX concentrations in the ELISA kit). Known concentrations of TTX (0, 10, 30, 90 and 270 ng ml−1) were examined with a TTX ELISA kit pretreated with these peptides, and the results compared to data from kits pretreated with PBS.
Measurement of the dissociation constant.
A volume of 0.5 ml 20 μM ϕFFF-P1P2 or ϕFFF-DP1P2, and 20 μM TTX was prepared in PBS and placed at room temperature (25 °C) for 30 min, after which the solution was centrifuged. The centrifugation speed was gradually increased to 15,000 r.p.m. and kept at this speed for 5 min. The concentration of ϕFFF-P1P2 or ϕFFF-DP1P2 in the supernatant was analysed by HPLC, and the concentration of TTX in the supernatant was measured using a TTX ELISA kit.
The Kd between ϕFFF-P1P2 nanofibres and TTX was determined using the following formula:
where nanofibres* refers to nanofibres not bound to TTX;
Tyndall effect.
FFF-P1P2 + TTX formulations containing 20 μM ϕFFF-P1P2 and 20 μM TTX were prepared as described above. The Tyndall effect of the resultant solution was tested using a 635-nm red laser pointer. The Tyndall effect image of the solution was recorded photographically. The solution was then centrifuged at 15,000 r.p.m. for 5 min, and the resultant supernatant was illuminated with the same 635-nm red laser pointer. The Tyndall effect image of the supernatant was also recorded.
Determination of viscosity.
The rheological properties of P1P2, ϕFFF-P1P2, ϕFFF-MuQP1P2 and ϕFFF-MuDP1P2 (626.4 μM) were monitored using an AR2000 rheometer (TA instruments) equipped with a temperature controller. A parallel plate 20 mm in diameter was used for all tests. The gap distance between the plates was 0.3 mm. Frequency sweeps ranging from 0.01 to 100 rad s−1 were conducted at room temperature. A constant 0.1 Pa stress was used. The complex viscosity of each sample was recorded at a frequency of 0.01 rad s−1.
Cell culture.
Cell culture of C2C12 mouse myoblasts (American Type Culture Collection (ATCC), CRL-1772) and PC12 rat adrenal gland pheochromocytoma cells (ATCC, CRL-1772) was performed as previously reported9–13,15. In brief, C2C12 cells were cultured in DMEM with 10% FBS and 1% penicillin–streptomycin (Invitrogen). Cells were seeded onto a 24-well plate at 50,000 cells per ml and incubated for 10–14 days in DMEM with 1% FBS and 1% penicillin–streptomycin to differentiate into myotubules. PC12 cells were grown in DMEM with 12.5% horse serum, 2.5% FBS and 1% penicillin–streptomycin. Cells were seeded onto a 24 well-plate, and 50 ng ml−1 nerve growth factor (Invitrogen) was added 24 h after seeding.
Cell viability.
To determine the cytotoxicity of the formulations, cells were exposed to TTX, ϕFFF-P1P2 and ϕFFF-P1P2 + TTX (TTX concentration of 62.6 μM; ϕFFF-P1P2 concentration of 626.4 μM) using a 24-well Transwell membrane system (Costar 3495, pore size 0.4 μm) (Corning). Cells were incubated in 0.9 ml of medium in the cell culture wells, and 100 μl of test samples was added above the Transwell membranes, which were immersed in the medium in the wells. Cell viability was evaluated using the MTS assay (Promega) 96 h after incubation.
Animal studies.
Animal studies were conducted following protocols approved by the Boston Children’s Hospital Animal Care and Use Committee in accordance with the guidelines of the International Association for the Study of Pain. Adult male Sprague–Dawley rats (Charles River Laboratories) weighing 350–400 g were housed in groups under a 12-h/12-h light/dark cycle with lights on at 6:00.
After being anaesthetized with isoflurane–oxygen, the animals were injected with 0.2 ml of each formulation using a 23-G needle. The needle was introduced postero-medial to the greater trochanter, pointing in the anteromedial direction. After contact with bone, the TTX formulations were injected onto the sciatic nerve.
Sensory nerve block was examined at predetermined time points via a modified hotplate test (hind-paw thermal latency) as previously reported9–12. The plantar surface of the rat’s hind paw was placed on a preheated hot plate at 56 °C. The time until the animal withdrew its foot (the thermal latency) was recorded. Animals that did not retract the foot after 12 s were removed from the hotplate to prevent thermal injury. A thermal latency above 7 s was considered a successful nerve block for the purpose of calculating the duration of nerve block. Measurements were repeated three times at each time interval.
Motor nerve block was assessed using a weight-bearing test to determine the motor strength of the rat’s hind paw as previously described9–13,15. In brief, the rat was positioned with one hind paw on a digital balance and was allowed to bear its own weight. The maximum weight that the rat could bear without the ankle touching the balance was recorded, and motor block was considered achieved when the motor strength was less than half-maximal, as described previously9–13,15.
IVIS imaging.
For Alexa-647-tagged P1, MuQP1 or MuDP1 coupling (take P1 as the example), Alexa-647-NHS ester (0.2 μmol) was added into P1 solution in PBS (100 μl, 0.5 mM). The mixture was incubated in a 1.0-ml Eppendorf tube at 25 °C for 3 h with gentle shaking (the pH controlled at 7.4 for the entire process). The conjugated P1 (Alexa-P1) was purified using a NAP-5 column (GE Healthcare) preequilibrated with PBS buffer28. Under isoflurane–oxygen anaesthesia, rats were shaved and injected with 0.2 ml of test formulation. The in vivo fluorescence images were captured, and the fluorescence intensity was evaluated at predetermined time points post-injection (under brief isoflurane–oxygen anaesthesia) using a Spectrum IVIS (PerkinElmer). Whole-body animal images were noninvasively recorded. The 67-nm excitation filter and the 700-nm emission filter were used for the imaging. Quantitative analysis was carried out using the Live Imaging software of the IVIS. The half-life of tissue retention was the time required for the fluorescence intensity to decrease by 50% after injection. It was calculated based on the plot in Fig. 5d.
LSCM imaging.
Under brief isoflurane–oxygen anaesthesia, rats were injected with 0.2 ml of test formulation (Alexa-P1P2 or Alexa-ϕFFF-P1P2) then euthanized at predetermined intervals (15 min and 24 h). Sciatic nerves together with surrounding tissues were collected and embedded into OCT compound (VWR), then frozen and stored at −20 °C. Sections (10 μm) were prepared using a cryostat microtome (Leica CM3050 S) and mounted onto glass slides. Afterwards, slides were fixed with 4% paraformaldehyde for 20 min at room temperature and washed in PBS (pH 7.4) three times. Nuclei were stained with Hoechst 33342. The slices were imaged using a Zeiss LSM 710 multi-photon confocal microscopy (Carl Zeiss).
Histology.
Animals were euthanized by carbon dioxide at 4 days or 14 days after formulation administration. The sciatic nerve and surrounding tissue were collected and underwent standard procedures to produce H&E-stained slides. The samples were scored for inflammation (0–4) and myotoxicity (0–6), as previously reported9–13,15. All scoring and other histological assessments were performed by an observer (M.M.) blinded to the nature of the individual samples. The inflammation score was a subjective quantification of severity in which 0 was normal and 4 was severe inflammation. The myotoxicity score was determined by the nuclear internalization and regeneration of myocytes, two representative characteristics of myotoxicity of local anaesthetics. Nuclear internalization was characterized by myocytes having nuclei located away from their usual location at the periphery of the cell. Regeneration was characterized by the presence of shrunken myocytes with basophilic cytoplasm. The scoring scale was as follows: 0 was normal; 1 was perifascicular internalization; 2 was deep internalization (more than five cell layers); 3 was perifascicular regeneration; 4 was deep tissue regeneration (more than five cell layers); 5 was hemi-fascicular regeneration; and 6 was holo-fascicular regeneration.
To evaluate the neurotoxicity of the formulations, the sciatic nerve samples were fixed in Karnovsky’s KII solution (2.5% glutaraldehyde, 2.0% paraformaldehyde, 0.025% calcium chloride in 0.1 M cacodylate buffer, pH 7.4). Samples were treated with osmium tetroxide for post-fixation and were subsequently stained with uranyl acetate, dehydrated in graded ethanol solutions and infiltrated with propylene oxide/TAAB 812 Resin (TAAB Laboratories) mixtures. Tissue sections of 0.5 μm were stained with toluidine blue, followed by high-resolution light microscopy.
Statistical analysis.
Statistical comparisons were performed using Student t-test (two-sided) unless stated otherwise. Thermal latency, inflammation and myotoxicity scores are reported as medians and quartiles due to their ordinal or non-Gaussian character. Data are presented as the mean ± s.d. (n = 4) in release kinetics, cell work, neurobehavioural and histology studies. Data were considered significant if P < 0.05 (P values are provided unless P < 0.0001); data were considered not significant (NS) if P > 0.05.
Extended Data
Extended Data Fig. 1 |. Peptide concentration-dependent release kinetics, and nanostructures.
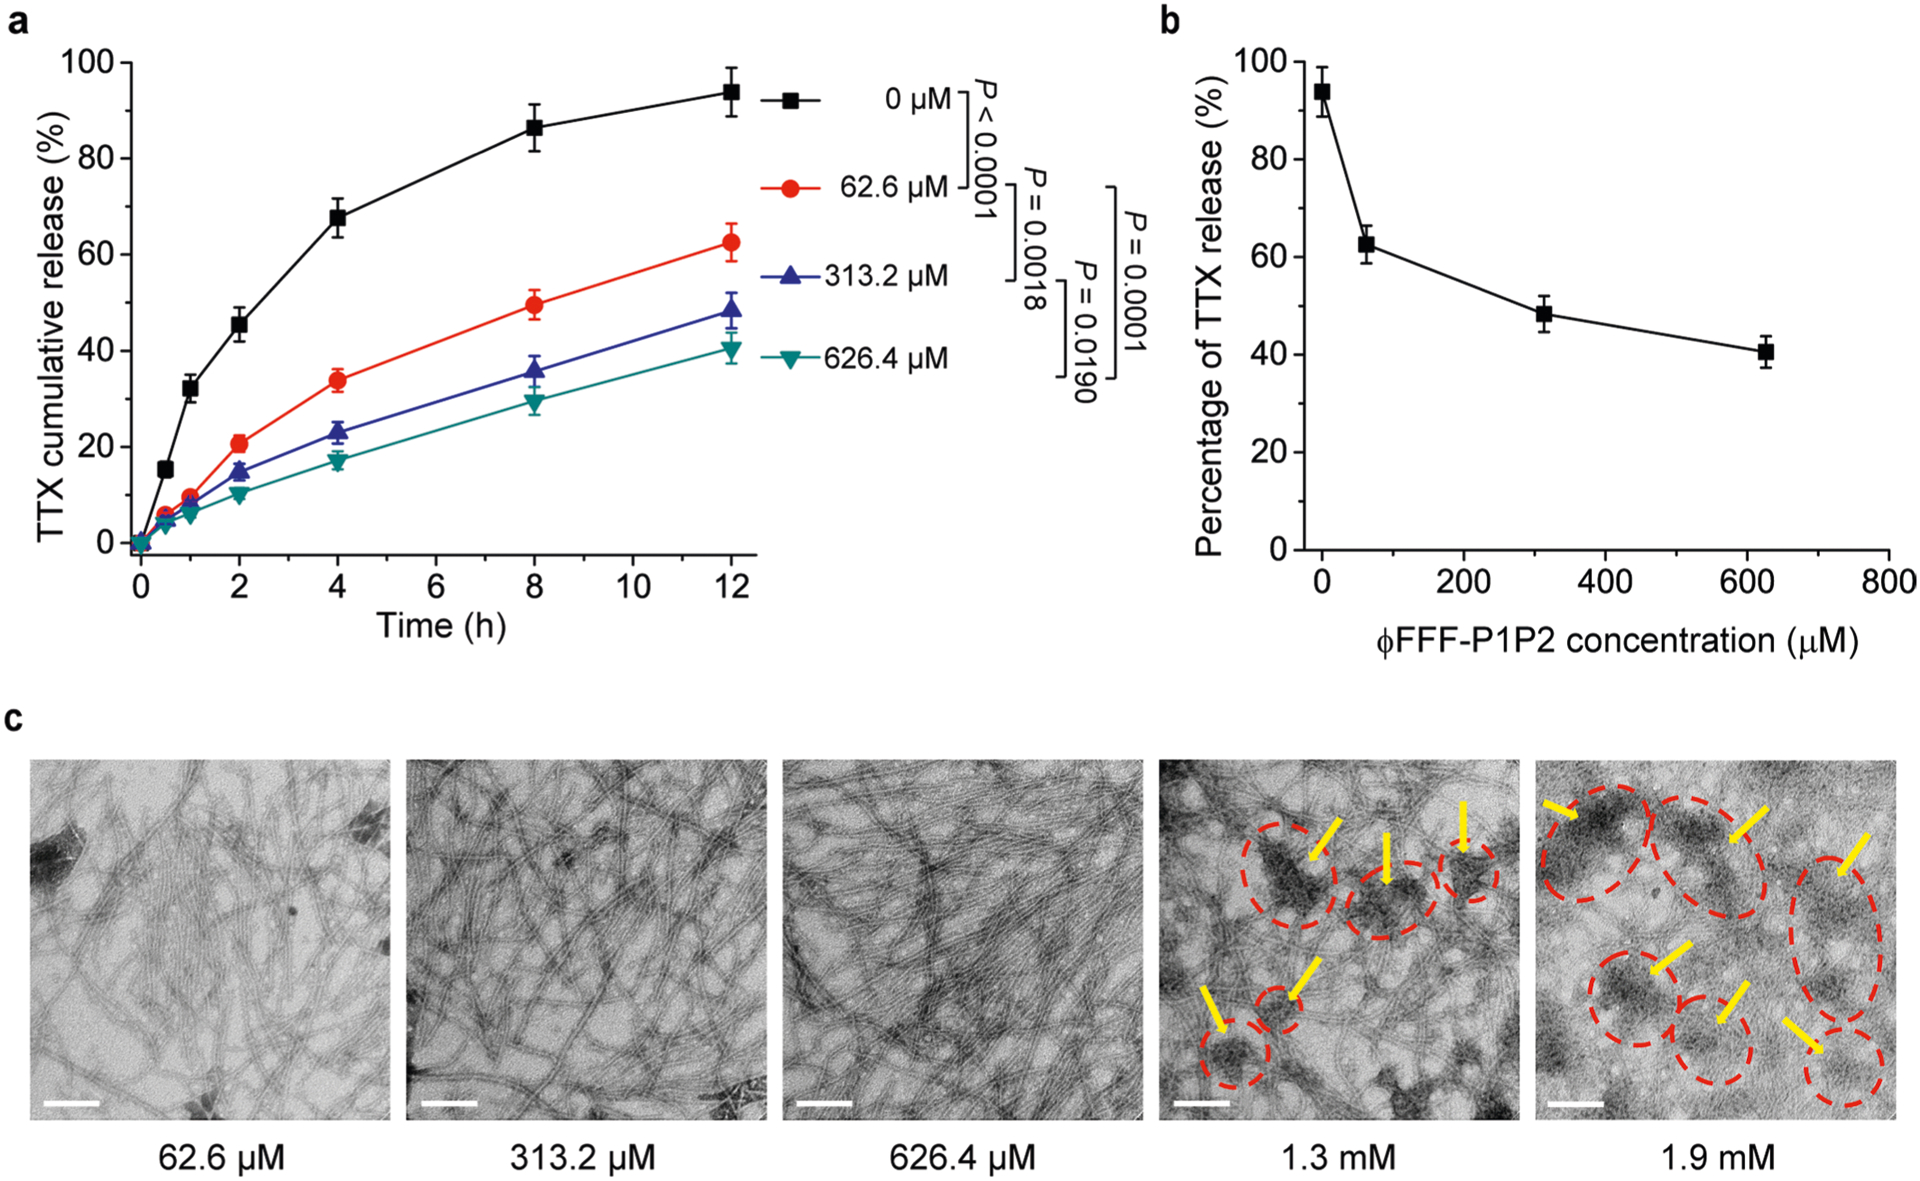
a) release kinetics of ϕFFF-P1P2 + TTX formulations with TTX and different concentrations of peptides. The TTX concentration was 62.6 μM in each group. Data are means ± SD; n = 4. *p < 0.05, **p < 0.01. b) Data from panel (a) at 12 h to show relationship between peptide concentration and release of TTX. Data are mean ± SD; n = 4. *p < 0.01 vs. ϕFFF-P1P2 concentration at 62.6 μM. c) representative TEM images showing the effect of the concentration of ϕFFF-P1P2 on morphology. The dashed red circles and yellow arrows indicated aggregations. Scale bar: 100 nm.
Extended Data Fig. 2 |. Laser scanning confocal microscopy of the fluorescence of Alexa-ϕFFF-P1P2 and Alexa-P1P2 injected at the sciatic nerve in rats.
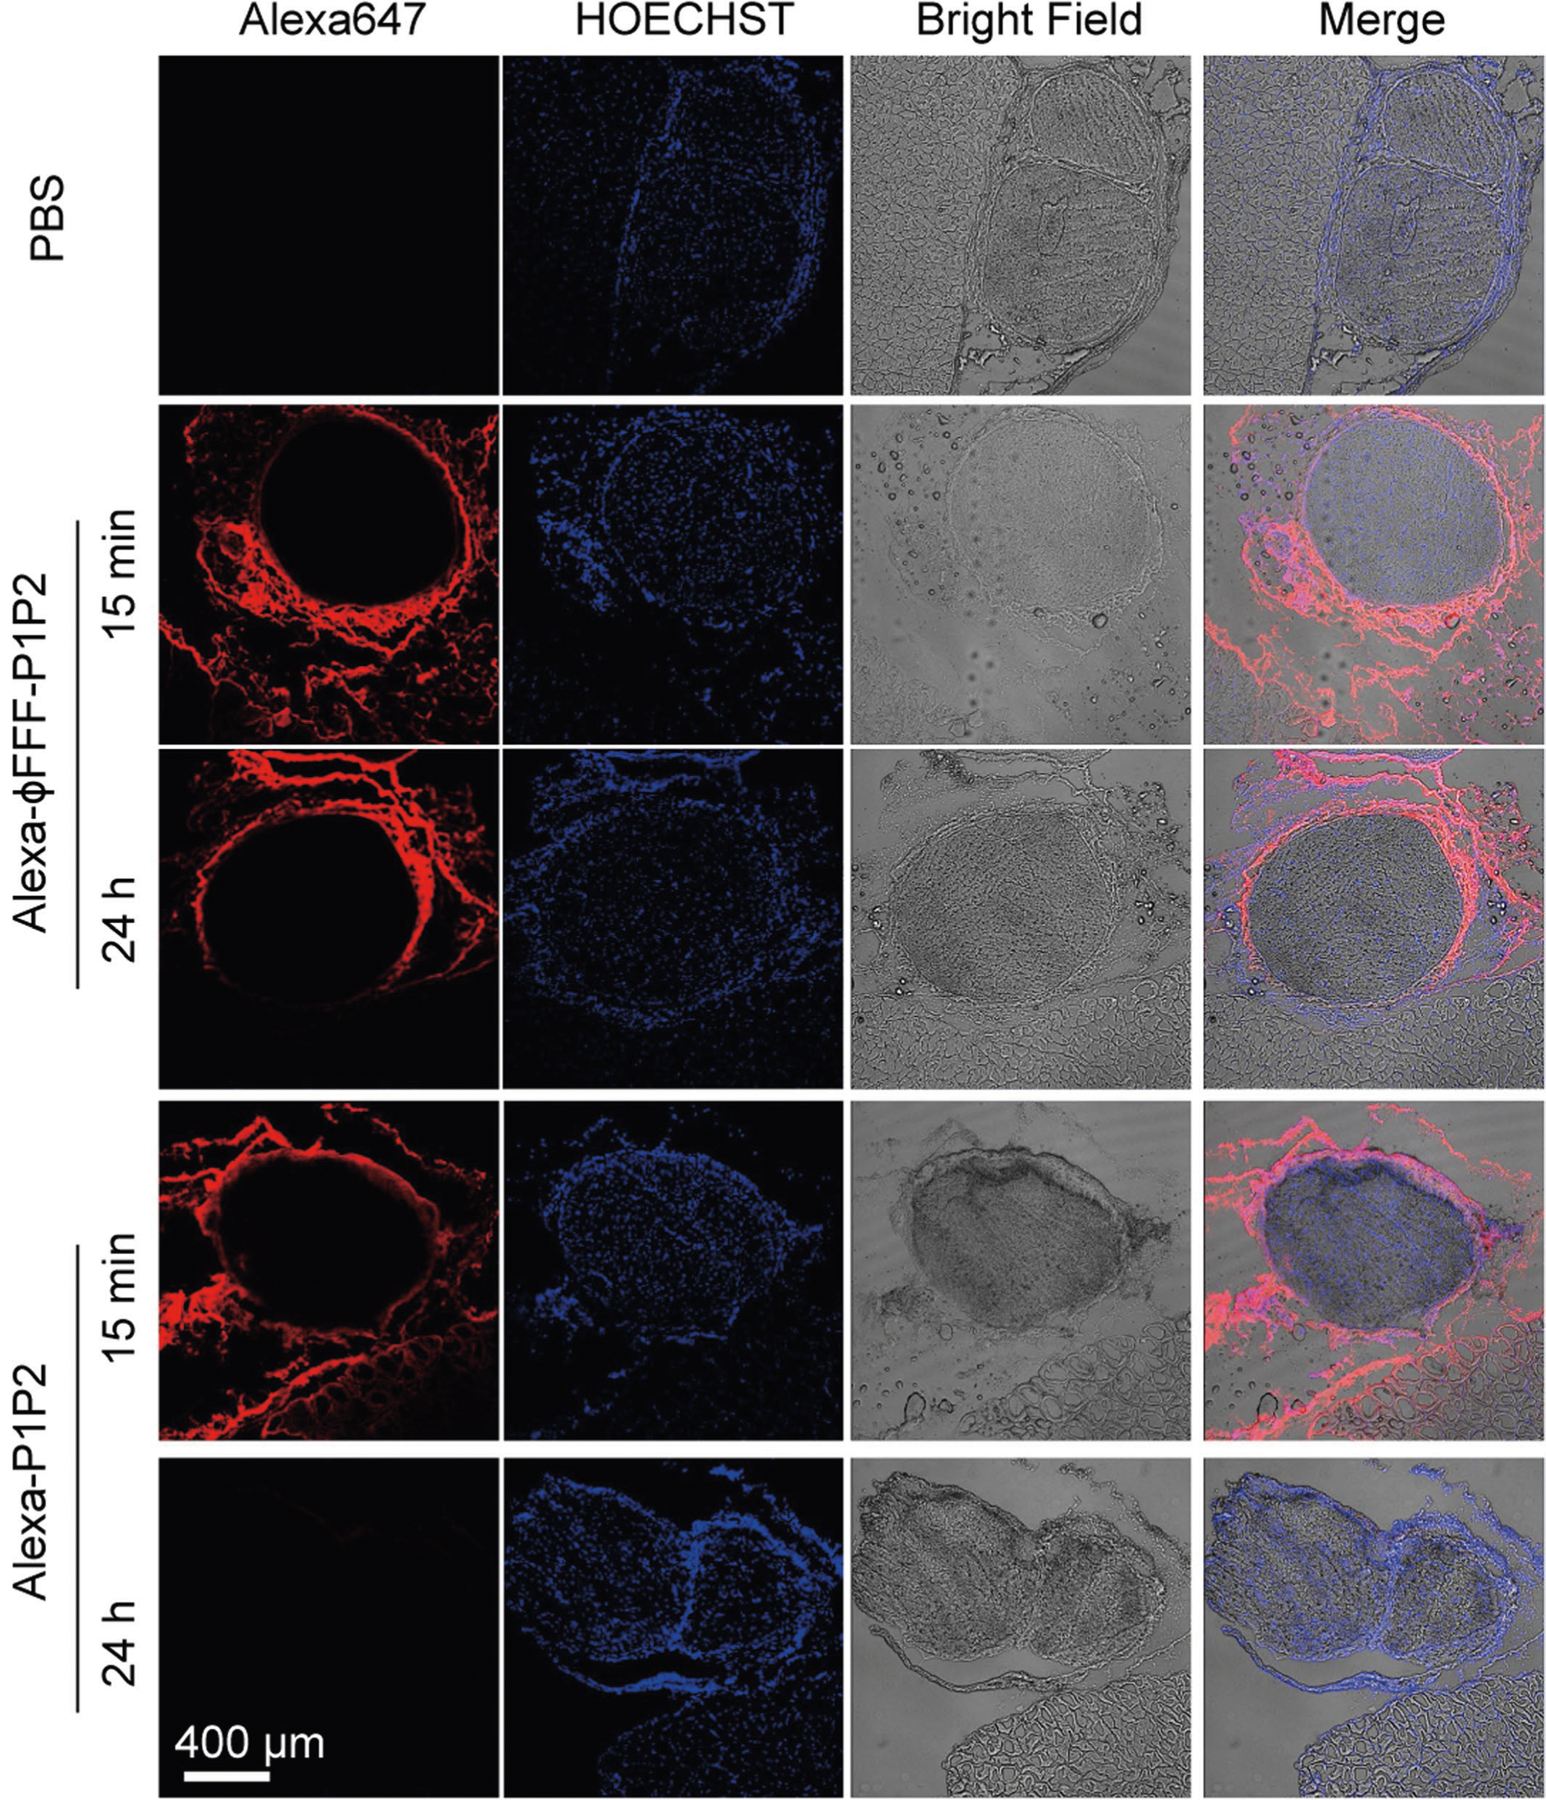
Representative images are of sciatic nerves and surrounding tissues collected 15 min and 24 h after injection. red: Alexa647, indicating formulations; blue: HOECHST33342, indicating nuclei.
Extended Data Fig. 3 |. In vivo data for saxitoxin, free and in ϕFFF-P1P2 (ϕFFF-P1P2 + STX).
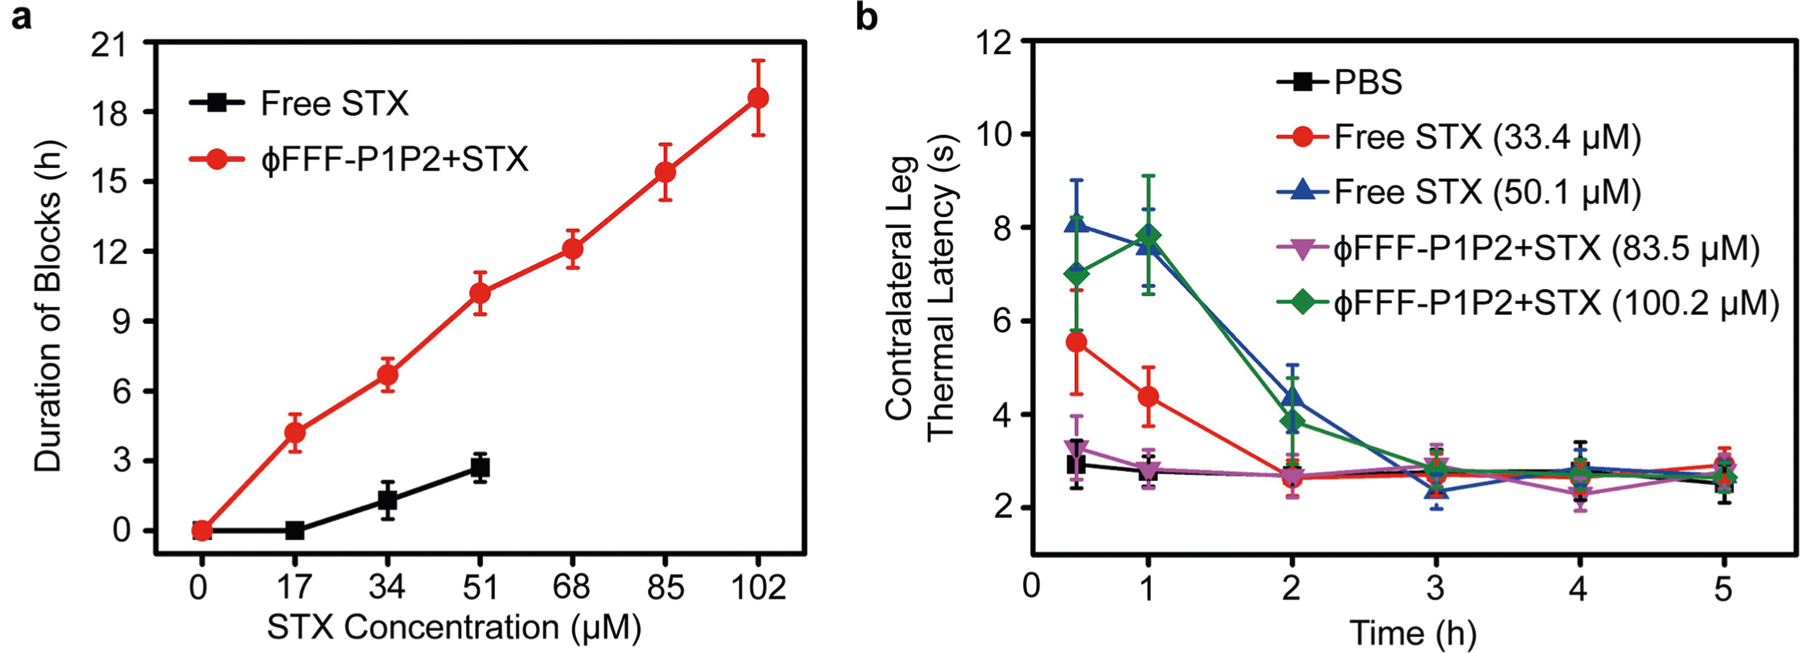
a) Duration of sensory nerve blocks. Data are means ± SD; n = 4. b) Thermal latency in the uninjected (contralateral) extremity in the first 5 h. In both panels, the ϕFFF-P1P2 concentration was 626.4 μM, and the ratio of ϕFFF-P1: ϕFFF-P2 = 1:1. The STX concentration is as shown in the figures. Data are means ± SD; n = 4.
Extended Data Fig. 4 |. Tissue reaction to STX and dcSTX formulations 14 days after administration.
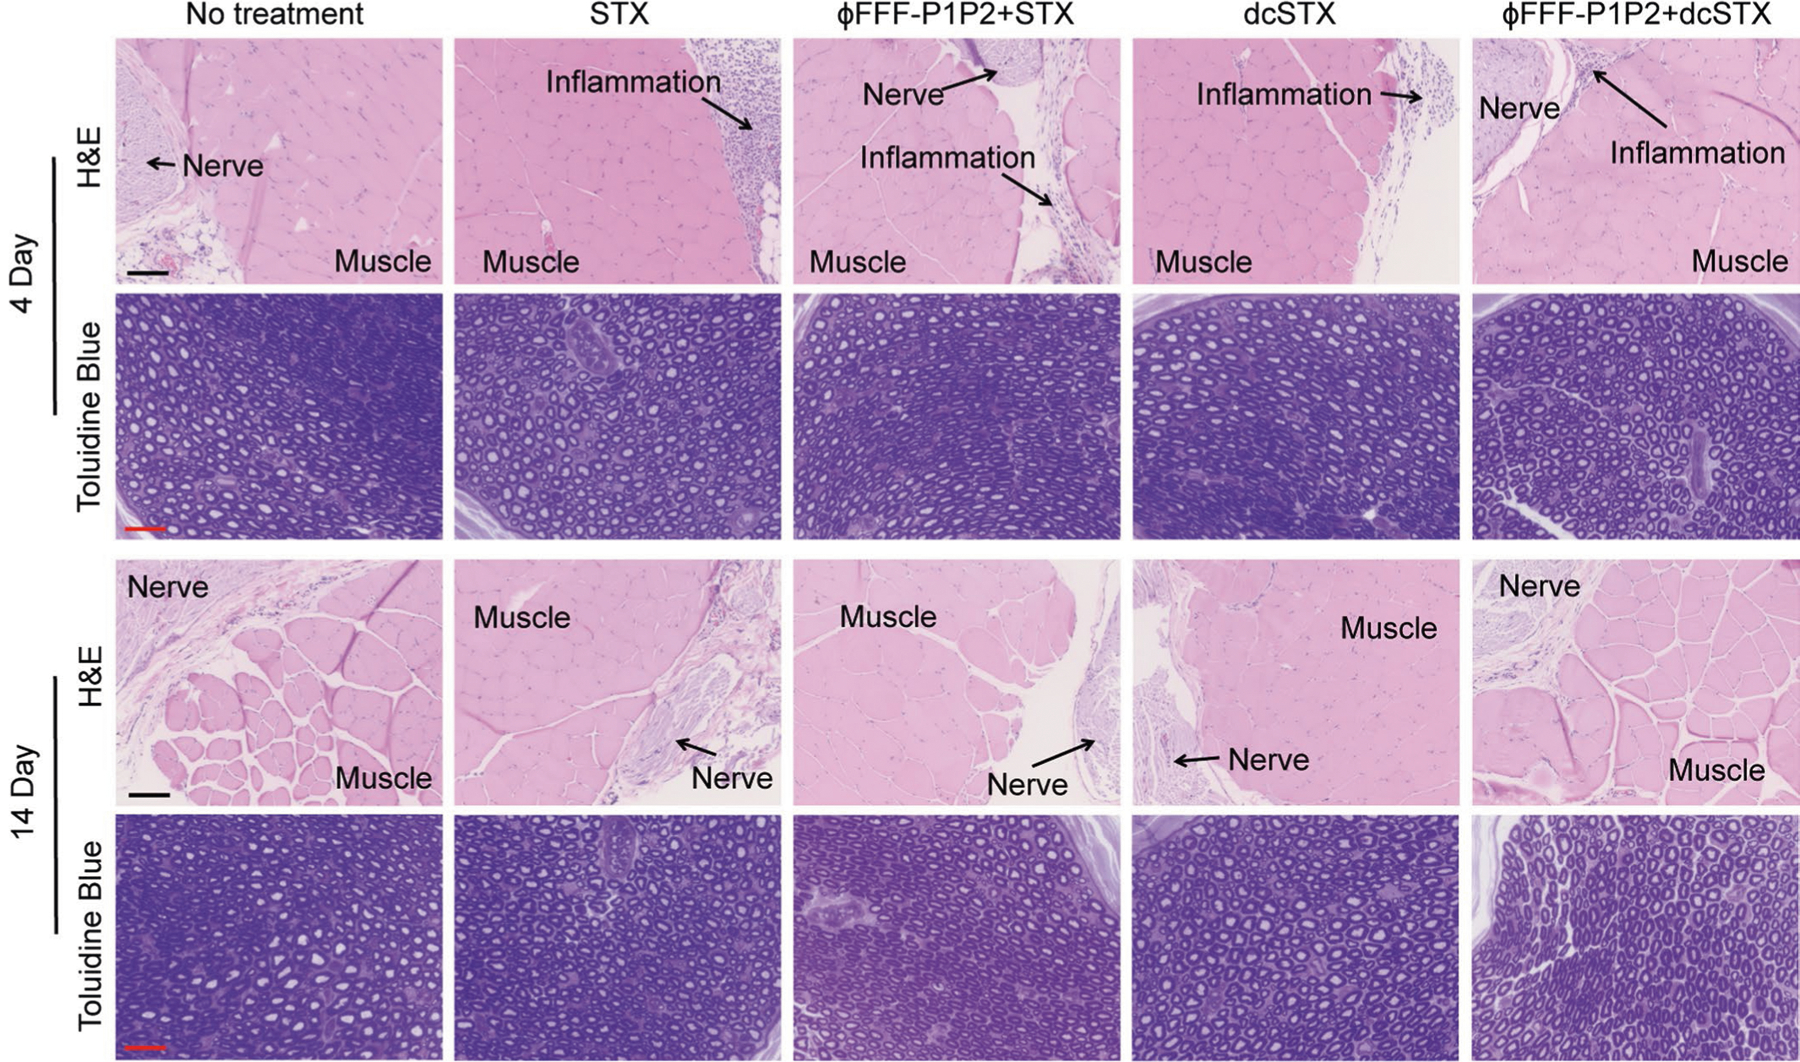
Scale bar for H&E-stained sections: 100 μm; for toluidine blue stained sections: 25 μm.
Supplementary Material
Acknowledgements
Support for this work was provided by NIH R35 GM131728 (to D.S.K.) and by the Anaesthesia Research Distinguished Trailblazer Award (to T.J. and Y.L.).
Footnotes
Reporting Summary. Further information on research design is available in the Nature Research Reporting Summary linked to this article.
Competing interests
The authors declare no competing interests.
Extended data is available for this paper at https://doi.org/10.1038/s41551-021-00793-y.
Supplementary information The online version contains supplementary material available at https://doi.org/10.1038/s41551-021-00793-y.
Data availability
The main data supporting the results in this study are available within the paper and its Supplementary Information. The raw and analysed datasets generated during the study are available for research purposes from the corresponding author upon reasonable request.
References
- 1.McAlvin JB, Reznor G, Shankarappa SA, Stefanescu CF & Kohane DS Local toxicity from local anesthetic polymeric microparticles. Anesth. Analg 116, 794–803 (2013). [DOI] [PMC free article] [PubMed] [Google Scholar]
- 2.Santamaria CM, Woodruff A, Yang R & Kohane DS Drug delivery systems for prolonged duration local anesthesia. Mater. Today 20, 22–31 (2017). [DOI] [PMC free article] [PubMed] [Google Scholar]
- 3.Kohane DS et al. A re-examination of tetrodotoxin for prolonged duration local anesthesia. Anesthesiology 89, 119–131 (1998). [DOI] [PubMed] [Google Scholar]
- 4.Lahaye LA & Butterworth JF IV Site-1 sodium channel blockers as local anesthetics: will neosaxitoxin supplant the need for continuous nerve blocks? Anesthesiology 123, 741–742 (2015). [DOI] [PubMed] [Google Scholar]
- 5.Adams H, Blair M Jr & Takman B The local anesthetic activity of saxitoxin alone and with vasoconstrictor and local anesthetic agents. Arch. Int. Pharmacodyn. Ther 224, 275–282 (1976). [PubMed] [Google Scholar]
- 6.Padera R, Bellas E, Tse JY, Hao D & Kohane DS Local myotoxicity from sustained release of bupivacaine from microparticles. Anesthesiology 108, 921–928 (2008). [DOI] [PMC free article] [PubMed] [Google Scholar]
- 7.Neal JM, Salinas FV & Choi DS Local anesthetic-induced myotoxicity after continuous adductor canal block. Reg. Anesth. Pain Med 41, 723–727 (2016). [DOI] [PubMed] [Google Scholar]
- 8.Hofmann P et al. The myotoxic effect of bupivacaine and ropivacaine on myotubes in primary mouse cell culture and an immortalized cell line. Anesth. Analg 117, 634–640 (2013). [DOI] [PubMed] [Google Scholar]
- 9.Kohane DS et al. The local anesthetic properties and toxicity of saxitonin homologues for rat sciatic nerve block in vivo. Reg. Anesth. Pain Med 25, 52–59 (2000). [DOI] [PubMed] [Google Scholar]
- 10.Kohane DS et al. Prolonged duration local anesthesia from tetrodotoxin-enhanced local anesthetic microspheres. Pain 104, 415–421 (2003). [DOI] [PubMed] [Google Scholar]
- 11.Rwei AY et al. Repeatable and adjustable on-demand sciatic nerve block with phototriggerable liposomes. Proc. Natl Acad. Sci. USA 112, 15719–15724 (2015). [DOI] [PMC free article] [PubMed] [Google Scholar]
- 12.Zhan C et al. Ultrasensitive phototriggered local anesthesia. Nano Lett 17, 660–665 (2017). [DOI] [PMC free article] [PubMed] [Google Scholar]
- 13.Thalhammer J, Vladimirova M, Bershadsky B & Strichartz G Neurologic evaluation of the rat during sciatic nerve block with lidocaine. Anesthesiology 82, 1013–1025 (1995). [DOI] [PubMed] [Google Scholar]
- 14.Zhan C et al. Phototriggered local anesthesia. Nano Lett 16, 177–181 (2016). [DOI] [PubMed] [Google Scholar]
- 15.Rwei AY, Zhan C, Wang B & Kohane DS Multiply repeatable and adjustable on-demand phototriggered local anesthesia. J. Control. Release 251, 68–74 (2017). [DOI] [PMC free article] [PubMed] [Google Scholar]
- 16.Stoetzer C et al. Tetrodotoxin-sensitive α-subunits of voltage-gated sodium channels are relevant for inhibition of cardiac sodium currents by local anesthetics. Naunyn Schmiedebergs Arch. Pharmacol 389, 625–636 (2016). [DOI] [PubMed] [Google Scholar]
- 17.Nau C, Wang S-Y & Wang GK Point mutations at L1280 in Nav1.4 channel D3-S6 modulate binding affinity and stereoselectivity of bupivacaine enantiomers. Mol. Pharmacol 63, 1398–1406 (2003). [DOI] [PubMed] [Google Scholar]
- 18.Lipkind GM & Fozzard HA A structural model of the tetrodotoxin and saxitoxin binding site of the Na+ channel. Biophys. J 66, 1–13 (1994). [DOI] [PMC free article] [PubMed] [Google Scholar]
- 19.Kaneko Y, Matsumoto G & Hanyu Y TTX resistivity of Na+ channel in newt retinal neuron. Biochem. Biophys. Res. Commun 240, 651–656 (1997). [DOI] [PubMed] [Google Scholar]
- 20.Choudhary G, Yotsu-Yamashita M, Shang L, Yasumoto T & Dudley SC Jr Interactions of the C-11 hydroxyl of tetrodotoxin with the sodium channel outer vestibule. Biophys. J 84, 287–294 (2003). [DOI] [PMC free article] [PubMed] [Google Scholar]
- 21.Chen S-F, Cölfen H, Antonietti M & Yu S-H Ethanol assisted synthesis of pure and stable amorphous calcium carbonate nanoparticles. Chem. Comm 49, 9564–9566 (2013). [DOI] [PubMed] [Google Scholar]
- 22.Bender M The use of light scattering for determining particle size and molecular weight and shape. J. Chem. Educ 29, 15 (1952). [Google Scholar]
- 23.Wasielewski MR Self-assembly strategies for integrating light harvesting and charge separation in artificial photosynthetic systems. Acc. Chem. Res 42, 1910–1921 (2009). [DOI] [PubMed] [Google Scholar]
- 24.Chen R & Chung S-H Mechanism of tetrodotoxin block and resistance in sodium channels. Biochem. Biophys. Res. Commun 446, 370–374 (2014). [DOI] [PubMed] [Google Scholar]
- 25.Lee CH & Ruben PC Interaction between voltage-gated sodium channels and the neurotoxin, tetrodotoxin. Channels 2, 407–412 (2008). [DOI] [PubMed] [Google Scholar]
- 26.Tikhonov DB & Zhorov BS Predicting structural details of the sodium channel pore basing on animal toxin studies. Front. Pharmacol 9, 880 (2018). [DOI] [PMC free article] [PubMed] [Google Scholar]
- 27.Shen H et al. Structural basis for the modulation of voltage-gated sodium channels by animal toxins. Science 362, eaau2596 (2018). [DOI] [PubMed] [Google Scholar]
- 28.Ji T et al. Peptide assembly integration of fibroblast‐targeting and cell‐ penetration features for enhanced antitumor drug delivery. Adv. Mater 27, 1865–1873 (2015). [DOI] [PubMed] [Google Scholar]
- 29.Ji T et al. Designing liposomes to suppress extracellular matrix expression to enhance drug penetration and pancreatic tumor therapy. ACS Nano 11, 8668–8678 (2017). [DOI] [PubMed] [Google Scholar]
- 30.Ji T et al. Transformable peptide nanocarriers for expeditious drug release and effective cancer therapy via cancer‐associated fibroblast activation. Angew. Chem 128, 1062–1067 (2016). [DOI] [PMC free article] [PubMed] [Google Scholar]
- 31.Israelachvili JN Intermolecular and Surface Forces (Academic Press, 2011). [Google Scholar]
- 32.Trent A, Marullo R, Lin B, Black M & Tirrell M Structural properties of soluble peptide amphiphile micelles. Soft Matter 7, 9572–9582 (2011). [Google Scholar]
- 33.Wang H, Feng Z & Xu B Supramolecular assemblies of peptides or nucleopeptides for gene delivery. Theranostics 9, 3213–3222 (2019). [DOI] [PMC free article] [PubMed] [Google Scholar]
- 34.Hendricks MP, Sato K, Palmer LC & Stupp SI Supramolecular assembly of peptide amphiphiles. Acc. Chem. Res 50, 2440–2448 (2017). [DOI] [PMC free article] [PubMed] [Google Scholar]
- 35.Hartgerink JD, Beniash E & Stupp SI Self-assembly and mineralization of peptide–amphiphile nanofibers. Science 294, 1684–1688 (2001). [DOI] [PubMed] [Google Scholar]
- 36.Ortony JH et al. Internal dynamics of a supramolecular nanofibre. Nat. Mater 13, 812–816 (2014). [DOI] [PMC free article] [PubMed] [Google Scholar]
- 37.Micsonai A et al. Accurate secondary structure prediction and fold recognition for circular dichroism spectroscopy. Proc. Natl Acad. Sci. USA 112, E3095–E3103 (2015). [DOI] [PMC free article] [PubMed] [Google Scholar]
- 38.Greenfield NJ Using circular dichroism spectra to estimate protein secondary structure. Nat. Protoc 1, 2876–2890 (2006). [DOI] [PMC free article] [PubMed] [Google Scholar]
- 39.Ellett LJ & Johanssen VA In Prions: Methods and Protocols (ed. Lawson VA) 27–34 (Springer, 2017). [Google Scholar]
- 40.Feldman CR, Brodie ED & Pfrender ME Constraint shapes convergence in tetrodotoxin-resistant sodium channels of snakes. Proc. Natl. Acad. Sci. USA 109, 4556–4561 (2012). [DOI] [PMC free article] [PubMed] [Google Scholar]
- 41.Kawatsu K, Hamano Y, Yoda T, Terano Y & Shibata T Rapid and highly sensitive enzyme immunoassay for quantitative determination of tetrodotoxin. Jpn. J. Med. Sci. Biol 50, 133–150 (1997). [DOI] [PubMed] [Google Scholar]
- 42.Moczydlowski E, Mahar J & Ravindran A Multiple saxitoxin-binding sites in bullfrog muscle: tetrodotoxin-sensitive sodium channels and tetrodotoxin-insensitive sites of unknown function. Mol. Pharmacol 33, 202–211 (1988). [PubMed] [Google Scholar]
- 43.Ciolino JB et al. A drug-eluting contact lens. Invest. Ophthalmol. Vis. Sci 50, 3346–3352 (2009). [DOI] [PMC free article] [PubMed] [Google Scholar]
- 44.Lomonte B et al. Comparative study of the cytolytic activity of myotoxic phospholipases A2 on mouse endothelial (tEnd) and skeletal muscle (C2C12) cells in vitro. Toxicon 37, 145–158 (1999). [DOI] [PubMed] [Google Scholar]
- 45.Slotkin TA, MacKillop EA, Ryde IT, Tate CA & Seidler FJ Screening for developmental neurotoxicity using PC12 cells: comparisons of organophosphates with a carbamate, an organochlorine, and divalent nickel. Environ. Health Perspect 115, 93–101 (2007). [DOI] [PMC free article] [PubMed] [Google Scholar]
Associated Data
This section collects any data citations, data availability statements, or supplementary materials included in this article.
Supplementary Materials
Data Availability Statement
The main data supporting the results in this study are available within the paper and its Supplementary Information. The raw and analysed datasets generated during the study are available for research purposes from the corresponding author upon reasonable request.


