

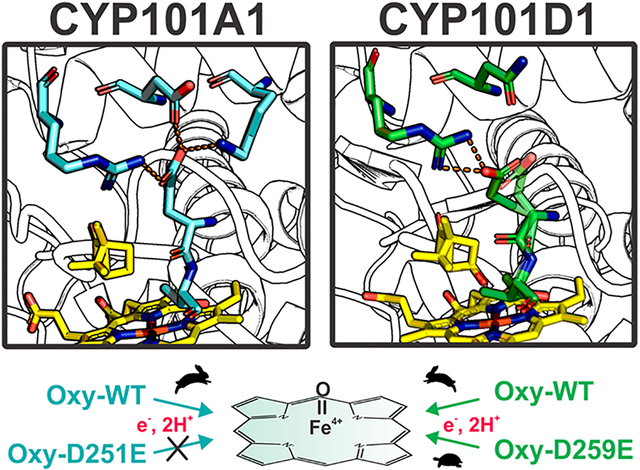
Abstract
Cytochrome P450s are among nature’s most powerful catalysts. Their ability to activate molecular dioxygen to form high-valent ferryl intermediates (Compounds I and II) enables a wide array of chemistries ranging from simple epoxidations to more complicated C–H bond oxidations. Oxygen activation is achieved by reduction of the ferrous dioxygen complex, which requires the transfer of an electron from a redox partner and subsequent double protonation to yield a water molecule and a ferryl porphyrin π-cation radical (Compound I). Previous studies of the CYP101 family of cytochrome P450s demonstrated the importance of the conserved active site Asp25X residue in this protonation event, although its precise role is yet to be unraveled. To further explore the origin of protons in oxygen activation, we analyzed the effects of an Asp to Glu mutation at the 25X position in P450cam and in CYP101D1. This mutation inactivates P450cam but not CYP101D1. A series of mutagenic, crystallographic, kinetic, and molecular dynamics studies indicate that this mutation locks P450cam into a closed, inactive conformation. In CYP101D1, the D259E mutant changes the rate-limiting step to reduction of the P450-oxy complex, thus opening a window into the critical proton-coupled electron transfer step in P450 catalysis.
Graphical Abstract
Cytochromes P450 are heme-containing monooxygenases that can catalyze the oxidation of C–H bonds to give the corresponding alcohol. P450s are widespread in nature and participate in xenobiotic detoxification, steroid biosynthesis, the synthesis of various natural products, and the oxidative assimilation of various compounds as carbon/energy sources in a number of bacteria.1 The catalytic cycle of all P450s requires the transfer of an electron from a FMN or iron–sulfur redox partner. The most detailed understanding of P450–redox partner interactions derives from P450cam (CYP101A1) from Pseudomonas putida given that this was the first P450 crystal structure to be determined, the first to be sequenced, and the first to be available in sufficient quantities for detailed structure–function studies.2–6
The P450cam redox partner is the Fe2S2 ferredoxin called putidaredoxin or Pdx. There are two electron transfer (ET) steps involving Pdx. The first ET step reduces the P450cam heme iron from Fe(III) to Fe(II) to form the oxy-P450, which is usually considered to be ferric-superoxide, Fe(III)-O-O−. The second ET step effectively reduces the heme to ferric peroxy, Fe(III)-O-O2−. This second ET step is accompanied by protonation of the distal peroxide O atom to give first Fe-OOH− followed by a second protonation to give Fe(III)-O-OH2. Proper protonation is required to promote heterolytic cleavage of the O–O bond so that H2O departs, leaving behind the ferryl center of Compound I, Fe(IV)=O, the active P450 oxidant.
A long-standing problem in P450 enzymology is how protons are properly delivered to the iron-linked oxygen. Early on, Asp251 (Figure 1) was proposed to play a critical role in forming a proton relay network.7,8 An acid residue, Asp or Glu, is found at this position in many P450s and where investigated has been found to be important for function.9–11 In addition, a D251N P450cam mutant retains at most 1% of wild-type activity, and what little activity is left exhibits a large kinetic solvent isotope effect, suggesting Asp251 is involved in proton transfer.8 Interestingly, the P450cam structure shows that Asp251 is tied up in salt bridges with Lys178 and Arg186 (Figure 1), so if Asp251 is to serve in a proton relay network, these salt bridges must be broken. The P450cam–Pdx crystal structure12,13 shows that Pdx binding favors a more open structure of P450cam wherein Asp251 is freed from its salt bridges (Figure 1) and thus can participate in a proton relay network. This Pdx-induced change in structure enables the proton relay network to operate and provides a structural basis for why only Pdx can support the second ET step.14 Pdx not only operates as a source of electrons but also serves as an allosteric effector by promoting the structural changes required to arm the proton relay machinery.
Figure 1.
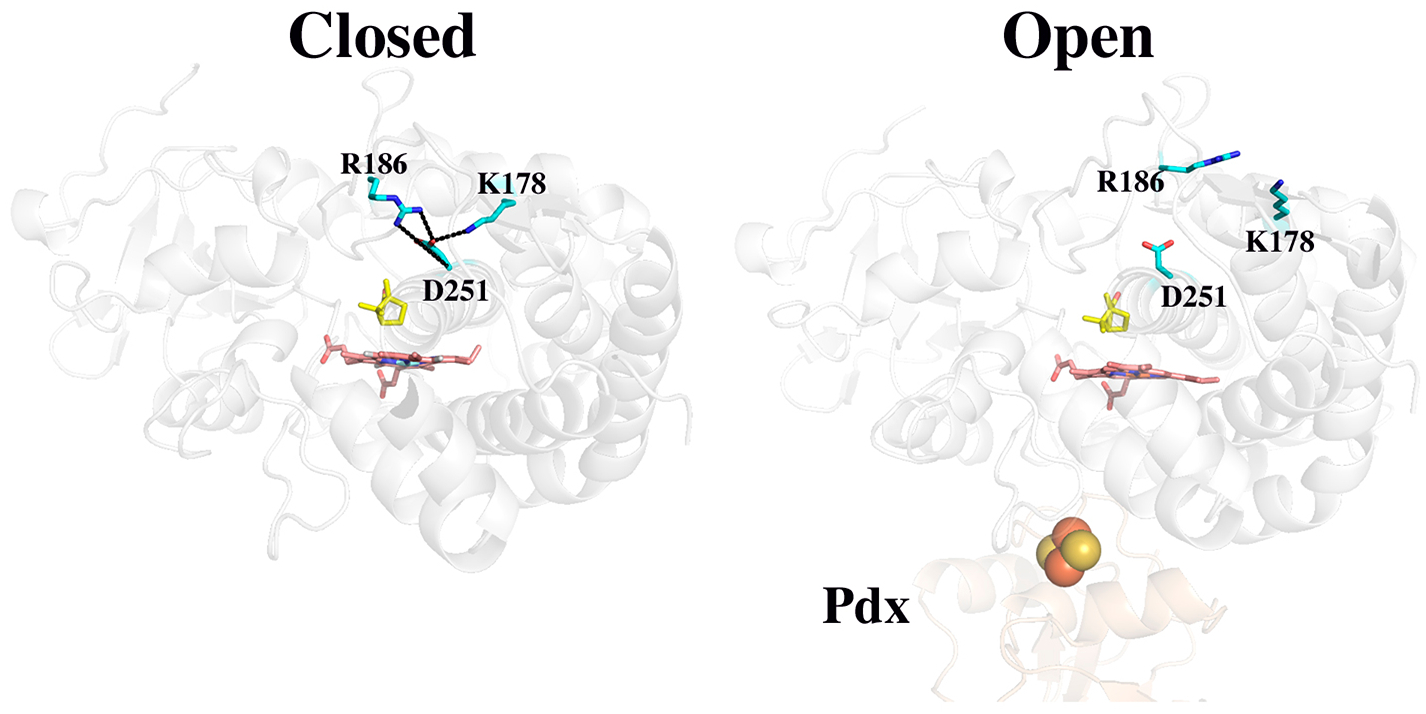
Closed (5CP4) and open (4JX1) structures of P450cam. In the closed state, Asp251 makes salt bridges to Arg186 and Lys178. In the open state, the substrate access channel widens and the Asp251 salt bridges are disrupted. Camphor is colored yellow.
As a control in probing the proton relay network in P450cam, we converted Asp251 to Glu with the expectation that this conservative mutation would have an only modest effect. Instead, we found that this mutant exhibits no enzymatic activity in P450cam but retains substantial activity in CYP101D1. Probing the reason for this difference provided the basis for this study.
MATERIALS AND METHODS
Protein Expression.
Expression conditions for P450cam, CYP101D1, and all of the mutants followed published methods.9,15,16 Briefly, the P450 expression-containing plasmids were transformed into C41(DE3) Escherichia coli cells. A single colony was inoculated in Luria Broth and grown overnight at 37 °C. The following day, 20 mL of a starter culture was inoculated into 1 L of modified Terrific Broth (24 g of yeast extract, 12 g of tryptone, and 2 g of peptone per liter) supplemented with the necessary antibiotic (100 μg/mL ampicillin for P450cam and mutants and 50 μg/mL kanamycin for CYP101D1 and mutants), 125 mg/mL thiamine, and trace metals. Cultures were grown for ~2 h at 37 °C until the OD600 was 0.6, after which the temperature was decreased to 20 °C and the cultures were shaken for an additional 1 h. Cultures were induced at an OD600 of ~1.5 with 0.2 mM isopropyl β-d-1-thiogalactopyranoside and 15 mg/L 5-aminolevulinic acid and grown for an additional 48 h.
Protein Purification.
Cells containing P450cam or any of its mutants were resuspended in buffer A [50 mM K2HPO4 (pH 8) and 1 mM DTT] and stirred for 2 h before being lysed using a microfluidizer. The lysate was centrifuged for 45 min at 16000 rpm, and the pellet was discarded. The supernatant was loaded onto a previously equilibrated anion exchange column (Q Sepharose, GE Healthcare), washed with buffer A, and eluted over a 7 column volume (CV) gradient to buffer A supplemented with 500 mM NaCl. Fractions with an RZ absorbance ratio (A418/A280) of >0.8 were pooled and dialyzed against buffer A. The protein then was diluted 1:1 (v:v) with buffer B [50 mM K2HPO4 (pH 8) and 60% (w/v) ammonium sulfate] and loaded onto a Phenyl Sepharose (GE Healthcare) column. The resin was washed with 5 CV of buffer C [50 mM K2HPO4 (pH 8) and 30% (w/v) ammonium sulfate] and eluted over 7 CV to buffer A. Fractions with an RZ ratio of >1.3 were pooled, concentrated, and further purified using an S200 Sephacryl column in 50 mM K2HPO4 (pH 7.4) and 100 mM NaCl. Proteins were concentrated and supplemented with 1 mM d-camphor for long-term storage. The final average yield was 60 mg of protein per liter of culture, and the RZ ratio was >1.7.
Purification conditions were similar for CYP101D1 and its variants with some minor modifications.9,17 Cell pellets were resuspended with lysis buffer [50 mM K2HPO4 (pH 8), 100 mM NaCl, and 10 mM imidazole], stirred for 2 h, and disrupted using a microfluidizer. The lysate was centrifuged for 45 min at 16000 rpm, and the supernatant was loaded onto a Ni-NTA column previously equilibrated with lysis buffer. The resin was washed with lysis buffer and eluted with 200 mM imidazole. Red-colored fractions were pooled and dialyzed against buffer A. Similar to P450cam, the protein was further purified using hydrophobic interaction and size exclusion chromatography. The final average yield was 35 mg per liter of culture with an RZ ratio of >1.5.
Spectroscopy.
All ultraviolet–visible spectroscopy was performed on a Cary 3 spectrophotometer. The following extinction coefficients were used: ε418 = 115 mM−1 cm−1 for P450cam and its variants,2 and ε418 = 107 mM−1 cm−1 for D259E CYP101D1.18 For the ferredoxin proteins, Pdx19 and Arx,18 the following 414 nm extinction coefficients were used: ε = 10.2 mM−1 cm−1, and ε = 9.3 mM−1 cm−1.
Crystallization.
All P450cam variants were prepared in a similar way. Proteins were thawed on ice and buffer-exchanged into 100 mM Bis-Tris (pH 6.5) using a PD-10 desalting column. Samples were concentrated to ~30 mg/mL (~650 μM). Crystals were grown using the hanging-drop method at room temperature using substrate-free conditions previously published20 [100 mM Bis-Tris (pH 6.5), 20% PEG 8000, 200 mM KCl, and 5 mM DTT] or in the presence of camphor (50 mM Tris, 10% PEG 4000, 200 mM KCl, and 1.2 mM d-camphor). To generate camphor-bound crystals from the substrate-free conditions, single crystals were soaked for 1 h in a reservoir solution supplemented with 1 mM d-camphor and subsequently flash-frozen in liquid nitrogen; 25% glycerol was used as the cryoprotectant for all crystals.
Similarly, D259E CYP101D1 crystals were prepared at room temperature using the hanging-drop method.9,17 Drops contained 2 μL of protein sample at 60 mg/mL (~1.3 mM) in 25 mM Tris (pH 8) and 2 μL of a reservoir solution [1.6 M ammonium sulfate and 0.1 M Tris (pH 8.2)]. Camphor-bound crystals were generated by soaking crystals for 1 h in a reservoir solution containing 1 mM d-camphor and 20% glycerol as a cryoprotectant. All data sets were collected at the Stanford Synchrotron Radiation Lightsource (SSRL) facility. Data were indexed, integrated, and scaled using XDS. Molecular replacement calculations and refinement were performed using PHASER21,22 and Phenix.refine, respectively, in the Phenix graphical interface.23,24 Data collection and refinement statistics are listed in Table S1. Backbone B-factor comparison was performed using the Structure Comparison module on Phenix. B-Factors were normalized to the mean B-factor of the chain. Tunnel and cavity analyses were performed using Mole 2.0.25
Steady-State Assays.
The hydroxylation activity of the P450 enzymes was determined spectroscopically using a Cary 3 spectrophotometer by monitoring the absorbance of NADH at 340 nm.15,19 The reconstituted systems contained 0.5 μM P450 enzyme, 5 μM ferredoxin (either PdX for P450cam or ArX for CYP101D1), 0.5 μM ferredoxin reductase (either PdR or ArR), and 200 μM NADH in 50 mM K2HPO4 (pH 7.4), for a final volume of 1 mL. Reactions were initiated by the addition of 200 μM d-camphor with minimal dilution. Rates were determined using the least-squares regression line method and using the extinction coefficient of NADH at 340 nm of 6300 M−1 cm−1. For measurements in D2O, the reconstituted system was incubated in D2O for at least 3 h at room temperature. To assess system coupling, reactions were run to completion enabling the exact amount of NADH oxidized to be determined. The reaction mixture then was extracted with a 2:1 volume of dichloromethane using cineole as an internal standard, and the amount of product formed was quantitated using GC/MS. The ratio of product formed to NADH oxidized is a measure of coupling efficiency.
Stopped-Flow Kinetics.
All measurements were performed using an SX-18 stopped-flow apparatus from Applied Photophysics under oxygen-free conditions. Full spectral data were acquired using photodiode array (PDA) detection, and single-wavelength traces were collected using a photomultiplier tube (PMT). All buffers and protein samples used in these experiments were degassed and purged with argon gas and treated under oxygen-deprived conditions unless otherwise specified. All samples were buffered in 50 mM K2HPO4 (pH 7.4) and 200 μM d-camphor. First-electron transfer rates were determined by monitoring the formation of the CO complex. Briefly, two solutions containing either 10 μM P450 or 70 μM ferredoxin were degassed and purged with CO gas for 5 min. Ferredoxin was additionally treated with a stoichiometric amount of sodium dithionite until the protein was fully reduced (determined spectroscopically). Protein samples were loaded into the anaerobic syringes and rapidly mixed in a 1:1 ratio at room temperature. CO complex formation and decay rates were determined by fitting the PMT time courses at 448 nm using the ProData software.
To determine second-electron transfer rates, the sequential mixing mode of the stopped-flow apparatus was used. A solution of 20 μM P450 was treated with stoichiometric amounts of sodium dithionite and rapidly mixed in a 1:1 ratio (v:v) against an oxygen-saturated buffer solution, aged 100 ms to allow for maximal accumulation of the oxy complex, and subsequently mixed in a 1:1 ratio with a solution of 70 μM reduced ferredoxin. Rates were determined by fitting the PMT time courses at 435 and 392 nm. For the D251E P450cam mutant, reduced Pdx had little effect on the oxy complex.
Computational Methods.
Amber 18 was employed for molecular dynamics simulations using force fields and parameters previously described.26,27 P450cam substrate-bound structures with crystallographic water molecules were solvated in an octahedral box of water with a 10 Å cushion and sodium ions added to maintain net neutrality. Energy minimization consisted of 1000 cycles allowing H atoms and solvent to move followed by 5000 cycles of unrestrained conjugate gradient minimization. The solvated system was allowed to equilibrate for 2 ns with backbone and camphor atoms restrained. This was followed by 10 separate 100 ns simulations, each with a different initial starting velocity. A total of 50000 snapshots form the 10 separate runs were used for further analysis using cpptraj28 and home-built scripts.
The pKa’s of Asp251 and Glu251 were estimated with H++ (http://biophysics.cs.vt.edu/) using Amber charges as inputs. We also employed Amber 18 for constant-pH calculations.29,30 Constant-pH calculations require the reference energy of a model compound in water. To model Asp and Glu, we used a Gly-Asp/Glu-Gly peptide with the N- and C-termini acetylated. The traditional method for obtaining the protonation/deprotonation energy of the model compound is thermodynamic integration. A simpler and less cumbersome method that we employed is finddgref.py in Amber 18 wherein the energy is continually adjusted at the known pKa of the Asp or Glu until 50% protonation is achieved. This reference energy then can be used to calculate the pKa of the Asp or Glu in the protein.
RESULTS
Crystal Structures.
The crystal structure of camphor-bound D251E P450cam was determined by either co-crystallization [Protein Data Bank (PDB) entry 6WE6, D251E-co] or soaking (PDB entry 6WFL, D251E-soak) to final resolutions of 2.16 and 1.6 Å, respectively. The main difference between WT P450cam and the D251E-co structure is that in Glu251 one carboxyl O atom is closer to (2.6 Å) an Asp182 carboxyl O atom in the mutant (Figure 2 and Table S2), suggesting a potential H-bond, which will be addressed below. The electron density for the substrate, camphor, is well-defined in D251E-co with no hint of product, indicating that X-ray-generated hydrated electrons did not result in substrate hydroxylation.
Figure 2.
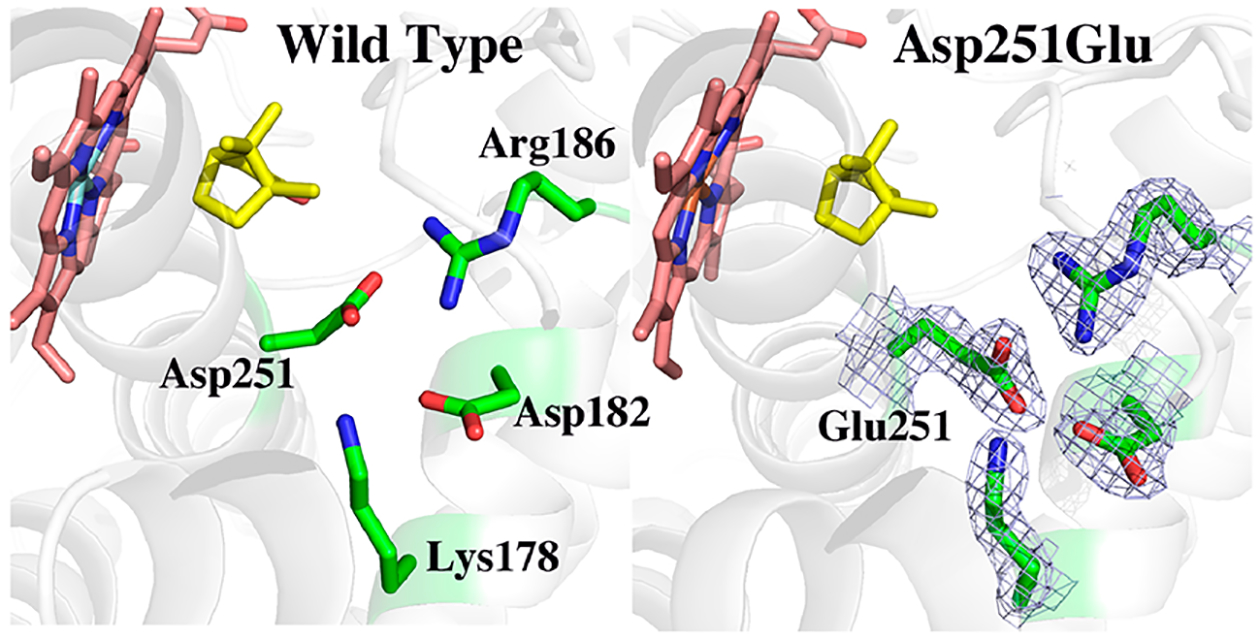
2Fo – Fc electron density map contoured at 1.0σ of the D251E P450cam mutant compared to the wild-type structure. The main new interaction in the mutant is a possible H-bond between Glu251 and Asp182.
In an attempt to compare the open form of the protein, we also crystallized the D251E mutant under the substrate-free condition previously published by Lee et al.20 for wild-type P450cam. Surprisingly, the protein crystallized in the closed conformation even in the absence of substrate (6WFL), showing features in the immediate vicinity of the mutation similar to those in the camphor-bound structure. However, in contrast with D251E-co where we co-crystallized the D251E mutant with camphor, the electron density of the substrate showed that the C5 sp3 carbon has additional density, indicating the presence of the product 5-exo-hydroxycamphor. This suggests that X-ray cryo-reduction resulted in substrate hydroxylation (Figure 3).
Figure 3.
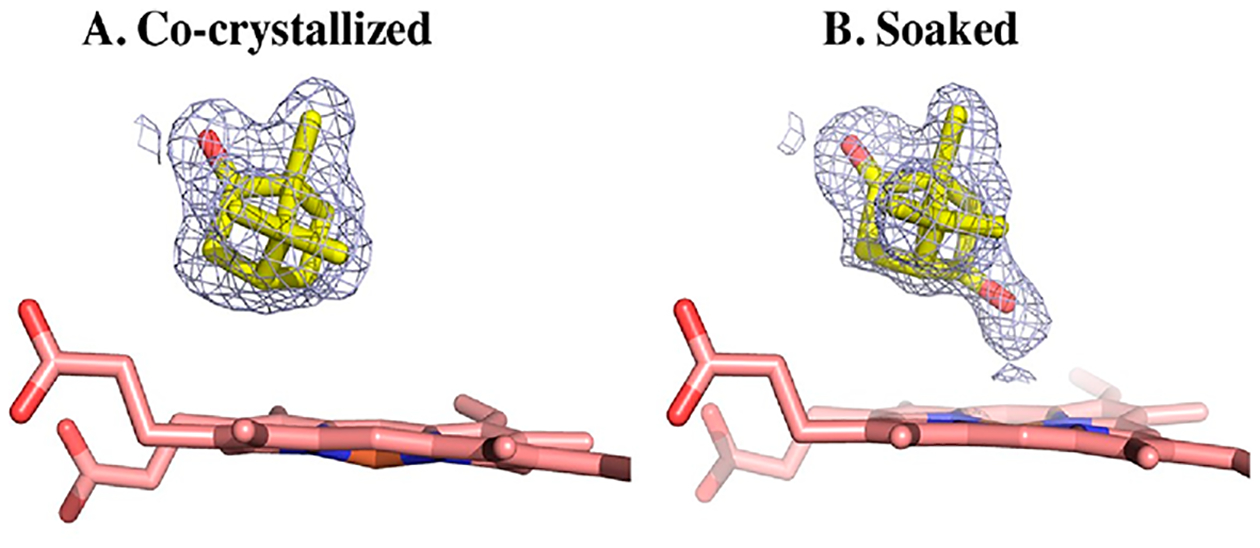
2Fo – Fc electron density maps contoured at 1.0σ of (A) the co-crystallized form (D251E-co) or (B) the camphor-soaked form (D251E-soak). Additional density near the iron center indicates that camphor is hydroxylated to 5-exo-hydroxy-camphor in the soaked conformation.
To address this distinctive feature, we sought to identify any significant difference between both D251E-co and D251E-soak structures using the Structure Comparison module in PHENIX. The results revealed an increase in the normalized backbone temperature factors of the D251E-soak structure around residues 118–125 (Figure S1), corresponding to the break of helices C and D and resulting in the formation of a solvent tunnel leading to the cavity where the functional waters sit next to T25231,32 (Figure S2). Moreover, Fo – Fc density around T252 suggests that this residue can also adopt the conformation observed in the oxy complex (Figure S3). There is, however, no significant difference in backbone conformation, and the root-mean-square deviation for Cα atoms is 0.13 Å.
Similarly, with CYP101D1, the structure of the D259E mutant (PDB entry 6WGW, 1.6 Å) indicated only modest local changes as compared to the WT enzyme. The region around Glu259 is flexible because the peptide carbonyl oxygen atom occupies two different positions. The residue corresponding to Asp182 in CYP101D1 is Asn184, which is 3.7 Å from Glu259, too far for an H-bonding interaction. As was observed with WT CYP101D1,9 the electron density in the mutant protein clearly shows product at the active site in both molecules in the asymmetric unit (Figure 4).
Figure 4.
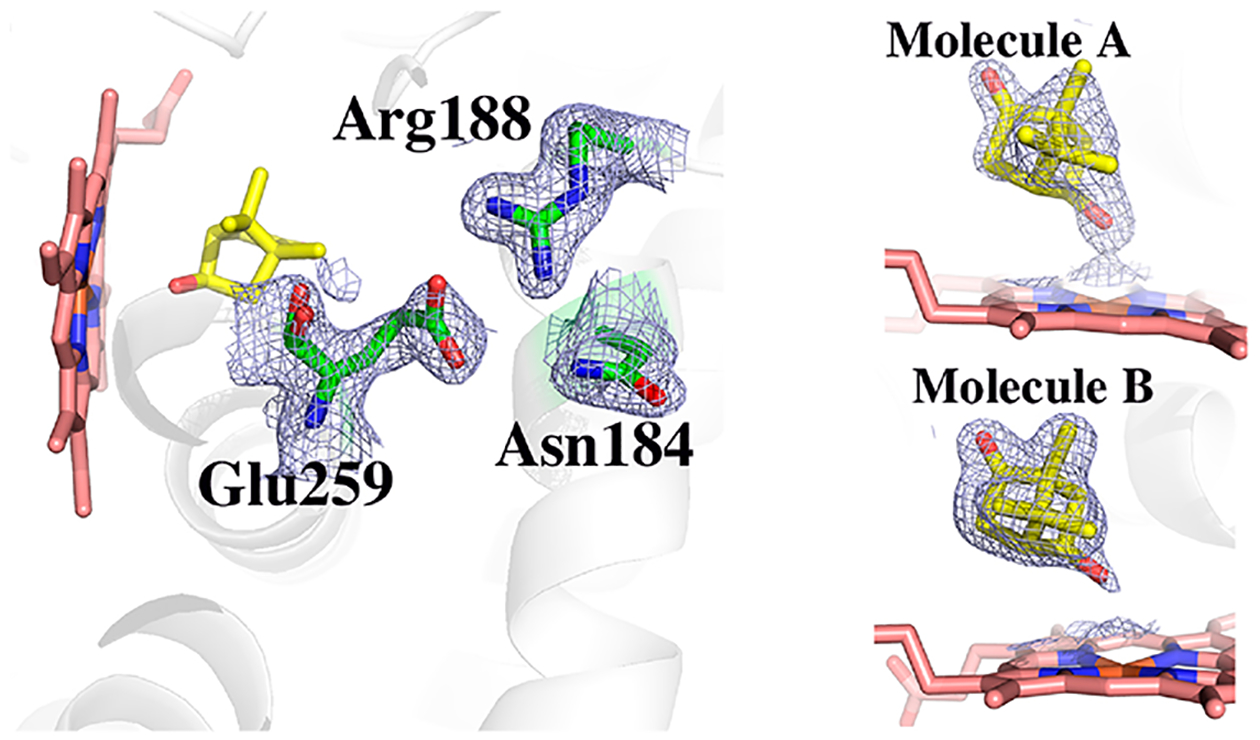
2Fo – Fc electron density map contoured at 1.0σ of the D259E CYP101D1 mutant. The backbone of Glu259 occupies two positions. Also shown is the 2Fo – Fc map in the active site of both molecules in the asymmetric unit. The extra lobe of density extending toward the heme iron clearly indicates that substrate hydroxylation occurred in the X-ray beam to give 5-exo-hydroxycamphor.
Enzyme Activity.
The results of steady-state kinetic assays including activities measured in D2O are listed in Table 1. The coupling efficiency is the ratio of moles of NADH oxidized to moles of product molecules formed. In a 100% coupled P450 system, one NADH molecule is oxidized per product molecule formed.
Table 1.
Steady-State Enzyme Activities
| % WT | couplinga (%) | KSIEb | |
|---|---|---|---|
| WT P450cam | 100 (864.9 ± 28. min−1) | 96 | 1.8 |
| D251E P450cam | NDc | NDc | NDc |
| D251E/K179G P450cam | 18 (158.1 ± 6.2 min−1) | 92 | 3.3 |
| WT CYP101D1 | 100 (798.2 ± 10.2 min−1) | 87 | 1.9 |
| D259E CYP101D1 | 28 (226.6 ± 7.5 min−1) | 83 | 6.0 |
Coupling = NADH oxidized/product formed.
KSIE is the kinetic solvent isotope effect.
Not detectable.
At neutral pH, D251E P450cam exhibits no enzyme activity while D259E CYP101D1 retains ≈28% of WT activity. The large KSIE in the CYP101D1 mutant indicates that some step in catalysis involving proton transfer is altered. Consistent with this possibility is the observation that the activity of the mutant relative to WT increases as the pH decreases: at pH 6.4, the D259E mutant exhibits ≈60% of WT activity, while at pH 8, the activity of the mutant is only ≈14% of WT activity.
To explore which step in the catalytic cycle has been altered, single-turnover kinetics for the first (Figure S4) and second ET (Figure S5) reactions were measured, and the results are listed in Table 2. Single-turnover kinetics show that D259E CYP101D1 slows the second ET step, reduction of the oxy complex. Under steady-state conditions, the first ET step is rate-limiting in P450cam.19 It thus appears that in the D259E mutant, the rate-limiting step has been changed to the second ET step. It also appears that the main reason for the lower activity in the D259E mutant is that proton transfer is slowed, as evidenced by the increased KSIE. This indicates that the second ET step is a proton-coupled electron transfer process and that in the wild-type enzyme, electron transfer and proton transfer are tightly coupled. Despite proton transfer now becoming limiting, the D259E mutant remains tightly coupled. Because the change from Asp to Glu is a conservative mutation, it is perhaps not too unexpected that the D259E mutant retains activity. What remains a puzzle is why the D251E P450cam is inactive. We next address this question.
Table 2.
Percent WT Rates and KSIEsa for the First and Second Electron Transfers
| % WT for first ET | % WT for second ET | KSIE for second ET | |
|---|---|---|---|
| WT P450cam | 100 (76.7 ± 5.1 s−1) | 100 (106.4 ± 6.1 s−1) | 1.7 |
| D251E P450cam | 36 (26.3 ± 0.2 s−1) | NDb | NDb |
| WT CYP101D1 | 100 (20.6 ± 0.6 s−1) | 100 (161.3 ± 13 s−1) | 1.9 |
| D259E CYP101D1 | 205 (44.5 ± 2.9 s−1) | 5 (8.4 ± 0.4 s−1) | 2.9 |
KSIE is the kinetic solvent isotope effect.
Not detectable.
Why D251E P450cam Is Inactive.
As shown in Figure 2, Glu251 and Asp182 are quite close in P450cam, suggesting a possible H-bond. H-Bonds are particularly strong when the H-bond donor and acceptor have the same or close to the same pKa.33 We thus considered the possibility that a particularly strong Glu251–Asp182 H-bond locks down Glu251 so it cannot participate in the proton relay process required for O2 activation. Computational modeling a shared proton by two carboxyls is challenging, but currently available software enables an estimate of the pKa of these groups. We used the H++ server (http://biophysics.cs.vt.edu/) and constant-pH calculations to estimate the pKa of Glu251 in the mutant and Asp251 in the WT protein, and the results are listed in Table 3. These results suggest that Glu251 is at least partially protonated at neutral pH.
Table 3.
Computed pKa Values
| H++ | constant pH | |
|---|---|---|
| P450cam Asp251 | <0 | <0 |
| P450cam Glu251 | 8.6 | 6.5 |
| CYP101D1 Asp259 | <0 | <0 |
| CYP101D1 Glu259 | 3.1 | <0 |
The stability of the Asp251–Asp182 and Gu251–Asp182 interaction was analyzed from 50000 snapshots derived from 10 separate 100 ns MD simulations. The distance measured is between the center of mass of the two carboxyl groups. Given that Glu251 is estimated to be at least partially to fully protonated at neutral pH, Glu251 was modeled as protonated. The resulting Glu251–Asp182 distance remains tightly distributed (Figure 5) and is consistent with a very stable H-bond. In WT P450cam, Asp251 never H-bonds with Asp182. The greater distance of Asp251 from Asp182 and the interactions of Asp251 with Arg186 and Lys178 are why Asp251 remains unprotonated.
Figure 5.
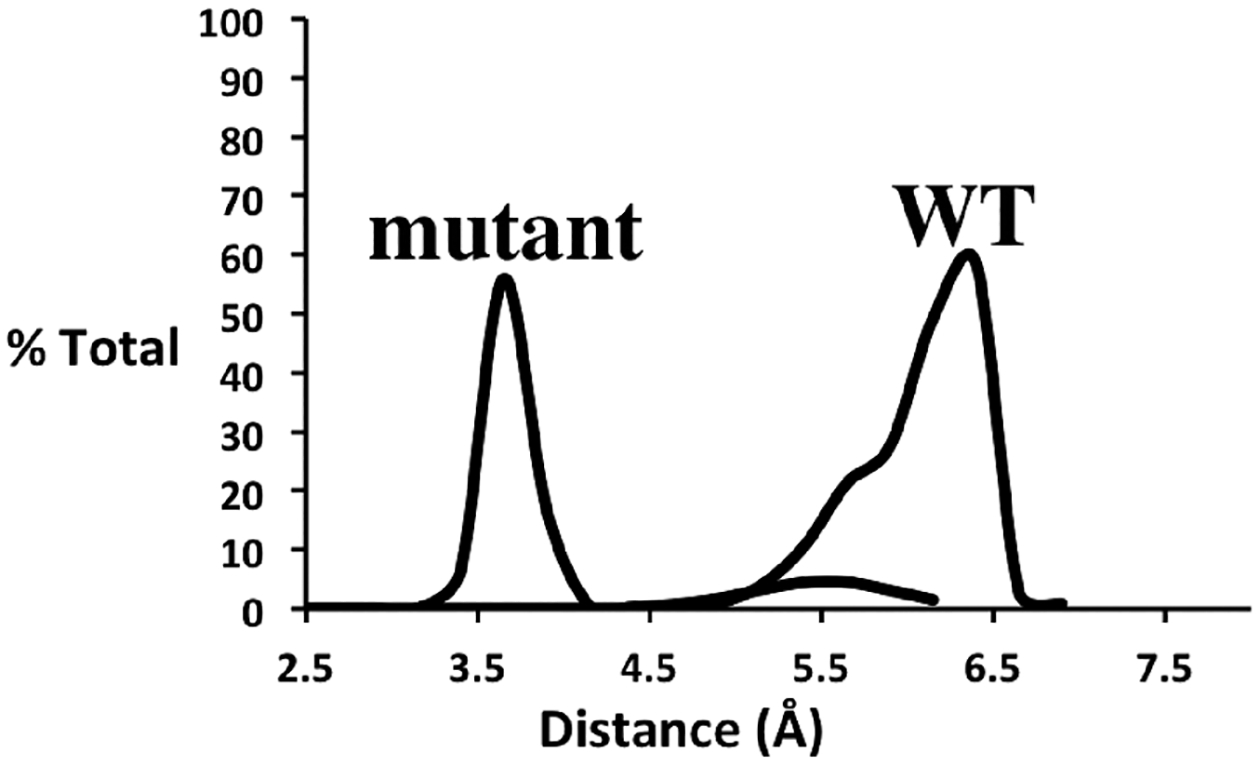
Distribution of distances between the carboxyl groups of Asp/Glu251 and Asp182 in the WT and the D251E mutant. The distance measured is from the center of mass of the two carboxyl O atoms of Asp182 and the center of mass of the two carboxyl O atoms in Asp/Glu251. The data were taken from 50000 snapshots obtained from ten 100 ns MD simulations.
If a particularly strong Glu251–Asp182 H-bond is responsible for the loss of activity, then one would predict that the binding of Pdx might not shift the mutant P450cam more toward the open state. The high-spin closed state of P450cam exhibits an ultraviolet–visible (UV–vis) Soret maximum near 390 nm, while this band shifts to ≈420 nm in the low-spin open state. It was demonstrated some time ago that Pdx binding shifts P450cam more toward the low-spin/open conformation,34 which is consistent with the crystal structures. As shown in Figure 6, Pdx is unable to shift the D251E UV–vis spectrum toward the low-spin state, unlike the case for WT P450cam. These results are consistent with the MD results and support the hypothesis that the D251E mutant is inactive because Pdx binding is unable to release Glu251 from a particularly strong set of H-bonding interactions. Furthermore, crystallization of D251E in a relaxed closed form in the absence of substrate suggests that the E251–D182 H-bond is strong enough to stabilize the closed conformation.
Figure 6.
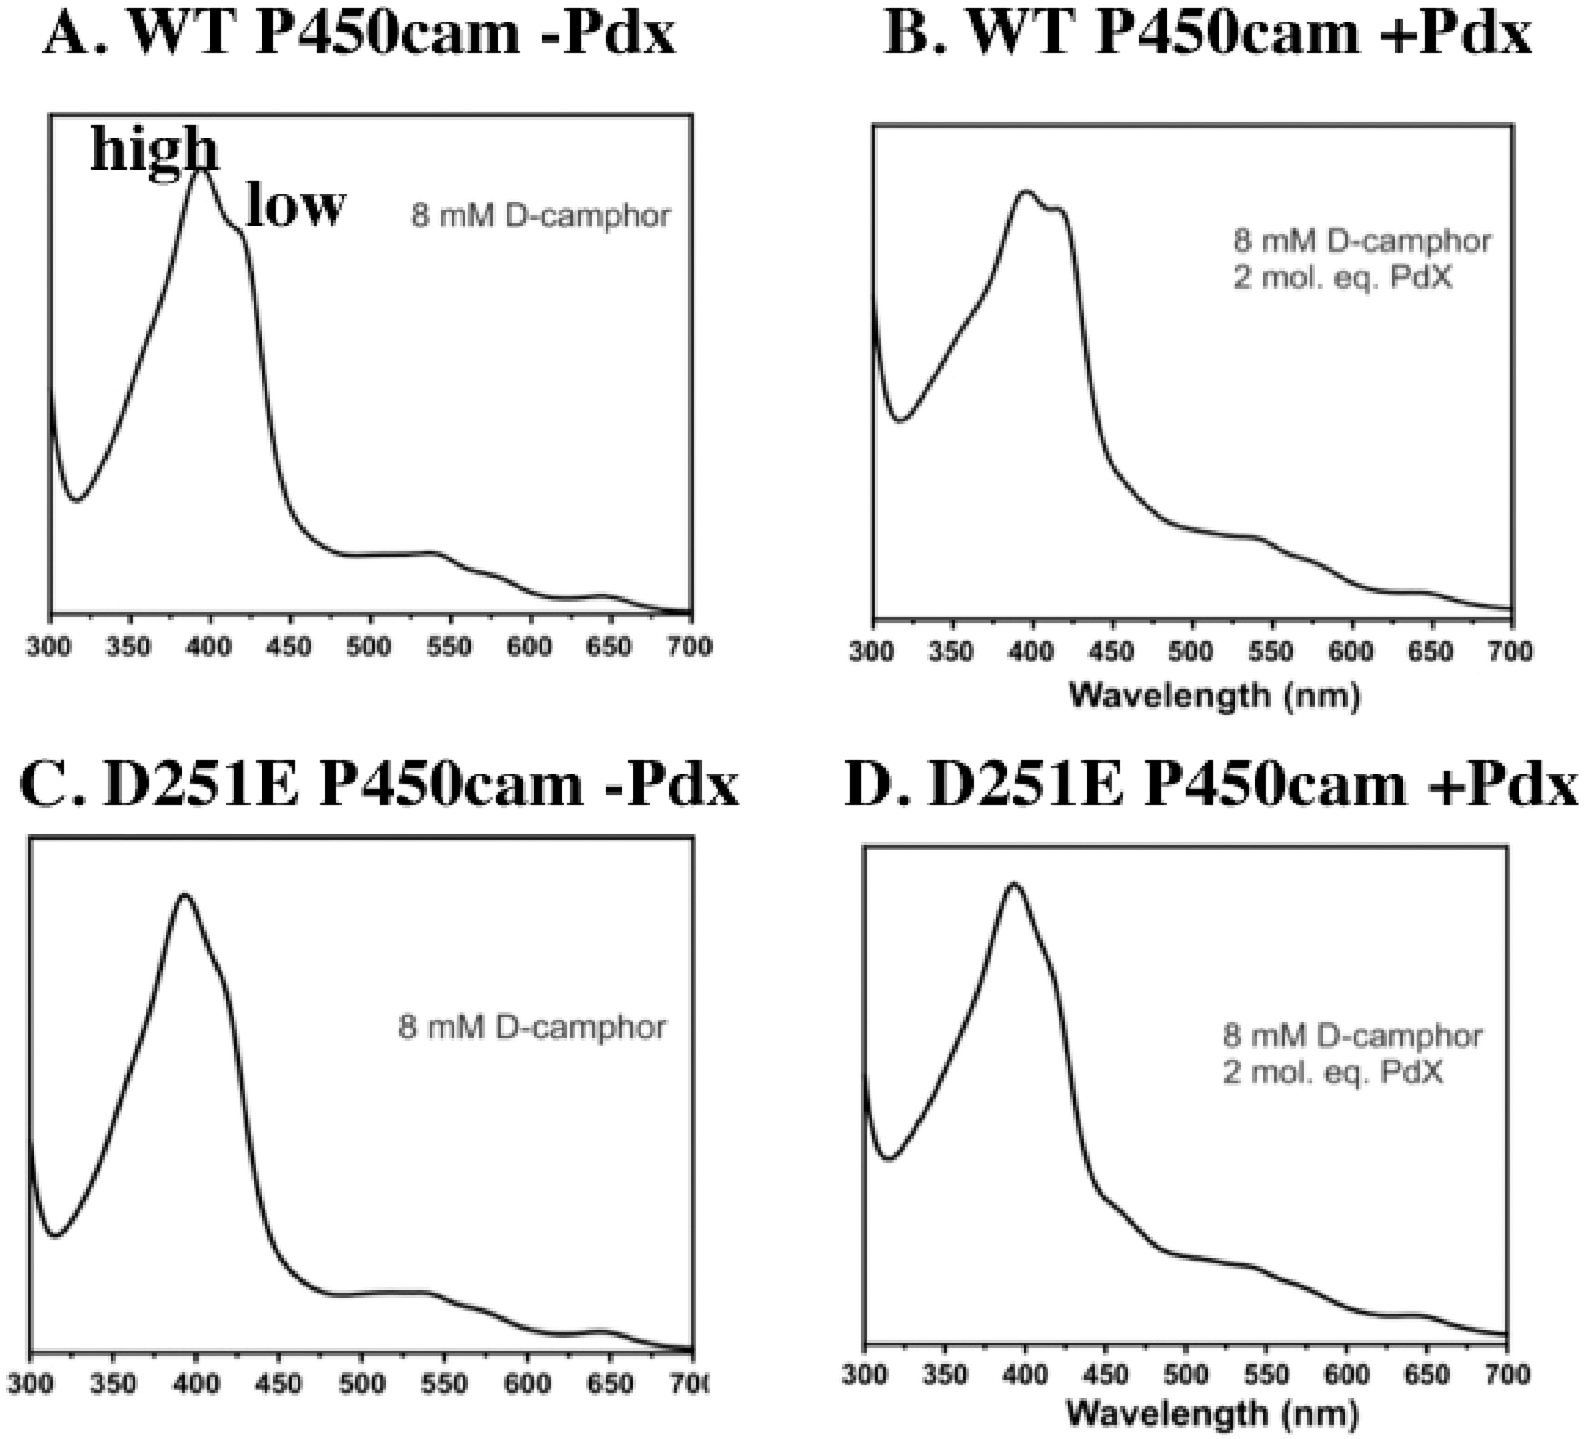
Effect of Pdx on the P450cam spin state. In a large excess of camphor, (A) P450cam is not 100% high-spin as evidenced by the low-spin shoulder to a low-affinity allosteric site.26 The addition of Pdx (B) increases the fraction of the low-spin form owing to Pdx shifting P450cam more toward the open state. With the D251E mutant, the addition of Pdx has no effect on the fraction of the low-spin form (C and D), indicating that Pdx is unable to shift the mutant more toward the open state near 420 nm. This is due to the well-known shift of P450cam back toward the low-spin form at high camphor concentrations35–38 owing to possible binding of camphor to a second site well removed from the active site.
We also analyzed the activity of the D251E/K178G double mutant. Lys178 is a Gly in CYP101D1 and together with Arg186 H-bonds with Asp251. We hypothesized that removal of Lys178 to mimic more closely CYP101D1 might free Glu251 to serve its potential role in proton transfer. Indeed, as shown in Table 1, the D251E/K178G mutant exhibits about 18% of WT activity, is tightly coupled, and has an increased KSIE.
DISCUSSION
We had anticipated that changing the highly conserved Asp on the I helix to Glu in a cytochome P450 would alter but not eliminate enzymatic activity. This was true for CYP101D1 but not for P450cam. Our results support the conclusion that the D251E P450cam mutant is inactive owing to strong local H-bonding interactions not present in WT P450cam that lock the mutant into a closed state. As a result, Pdx binding cannot free Glu251 to serve its role in the proton delivery required for O2 activation. Changing Lys178 breaks one of the H-bonding interactions with Glu251, resulting in a recovery of activity. These results support the proposal that the effector role of Pdx is to free the proton relay network required for O2 activation.13 Given that many other P450s can use non-native redox partners, P450cam appears to be unusual in having such a strict requirement for redox partner binding-induced changes to an active more open conformational state. Even so, many P450s have the Asp251 homologue, either Asp or Glu, and even those that do not must have a similar mechanism for shuttling proteins to the iron-linked dioxygen. Independent of the specifics, our results support the view that P450s require flexibility to satisfy the structural dynamics required for delivering solvent protons deep into the active site.
An unexpected outcome of this investigation was the change in the rate-limiting step to the second ET process and the large KSIE in the D259E CYP101D1 mutant. A mutant in which the rate-limiting step of the reaction is altered but the overall mechanism remains the same could provide the potential for studying intermediates not accessible in the wild-type enzyme. This appears to be the case with the D259E CYP101D1 mutant. This mutant retains a substantial amount of highly coupled activity, and the decrease in activity is due to a much slower second ET step, reduction of the oxy complex, which now is the rate-limiting step under steady-state conditions rather than the first ET reaction. Because the KSIE increases in the mutant, the decrease in the second ET reaction is due to proton transfer becoming limiting. This further indicates that the second ET reaction is a proton-coupled ET process. These results are similar to what was found with the D251N P450cam mutant.7,8 Compared to those of the WT enzyme, activity decreased and the KSIE increased. However, the D259E CYP101D1 mutant provides some distinct advantages because its activity is ≈30% of that of the wild type and is coupled, while the D251N P450cam mutant exhibits <1% NADH oxidation rates at neutral pH.7,8 The D259E mutation thus opens a window on a step of the P450 reaction cycle that has been difficult to study and provides the possibility of trapping intermediates that accompany proton transfer that cannot be accessed with the wild-type enzyme.
Supplementary Material
ACKNOWLEDGMENTS
The authors thank the Stanford Synchrotron Radiation Lab beamline staff for their support during remote data collection and Dr. Christine Hardy for valuable input.
Funding
This work was supported by National Institutes of Health Grant GM131920.
ABBREVIATIONS
- PdX
Fe2S2 ferrredoxin that supports P450cam catalysis
- ArX
Fe2S2 ferrredoxin that supports CYP101D1 catalysis
- ET
electron transfer
Footnotes
Supporting Information
The Supporting Information is available free of charge at https://pubs.acs.org/doi/10.1021/acs.biochem.0c00329.
Figures S1–S7 and Table S1 (PDF)
Accession Codes
Coordinates and structure factors were deposited in the Protein Data Bank as entries 6WFL (D251E P450cam soaked), 6WE6 (D251E P450cam co-crystallized), and 6WGW (D259E CYP101D1).
Complete contact information is available at: https://pubs.acs.org/10.1021/acs.biochem.0c00329
The authors declare no competing financial interest.
Contributor Information
José A. Amaya, Departments of Molecular Biology and Biochemistry, Pharmaceutical Sciences, and Chemistry, University of California, Irvine, California 92697-3900, United States
Dipanwita Batabyal, Departments of Molecular Biology and Biochemistry, Pharmaceutical Sciences, and Chemistry, University of California, Irvine, California 92697-3900, United States.
Thomas L. Poulos, Departments of Molecular Biology and Biochemistry, Pharmaceutical Sciences, and Chemistry, University of California, Irvine, California 92697-3900, United States.
REFERENCES
- (1).Poulos TL (2014) Heme enzyme structure and function. Chem. Rev 114, 3919–3962. [DOI] [PMC free article] [PubMed] [Google Scholar]
- (2).Gunsalus IC, and Wagner GC (1978) Bacterial P-450cam methylene monooxygenase components: cytochrome m, putidaredoxin, and putidaredoxin reductase. Methods Enzymol 52, 166–188. [DOI] [PubMed] [Google Scholar]
- (3).Haniu M, Armes LG, Tanaka M, Yasunobu KT, Shastry BS, Wagner GC, and Gunsalus IC (1982) The primary structure of the monoxygenase cytochrome P450CAM. Biochem. Biophys. Res. Commun 105, 889–894. [DOI] [PubMed] [Google Scholar]
- (4).Katagiri M, Ganguli BN, and Gunsalus IC (1968) A soluble cytochrome P-450 functional in methylene hydroxylation. J. Biol. Chem 243, 3543–3546. [PubMed] [Google Scholar]
- (5).Poulos TL, Finzel BC, Gunsalus IC, Wagner GC, and Kraut J (1985) The 2.6-A crystal structure of Pseudomonas putida cytochrome P-450. J. Biol. Chem 260, 16122–16130. [PubMed] [Google Scholar]
- (6).Poulos TL, Finzel BC, and Howard AJ (1987) High-resolution crystal structure of cytochrome P450cam. J. Mol. Biol 195, 687–700. [DOI] [PubMed] [Google Scholar]
- (7).Gerber NC, and Sligar SG (1992) Catalytic mechanism of cytochrome P-450: evidence for a distal charge relay. J. Am. Chem. Soc 114, 8742–8743. [Google Scholar]
- (8).Gerber NC, and Sligar SG (1994) A role for Asp-251 in cytochrome P-450cam oxygen activation. J. Biol. Chem 269, 4260–4266. [PubMed] [Google Scholar]
- (9).Batabyal D, and Poulos TL (2013) Crystal structures and functional characterization of wild-type CYP101D1 and its active site mutants. Biochemistry 52, 8898–8906. [DOI] [PMC free article] [PubMed] [Google Scholar]
- (10).Stok JE, Yamada S, Farlow AJ, Slessor KE, and De Voss JJ (2013) Cytochrome P450(cin) (CYP176A1) D241N: investigating the role of the conserved acid in the active site of cytochrome P450s. Biochim. Biophys. Acta, Proteins Proteomics 1834, 688–696. [DOI] [PubMed] [Google Scholar]
- (11).Yeom H, and Sligar SG (1997) Oxygen activation by cytochrome P450BM-3: effects of mutating an active site acidic residue. Arch. Biochem. Biophys 337, 209–216. [DOI] [PubMed] [Google Scholar]
- (12).Hiruma Y, Hass MA, Kikui Y, Liu WM, Olmez B, Skinner SP, Blok A, Kloosterman A, Koteishi H, Lohr F, Schwalbe H, Nojiri M, and Ubbink M (2013) The structure of the cytochrome p450cam-putidaredoxin complex determined by paramagnetic NMR spectroscopy and crystallography. J. Mol. Biol 425, 4353–4365. [DOI] [PubMed] [Google Scholar]
- (13).Tripathi S, Li H, and Poulos TL (2013) Structural basis for effector control and redox partner recognition in cytochrome P450. Science 340, 1227–1230. [DOI] [PubMed] [Google Scholar]
- (14).Lipscomb JD, Sligar SG, Namtvedt MJ, and Gunsalus IC (1976) Autooxidation and hydroxylation reactions of oxygenated cytochrome P-450cam. J. Biol. Chem 251, 1116–1124. [PubMed] [Google Scholar]
- (15).Sevrioukova IF, Garcia C, Li H, Bhaskar B, and Poulos TL (2003) Crystal structure of putidaredoxin, the [2Fe-2S] component of the P450cam monooxygenase system from Pseudomonas putida. J. Mol. Biol 333, 377–392. [DOI] [PubMed] [Google Scholar]
- (16).Yoshioka S, Tosha T, Takahashi S, Ishimori K, Hori H, and Morishima I (2002) Roles of the proximal hydrogen bonding network in cytochrome P450cam-catalyzed oxygenation. J. Am. Chem. Soc 124, 14571–14579. [DOI] [PubMed] [Google Scholar]
- (17).Yang W, Bell SG, Wang H, Zhou W, Hoskins N, Dale A, Bartlam M, Wong LL, and Rao Z (2010) Molecular characterization of a class I P450 electron transfer system from Novosphingobium aromaticivorans DSM12444. J. Biol. Chem 285, 27372–27384. [DOI] [PMC free article] [PubMed] [Google Scholar]
- (18).Bell SG, Dale A, Rees NH, and Wong LL (2010) A cytochrome P450 class I electron transfer system from Novosphingobium aromaticivorans. Appl. Microbiol. Biotechnol 86, 163–175. [DOI] [PubMed] [Google Scholar]
- (19).Kuznetsov VY, Poulos TL, and Sevrioukova IF (2006) Putidaredoxin-to-cytochrome P450cam electron transfer: differences between the two reductive steps required for catalysis. Biochemistry 45, 11934–11944. [DOI] [PMC free article] [PubMed] [Google Scholar]
- (20).Lee YT, Wilson RF, Rupniewski I, and Goodin DB (2010) P450cam visits an open conformation in the absence of substrate. Biochemistry 49, 3412–3419. [DOI] [PMC free article] [PubMed] [Google Scholar]
- (21).McCoy AJ (2007) Solving structures of protein complexes by molecular replacement with Phaser. Acta Crystallogr., Sect. D: Biol. Crystallogr 63, 32–41. [DOI] [PMC free article] [PubMed] [Google Scholar]
- (22).McCoy AJ, Grosse-Kunstleve RW, Adams PD, Winn MD, Storoni LC, and Read RJ (2007) Phaser crystallographic software. J. Appl. Crystallogr 40, 658–674. [DOI] [PMC free article] [PubMed] [Google Scholar]
- (23).Adams PD, Afonine PV, Bunkoczi G, Chen VB, Echols N, Headd JJ, Hung LW, Jain S, Kapral GJ, Grosse Kunstleve RW, McCoy AJ, Moriarty NW, Oeffner RD, Read RJ, Richardson DC, Richardson JS, Terwilliger TC, and Zwart PH (2011) The Phenix software for automated determination of macromolecular structures. Methods 55, 94–106. [DOI] [PMC free article] [PubMed] [Google Scholar]
- (24).Echols N, Grosse-Kunstleve RW, Afonine PV, Bunkoczi G, Chen VB, Headd JJ, McCoy AJ, Moriarty NW, Read RJ, Richardson DC, Richardson JS, Terwilliger TC, and Adams PD (2012) Graphical tools for macromolecular crystallography in PHENIX. J. Appl. Crystallogr 45, 581–586. [DOI] [PMC free article] [PubMed] [Google Scholar]
- (25).Sehnal D, Svobodova Varekova R, Berka K, Pravda L, Navratilova V, Banas P, Ionescu CM, Otyepka M, and Koca J (2013) MOLE 2.0: advanced approach for analysis of biomacromolecular channels. J. Cheminf 5, 39. [DOI] [PMC free article] [PubMed] [Google Scholar]
- (26).Follmer AH, Mahomed M, Goodin DB, and Poulos TL (2018) Substrate-Dependent Allosteric Regulation in Cytochrome P450cam (CYP101A1). J. Am. Chem. Soc 140, 16222–16228. [DOI] [PubMed] [Google Scholar]
- (27).Hollingsworth SA, and Poulos TL (2015) Molecular dynamics of the P450cam-Pdx complex reveals complex stability and novel interface contacts. Protein Sci 24, 49–57. [DOI] [PMC free article] [PubMed] [Google Scholar]
- (28).Roe DR, and Cheatham TE 3rd (2013) PTRAJ and CPPTRAJ: Software for Processing and Analysis of Molecular Dynamics Trajectory Data. J. Chem. Theory Comput 9, 3084–3095. [DOI] [PubMed] [Google Scholar]
- (29).Kim MO, Blachly PG, Kaus JW, and McCammon JA (2015) Protocols utilizing constant pH molecular dynamics to compute pH-dependent binding free energies. J. Phys. Chem. B 119, 861–872. [DOI] [PMC free article] [PubMed] [Google Scholar]
- (30).Simonson T, Carlsson J, and Case DA (2004) Proton binding to proteins: pK(a) calculations with explicit and implicit solvent models. J. Am. Chem. Soc 126, 4167–4180. [DOI] [PubMed] [Google Scholar]
- (31).Nagano S, and Poulos TL (2005) Crystallographic Study on the Dioxygen Complex of Wild-type and Mutant Cytochrome P450cam: Implications for THE Dioxygen Activation Mechanism. J. Biol. Chem 280, 31659–31663. [DOI] [PubMed] [Google Scholar]
- (32).Schlichting I, Berendzen J, Chu K, Stock AM, Maves SA, Benson DE, Sweet RM, Ringe D, Petsko GA, and Sligar SG (2000) The catalytic pathway of cytochrome p450cam at atomic resolution. Science 287, 1615–1622. [DOI] [PubMed] [Google Scholar]
- (33).Gilli P, Pretto L, Bertolasi V, and Gilli G (2009) Predicting Hydrogen-Bond Strengths from Acid–Base Molecular Properties. The pKa Slide Rule: Toward the Solution of a Long-Lasting Problem. Acc. Chem. Res 42, 33–44. [DOI] [PubMed] [Google Scholar]
- (34).Unno M, Christian JF, Benson DE, Gerber NC, Sligar SG, and Champion PM (1997) Resonance Raman Investigations of Cytochrome P450 camComplexed with Putidaredoxin. J. Am. Chem. Soc 119, 6614–6620. [Google Scholar]
- (35).Lange R, Bonfils C, and Debey P (1977) The low-spin/high-spin transition equilibrium of camphor-bound cytochrome P-450. Effects of medium and temperature on equilibrium data. Eur. J. Biochem 79, 623–628. [DOI] [PubMed] [Google Scholar]
- (36).Lipscomb JD (1980) Electron paramagnetic resonance detectable states of cytochrome P-450cam. Biochemistry 19, 3590–599. [DOI] [PubMed] [Google Scholar]
- (37).Marden MC, and Hui Bon Hoa G (1987) P-450 binding to substrates camphor and linalool versus pressure. Arch. Biochem. Biophys 253, 100–107. [DOI] [PubMed] [Google Scholar]
- (38).Narasimhulu S, Havran LM, Axelsen PH, and Winkler JD (1998) Interactions of substrate and product with cytochrome P450: P4502B4 versus P450cam. Arch. Biochem. Biophys 353, 228–238. [DOI] [PubMed] [Google Scholar]
Associated Data
This section collects any data citations, data availability statements, or supplementary materials included in this article.