

ABSTRACT
Accumulated oncometabolites in the tumor microenvironment (TME) suppresses the metabolism, expansion, and function of T cells. Immunosuppressive TME also impeded Chimeric Antigen Receptor (CAR)-T cells mediated cytotoxicity since CAR-T cells had to adapt the in vivo metabolic characteristics with high levels of oncometabolites. We screened oncometabolites for the inhibition of glucose uptake in CD8 + T cells and found Kynurenine (Kyn) showed the strongest inhibiting effect on glucose uptake. In vitro experiments showed that 120 μM Kyn treatment in CD8 + T cells resulted in inhibiting the expansion of CD8 + T cells, decreasing the production of granzyme B and interferon-γ. CAR-T cells mediated cytotoxicity was also impaired by the high Kyn treatment from killing assay. We then explored the anti-tumor effect of Kynureninase (KYNU) modified CAR-T cells through catabolism o oncometabolites Kyn. KYNU over-expression (OE) CAR-T cells showed a superior killing effect against cancer cells even in the immunosuppressive TME with high Kyn levels. In vivo experiments confirmed KYNU-OE CAR-T cells showed an excellent anti-tumor effect in a TME with high Kyn levels since it improved the survival of mice bearing NALM6 cancer cells and NALM6-IDO1 cancer cells. The KYNU-modified CAR-T cells displayed distinct phenotypes related to the expansion, function, and memory differentiation status of CAR-T cells. This study explores an immunotherapy strategy for patients with alterations in Kyn metabolism. KYNU-OE CAR-T cells take advantage of Kyn catabolism to improve anti-tumor activity in the metabolic immunosuppressive TME with high Kyn.
KEYWORDS: Chimeric antigen receptor (CAR), T cell therapy, immunotherapy, oncometabolite, Kynurenine
Chimeric Antigen Receptor (CAR) T cells therapy is an important therapeutic strategy for refractory hematopoietic malignancies.1 CAR acts as a synthetic supraphysiological signaling molecule to initiate signal transduction modules of the T cell receptor that enhances antigen recognition and cytotoxicity.2 Different strategy was developed via optimization of costimulatory factors and coupling molecular to improve the cytotoxicity effect.3 Owing to CAR-T’s impressive clinical outcomes, the relapsed or refractory leukemia and lymphoma patients have high expectations of this therapy.4 However, only partial patients achieve complete responses during clinical practice. Some patients who achieve remission with anti-CD19 CAR-T cells develop resistance and experience disease relapse within 1 y of treatment.5
The immunosuppressive tumor microenvironment (TME) and cellular characteristics of CAR-T cells are two important factors that affected clinical response to CAR-T therapy.6 Many researchers have highlighted the CAR-T cell characteristics of heightened cellular longevity, increased self-renewal and proliferation capacity in determining the efficacy of CAR-T cell therapy.7 However, the phenotypic characteristics of T cells are affected by the overall metabolic TME.8 Different subsets and functional status of lymphocytes have different metabolic pathways and fates.9 The expression of indoleamine 2,3-dioxygenase in cancer cells results in tryptophan depletion and T cell dysfunction.10 Tumor-derived lactate can disrupt aerobic glycolysis and suppress T cell function.11 Tumor-imposed glucose restriction directly impedes cytokine production in lymphocytes.12 Accumulated oncometabolites were not only associated with tumorigenesis, progression, and metastasis, but could also suppress the expansion and function of T cells and impair the metabolic adaption of T lymphocytes in the immunosuppressive TME. Modulation of T cell metabolism was proposed as a potential therapeutic approach to enhance immune responses in immunotherapy since immunonutrition plays key roles in regulating CD8+ expansion, function, longevity and differentiation.13
During the last two decades, emerging evidence has demonstrated that there are accumulated oncometabolites involved in the metastasis of cancer cells and in the worsening of patients’ clinical outcomes.14,15 These oncometabolites are produced and secreted by cancer and surrounding cells as a consequence of mutations in oncogenes or alterations in enzyme/gene expression signature. However, the oncometabolite generally accumulate in the body and sustains an invasive neoplastic phenotype or therapy-resistant TME. In the present study, we evaluated the effects of oncometabolite on the CD8 + T cell metabolism and phenotype. Then, we explored the anti-tumor effectiveness of modified CAR-T cells by reprogramming metabolism. We aimed to take advantage of catabolism of oncometabolite to enhance antitumor effect in the immunosuppressive TME through modification of CAR-T cells.
Materials and methods
Study approval
Normal healthy donors were enrolled for peripheral blood collection and provided written informed consent for research protocols approved by the Human Research Ethics Board of the Shanghai Jiao Tong University Affiliated Sixth People’s Hospital. Blood sample collection was conducted in accordance with the Declaration of Helsinki. In vivo mouse experiments were approved by the Animal Welfare Committee of Shanghai Jiao Tong University Affiliated Sixth People Hospital, and they were performed in the Laboratory Animal Center according to the Institutional Animal Care and Use Committee.
Plasmid construction
The cassette vector encoding the CD19-specific scFv (FMC63), the CD8a transmembrane domain, the CD28 intracellular domain and CD3ζ chain was cloned into the lentivirus plasmid backbone following promoter EF1α. scFv FMC63 was previously identified and used in clinical studies.16 FLAG-tag was included for the detection of CAR expression. We then generated vector cassettes encoding the CAR in combination with the KYNU cDNA (accession: CCDS33299.1) using a T2A sequence peptide. Vectors encoding the fusion protein green fluorescent protein (GFP) and luciferase (GL) were used for the production of NALM6-GL cells as previously described.17 Full-length human IDO1 (accession: CCDS47847.1) was PCR amplified, sequenced, and cloned into the lentivirus vector and used for the production of NALM6-IDO1 cells with accumulation of Kyn.
Cell lines
The tumor cell line NALM-6 was purchased from the American Type Culture Collection and grown in 90% RPMI 1640 medium + 10% fetal bovine serum (FBS) + 100 U/mL penicillin–streptomycin. Lentiviruses with plasmids encoding GFP and luciferase-containing plasmids were used to produce NALM6-GL cells through spinoculation (1900 g, 60 minutes at 37°C) in the presence of 4 mg/mL polybrene. Lentiviruses with plasmids encoding IDO1 were used to produce NALM6-IDO1 cells. HEK293T cells were cultured in DMEM with 10% FBS and 100 U/mL penicillin–streptomycin. All cell lines were tested routinely for mycoplasma contamination using the mycoplasma detection kit according to the manufacturer’s instructions.
Blood samples and CD8 + T cell isolation
Peripheral blood mononuclear cells were isolated by centrifugation using a Ficoll–Histopaque (Sigma) density cushion according to the manufacturer’s instructions. CD8 + T cells were negatively selected using a MACS CD8 + T Cell Isolation Kit (Miltenyi Biotec, Bergisch Gladbach, Germany). Purified CD8 + T cells were activated using microbeads coated with anti-human CD3 and CD28 antibodies at a 1:2 bead: cell ratio. Fresh RPMI-1640 medium supplemented with 10% heat-inactivated FBS, 30 IU/ml recombinant human IL-2 (PeproTech), 10 mM HEPES, 2 mM glutamine, and 1% penicillin/streptomycin was used for the culture of CD8 + T cells. For the expansion of T cells, half of the cell supernatant was replaced by fresh culture media every 2 d, and they were maintained between 0.5 × 101 and 3 × 10⁶ cells/mL.
Generation of CAR-T cells
CD8 + T cells from healthy donors (5 × 10⁶/well) were stimulated with anti-human CD3 and CD28 antibodies in a 24-well plate in culturing medium. After 48 hours, 1 mL of 3 × 10⁶ cells was transferred to another plate. Lentivirus transduction was then performed by the addition of 500 μL of virus per well followed by spinoculation (1900 g, 60 minutes at room temperature) in the presence of 4 mg/mL polybrene. A second transduction was conducted after 16 hours, replacing half of the cell supernatant with freshly obtained virus (1 mL). Six hours after the second treatment, half of the cell supernatant was replaced by fresh culture media again. CAR expression efficiency was measured by flow cytometry using FLAG-tag after culturing for more than 72 hours.
Knockout of KYNU in CAR-T cells
We used a CRISPR/CAS9-based ribonucleoprotein (RNP) complex for the knockout (KO) of KYNU in CAR-T cells. Stocked Invitrogen TrueCut Cas9 v2 was provided by Thermo Fisher and diluted to 5 μg/μL. The 5 sgRNA sequences for KYNU knockout were designed using CRISPick (https://portals.broadinstitute.org/gppx/crispick/public). The sgRNA for the KO of KYNU was preferred as AATGCCACCCAACGGATGAG based on preliminary experiments. tracrRNA and crRNA were synthesized by Genscript Biotech (Nanjing, China). The gRNA was formed after mixing tracrRNA and corresponding crRNA at a ratio of 1:1 and undergoing an annealing procedure. The RNP complex was formed by mixing diluted Cas9 protein and sgRNA at a ratio of 1:1. The RNP complex was electrically shocked with a program of 1,600 V, 10 ms, and 3 pulses, and T cells were prepared at a density of 5 × 10⁶ cells per 100 μL tip reaction (Neon Transfection System Kits). The cells were immediately transferred into prewarmed RPMI-1640 media with 5% FBS and recombinant human IL-2 (30 U/mL) for continuing culture. Five days later, the genomic DNA of KYNU-KO CAR-T cells was extracted with QuickExtract Buffer according to the manufacturers’ recommendations. One microliter of genomic DNA was used for a 50 µL PCR volume that contained DreamTaq Green PCR Master Mix (Thermo Fisher Scientific), primer pairs and nuclease-free water, followed by 36 cycles. Then, 200 ng of PCR products were added to a 19 µL heteroduplex reaction consisting of incubation at 95°C for 5 min in a thermocycler followed by an annealing process. Heteroduplex digestion was processed by adding 1 µL of T7 endonuclease I (NEB) and incubating at 37°C for 60 minutes. All 20 µL volumes of digested heteroduplexes were run on a 2% agarose gel.
mRNA expression analysis
CAR-T cells and control T cells were lysed in TRIzol reagents (Life Technologies) and frozen at −80°C. Total RNA extraction was performed according to the manufacturer’s instructions. Reverse transcription of cDNA was performed using M-Mulv enzyme (NEB), and qPCE was performed using 2 × SYBR Green RT-PCR Mix. Expression analysis of mRNA was normalized to β-actin, and data were analyzed by applying the 2^(-dCt) calculation method.
Western blot analysis
T-cell lysates were resuspended in RIPA buffer. All lysates were separated in 10% SDS-PAGE gels and transferred to polyvinylidene difluoride membranes. Blots were probed with a human CD3ζ Ab (Santa Cruz Biotechnology) or a KYNU Ab (Abcam) diluted 1:1,000 in TBS-Tween/5% skim milk. Membranes were then incubated with an HRP-conjugated goat a-mouse or a goat a-rabbit IgG (Santa Cruz Biotechnology) at a dilution of 1:5000 and imaged using the ECL Substrate Kit on a Tanno bioimaging system according to the manufacturer’s instructions.
Determination of intracellular Kyn concentration
NALM6 cells and NALM6-IDO1 cells were cultured for 48 hours. Cells were counted and 1 million living cells were used extraction of Kyn using 800 μL of 80% (vol/vol) methanol (precooled to −80°C) on dry ice for 30 minutes twice. The metabolite-containing supernatant was dried and analyzed using an Agilent 6490- QQQ LC/MS System. Selective reaction monitoring was used for the qualitative and quantitative analysis of intracellular Kyn after referencing the standard Kyn.
In vitro functional assays
CAR-T cells were incubated with NALM6-GL cells for in vitro functional assays. Briefly, 5 × 10⁴ cancer cells/well (target) were seeded into 96-well plates, and different numbers of CAR-T cells or mock T cells (target) were added to form serial dilutions of effector cells to target cell (E:T) ratios of 1:1, 1:2, 1:4, and 1:10. All cells were cultured in RPMI 1640 + 10% FBS+ 30 ng/mL rhIL2 (PeproTech) + 100 U/mL penicillin–streptomycin. After coculture for 24 hours, all cells were monitored by adding 10 µl/well of 150 µg/ml D-luciferin (potassium salt) (Thermo Fisher). Background luminescence was negligible (<1% of the signal from wells containing only target cells). The percent viability (%) was calculated as experimental signal/maximal signal× 100, and the percent lysis was equal to 100–percent viability.
Xenogeneic models
Male 6- to 8-week-old NSG mice (NOD-PrkdcscidIl2rgem1/Smoc) were maintained in specific pathogen-free (SPF)-grade cages and were provided autoclaved food and water. All mice received intravenous tail injection of 1 × 10⁶ NALM6 cells. Three days after tumor engraftment, mice received intravenous tail injection of 5 × 10⁶ mock T cells or CAR-T cells in RPMI 1640 media (without FBS). No exogenous cytokines were administered to the mice. Peripheral blood was collected from 3 to 5 biological replicate samples from each group at day 14 after T cell adaptation therapy. Body weights were measured every other day. Survival and disease status were followed after CAR-T cell treatment, and mice were euthanized when tumor growth caused discomfort as per the veterinarian’s recommendation.
Isolation of tumor-infiltrating cells
Tumor samples were minced with scissors and incubated with collagen IV and DNase in RPMI at 37°C for 30 min. Samples were then processed by repeated pipetting and filtered through a 100-μm nylon filter (Sangon) in RPMI to generate single-cell suspensions. The single-cell suspensions were then subsequently washed with complete RPMI and purified on a Ficoll gradient to eliminate dead cells. The remaining cells were treated with red blood cell lysis buffer (ACK Lysing Buffer, Lonza). Before flow cytometry analysis, the cells were further washed and resuspended in MACS buffer (PBS+2 mM EDTA +0.5% BSA) before incubation with antibodies.
Flow cytometry
To detect CD19 CAR expression in transduced T cells, we cloned FLAG-tag ahead of scfv FMC63 and detected CAR expression through detection of APC-antiFLAG (APC-antiCAR) antibody. Activation of CD8 + T cells and CAR-T cells was detected based on PE-antiCD8, BV510-antiCD8, APC/Cyanine7-antiCD3, PE/Cyanine7-antiCD44 and FITC-antiCD45RO antibodies. Memory T subsets were detected based on PerCP/Cyanine5.5-antiCD62L, APC/Cyanine7-antiCD197 (CCR7), PE/Cyanine7-antiCD44 and FITC-antiCD45RO antibodies. Exhaustion of T cells was detected based on APC/Cyanine7-antiCD366 (Tim-3) and PE/Cyanine7 anti-CD279 (PD-1) antibodies. Intracellular cytokines were detected based on Pacific Blue™ anti-Granzyme B, APC/Cyanine7 anti-IFN-γ and FITC anti-TNF-α antibodies after fixation and permeabilization. BV605 anti-mouse IgG was used as control. FACS protein staining was performed with diluted antibodies (1:200) on ice for 30 minutes. Cells were then washed with PBS containing 1% FBS, and cytometry analysis was performed using a CytoFLEX LX Flow cytometer (Beckman Coulter, USA) or Attune NxT Flow Cytometer (Thermo Fisher, USA). Each group had at least 3 biological repetitions, and the data were analyzed using FlowJo software version 10.3 (Treestar, Ashland, OR, USA). Conjugated antibodies mainly obtained from Biolegend (San Diego, CA, USA) and BD Biosciences (San Jose, CA, USA) were reacted with human cells for flow cytometry. Peripheral blood and tumor infiltrating cells from mouse xenografts were treated with red blood cell lysis buffer (Biolegend), and the cells were stained with the corresponding antibodies, including BV510-anti-CD45, PE-anti-CD8 and APC-anti-CAR antibodies.
Carboxyfluorescein succinimidyl ester-based proliferation assay
CAR-T cells and control T cells were labeled with carboxyfluorescein succinimidyl ester (CFSE; Invitrogen) and seeded into 96-well plates. On day 5, cells were collected and analyzed for CFSE dilution by flow cytometry according to the manufacturer’s instructions.
2-NBDG glucose uptake assay
CAR-T cells and control T cells were washed with PBS and incubated with 400 µL of PBS + 0.5% FBS. 2-NBDG reagent (Thermo Fisher, Shanghai, China) to a final concentration of 200 µg/mL for 60 minutes at 37°C. After incubation, cells were collected from the plate and washed with PBS. Glucose uptake was determined by flow cytometry analysis immediately according to the manufacturer’s instructions. 2-NBDG glucose uptake was analyzed by calculating the 2-NBDG+ cell proportion.
Granzyme B and IFN-γ measurements
Culture supernatants were collected after 24 hours of coculture to measure the release of granzyme B and IFN-γ using specific ELISAs (R&D Systems, Inc.). Plasma obtained from mice and the cytokines IFN-γ and TNF-ɑ were also measured using specific ELISAs (R&D Systems, Inc.) following the manufacturer’s instructions.
Statistical analysis
To compare the two paired groups, a two-sample paired t test was used. Two-way ANOVA was used if there were two factors in group comparisons. To compare multiple groups with a single control, Dunnett’s test was used for multiplicity adjustment. Kaplan–Meier curves were generated for survival analysis, and the curves were compared by the log-rank test. For survival curve comparison, an unadjusted P value was reported.
Results
Kynurenine inhibited the metabolism of CD8 + T cells and impaired CD8 + T cell expansion and cytotoxicity
To explore the effects of metabolites on CD8 T cell metabolism, we listed cancer-related metabolic genes based on the ccmGDB database (https://bioinfo.uth.edu/ccmGDB), and 514 cancer-related genes were found (Table S1). Functional annotations were included based on Metascape,18 and the related metabolites were verified by searching for oncometabolites. A total of 73 metabolites were included (Supplementary materials Table S1), and the functions were matched with the Human Metabolome Database (www.hmdb.ca). After evaluating the references based on the immunological function of these metabolites, a total of 15 metabolites were found to be related to T cell metabolism and the concentration of metabolites were listed after referencing previous study (Supplementary materials Table S2). Metabolism of CD8 + T cells was directly associated with their effector function and differentiation.19 Glucose is the predominant fuel for T cells and essential biomarker for immune function.8 Changes in glucose uptake can reflect overall metabolic changes. 2-NBDG is a fluorescent glucose analog that has been used to monitor glucose uptake in live cells as an indicator of cell viability.19 Thus, a 2-NBDG assay was used to evaluate the effect of these metabolites on CD8 + T cell overall metabolic activity. We purified human CD8 + T cells and cultured them in complete culturing media (Figure 1(a)). After activation with CD3/CD28 microbeads, almost all lymphocytes were stained as CD8+ CD45RO+ CCR7- CD62L-, which implied that these cells showed a differentiation state as effector cells (Figure 1(b)). After 15 metabolites were added and determined by flow cytometry, different metabolites showed significantly altered glucose uptake ability (Figure 1(c)). Kyn had the strongest inhibitory effect on CD8 + T cell metabolism (Figure 1(d)).
Figure 1.
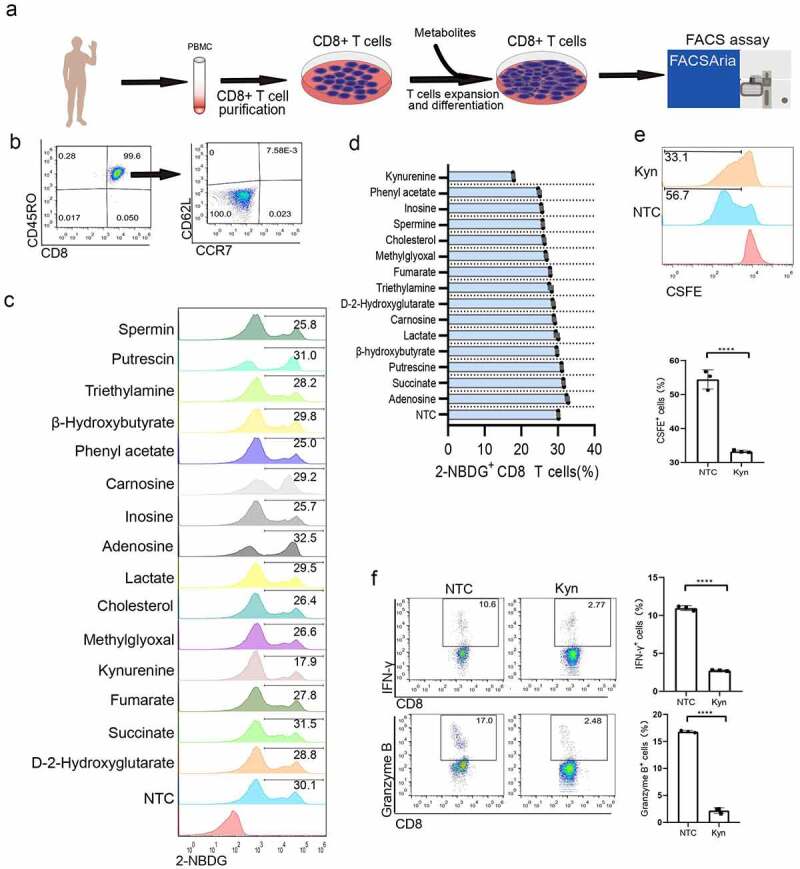
Kyn treatment showed the strongest inhibition of CD8 + T cell glucose metabolism proliferation and effector function. (a) Experimental strategy for 15 metabolite treatments in CD8 + T lymphocytes. (b) Typical FACS plots of subsets of memory cells after staining with CD45RO, CCR7 and CD62L. (c) Typical FACS plots and analysis of glucose uptake after staining with 2-NBDG. (d) Analysis of the glucose uptake inhibition percentage after different metabolite treatments. (e) Typical FACS plots and analysis of proliferation after staining with CSFE. (f) Typical FACS plots and analysis of effector function after staining with IFN-γ and granzyme B. (g) Typical FACS plots and analysis of exhausted cells after staining with PD-1. Data show mean ± SD of biological triplicates. Statistical analysis was performed by one-way ANOVA with Dunnett’s post hoc analysis compared with the control group (*, P < .05; **, P < .01; ***, P < .005, ***, P < .001).
Kyn is produced by catabolism of the essential amino acid tryptophan (Trp), and high concentrations of Kyn can be found in the plasma of multiple cancer types, such as lymphoma, leukemia,20 melanoma,21 lung cancer,22 pancreatic cancer,23 colon cancer,24 and renal cell carcinoma,25 depending on cancer type and individualized gene expression profile. Referencing the previous study that the pathological Kyn could produce and accumulate to micromoles.26,27 We performed a titration to assess the dose–response of Kyn on T cell metabolic inhibiting effect. It was found 100 nM Kyn inhibited glucose uptake and 100 μM Kyn showed plateau inhibition efficiency (Supplementary materials Fig S1). The dysregulated serum Kyn/Trp ratio as an adaptive resistance mechanism was associated with worse overall survival after PD-1 blockade immunotherapy.28 Multiple studies have implied that Kyn contributes to the immune-tolerant TME by several mechanisms, including suppressing tumor-reactive effector T-cell responses29 and inhibiting the expansion of effector T cells.30,31 Thus, we used a CSFE assay to determine the effect of Kyn on T cell proliferation. Kyn of 120 μM significantly inhibited the proliferation of CD8 + T cells (Figure 1(e)).
The cytotoxicity of CD8 + T cells was characterized by both lytic granule contents (particularly granzymes) and enhanced cytokine production (particularly interferon-γ). Based on a preliminary experiment, when CD8 + T cells were treated with 120 μM Kyn for 24 hours, intracellular interferon-γ- and granzyme B-positive cells were significantly decreased (Figure 1(f)). This indicated that a high concentration of Kyn would impair CD8 + T cell cytotoxicity. Previous studies showed that Kyn treatment resulted in exhaustion of CD4 + T cells after exposure to antigen.32 For CD8 + T cells, Kyn treatment at 120 μM did not significantly change the expression of the exhaustion marker PD-1 (Figure 1(g)). Moreover, the subsets of memory T cells were not significantly altered based on the expression of CCR7 and CD62L.
CAR-T cell-mediated cytotoxicity was weakened by Kyn treatment
To confirm the immunosuppressive effect of Kyn, we produced CAR-T cells and designed experiments after the addition of Kyn to the media (Figure 2(a)). The CAR cassette expressed soluble anti-CD19 scFv, followed by a CD28 intracellular domain and CD3ζ chain (Figure 2(b)). The scFv for anti-CD19 was previously used in clinical studies in the second-generation lentivirus plasmid backbone. FLAG-tag was included for the detection of CAR expression after promoter EF1ɑ. CD8 + T cells were spinfected with lentivirus and cultured in culture media. After culturing for 7 d, the expression of CAR in CD8 + T cells was approximately 72% (Figure 2(c)). These CAR-T cells were then used for phenotype research. Kyn (120 μM) and Trp (120 μM) showed similar CD44 and CD69 expression, indicating that all cells were activated (Figure 2(d)). The CFSE assay revealed that Kyn inhibited the expansion of CAR-T cells and that Trp promoted the proliferation of CAR-T cells (Figure 2(e)).
Figure 2.
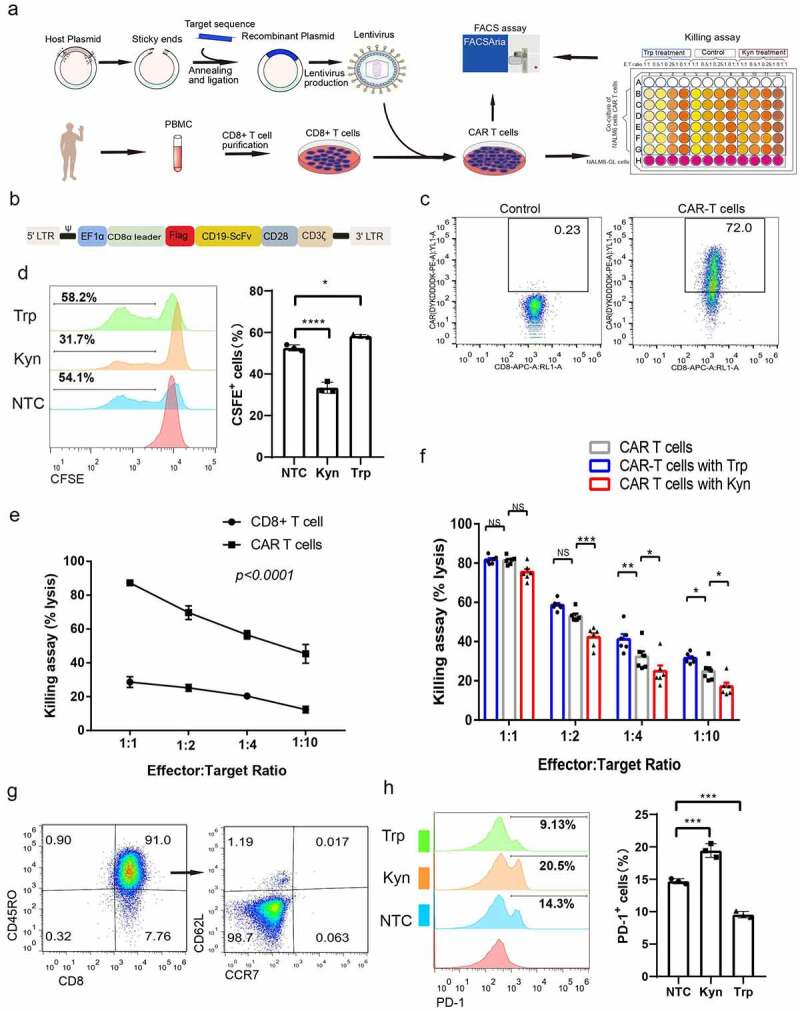
Kyn treatment decreased CAR-T cell-mediated antitumor effects. (a) Experimental strategy of CAR-T cell production and antitumor killing assay in high Trp and Kyn media. (b) Simplified overview of anti-CD19 (FMC63) CAR-T expression lentiviral vectors. (c) Typical FACS plots of CAR expression after staining with FLAG-tag. (d) Typical FACS plots of CAR-T cell activation after staining with CD44 and CD69. (D) Typical FACS plots and analysis of CAR-T cell proliferation after CAR-T cells were treated with high Trp or Kyn based on staining with CSFE. (f) Analysis of the killing assay based on the lysis percentage of cancer cells by CAR-T cells and CD8 + T cells at different effector-to-target ratios. (g) Analysis of CAR-T cell-mediated killing assay based on the lysis percentage of cancer cells by CAR-T cells in high Trp and high Kyn media at different effector-to-target ratios. (h) Typical FACS plots of subsets of memory cells after staining with CD45RO, CCR7 and CD62L. (i) Typical FACS plots and analysis of exhaustion after CAR-T cells were treated with high Trp or Kyn based on staining with PD-1. Data show the mean ± SD of at least biological triplicates. Statistical analysis was performed by one-way ANOVA with Dunnett’s post hoc analysis compared with the control group (*, P < .05; **, P < .01; ***, P < .005, ***, P < .001).
The direct cytotoxicity of CAR-T cells was evaluated using a co-culture assay of effector CAR-T cells and target NALM6 cancer cells. CD8 + T cells showed limited killing ability of cancer cells, and there was no significant increase in killing ability when the effector CAR-T cell proportion was increased (Figure 2(f)). While CAR-T cells showed a strong killing effect of NALM-6 cancers cells, and there was a good correlation at different effector CAR-T cells to target cancer cells ratios. Then, killing assays were performed in media with additional Kyn and Trp. Interestingly, when the effector CAR-T cell to target NALM6 cancer cell ratio decreased to 1:2, the killing ability of CAR-T cells in high Kyn media was significantly decreased (Figure 2(g)). Moreover, when the effector-to-target ratio decreased to 1:4, the killing ability of CAR-T cells was significantly increased in high Trp media but decreased in high Kyn media. These results clarified the weakening cytotoxicity of CAR-T cells under high Kyn conditions. We then measured the subsets of CAR-T cells and found that almost all CAR-T cells showed an effector subset that expressed CD45RO+ CCR7- CD62L- (Figure 2(h)). This implied that anti-CD19 CAR-T cells are a potential strong effector subset. PD-1 expression was significantly increased after Kyn treatment and decreased after Trp treatment (Figure 2(i)).
KYNU-modified CAR-T cells showed distinct proliferation and metabolic phenotypes
Kyn is produced by cancer cells through over-expression (OE) of Indoleamine 2,3 Dioxygenase 1 (IDO1) or Tryptophan 2,3-Dioxygenase 2 (TDO2) and catabolized by the enzyme kynurenine (KYNU).33 IDO1 has been widely studied as a tryptophan metabolizing enzymes that catalyze the initial step of the Kyn pathway34 (Supplementary materials Fig S2). Tumor overexpression of IDO1 increases local Kyn concentrations and depletes tryptophan levels. However, KYNU catalyzed the cleavage of Kyn and was recognized as the key enzyme for the degradation of Kyn. There was weak expression of KYNU staining in human immunocytes and the TME. The high activation of IDO1/TDO2 and low expression of KYNU in TME resulted in the accumulation of Kyn. To overcome the immunosuppressive impact of TME with high concentrations of Kyn, we modified CAR-T cells through overexpression (OE) of KYNU or knockout (KO) of KYNU and explored their phenotype (Figure 3(a)). KYNU-OE CAR-T cells was produced by placing the cDNA of KYNU after the anti-CD19 CAR cassette via T2A (Figure 3(b)). Then, lentivirus with anti-CD19 CAR-T2A-KYNU shuttle plasmid was added to CD8 + T cells, and KYNU-OE CAR-T cells were produced and purified. KYNU-KO CAR-T cells was performed through a CRISPR/Cas9-based ribonucleoprotein (RNP) complex. After the verification of preliminary experimental results (Supplementary materials Fig S3), sgRNA for the KO of KYNU was preferred as sgRNA1 and the sgRNA sequence was chosen as AATGCCACCCAACGGATGAG. Analysis of KYNU mRNA confirmed the increased gene expression of KYNU in KYNU-OE CAR-T cells and decreased KYNU gene expression in KYNU-KO CAR-T cells (Figure 3(c)). The survey assay indicated the knockout of the KYNU gene in CAR-T cells (Figure 3(d)). Protein expression of the enzyme KYNU was also confirmed by Western blot results (Figure 3(e)). After culturing the cells for more than 7 d, the CAR expression was above 50%, so the cells were used for phenotypic research. The CSFE assay showed decreased proliferative activity of KYNU-KO CAR-T cells and increased proliferative activity of KYNU-OE CAR-T cells (Figure 3(f)). Glucose uptake was decreased in KYNU-KO CAR-T cells but increased in KYNU-OE CAR-T cells (Figure 3(g)). These data implied distinct metabolic and expansion phenotype after KYNU modification in CAR-T cells.
Figure 3.
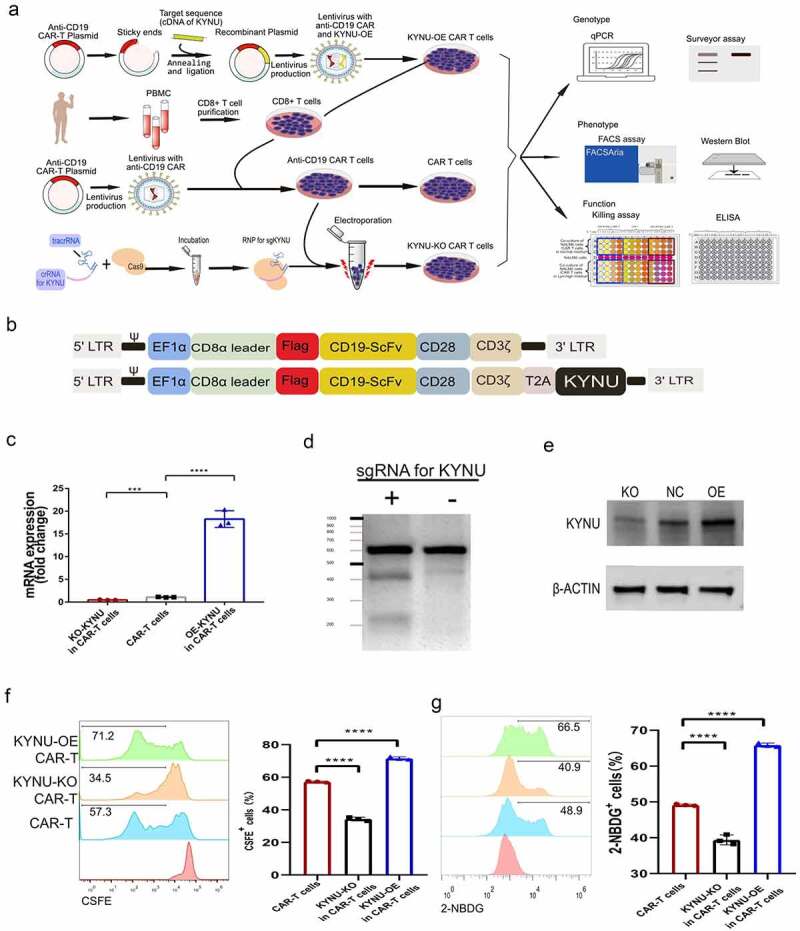
CAR-T cells with KYNU modification displayed distinct proliferation and glucose uptake features. (a) Experimental strategy of KYNU modification of CAR-T cell production, genotype, phenotype and functional analysis. (b) Simplified overview of KYNU-OE anti-CD19 (FMC63) CAR-T expression lentiviral vectors. (c) Analysis of KYNU mRNA expression in KYNU-modified CAR-T cells. (d) Northern blot analysis of KYNU KO in KYNU-KO CAR-T cells by SURVEYOR T7E1 assay. (e) Western blot analysis of KYNU-modified CAR-T cells by staining with KYNU. (f) Typical FACS plots and analysis of CAR-T cell proliferation after KYNU modification based on staining with CSFE. (g) Typical FACS plots and analysis of CAR-T cell glucose uptake after KYNU modification based on staining with 2-NBDG. Data show the mean ± SD of at least biological triplicates. Statistical analysis was performed by one-way ANOVA with Dunnett’s post hoc analysis compared with the control group (*, P < .05; **, P < .01; ***, P < .005, ***, P < .001).
KYNU-modified CAR-T cells showed unique cytotoxicity against cancer cells
Next, we designed a killing assay by co-culturing effector CAR-T cells and target NALM6 cancer cells. The results indicated that KYNU-KO CAR-T cells display inferior killing effect at all effector-to-target ratios, while KYNU-OE CAR-T cells display supferior killing potential at all effector-to-target ratios (Figure 4(a)). To reveal the mechanisms underlying the different cytotoxicities of CAR-T cells, we further revealed the subsets of these KYNU-modified CAR-T cells. The three groups showed different memory subsets based on CD62L and CD127 markers (Figure 4(b)). KYNU-OE CAR-T cells displayed increased effector memory cell and effector CAR-T cell percentages, while KYNU-KO CAR-T cells displayed increased effector CAR-T cells and intermediate CAR-T cells and decreased effector memory CAR-T cells (Figure 4(c)).
Figure 4.
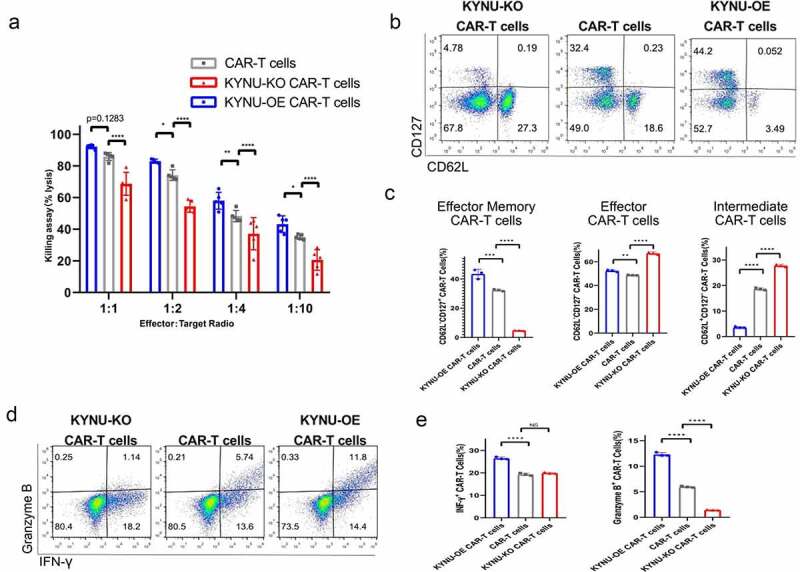
CAR-T cells with KYNU modification displayed different killing effects and phenotypic characteristics. (a) Analysis of the killing assay based on the lysis percentage of cancer cells by KYNU-modified CAR-T cells at different effector-to-target ratios. (b) Typical FACS plots of subsets of memory cells after KYNU modification in CAR-T cells based on staining with CD127 and CD62L. (c) Analysis of a subset of memory cells after KYNU modification in CAR-T cells. (d) Typical FACS plots of effector function after KYNU modification in CAR-T cells based on staining with Granzyme B and IFN-γ. (e) Analysis of effector function of granzyme B and IFN-γ after KYNU modification in CAR-T cells. (f) Typical FACS plots of exhaustion after KYNU modification in CAR-T cells based on staining with PD-1. (g) Analysis of exhaustion after KYNU modification in CAR-T cells. Data show the mean ± SD of at least biological triplicates. Statistical analysis was performed by one-way ANOVA with Dunnett’s post hoc analysis compared with the control group (*, P < .05; **, P < .01; ***, P < .005, ***, P < .001).
The cytotoxicities of KYNU-modified CAR-T cells were reflected by the expression of interferon-γ and granzyme B (Figure 4(d)). Consistent with the killing assay results, KYNU-OE CAR-T cells contained high lytic granules of granzyme B and enhanced cytokine production of interferon-γ, while KYNU-KO CAR-T cells contained significantly decreased lytic granules of granzyme B (Figure 4(e)). This indicated that modification of KYNU in CAR-T cells resulted in different cytotoxicity against cancer cells. The exhaustion marker of PD-1 was also analyzed and showed obvious alterations after modification of KYNU (Figure 4(f)). PD-1 was significantly decreased in KYNU-OE CAR-T cells but increased in KYNU-KO CAR-T cells (Figure 4(g)).
KYNU-OE CAR-T cells display excellent killing effect in high Kyn media
Based on the fact that the production and accumulation of Kyn in the TME impairs the cytotoxicity of CAR-T cells,29 we explored the killing effect of KYNU-modified CAR-T cells in high Kyn media. KYNU-OE CAR-T cells displayed a stronger killing ability in high Kyn media than in normal media at all effector-to-target ratios (Figure 5(a)). Moreover, CAR-T cells and KYNU-KO CAR-T cells displayed weaker killing ability in high Kyn media than in normal media. The KYNU modified CAR-T cells displayed different killing effect in the high Kyn immunosuppressive TME. PD-1 expression was also significantly increased in CAR-T cells and KYNU-KO CAR-T cells in normal media compared to media with high Kyn levels (Figure 5(b)). The subsets of memory cells were analyzed based on CD62L and CD127. Interestingly, KYNU-OE CAR-T cells resulted in low effector memory CAR-T cells and a high effector CAR-T cell subset proportion in high Kyn media (Figure 5(c)). However, CAR-T cells and KYNU-KO CAR-T cells showed significant proportions of effector CAR-T cells and low effector memory CAR-T cell subset proportions. Since the longevity of effector CAR-T cells is shorter than that of effector memory CAR-T cells, the cytotoxicity of CAR-T cells and KYNU-KO CAR-T cells was reasonably impaired in high Kyn media.
Figure 5.
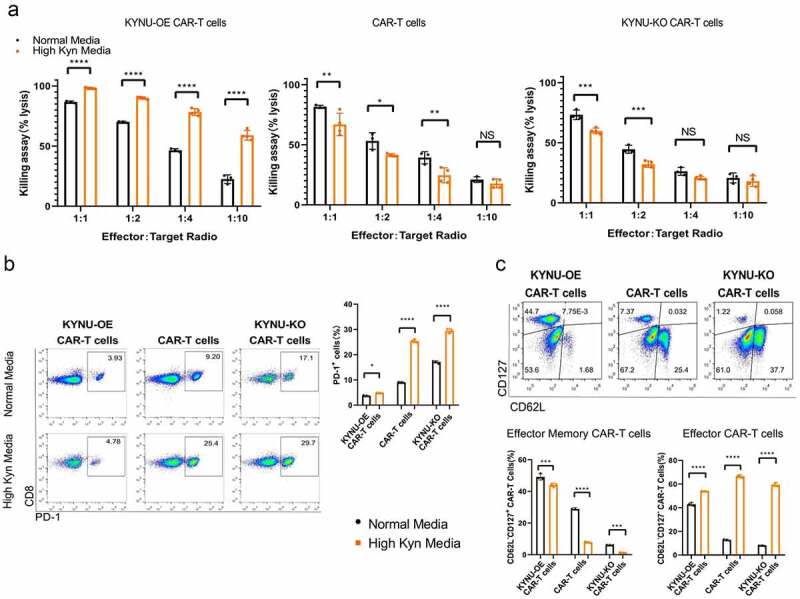
CAR-T cells with KYNU modification displayed different killing potentials and differentiation of memory subsets. (a) Analysis of the killing assay based on the lysis percentage of cancer cells by KYNU-modified CAR-T cells in high Trp and Kyn media at different effector-to-target ratios. (b) Typical FACS plots and analysis of exhaustion of KYNU-modified CAR-T cells in normal media and high Kyn media based on staining with PD-1. (c) Typical FACS plots of subsets of memory cells of KYNU-modified CAR-T cells in high Kyn media based on staining with CD127 and CD62L. (d) Analysis of a subset of memory cells of KYNU-modified CAR-T cells in normal media and high-Kyn media based on staining with CD127 and CD62L. Data show the mean ± SD of at least biological triplicates. Data show the mean ± SD of at least biological triplicates. Statistical analysis was performed by one-way ANOVA with Dunnett’s post hoc analysis compared with the control group (*, P < .05; **, P < .01; ***, P < .005, ***, P < .001).
Based on the specific metabolic pathway of Kyn that kynurenic acid may accumulated in the body (Supplementary materials Fig S2), we further evaluated the killing effect of KYNU-modified CAR-T cells in 120 µM kynurenic acid media. There was significant decrease of overall killing effect at high kynurenic acid media when compared with normal media (Supplementary materials Fig S4). Though KYNU modified CAR-T cells showed no significant killing ability at effector to target ratios of 1:4 and 1:10 when compared with normal CAR-T cells in high kynurenic acid media, KYNU-OE CAR-T cells and KYNU-KO CAR-T cells showed significant different anti-tumor acitivity against NALM6 cells. These implied the distinct functional and phenotypic changes of KYNU modified CAR-T cells.
KYNU-OE CAR-T cell treatment improved the survival of mice bearing cancer cells
To verify the in vivo antitumor activity of KYNU-OE CAR-T cells on cancer cells, we designed two independent experiments. First, NALM6 cancer cells with CD19 expression in the cell membrane were inoculated into NSG mice, and then 4.0 × 10⁶ anti-CD19 CAR-T cells were injected at day 3 post inoculation (Figure 6(a)). Disease progression was followed until the discomfort status resulting in sacrifice, per the veterinarian’s recommendation. It was noted that anti-CD19 CAR-T cells could significantly improve the overall survival of mice bearing NALM6 cancer (Figure 6(b)). This was consistent with previous studies. KYNU-modified CAR-T cell treatment resulted in significantly different survival profiles. Interestingly, KYNU-OE CAR-T cells improved the survival status, while KYNU-KO CAR-T cells shortened the average survival span (Figure 6(b)). Since effector CAR-T cells lasted for approximately 2 weeks,35 we collected blood at day 14 post inoculation and analyzed the CAR-T cells by detection of CD3 and CAR using flow cytometry (Figure 6(c)). The CD3+ lymphocyte percentage decreased from 40% in the PBS control group to below 30% in all CAR-T cell therapy groups (Figure 6(d)). When additional CAR-T lymphocytes were injected into mice, the development of autologous lymphocytes was inhibited, and the CD3 + T lymphocyte percentage was decreased. However, the KYNU-KO CAR-T cell-treated mice contained the lowest CD3 + T cell percentage. CAR-T cells were found in all CAR-T cell therapy groups and ranged from 0.30% to 0.77% (Figure 6(e)). This was evident with the subsets of memory T cells. Interestingly, the lowest proportion of CAR-T cells was obtained from KYNU-KO CAR-T cell-treated mice. This inferior survival effect of KYNU-KO CAR-T cells clarified the importance of KYNU on CAR-T cell longevity and antitumor effects.
Figure 6.
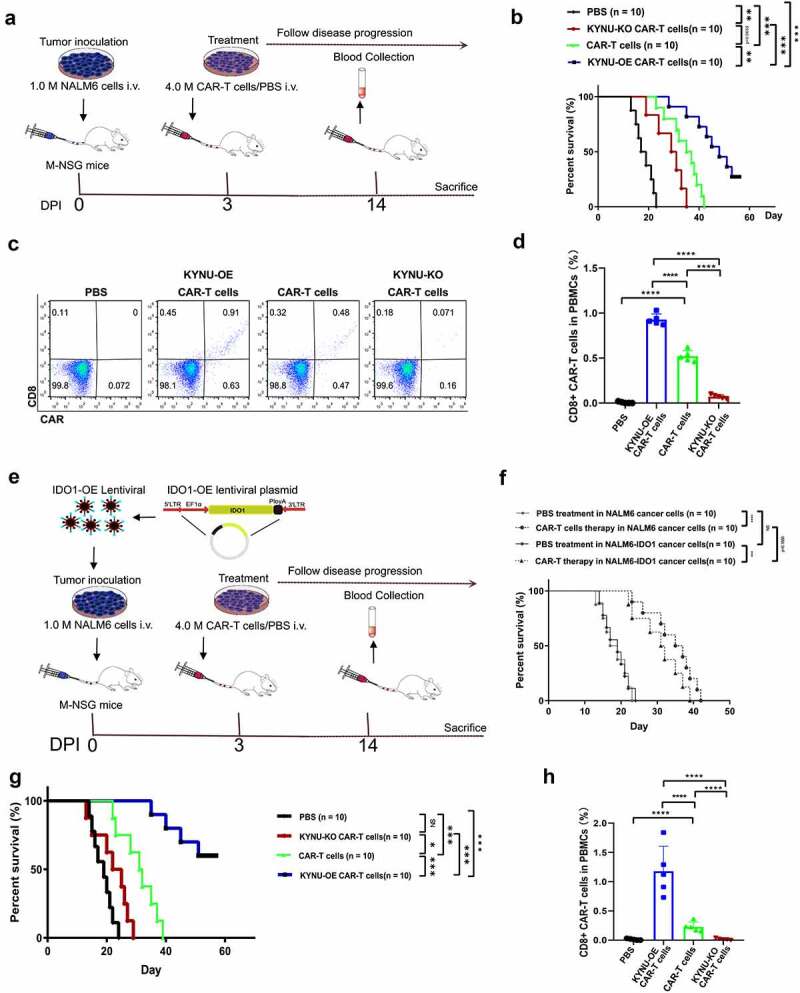
CAR-T cells with KYNU modification displayed different overall survival and resident CAR-T cell percentages after treatment for 14 d. (a) Experimental strategy of KYNU-modified CAR-T cells for the treatment of NALM6 cancer cell-bearing mice. (b) Analysis of overall survival of KYNU-modified CAR-T cells in mice bearing NALM6 cancer cells. (c) Typical FACS plots of CD3 and CAR-T cells after treatment with KYNU-modified CAR-T cells for 14 d based on CD3 and FLAG tags. (d) Analysis of CD3 + T lymphocyte percentages after treatment with KYNU-modified CAR-T cells for 14 d in mice bearing NALM6 cancer cells. (e) Analysis of CAR-T cell percentages after treatment with KYNU-modified CAR-T cells for 14 d in mice bearing NALM6 cancer cells. (f) Experimental strategy of KYNU-modified CAR-T cells for the treatment of NALM6-IDO1 cancer cell-bearing mice. (g) Analysis of overall survival of CAR-T cells in mice bearing NALM6 cancer cells and NALM6-IDO1 cancer cells. (h) Analysis of overall survival of KYNU-modified CAR-T cells in mice bearing NALM6-IDO1 cancer cells. (i) Typical FACS plots of CD3 and CAR-T cells after treatment with KYNU-modified CAR-T cells for 14 d based on CD3 and FLAG tags. (j) Analysis of CD3 + T lymphocyte percentages after treatment with KYNU-modified CAR-T cells for 14 d in mice bearing NALM6-IDO1 cancer cells. (k) Analysis of CAR-T cell percentages after treatment with KYNU-modified CAR-T cells for 14 d in mice bearing NALM6-IDO1 cancer cells. Each group had 10 mice, and the FACS data show the mean ± SD of biological triplicates at minimum. Statistical analysis was performed by one-way ANOVA with Dunnett’s post hoc analysis compared with the control group (*, P < .05; **, P < .01; ***, P < .005, ***, P < .001).
To overcome the immunosuppressive TME, we produced NALM6-IDO1 cells via lentivirus infection and antibiotic screening. The protein expression of IDO1 was low in NALM6, while observed increasing in NALM6-IDO1 cells (Supplementary materials Fig S5). When determined the intracellular Kyn and it was found no signal of Kyn in 1 million NALM-6 cells after culturing for 48 hours, while high Kyn in the NALM6-IDO1 cells (0 vs 4.14 ± 1.11 μM). These made the in vivo model of M-NSG mice bearing NALM6-IDO1 cells more convincing of high Kyn TME. KYNU-modified CAR-T cells were injected at day 3 post inoculation for treatment as described strategy (Figure 6(f)). NALM6-IDO1 cancer cell-bearing mice showed similar survival status to wild-type NALM6 cancer cells. However, CAR-T cell therapy resulted in shorter overall survival in IDO1-OE NALM6 cancer cell-bearing mice (Figure 6(g)). It was noted that KYNU-OE CAR-T cell therapy significantly improved the survival of NALM6-IDO1 cancer cell-bearing mice, while KYNU-KO CAR-T cell therapy did not show any effect on these mice (Figure 6(h)). KYNU catabolized Kyn, which was produced by IDO1-overexpressing cancer cells. KYNU-OE CAR-T cells could take advantage of high Kyn and use these oncometabolites as metabolic fuel. The percentages of lymphocytes and CAR-T cells were measured at day 14 post inoculation (Figure 6(i)). CD3 + T lymphocytes ranged from 22% to 30%, as shown in previous studies (Figure 6(j)). The CAR-T cell percentage was also only found in the CAR-T cell therapy groups (Figure 6(k)). However, there was a significant difference in CAR-T cell percentages among the KYNU-modified CAR-T cells, and the KYNU-OE CAR-T cell therapy group contained the highest CAR-T cell percentage.
Discussion
n the present study, we screened oncometabolite through evaluation of the inhibition of the overall metabolism of CD8 + T cells. Kyn showed a dose–response effect of inhibiting glucose uptake and 120 µM Kyn showed a distinct phenotypic change of expansion, function and differentiation status in CD8 + T cells and anti-CD19 CAR-T cells. Specifically, the in vitro experiment confirmed Kyn significantly inhibited CAR-T-mediated cytotoxicity, while catabolism of Kyn through KYNU over-expression in CAR-T cells could improve the killing effect against cancer cells even in the immunosuppressive TME of high Kyn. The in vivo experiment confirmed that KYNU-OE CAR-T cells provided a therapeutic advantage of anti-tumor effectiveness against NALM6 cancer cells and NALM6-IDO1 cancer cells when compared with CAR-T cells and KYNU-KO CAR-T cells. All of these results implied the immunosuppressive effect of high Kyn and superior anti-tumor effect of KYNU-OE CAR-T cells.
Kyn is an oncometabolite with up-regulated IDO1 and TDO2 expression/activity.33 The Kyn pathway contributed approximately 95% of Trp metabolism. Less than 1% of dietary Trp was used for protein synthesis under physiological conditions. IDO1 up-regulated expression/activity has been observed in tumor cells as well as in tumor-surrounding endothelial cells, fibroblasts, and mesenchymal cells.34 IDO1 up-regulated expression has also been documented in the peripheral blood and tumor infiltrating immune cells.36 Moreover, IDO1 could be induced by IFN since the promoter region of IDO consists of several IFN-stimulated response elements and gamma activation sequences.37 Investigation into the transcription of IDO1 and its induction by IFN-γ heralds a new era in immunologic research.
Knockout of IDO1 in mice showed a beneficial effect on the survival of mice bearing cancer and even robust rejection of tumors.38 Several efforts have been made to block the IDO1 pathway. More recently, the inhibition of the IDO1 pathway among unselected patient populations in a large phase III trial (ECHO-301/KEYNOTE-252) did not improve the therapeutic outcome of PD-1 blockade39 but heralded a new area of immunotherapy that investigate the regulation of Trp/Kyn pathway for the treatment of cancer. More researchers were designed to analyze the correlation to Kyn and the dosage of IDO1 blocker epacadostat,40 the selection of patients,41 and the optimization of novel IDO1 inhibitor.42,43
We confirmed the dose–response effect of Kyn on inhibition of glucose uptake in CD8 + T cells and the immunosuppressive effect of Kyn on CAR-T cells. Tumor-infiltrating CD8 + T cells could experience a loss of function or altered metabolic function in the immunosuppressive TME that was characterized by accumulated Kyn. Based on the immunosuppressive function of Kyn accumulation in TME, we modification of CAR-T cells for the catabolism of Kyn and explorer the phenotype of KYNU-modified CAR-T cells. We highlighted how the catabolism of Kyn improved T cells mediating cytotoxicity through KYNU-OE, as revealed by in vitro and in vivo experiments. This was consistent with previous study that modified KYNU mediated depletion of Kyn in the TME and reversed the modulatory effects of IDO1/TDO upregulation in the TME.44
As a supraphysiological signaling pathway, CAR modification results in a distinct phenotype.3 It is known that inclusion of CD28 domains in the CAR architecture tends to yield effector memory cells by enhancing glycolysis, while 4–1BB in CAR can promote the formation of central memory T cells through metabolic reprogramming by increasing fatty acid oxidation and enhancing mitochondrial biogenesis.45 Engineering immunomodulatory fusion proteins of Fas-4-1BB could also significantly enhance human T cell function by enhancing mitochondrial biogenesis and metabolic reprogramming.46 In the present study, we modified CAR-T cells through overexpression or knockout of KYNU. The antitumor activity of KYNU-modified CAR-T cells were verified through in vivo experiments. KYNU-OE CAR-T cells not only catabolized the accumulated Kyn but also changed the phenotype, such as regulating the metabolic activity, expansion, differentiation and longevity of CAR-T cells. For the animal experiment, we injected CAR-T cells into mice, and blood was collected at day 14 for the analysis of resident CAR-T cells. There was an approximately 0.3% percentage of CAR-T cells, and the KYNU-OE CAR-T cell treatment group contained the highest CAR-T cell percentage. Based on a lifespan of effector T cells of approximately 2 weeks,35,47 these resident detected CAR-T cells were the main fighters against the antitumor effect.
It was noted that the production and accumulation of Kyn were found in various cancers. To proof the hypothesis that the catabolism of Kyn for the improvement of anti-tumor effectiveness through tandem KYNU and CAR, we used commercialized anti-CD19 CAR-T cells and NALM6 leukemia cell line. However, there were weak expressions of IDO1, IDO2, and TDO2 protein and no signal of intracellular Kyn in NALM6 cells. This made the addition of Kyn in the media for the killing assay more convincing. In the in vivo experiment, we produced NALM6-IDO1 cells to establish high Kyn TME. There were high IDO1 protein expression and intracellular Kyn concentration in NALM6-IDO1 cells. KYNU-OE CAR-T cells showed superior antitumor efficacy, while KYNU-KO CAR-T cells showed inferior antitumor potential. The distinct antitumor immunotherapy efficacy of KYNU modified CAR-T cells implied further clinical trial for the rescue of the immunosuppressive effect of Kyn.
In conclusion, we produced KYNU-OE CAR-T cells for the treatment of hematopoietic malignancies with a high concentration of the immunosuppressive oncometabolite Kyn. KYNU-modified CAR-T cells displayed distinct phenotypes of expansion, function and differentiation status. KYNU-OE CAR-T cells enhance the killing potential through increased production of lytic granule contents granzyme B and cytokine IFN-γ. This enhanced antitumor effect was consistent with the prolonged survival of mice bearing NALM6-IDO1 cancer cells. This study explores an immunotherapy strategy for patients with alterations in Trp metabolic disorder through catabolism of the immunosuppressive oncometabolite Kyn.
Supplementary Material
Acknowledgments
This work was supported by grants from the National Natural Science Foundation of China (No.: 81872494, 81803874, 81873042, and 82074063).
Funding Statement
This work was supported by the National Natural Science Foundation of China [81872494]; National Natural Science Foundation of China [81873042, and 82074063]; National Natural Science Foundation of China [81803874].
Author contributions
Design of experiments, CG and QY. Perform the experiments, QY, JH, MC, and YW. Analyzed the data, JL (Jin Lu), JL (Jie Lu). Provided experimental materials, CG, QY, JH, JH, XS, JZ, CL. Supervised the project, CG, YH (Yan Huo), YH (Yonglong Han). Preparation and revision of the manuscript QY, JH and CG.
Disclosure statement
No potential conflict of interest was reported by the author(s).
Supplementary material
Supplemental data for this article can be accessed on the publisher’s website
References
- 1.Schuster SJ, Svoboda J, Chong EA, Nasta SD, Mato AR, Anak Ö, Brogdon JL, Pruteanu-Malinici I, Bhoj V, Landsburg D, et al. Chimeric antigen receptor T cells in refractory B-cell lymphomas. N Engl J Med. 2017;377(26):2545–14. doi: 10.1056/NEJMoa1708566. [DOI] [PMC free article] [PubMed] [Google Scholar]
- 2.Singh AK, McGuirk JP.. CAR T cells: continuation in a revolution of immunotherapy. Lancet Oncol. 2020;21(3):e168–e178. doi: 10.1016/S1470-2045(19)30823-X. [DOI] [PubMed] [Google Scholar]
- 3.Long AH, Haso WM, Shern JF, Wanhainen KM, Murgai M, Ingaramo M, Smith JP, Walker AJ, Kohler ME, Venkateshwara VR, et al. 4-1BB costimulation ameliorates T cell exhaustion induced by tonic signaling of chimeric antigen receptors. Nat Med. 2015;21(6):581–590. doi: 10.1038/nm.3838. [DOI] [PMC free article] [PubMed] [Google Scholar]
- 4.Jackson HJ, Rafiq S, Brentjens RJ. Driving CAR T-cells forward. Nat Rev Clin Oncol. 2016;13(6):370–383. doi: 10.1038/nrclinonc.2016.36. [DOI] [PMC free article] [PubMed] [Google Scholar]
- 5.El-Khazragy N, Ghozy S, Emad P, Mourad M, Razza D, Farouk YK, Mohamed NA, Ahmed MK, Youssef T, Bahnasawy YM, et al. Chimeric antigen receptor T cells immunotherapy: challenges and opportunities in hematological malignancies. Immunotherapy. 2020;12(18):1341–1357. doi: 10.2217/imt-2020-0181. [DOI] [PubMed] [Google Scholar]
- 6.Yan ZX, Li L, Wang W, OuYang B-S, Cheng S, Wang L, Wu W, Xu -P-P, Muftuoglu M, Hao M, et al. Clinical efficacy and tumor microenvironment influence in a dose-escalation study of anti-CD19 chimeric antigen receptor T cells in refractory B-Cell non-hodgkin’s lymphoma. Clin Cancer Res. 2019;25(23):6995–7003. doi: 10.1158/1078-0432.CCR-19-0101. [DOI] [PubMed] [Google Scholar]
- 7.Hong M, Clubb JD, Chen YY. Engineering CAR-T cells for next-generation cancer therapy. Cancer Cell. 2020;38(4):473–488. doi: 10.1016/j.ccell.2020.07.005. [DOI] [PubMed] [Google Scholar]
- 8.Palmer CS, Ostrowski M, Balderson B, Christian N, Crowe SM. Glucose metabolism regulates T cell activation, differentiation, and functions. Front Immunol. 2015;6:1. doi: 10.3389/fimmu.2015.00001. [DOI] [PMC free article] [PubMed] [Google Scholar]
- 9.Chang CH, Curtis J, Maggi L, Faubert B, Villarino A, O’Sullivan D, Huang S-C, Van der windt GW, Blagih J, Qiu J, et al. Posttranscriptional control of T cell effector function by aerobic glycolysis. Cell. 2013;153(6):1239–1251. doi: 10.1016/j.cell.2013.05.016. [DOI] [PMC free article] [PubMed] [Google Scholar]
- 10.Edwards-Hicks J, Mitterer M, Pearce EL, Buescher JM. Metabolic dynamics of in vitro CD8+ T cell activation. Metabolites. 2020;11(1):12. doi: 10.3390/metabo11010012. [DOI] [PMC free article] [PubMed] [Google Scholar]
- 11.Xu J, Ma X, Yu K, Wang R, Wang S, Liu R, Liu H, Gao H, Yu K, Wang C, et al. Lactate up-regulates the expression of PD-L1 in kidney and causes immunosuppression in septic acute renal injury. J Microbiol Immunol Infect. 2019;54(3):404–410. doi: 10.1016/j.jmii.2019.10.006. [DOI] [PubMed] [Google Scholar]
- 12.Chang C-H, Qiu J, O’Sullivan D, Buck M, Noguchi T, Curtis J, Chen Q, Gindin M, Gubin M, Van der windt GW, et al. Metabolic competition in the tumor microenvironment is a driver of cancer progression. Cell. 2015;162(6):1229–1241. doi: 10.1016/j.cell.2015.08.016. [DOI] [PMC free article] [PubMed] [Google Scholar]
- 13.Leone RD, Powell JD. Fueling the revolution: targeting metabolism to enhance immunotherapy. Cancer Immunol Res. 2021;9(3):255–260. doi: 10.1158/2326-6066.CIR-20-0791. [DOI] [PMC free article] [PubMed] [Google Scholar]
- 14.Bunse L, Pusch S, Bunse T, Sahm F, Sanghvi K, Friedrich M, Alansary D, Sonner JK, Green E, Deumelandt K, et al. Suppression of antitumor T cell immunity by the oncometabolite (R)-2-hydroxyglutarate. Nat Med. 2018;24(8):1192–1203. doi: 10.1038/s41591-018-0095-6. [DOI] [PubMed] [Google Scholar]
- 15.Mabuchi R, Hara T, Matsumoto T, Shibata Y, Nakamura N, Nakamura H, Kitagawa J, Kanemura N, Goto N, Shimizu M, et al. High serum concentration of L-kynurenine predicts unfavorable outcomes in patients with acute myeloid leukemia. Leukemia & Lymphoma. 2016;57(1):92–98. doi: 10.3109/10428194.2015.1041388. [DOI] [PubMed] [Google Scholar]
- 16.Brudno JN, Lam N, Vanasse D, Shen Y-W, Rose JJ, Rossi J, Xue A, Bot A, Scholler N, Mikkilineni L, et al. Safety and feasibility of anti-CD19 CAR T cells with fully human binding domains in patients with B-cell lymphoma. Nat Med. 2020;26(2):270–280. doi: 10.1038/s41591-019-0737-3. [DOI] [PMC free article] [PubMed] [Google Scholar]
- 17.Qin H, Ramakrishna S, Nguyen S, Fountaine TJ, Ponduri A, Stetler-Stevenson M, Yuan CM, Haso W, Shern JF, Shah NN, et al. Preclinical development of bivalent chimeric antigen receptors targeting both CD19 and CD22. Molecular Therapy-Oncolytics. 2018;11:127–137. doi: 10.1016/j.omto.2018.10.006. [DOI] [PMC free article] [PubMed] [Google Scholar]
- 18.Zhou Y, Eicke N, Huber P, Köhler J, Zeller S, Voigtsberger J, Schlott N, Henrichs K, Sann H, Trinter F, et al. Metascape provides a biologist-oriented resource for the analysis of systems-level datasets. Nat Commun. 2019;10(1):1–10. doi: 10.1038/s41467-018-07882-8. [DOI] [PMC free article] [PubMed] [Google Scholar]
- 19.Huang H, Zhou P, Wei J, Long L, Shi H, Dhungana Y, Chapman NM, Fu G, Saravia J, Raynor JL, et al. In vivo CRISPR screening reveals nutrient signaling processes underpinning CD8+ T cell fate decisions. Cell. 2021;184(5):1245–1261. e21. doi: 10.1016/j.cell.2021.02.021. [DOI] [PMC free article] [PubMed] [Google Scholar]
- 20.Vonka V, Humlova Z, Klamova H, Kujovska-Krcmova L, Petrackova M, Hamsikova E, Krmencikova-Fliegl M, Duskova M, Roth Z. Kynurenine and uric acid levels in chronic myeloid leukemia patients. Oncoimmunology. 2015;4(3):e992646. doi: 10.4161/2162402X.2014.992646. [DOI] [PMC free article] [PubMed] [Google Scholar]
- 21.Rad Pour S, Morikawa H, Kiani NA, Gomez-Cabrero D, Hayes A, Zheng X, Pernemalm M, Lehtiö J, Mole DJ, Hansson J, et al. Immunometabolic network interactions of the kynurenine pathway in cutaneous malignant Melanoma. Front Oncol. 2020;10:51. doi: 10.3389/fonc.2020.00051. [DOI] [PMC free article] [PubMed] [Google Scholar]
- 22.Nguyen DJM, Theodoropoulos G, Li -Y-Y, Wu C, Sha W, Feun LG, Lampidis TJ, Savaraj N, Wangpaichitr M. Targeting the kynurenine pathway for the treatment of cisplatin-resistant lung cancer. Mol Cancer Res. 2020;18(1):105–117. doi: 10.1158/1541-7786.MCR-19-0239. [DOI] [PMC free article] [PubMed] [Google Scholar]
- 23.Huang JY, Butler LM, Midttun Ø, Ulvik A, Wang R, Jin A, Gao Y-T, Ueland PM, Koh W-P, Yuan J-M, et al. A prospective evaluation of serum kynurenine metabolites and risk of pancreatic cancer. PLoS One. 2018;13(5):e0196465. doi: 10.1371/journal.pone.0196465. [DOI] [PMC free article] [PubMed] [Google Scholar]
- 24.Ghazi A, Le Corre D, Pilati C, Taieb J, Aparicio T, Didelot A, Dedhar S, Mulot C, Le Malicot K, Djouadi F, et al. Prognostic value of the PrPC-ILK-IDO1 axis in the mesenchymal colorectal cancer subtype. Oncoimmunology. 2021;10(1):1940674. doi: 10.1080/2162402X.2021.1940674. [DOI] [PMC free article] [PubMed] [Google Scholar]
- 25.Lucarelli G, Rutigliano M, Ferro M, Giglio A, Intini A, Triggiano F, Palazzo S, Gigante M, Castellano G, Ranieri E, et al. Activation of the kynurenine pathway predicts poor outcome in patients with clear cell renal cell carcinoma. Urol Oncol. 2017;35(7):461 e15–461 e27. doi: 10.1016/j.urolonc.2017.02.011. [DOI] [PubMed] [Google Scholar]
- 26.Shepard PD, Joy B, Clerkin L, Schwarcz R. Micromolar brain levels of kynurenic acid are associated with a disruption of auditory sensory gating in the rat. Neuropsychopharmacology. 2003;28(8):1454–1462. doi: 10.1038/sj.npp.1300188. [DOI] [PubMed] [Google Scholar]
- 27.Siska PJ, Jiao J, Matos C, Singer K, Berger RS, Dettmer K, Oefner PJ, Cully MD, Wang Z, QuinnIII WJ, et al. Kynurenine induces T cell fat catabolism and has limited suppressive effects in vivo. EBioMedicine. 2021;74:103734. doi: 10.1016/j.ebiom.2021.103734. [DOI] [PMC free article] [PubMed] [Google Scholar]
- 28.Li H, Bullock K, Gurjao C, Braun D, Shukla SA, Bossé D, Lalani AKA, Gopal S, Jin C, Horak C, et al. Metabolomic adaptations and correlates of survival to immune checkpoint blockade. Nat Commun. 2019;10(1):4346. doi: 10.1038/s41467-019-12361-9. [DOI] [PMC free article] [PubMed] [Google Scholar]
- 29.Ray A, Song Y, Du T, Tai Y-T, Chauhan D, Anderson KC. Targeting tryptophan catabolic kynurenine pathway enhances antitumor immunity and cytotoxicity in multiple myeloma. Leukemia. 2020;34(2):567–577. doi: 10.1038/s41375-019-0558-x. [DOI] [PMC free article] [PubMed] [Google Scholar]
- 30.Pham HT, Ono M, Hara E, Nguyen H, Dang A, Do H, Komori T, Tosa I, Hazehara-Kunitomo Y, Yoshioka Y, et al. Tryptophan and kynurenine enhances the stemness and osteogenic differentiation of bone marrow-derived mesenchymal stromal cells in vitro and in vivo. Mate (Basel). 2021;14(1):208. doi: 10.3390/ma14010208. [DOI] [PMC free article] [PubMed] [Google Scholar]
- 31.Bishnupuri KS, Alvarado DM, Khouri AN, Shabsovich M, Chen B, Dieckgraefe BK, Ciorba MA. IDO1 and kynurenine pathway metabolites activate PI3K-Akt signaling in the neoplastic colon epithelium to promote cancer cell proliferation and inhibit apoptosis. Cancer Res. 2019;79(6):1138–1150. doi: 10.1158/0008-5472.CAN-18-0668. [DOI] [PMC free article] [PubMed] [Google Scholar]
- 32.Rad Pour S, Morikawa H, Kiani NA, Yang M, Azimi A, Shafi G, Shang M, Baumgartner R, Ketelhuth DFJ, Kamleh MA, et al. Exhaustion of CD4+ T-cells mediated by the Kynurenine pathway in Melanoma. Sci Rep. 2019;9(1):12150. doi: 10.1038/s41598-019-48635-x. [DOI] [PMC free article] [PubMed] [Google Scholar]
- 33.Kim JH, Lee WS, Lee HJ, Yang H, Lee SJ, Kong SJ, Je S, Yang H-J, Jung J, Cheon J, et al. Deep learning model enables the discovery of a novel immunotherapeutic agent regulating the kynurenine pathway. Oncoimmunology. 2021;10(1):2005280. doi: 10.1080/2162402X.2021.2005280. [DOI] [PMC free article] [PubMed] [Google Scholar]
- 34.Wang Y, Liu H, McKenzie G, Witting PK, Stasch J-P, Hahn M, Changsirivathanathamrong D, Wu BJ, Ball HJ, Thomas SR, et al. Kynurenine is an endothelium-derived relaxing factor produced during inflammation. Nat Med. 2010;16(3):279–285. doi: 10.1038/nm.2092. [DOI] [PMC free article] [PubMed] [Google Scholar]
- 35.Hartmann J, Schüßler‐Lenz M, Bondanza A, Buchholz CJ. Clinical development of CAR T cells—challenges and opportunities in translating innovative treatment concepts. EMBO Mol Med. 2017;9(9):1183–1197. doi: 10.15252/emmm.201607485. [DOI] [PMC free article] [PubMed] [Google Scholar]
- 36.Meireson A, Devos M, Brochez L. IDO expression in cancer: different compartment, different functionality? Front Immunol. 2020;11:2340. doi: 10.3389/fimmu.2020.531491. [DOI] [PMC free article] [PubMed] [Google Scholar]
- 37.Uyttenhove C, Pilotte L, Théate I, Stroobant V, Colau D, Parmentier N, Boon T, Van den Eynde BJ. Evidence for a tumoral immune resistance mechanism based on tryptophan degradation by indoleamine 2, 3-dioxygenase. Nat Med. 2003;9(10):1269–1274. doi: 10.1038/nm934. [DOI] [PubMed] [Google Scholar]
- 38.Wainwright DA, Chang AL, Dey M, Balyasnikova IV, Kim CK, Tobias A, Cheng Y, Kim JW, Qiao J, Zhang L, et al. Durable therapeutic efficacy utilizing combinatorial blockade against IDO, CTLA-4, and PD-L1 in mice with brain tumors. Clinical Cancer Research. 2014;20(20):5290–5301. doi: 10.1158/1078-0432.CCR-14-0514. [DOI] [PMC free article] [PubMed] [Google Scholar]
- 39.Long GV, Dummer R, Hamid O, Gajewski TF, Caglevic C, Dalle S, Arance A, Carlino MS, Grob -J-J, Kim TM, et al. Epacadostat plus pembrolizumab versus placebo plus pembrolizumab in patients with unresectable or metastatic melanoma (ECHO-301/KEYNOTE-252): a phase 3, randomised, double-blind study. Lancet Oncol. 2019;20(8):1083–1097. doi: 10.1016/S1470-2045(19)30274-8. [DOI] [PubMed] [Google Scholar]
- 40.Lynch KT, Gradecki SE, Kwak M, Meneveau MO, Wages NA, Gru AA, Slingluff CL. IDO1 expression in melanoma metastases is low and associated with improved overall survival. Am J Surg Pathol. 2021;45(6):787–795. doi: 10.1097/PAS.0000000000001622. [DOI] [PMC free article] [PubMed] [Google Scholar]
- 41.Mariotti V, Han H, Ismail-Khan R, Tang S-C, Dillon P, Montero AJ, Poklepovic A, Melin S, Ibrahim NK, Kennedy E, et al. Effect of taxane chemotherapy with or without indoximod in metastatic breast cancer: a randomized clinical trial. JAMA Oncol. 2021;7(1):61–69. doi: 10.1001/jamaoncol.2020.5572. [DOI] [PMC free article] [PubMed] [Google Scholar]
- 42.Song X, Sun P, Wang J, Guo W, Wang Y, Meng L-H, Liu H. Design, synthesis, and biological evaluation of 1, 2, 5-oxadiazole-3-carboximidamide derivatives as novel indoleamine-2, 3-dioxygenase 1 inhibitors. Eur J Med Chem. 2020;189:112059. doi: 10.1016/j.ejmech.2020.112059. [DOI] [PubMed] [Google Scholar]
- 43.Hopkins B, Zhang H, Bharathan I, Li D, Pu Q, Zhou H, Martinot TA, Fradera X, Lammens A, Lesburg CA, et al. Utilization of metabolite identification and structural data to guide design of low-dose IDO1 inhibitors. ACS Med Chem Lett.2021;12(9):1435–1440.doi: 10.1021/acsmedchemlett.1c00265. [DOI] [PMC free article] [PubMed] [Google Scholar]
- 44.Triplett TA, Garrison KC, Marshall N, Donkor M, Blazeck J, Lamb C, Qerqez A, Dekker JD, Tanno Y, Lu W-C, et al. Reversal of indoleamine 2,3-dioxygenase-mediated cancer immune suppression by systemic kynurenine depletion with a therapeutic enzyme. Nat Biotechnol. 2018;36(8):758–764. doi: 10.1038/nbt.4180. [DOI] [PMC free article] [PubMed] [Google Scholar]
- 45.Kawalekar OU, O’ Connor RS, Fraietta JA, Guo L, McGettigan SE, Posey AD, Patel PR, Guedan S, Scholler J, Keith B, et al. Distinct signaling of coreceptors regulates specific metabolism pathways and impacts memory development in CAR T cells. Immunity. 2016;44(3):712. doi: 10.1016/j.immuni.2016.02.023. [DOI] [PubMed] [Google Scholar]
- 46.Oda SK, Anderson KG, Ravikumar P, Bonson P, Garcia NM, Jenkins CM, Zhuang S, Daman AW, Chiu EY, Bates BM, et al. A Fas-4-1BB fusion protein converts a death to a pro-survival signal and enhances T cell therapy. J Exp Med. 2020;217(12): doi: 10.1084/jem.20191166. [DOI] [PMC free article] [PubMed] [Google Scholar]
- 47.McLellan AD, Ali Hosseini Rad SM. Chimeric antigen receptor T cell persistence and memory cell formation. Immunol Cell Biol. 2019;97(7):664–674. doi: 10.1111/imcb.12254. [DOI] [PubMed] [Google Scholar]
Associated Data
This section collects any data citations, data availability statements, or supplementary materials included in this article.