

Abstract
Restricting social distancing is an effective means of controlling the COVID-19 pandemic, resulting in a sharp drop in the utilization of commercial buildings. However, the specific changes in the operating parameters are not clear. This study aims to quantify the impact of COVID-19 lockdowns on commercial building energy consumption and the indoor environment, including correlation analysis. A large green commercial building in Dalian, China's only country to experience five lockdowns, has been chosen. We compared the performance during the lockdown to the same period last year. The study found that the first lockdown caused a maximum 63.5% drop in monthly energy consumption, and the second lockdown was 55.2%. The energy consumption per unit area in 2020 dropped by 55.4% compared with 2019. In addition, during the lockdown, the compliance rate of indoor thermal environment increased by 34.7%, and indoor air quality was 9.5%. These findings could partly explain the short-term and far-reaching effects of the lockdown on the operating parameters of large commercial buildings. Humans are likely to coexist with COVID-19 for a long time, and commercial buildings have to adapt to new energy and health demands. Effective management strategies need to be developed.
Keywords: Post Occupancy Evaluation, Pandemic lockdown, Indoor Environment Quality, Building Energy
1. Introduction
Coronavirus appeared in December 2019 (COVID-19) and was later declared a global pandemic in March 2020. [1], [2], [3] COVID-19 is mainly transmitted through respiratory droplets, aerosols, and indirect pollutants. Cross-transmission between people and animals has dramatically increased the potential impact of virus outbreaks. [4] Governments of all countries are taking necessary interventions, including restricting travel, reducing gatherings, maintaining social distance, etc. [5], [6], [7], [8] Wuhan was the first city in China to have a pandemic, and it was immediately lockdown for 76 days. During this period, the first round of self-quarantine was also started all over the country. The Chairman of the Kuhn Foundation of the United States and the International Society for Antiviral Research said, “China has taken a series of decisive and powerful measures and demonstrated an organizational capability unprecedented in the history of global health, which is difficult for other countries to achieve.” [9].
The pandemic lockdown has also had a meaningful impact on energy consumption worldwide. Fig. 1 shows the power demand changes in some countries in the first three quarters of 2020. In 2020, countries worldwide implemented lockdown policies and in some areas, the lockdown was implemented for several rounds. Electricity demand has decreased in most countries. [10], [11], [12], [13], [14], [15], [16] Industrial and commercial building energy demand has declined significantly in many countries, accompanied by an increase in residential energy demand. The International Energy Agency (IEA) predicted that global electricity demand would drop about 2% in 2020, the most significant annual drop since the mid-20th century. [17].
Fig. 1.

Decrease in electricity demand by country in the first three weeks of March 2020[10], [11], [12], [13], [14], [15], [16].
New York has been severely affected by COVID-19. Compared with February in 2019, the daily power demand or average daily consumption in the same period of 2020 decreased by 2.9%, and the hourly decrease in March was 6.4%. [18], [19] The peak demand for electricity in Italy's power grid dropped by about 3–4% at the beginning of the lockdown. When the total lockdown is implemented, the peak demand and total daily energy decrease by 6–10% on weekends and 18–22% on weekdays. [20] Affected by the pandemic lockdown, the total electricity demand in Australia decreased by 6.7% in March, [21], but residents' electricity demand in Victoria increased by 14%. [22] In addition, combined data from the United States, Europe, and India showed that public electricity demand fell by 15% during the most stringent restriction period, while residential electricity consumption increased by 5% [23].
Fig. 2 shows the year-over-year changes in electricity demand in some countries' first three quarters of 2020. Spain is one of the EU countries most affected by the epidemic. From mid-March to the end of April, its electricity consumption dropped by 13.49% from the previous five years' average. [24]. Industrial electricity consumption in the UK fell by 17% from April to June 2020 compared with the same period last year, and commercial building electricity demand fell by 19%. Compared with other countries in the region, Argentina adopted relatively strict lockdown measures at the end of March. The decline in industrial electricity demand was particularly pronounced in the second quarter, with a 21% year-on-year decline and a 15% drop in commercial building electricity demand. Interestingly, China seemed rising electricity demand in 2020. However, its estimated demand growth of about 2% was still lower than the average level of 6.5% since 2015. [17] Most of the research on the influence of pandemics on people's lives is also aimed at residential buildings. [25], [26], [27]. The energy change of residential buildings has also become the focus of research.
Fig. 2.

Year-over-Year Changes in Electricity Demand in the First Three Quarters of 2020 [17].
The pandemic significantly affects commercial buildings with the most frequent social activities. On the one hand, “studying or working from home” became a common practice during the pandemic, and more than 50% of people experienced remote working in this pandemic. [13] The electricity demand of residential buildings has dramatically increased, while the electricity demand of commercial buildings (offices, shopping malls, etc.) has decreased. [28], [29] Changes in the utilization rate of commercial buildings directly affect the user demand and energy consumption of commercial buildings. [30] On the other hand, the spread of the virus indoors is closely related to temperature, humidity, sunshine, ventilation, and other conditions. [31], [32], [33], [34].
The virus spread faster under specific humidity [35] and indoor temperature [36]. For example, dried viruses can retain their viability for five days at 22–25 °C and 40–50% relative humidity under normal indoor conditions. [33] Improper disinfection and defective piping systems can also promote the spread of the virus. [37] Even in the absence of a pandemic, high levels of PM2.5 and PM10 will have adverse effects on human health. [39] As people stay indoors for a longer time during the epidemic, the indoor PM2.5 concentrations are twice as high as usual, and the indoor environment quality (IEQ) has deteriorated. [40] A well-designed and operated HVAC system can reduce the risk of virus spread. [41] For example, increasing air movement can significantly limit viruses that rely on airborne transmission. [42].
According to literature review results, social distancing restrictions caused by the outbreak of COVID-19 have been shown to impact building energy consumption and the indoor environment significantly. Unfortunately, there is currently insufficient research on the magnitude of the impact. Few papers have used detailed measurements to underpin research, as researchers were not allowed to enter during the lockdown. The energy consumption pattern of commercial buildings has apparent temporal and spatial variability, especially for exhibition buildings. People's living habits are constantly changing, and the difference between the energy consumption and physical environment parameters observed in the lockdown state and the normal state may exceed our imagination. Therefore, it is indispensable to conduct long-term physical environment monitoring and adopt appropriate adjustment strategies.[25] For example, improving the natural ventilation of buildings [43] and increasing the ventilation volume [44] can achieve good indoor air quality and energy-saving, thus reducing energy consumption and effectively controlling the spread of viruses. [35].
Due to the lockdown situation, these parameters are essential performance references for buildings in similar events in the future. Especially in China, it has a large population base, and coastal cities with cold chain logistics have a higher probability of being infected than ordinary cities, such as Dalian. It will have a considerable impact on the energy and indoor environment of the commercial building, as lockdowns will be frequent.
China's State Administration of Cultural Heritage issued a notice during the lockdown, asking local public cultural service agencies to strictly control the number and scale of mass cultural events. [45] Under the call of national policies, local policies are usually stricter. The Dalian Municipal Government issued a notice requiring that all public places be closed and strictly controlled if infected persons are in the area.[46] But public spaces in other areas are often closed to prevent unforeseen situations.
In this study, Dalian, the only city in China that has currently experienced five pandemic lockdowns, was selected. The research was based on investigating the building operation status of a commercial building in 2019–2020 and the data collection of the energy consumption monitoring system. We use statistical controlled variables to select typical months and days for comparison before and after the lockdown, including hourly energy consumption and sub-metering. The measurement of indoor environmental parameters mainly includes indoor temperature, humidity, CO2 concentration and PM2.5 concentration. The compliance rate compared with the design standard is calculated. This study aims to indicate the impact of the COVID-19 lockdown on building energy consumption and indoor environmental parameters and put forward forward-looking suggestions to deal with virus transmission in the future. COVID-19 has significantly impacted human activities, and commercial buildings need to adapt to new environments and seek changes. And all of this relies on the mining of commercial building-related data.
2. Research objects and methods
In this study, Dalian is a typical coastal high-density city with the characteristics of a cold region in China. The building energy consumption, environmental parameters and compliance rate were comprehensively analyzed based on data collection.
2.1. Climate characteristics and information of commercial buildings in Dalian
Fig. 3 shows the annual temperature and relative humidity changes in Dalian. The average yearly temperature is 10.4 °C, the average maximum temperature in summer is 27.3 °C, and the relative humidity is 83%. The average minimum temperature in winter is −8.2 °C. The relative humidity was 58%. The annual average precipitation is 658.7 mm. The maximum daily rainfall is 171.1 mm and the maximum hourly rainfall is 67.8 mm. [47] Dalian is also an important port city for China's frozen seafood imports. The risk of virus infection is greater than that of most cities in China. It is even more necessary to strengthen corresponding virus prevention and control measures.
Fig. 3.

The climate characteristics of Dalian [47].
Dalian experienced COVID-19 pandemic in January, July and December 2020 and May, July 2021, and became the only city in China blocked five times. The first lockdown was affected by the pandemic situation in Wuhan, while the second lockdown and the third lockdown were both caused by cold chain transportation. The lockdown impact analysis showed the characteristics of fast transmission speed, many scenes involved and strong transmission power, and even the phenomenon of super transmission appeared. Consequently, a large commercial building was selected as the research object of this paper. It reflects the typical characteristics of its energy consumption and indoor environmental parameters affected by the lockdown.
The selected building is a one-star certificated green building used in 2016, with a total floor area of 30000 m2. This building has one underground floor and four above-ground floors, with a height of 30.7 m. This building is majorly used as an exhibition, office and performance, with a large built-in exhibition hall. The building has a total of about 120 staff and receives about 500 tourists every day. The building is open daily from 9 am to 4 pm and is closed on Mondays. During the lockdown period, the opening and closing time of the commercial building was constantly adjusted with the pandemic change. Fig. 4 shows the timeline of the Dalian lockdowns and data acquisition interval. Affected by the Dalian epidemic, the first lockdown of the building was from January 23 to March 24, 2020. The second lockdown period is from July 22 to August 18, and the third lockdown period is from December 16 to April 1 of the following year. The data range for this study is mainly for the first two lockdowns. The monitoring of the indoor environment of the building covers the pre-, middle- and late-stage of the first lockdown and the middle-and late-stage of the second lockdown. Energy consumption data are collected for the whole year of 2019 and the first eight months of 2020. The monitoring period of indoor environmental parameters is from July to August 2019 and from December to the end of August 2020.
Fig. 4.

Essential events in Dalian affected by COVID-19 pandemic and data acquisition interval.
2.2. Data acquisition of energy consumption
The energy consumption data were collected throughout the lockdown period. Through the statistical method of control variables, the typical months and typical days during the COVID-19 lockdown were selected to comparative analyze the measured values at the same time when there is no epidemic. Meanwhile, we explore the annual energy consumption law to further analyze the pandemic's lockdown impact. We selected four typical consecutive days and covered weekends. Because this building typically hosts more visitors on weekends and the energy consumption data is representative. To compare the energy consumption with and without lockdowns in 2019 and 2020, we selected three representative lockdowns: the lockdown in February 2020 represents the heating season, the lockdown between July 9 to August 8 represents the cooling season, the lockdown in May represents the transition season. The characteristics of energy consumption and sub-metering are examined. Table 1 shows the sub-metering items of this building.
Table 1.
Sub-item method of building electricity consumption.
| First-level electricity sub-item | Secondary electricity sub-item | Name of electrical appliance |
|---|---|---|
|
Electricity for lighting sockets |
Electricity for sockets | Exhibition power supply, power supply chassis |
| Electricity for lighting | Public area lighting, emergency lighting | |
|
Air conditioning electricity |
Electricity for hot and cold stations |
Chiller plant |
| Electricity at the end of the air conditioner |
Air conditioner, indoor side fan, hot air curtain | |
|
Power consumption |
Electricity for elevators and roller shutters | Elevators, escalators, fire shutters |
| Electricity for water pumps except for air conditioning and fire fighting |
Water tank room |
|
| Electricity for ventilators except air conditioning and fire | Smoke exhaust machine room, fresh air ventilator | |
|
Other electricity |
Information center electricity | Master control screen, monitoring room |
| Kitchen electricity | Kitchen power supply, kitchen exhaust fumes | |
| Electricity for laundry room, shower room, underground air defense or other special equipment | ||
2.3. Measured parameters of the indoor environment
In this study, monitoring equipment was put in before the lockdown to obtain data on the indoor environment of buildings in winter. Afterward, due to the COVID-19 outbreak, equipment was not taken out until the lockdown eased. The indoor environmental quality measurement equipment uses the IBEM environmental quality monitor, which measures indoor temperature, humidity, CO2, and PM2.5. We select the following periods in this study: February 14 to 17 (before the COVID-19 outbreak, heating season); August 8 to 11 (before the COVID-19 outbreak, non-heating season); May 14th to 17th (after the COVID-19 outbreak, transition season). The space types investigated in this study include public space, office space, and exhibition space. The shared space consists of a foyer and walkway. Office space comprises offices rooms, multi-function halls and conference rooms. The exhibition space includes exhibition halls, libraries open to the public, lounges, etc.
Table. 2 is the measured relevant information. Considering the distribution information of building users and functions, 19 devices are placed in each division of each floor at a distance of 0.75 m or 1.2 m from the ground. There are ten exhibition halls, six office areas and four public areas. We chose typical months for different seasons throughout the year for continuous monitoring. The operating hours of the building are from 9:00 to 16:30, and it is closed every Monday. Therefore, the measured data from 8:00 to 17:00 is retained for analysis.
Table 2.
Basic information of indoor environment measurement.
| Information | Public Area | Exhibition Hall Area | Office Area |
|---|---|---|---|
| Equipment Quantity | 4 | 10 | 6 |
| Functional Space | Foyer, Corridor, etc. | Exhibition hall, Library, etc. | Office, meeting room, etc. |
| Time | Every Tuesday to Sunday from 8:00 to 17:00 | ||
| Device Height | 0.75 m or 1.2 m from the ground to each partition on each floor | ||
|
Locations |
 |
 |
 |
3. Results
3.1. Typical monthly energy consumption analysis
Fig. 5 describes the sub-item comparison of building operating energy consumption in typical months before and after the pandemic lockdown. We selected the year 2019 as the benchmark. In February, the energy consumption can drop by 63.5% compared with the benchmark as an immediate impact of the lockdown. The closure of the whole month in February 2020 affected the electricity consumption of lighting the most, which decreased by 72.4% year-over-year. Other electricity consumption has a significant correlation with the working conditions of employees in the project, and the decline under the condition of no one using it is predictable. In July 2020, the energy consumption per unit area was 3.59 kWh/m2. It is worth noting that the COVID-19 outbreak in Dalian was well controlled before July, and accordingly, the lockdown policy has gradually relaxed. The building operated as usual from July 8th to 23rd.
Fig. 5.

Sub-item comparison of building operating energy consumption in typical months before and after the lockdown.
However, on July 22nd, a new local confirmed case was confirmed in Dalian. As a result, the target building was shut down again on July 24th. Therefore, although this value includes the average operation period, there are almost no tourists in the venue. Only the staff were working in the building. Then, we can see that in July and August 2020, air conditioning accounted for the most significant proportion of electricity consumption. Its electricity consumption decreased by 55.0% compared with the benchmark, obviously affected by the lockdown. May is the month with the lowest energy consumption among the three typical months selected due to the lowest electricity consumption of air conditioners and the apparent reduction of electricity consumption of sockets.
The building was operated as normal in May of 2019 and 2020. As a result, it is also the month with the most negligible difference in energy consumption change. In May 2020, there was little difference in energy consumption level after the first lockdown, indicating that it had gradually recovered to the primary level. Total energy consumption during building closures was significantly lower than in 2019. The energy consumption value corresponding to each energy consumption sub-item has decreased, reflecting the clear reduction in the energy demand of commercial buildings during the lockdown period.
3.2. Daily energy consumption analysis
The daily changes of annual energy consumption are shown in Fig. 6, Fig. 7, Fig. 8 . We further collected yearly building energy consumption data to analyze the differences. The sample covers the daily energy consumption changes from January 2019 to August 2020, which is divided into winter (January-March), transitional season (April-May), and summer (June-August).
Fig. 6.

Changes in daily energy consumption in winter.
Fig. 7.

Daily energy consumption changes during the transition season.
Fig. 8.

Changes in daily energy consumption in summer.
Fig. 6 is an analysis of daily energy consumption in winter. The building officially closed on January 23. The lockdown was later eased, and it reopened on March 24. The building was left unoccupied during the lockdown. Our research found that before the outbreak, the general trend of sub-metering and total energy consumption was similar in the same season of 2019 and 2020. Although COVID-19 has already attacked Wuhan, Dalian was not substantially affected. In terms of specific items, lighting consumes the highest electricity. It changes periodically, and the difference in electricity consumption on working days is insignificant. Electricity consumption is maintained at the same level, between 1791 and 1973 kWh. In these two years, air-conditioning consumes less electricity than other categories. Its working day electricity consumption changes significantly without a noticeable periodic change trend. In addition to the lowest energy consumption on weekly rest days, the energy consumption is more down on two days of the week because of the decrease of visitors.
Compared with 2019, the energy consumption of air conditioning is lower, and the power consumption on weekdays is the least. The higher value trend of other power consumption is consistent with air conditioning. When the number of users in the project is large, other electricity consumption and air conditioning change are most apparent.
After the closing of the building, the electricity consumption of each sub-item fluctuated slightly in 2020, maintaining the normal business non-working day energy consumption level. This change is closely related to the decline in occupancy. As the primary function of the building is the exhibition, the decline in electricity consumption for lighting is most prominent. At the same time of 2019, except for the low energy consumption during the Spring Festival holiday, the changing trend of lighting electricity was consistent at other times. The electricity consumption of air conditioners increased within one week after the Spring Festival, reaching between 1682kWh and 1891kWh.
Considering that there is no natural ventilation in the venue, the indoor temperature of the venue without personnel is lower. The terminal load of the hot air curtain and basement air conditioner increases rapidly, and the electricity consumption of the air conditioner increases in a short time. The difference in air conditioning power consumption in subsequent working days is slight, showing an apparent periodic change trend, ranging from 1118kWh to 1256kWh. The peak value of power consumption and Other electricity consumption is lower than before the Spring Festival, and the general trend remains unchanged.
Fig. 7 is an analysis of daily energy consumption during the transition season. We found that the overall energy consumption value was significantly lower than the same quarter of the previous year. Moreover, before the COVID-19 outbreak, the energy consumption in the transitional season of 2019 was slightly higher than in 2020. Even when the COVID-19 is well controlled, gathering activities were not encouraged, and the number of visitors was limited, reducing the electricity consumption. The electricity consumption for lighting was the highest. In early April of two years, the electricity consumption for lighting was the same as last month, ranging from 1445kWh to 1857kWh, gradually decreasing, showing seasonal influences. The electricity consumption of air conditioners changed markedly.
In the first week of April 2019 and 2020, the electricity consumption increased and decreased to a lower level. The electricity consumption of air conditioning in two years was between 370kWh and 742kWh. The median in 2020 was 370kWh, which was 16.8% lower than that in 2019. After mid-May 2019, the electricity consumption of air conditioning gradually increased, but remained lower than the same period in 2019. The power consumption in the two years was almost the same. The power consumption value is much smaller than other electricity consumption, and the epidemic's impact is minimal.
In 2019, the particular electricity consumption fluctuated. The energy consumption level on working days was the same, with the electricity consumption ranging from 694kWh to 831kWh, which was higher than the same period in 2020. After the first lockdown in 2020, the special electricity consumption will gradually increase. On the one hand, the project's operation has improved and steadily adjusted to the normal operation state. On the other hand, considering that the epidemic has just eased, buildings are usually sterilized due to policy restrictions. The increase in electricity consumption is mainly reflected in the special electricity consumption.
Fig. 8 shows the daily energy consumption of 2019 and 2020 in summer. Affected by the second epidemic in Dalian, the building was officially closed on July 22 and did not reopen until August 18. Summer's total construction energy consumption is the highest for this commercial building, majorly driven by the significant increase in lighting and air conditioning electricity consumption. In 2019, the electricity consumption of air conditioning gradually increased from a low level of 487kWh in early June to a high level of 4715kWh in mid-July. The growth curve is exponential, with a growth rate of 868.17%. In 2020, the electricity consumption of air conditioning also showed an increasing trend, but a lower growth rate than the same period in 2019, which increased from 373kWh in early June to 2655kWh in early July, with a growth rate of 611.80%. It can be seen that in the summer, the impact of blocking on the total energy consumption and growth rate of construction is significant. The difference in growth is even more than 250%.
The growth trend of lighting power consumption in 2019 and 2020 is consistent with the trend of air conditioning, showing a gradual upward trend. The growth rate in 2019 was 329.41%, which was lower than the growth rate of air conditioning. Influenced by the COVID-19 outbreak, the growth rate dropped to 132.48% in 2020. In July, the electrical amount of the socket lighting is almost consistent with the air conditioner, but it is significantly reduced compared to 2019. In 2020, the electricity consumption at the same time would be between 231kWh and 302kWh. Under the normal operating conditions in summer, the power consumption was not affected by the lockdown situation, but by the activities within the project or other human factors.
To conclude, in 2020, the total energy consumption decreased significantly. Lighting consumes the most energy, while the electricity consumption of air conditioners fluctuates wildly, ranging from 223 kWh to 651 kWh. The power consumption and the other electricity consumption showed a gradually decreasing trend in the pandemic lockdown.
3.3. Typical daily energy consumption correlation
To explore the impact of the lockdown on the correlation between energy consumption and environmental factors, we selected typical working days before and after the lockdown in summer for analysis, using the Pearson correlation coefficient (PCCs) to determine. The most significant difference between the two typical days is whether the lockdown happened or not. The reason for choosing summer is because the building energy consumption level is significantly higher than other seasons during this period, and the environmental parameters change significantly. If lockdown occurs at this time, the effect on the correlation factor may be readily observable. This chapter will show the difference between the unmanaged state of the building and the day-to-day state, which is rare in the current literature.
The correlation heatmap before lockdown is shown in Fig. 9 . We found a significant positive correlation between building energy consumption and all environmental factors, except indoor humidity. Analysis of the data found that the building interior humidity remains at 80–84% throughout the day on a typical day. Its changing trend is not much related to energy consumption. Among the factors affecting indoor humidity, outdoor humidity has the highest PCCs of 0.61. It indicates that the dehumidification effect of the building may be limited, and the indoor humidity cannot be effectively reduced, which can be regarded as a practical problem in the building operation. The PCCs of indoor illuminance were the highest at 0.92. Considering that the primary function of the building is the exhibition, the interior lighting equipment is more than that of ordinary buildings, and the impact on energy consumption is predictable.
Fig. 9.

Heatmap of energy consumption correlation before the lockdown.
In summer, the flow of people in the building is large and gathers quickly. The heat and CO2 etc., produced will increase rapidly. Considering that large spaces dominate the building, the building's air conditioning and fresh air systems need to operate more powerfully and continuously filter the air to keep the interior comfortable. They are challenging to close briefly because the indoor environment can deteriorate rapidly. Building energy consumption typically remains high throughout the working hours.
The correlation heatmap after lockdown is shown in Fig. 10 . It can be clearly found that the impact of most environmental factors on energy consumption has begun to weaken compared to before the lockdown. For example, indoor PM2.5 and indoor CO2 are essential factors affecting energy consumption, and typically represent changes in building occupancy. But post-lockdown PCCs fell on average by about 0.2, indicating that buildings were left unoccupied. Consider that almost all building systems are shut down at this time, leaving only emergency electrical equipment. As a result, the correlation of indoor lighting has dropped significantly and is no longer the first influencing factor. Building energy consumption has remained low, peaking at just one-seventh of what it was before the lockdown. The correlation between outdoor temperature and outdoor humidity and building energy consumption is the highest, proving that the indoor environment's influence is weakening.
Fig. 10.

Heatmap of energy consumption correlation after the lockdown.
It is worth mentioning that the correlation between outdoor and indoor starts to account for the most significant proportion for the same parameter. It is very different from pre-lockdown, as PCCs are high with almost all other factors (e.g., the pre-lockdown indoor temperature is close to extreme PCCs with most other factors). After the lockdown, the PCCs between the indoor and outdoor temperature was 0.8, the indoor and outdoor humidity was 0.67, and the indoor and outdoor PM2.5 even reached 0.91. In short, after the lockdown, the interference of the outdoor environment on the interior is enhanced. But not all of them get a very high level, because the building itself is a relatively closed “container.”.
3.4. Indoor air quality of buildings
Fig. 11, Fig. 12 shows that the lockdown affects indoor air quality. The compliance rate during the lockdown increased by 9.5% on average. The concentration of PM2.5 and CO2 decreased during the lockdown in office, public and exhibition hall areas: PM2.5 decreased by 28% on average, and CO2 decreased by 12%. When the COVID-19 was well controlled, the number of occupants gradually increased. For instance, office workers resume their daily work. Due to the pandemic lockdown, the ventilation of the buildings has been improved. The air quality has become better. Among them, the average recovery rate of the office area is the largest, which is 23%.
Fig. 11.

The overall distribution of PM2.5 in buildings.
Fig. 12.

The overall distribution of indoor CO2 in buildings.
As shown in Fig. 13, Fig. 14, Fig. 15 , before the pandemic lockdown, the average concentration of PM2.5 in the exhibition hall was 19.9–30.5 μg/m3. The standard deviation was 36.2, and the distribution was scattered, with the peak value reaching 87.7 μg/m3 in some areas. Compared with the IAQ standard, the incompliance rate was 8.2%. [48] After that, affected by the lockdown, the PM2.5 value decreased by 34% on average to 15.4–22.3 μg/m3, and the incompliance rate was only 0.9%, which was relatively stable on the whole. In the post-pandemic period, the building was opened. In some periods, PM2.5 exceeded the pre-pandemic level. It is because the building is totally shut down and not well maintained. When the venue reopened, the staff cleaned the building and opened the ventilation system. After investigation and inquiry, it was mainly concentrated before and after the museum's opening at 9:00 in the morning. At the same time, a small number of tourists entering the venue and the activities of the staff contributed to this phenomenon.
Fig. 13.

Hourly average air quality in the exhibition hall area.
Fig. 14.

Hourly average air quality in the office area.
Fig. 15.

Hourly average air quality in the public area.
The office area is the first space affected by personnel activities after the outbreak. Before the outbreak, PM2.5 fluctuated between 24.1 and 27.5 μg/m3, with a peak value of 64.8 μg/m3 and an incompliance rate of 5.3%. The average decrease was 29% during the lockdown period, ranging from 14.1 μg/m3 to 21.2 μg/m3, and the incompliance rate dropped to 1.3%. After the lockdown, with the gradual resumption of office work, the average value of PM2.5 rose rapidly. It reached the approximate level before the pandemic, but the peak value decreased by 35% compared with before the pandemic. This is caused by the fact that not all the venue staff have returned to work.
The main types of space used in public areas are coffee shops, book bars, etc., which are densely populated. Before the pandemic, the PM2.5 value in this area was 22% higher than that in offices and exhibition halls on average. It ranged from 28.8 to 46.0 μg/m3 with a peak value of 131.6 μg/m3. Moreover, before the epidemic, PM2.5 in public areas did not meet the standard from 11:00 to 14:00, above the standard by 37%. During this time, the staff will gather here to relax, and the fresh air system alone may not meet the standard requirements. We suggest that windows be opened appropriately to increase natural ventilation to maintain good air quality. At the same time, as a northern city, Dalian has dramatically increased its coal consumption for domestic heating in recent years.
The decrease in temperature increases the exhaust emission of motor vehicles, which leads to higher outdoor PM2.5 in autumn and winter. Air enters the room through infiltration, increasing PM2.5 concentration in public areas. With the resumption of venue management after the pandemic, people are prohibited from gathering in this area, thus keeping PM2.5 low. The average PM2.5 value in office and exhibition hall areas complies with the standard.
The CO2 concentration in public and office areas before, during and after the pandemic were similar. Affected by office workers returning to work, it quickly rose to the previous level after the lockdown, floating around 450 ppm. Due to the closure of venues in the outbreak, the CO2 value in each space was maintained at 400 ppm. The exhibition hall is the primary use space, and the average distribution of CO2 before the pandemic is 488.5–540.9 ppm. On average, the peak value is 11% higher than office and public space, and the standard deviation is 29.6. After the lockdown, it rebounded slightly, and the change was smaller than that of the office and public. Generally speaking, the CO2 compliance rate of each space in the building is 100%.
3.5. Indoor thermal environment of buildings
Fig. 16, Fig. 17. The average temperature drop in the lockdown was 14%. Humidity changed extensively before, during and after the COVID-19 outbreak. The average decrease during the lockdown was 44%, and the average increase after the pandemic was 56%. It is because the building stopped operating during the lockdown. At this time, the average outdoor humidity is 48%, and moisture enters the room through uncontrolled infiltration to keep the venue's humidity low. With the reopening of the building, the fresh air system operates to maintain the humidity in the appropriate range.
Fig. 16.

The overall distribution of indoor temperature in the building.
Fig. 17.

The overall distribution of indoor humidity in the building.
The temperature and humidity data in the exhibition hall area are scattered in a wide range during and after the pandemic. It might be because of the building's gradual suspension of the district heating system. Moreover, the exhibition hall covers a large area, and the outdoor humidity increases continuously in spring after the pandemic, which causes the fluctuation of temperature and humidity. Generally speaking, the compliance rate of the thermal environment (temperature and humidity) increased by 34.7% on average during the lockdown period.
As shown in Fig. 18, Fig. 19, Fig. 20 , during the non-heating season before the epidemic, the temperature of the exhibition hall area was maintained at 21.2 °C. The public space was at 23.7 °C, and the office area was at 24.2 °C. The overall fluctuation was slight. However, according to the specification, the compliance rate of the exhibition hall area was relatively low, which was 41.3%. [48] Over-cooling was identified in the exhibition hall area during some periods, which will increase unnecessary building energy consumption without improving comfort. We recommend adjusting the central air-conditioning settings to ensure that the indoor temperature is appropriate while meeting energy-saving requirements.
Fig. 18.

Time-averaged thermal environment in the exhibition hall area.
Fig. 19.

Time-averaged thermal environment in the office area.
Fig. 20.

Time-averaged thermal environment in the common area.
After the COVID-19 outbreak, the temperature in each space rose slightly, and the overall compliance rate was high. The temperature of the office area was maintained at 22.4–23.7 °C, fully complying with the thermal comfort standard. In addition, exhibition halls and public areas have changed little. Because the venue has just been unsealed, and personnel access is strictly controlled. The building was deserted most of the time, and the temperature change was not noticeable.
Similar to temperature changes, the humidity of venues remains stable in daily management. However, the moisture in public, office and exhibition halls exceeded the standard by 13% on average in a non-heating season before the lockdown. The public area has the highest relative humidity of 81.6–82.9%. Dalian had a higher ambient humidity level in the summer before the pandemic. Indoor humidity is greatly affected by outdoor; dehumidification is necessary to control the relative humidity. During the COVID-19 outbreak, the humidity in the exhibition hall area was the lowest at 40% because it was winter. After the pandemic, the humidity in public spaces is relatively high in some periods, caused by users opening windows for ventilation and outdoor water vapor entering the room.
Generally speaking, the humidity compliance rate before the pandemic was 32.4%, and the compliance rate during and after the pandemic was about 85.7%. Humidity in summer should be considered in buildings to improve the running performance of equipment.
4. Discussion
Fig. 21 reflects the change in energy consumption by August 2020 compared with 2019. Suppose we define the regular operating hours of buildings as 8 am to 5 pm. In that case, we find that when the first lockdown was strictly implemented, the electricity consumption of the investigated building decreased by 63.50% in February compared with the similar month of the previous year. It reflected the impact of the full implementation of the lockdown policy, and commercial buildings closed quickly in a short period.
Fig. 21.

Changes in energy consumption by August 2020.
Later, with the relaxation of restrictions, the building energy consumption in the later period of the pandemic lockdown gradually recovered to the daily level in April, May, and June. However, there was still a gap of about 20%. It can be used to reference the initial performance difference of commercial buildings after significant events. During the second COVID-19 outbreak, buildings decreased by 38.9% year-on-year in July and 55.4% in August. However, it should be noted that the building was officially closed on July 24th and reopened on August 18th. If the city lockdown was strict in July and August, the data reduction might increase. Because building air conditioning power consumption peaks in summer, seasonality significantly affects energy consumption.
Fig. 22 shows the correlation analysis between hourly energy consumption and indoor and outdoor environmental parameters from August 1 to August 31, 2019. When the building is in regular use, energy consumption is significantly related to the outdoor temperature and wind speed, indoor temperature, PM2.5 and CO2 concentration. Energy consumption has the most significant positive correlation with indoor CO2 concentration and the most considerable negative correlation with indoor temperature. Moreover, there is an excellent relationship between outdoor temperature and indoor environmental parameters. In addition, indoor and outdoor humidity are closely related, indicating the tremendous pressure of the air conditioning system in summer.
Fig. 22.
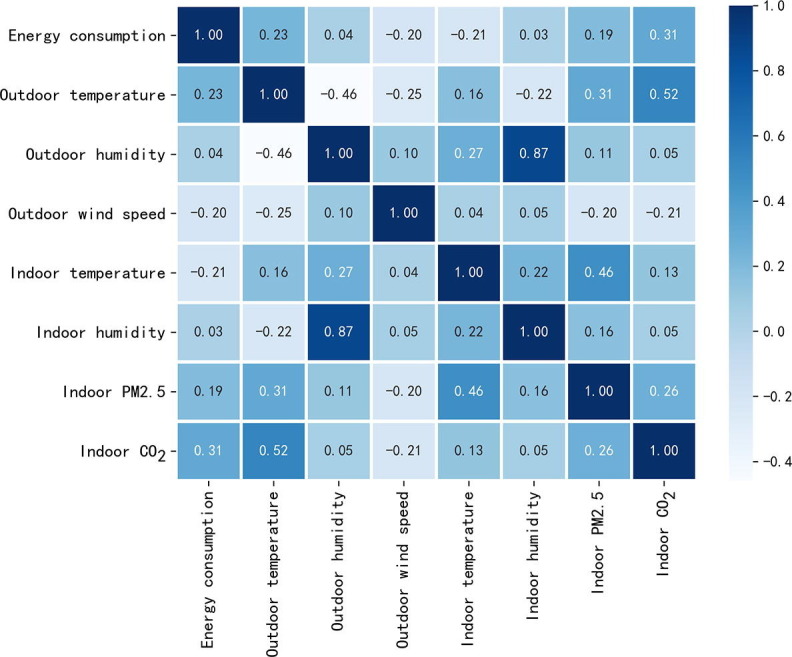
Correlation analysis between energy consumption and indoor and outdoor environmental parameters from August 1 to August 31, 2019.
As shown in Fig. 23 , our research on sub-metering data proves that air-conditioning consumption experienced the most significant reduction during the COVID-19 outbreak. An average of 37.3% reduced energy consumption. It is worth mentioning that the power consumption and the other power consumption increased more in June. China strictly controls the daily disinfection of public places, resulting in this part of the electricity consumption. The electricity consumption of building pumps, ventilators and manufactured water increased sharply in early summer, the lasting impact caused by the pandemic lockdown. Moreover, if the pandemic situation is not effectively controlled, this increase in energy consumption may last for a long time.
Fig. 23.

Relative changes in electricity consumption by item in 2020.
As shown in Fig. 24 , we compare the energy consumption per unit area for the whole year of 2019 and 2020, and we can find that the trend lines of the two are similar, with an average difference of 55.4%. The epidemic's impact on the energy consumption of large commercial buildings in cold regions referred to a certain extent from this result. The average reduction in energy consumption affected by the epidemic is a reference value for decision-makers to predict the energy consumption performance of buildings in the future. Beijing Energy Conservation and Environmental Protection Center of China has collected energy consumption data of 20 large commercial buildings in the city. Energy consumption in commercial buildings fell by an average of about 51 percent during the lockdown period, but the data collection lasted for only one week.
Fig. 24.

Comparison chart of energy consumption trend per unit area.
As the energy consumption patterns of different building types may be quite different, the reference of this result needs to be considered. [49] One contribution of this study is that we provide a more comprehensive database including different seasons and covers multiple weeks. Previous literature studies also mentioned the degree of energy consumption reduction in various countries. Still, the specific data related to the energy consumption of large commercial buildings is limited. We found that comparing studies of the energy consumption changes of commercial buildings with before, during and after the COVID-19 outbreak was lacking. Instead, our results can be used as a reference. It is vital to let stakeholders know that the influence of the pandemic lockdown on commercial buildings’ energy consumption may be higher than we expected.
At present, many studies mention that lockdown has dramatically improved outdoor air quality, [50], [51], [52] as human activities, which leads to air pollution, reduced significantly. The results showed that the indoor thermal environment and air quality compliance rates increased by an average of 34.7% and 9.5% during the lockdown. As shown in Fig. 25 , for example, in February, the building was completely shut down, the energy consumption was generally low, and the indoor environment was more vulnerable. The average temperature decreased by 17.6% and the average humidity increased by 28.1%.
Fig. 25.

Indoor environment and energy consumption distribution in the first eight months of 2020.
Compared with January, CO2 concentration decreased by 12.8% on average, while PM2.5 showed significant fluctuations. These are the changes of architecture without the intervention of human behavior, which have essential reference significance. In summer, the outdoor temperature and humidity are relatively high. If the building is shut down at this time, the energy consumption will decrease more significantly than that in other months. It is consistent with the previous analysis results.
In addition, we found that there was a regular operation of the target building before the COVID-19 outbreak. For example, the air conditioner in the exhibition hall area is over-cooled, and the average temperature is 12% lower than the standard requirement. It reflects the building operation and maintenance have room for improvements. Building operation has an enormous influence on energy consumption. Some behaviors such as “close the door and close the window,” “avoid turning on the lights during the day” can reduce building energy consumption. Therefore, strict management, improving the operation and maintenance of commercial buildings is one of the most effective measures to save energy.
Our results shed light on the influence of the COVID-19 lockdown on buildings. We expect what we found in this target building also could happen in other buildings. Due to the current research gap, it is necessary to share more energy consumption data and indoor physical parameter analysis related to the lockdown in different parts of the world. We believe this research will contribute to investigating how lockdowns have affected the energy efficiency of large commercial buildings. It will help to make more detailed comparisons between different regions globally. However, it is not clear to what extent the above changes in energy consumption and indoor physical parameters indicate the performance of future buildings in similar events. On the one hand, the pandemic may last for several years, confirmed by Zhang Wenhong, director of the National Center for Infectious Diseases Medicine. [53].
Therefore, even without any lockdown measures, the lifestyle during the pandemic may continue, such as daily disinfection and restrictions on crowd gathering. On the other hand, the buildings studied in this paper have experienced two shutdowns, after which the building performance gradually returned to normal, and we still need to continue to monitor the impact of shut down policies on the operation of commercial buildings. Suppose the energy consumption pattern changes in the future. In that case, both people's energy bills and the government's operational planning would be affected. Commercial buildings may need to adapt to this change to further optimize energy performance and indoor environmental quality.
5. Conclusion
The lockdown situation provides a unique chance to test the operational performance of commercial buildings. This paper studies the energy consumption pattern and indoor air quality of a large green commercial building in Dalian, China, by caring its performance before, during, and after the COVID-19 outbreak. The data covered typical months of the first and second lockdown in 2020, while the operational data for 2019 was used as a benchmark.
The results showed that during the lockdown period, the energy consumption of the large commercial building was significantly reduced. The first lockdown resulted in a monthly energy consumption decline of 63.5%, and the second lockdown was 55.2%. Compared with 2019, building energy consumption decreased by an average of 55.4% in 2020. During the lockdown, improvements in outdoor air quality affected the indoor environment. The indoor thermal environment and air quality compliance rate increased by 34.7% and 9.5%, respectively. In addition, we also found that before the lockdown, the indoor air quality of the building did not meet the standard, and problems such as insufficient dehumidification and excessive cooling in summer needed to be solved urgently. Although this study is a regional example, it can provide a reference for the energy performance of buildings in similar mass and climatic regions under emergency events so that managers can formulate reasonable energy management policies and discover energy-saving potential.
Due to the strict lockdown, few studies currently use large amounts of measured data. It is also difficult to know whether the lockdown affects the correlation of building and environmental parameters. This study shows that pre-lockdown building energy consumption has a significant positive correlation with almost all environmental factors. After lockdown, the interference of the outdoor environment to indoors has increased, and some of them have reached a very high level.
Because of social distancing constraints, we have learned about energy consumption and indoor environmental changes in commercial buildings left unattended for long periods, which are rare in the current literature. Our measured data will help managers take proactive feedback and properly adjust building systems to accommodate similar emergencies. The public concerns considering future work patterns and indoor environmental quality are growing. The study could provide value for the promotion of healthy building concepts. Further research will be carried out to expand the database to gain a deeper understanding of the impact of COVID-19 on the operational parameters of different types of buildings in the city.
Funding sources
This work is supported by the “National Key R&D Program” (2016FYC0700100).
Declaration of Competing Interest
The authors declare that they have no known competing financial interests or personal relationships that could have appeared to influence the work reported in this paper.
References
- 1.Lu R., Zhao X., Li J., Niu P., Yang B.o., Wu H., Wang W., Song H., Huang B., Zhu N.a., Bi Y., Ma X., Zhan F., Wang L., Hu T., Zhou H., Hu Z., Zhou W., Zhao L.i., Chen J., Meng Y., Wang J.i., Lin Y., Yuan J., Xie Z., Ma J., Liu W.J., Wang D., Xu W., Holmes E.C., Gao G.F., Wu G., Chen W., Shi W., Tan W. Genomic characterisation and epidemiology of 2019 novel coronavirus: implications for virus origins and receptor binding. LANCET[J]. 2020;395(10224):565–574. doi: 10.1016/S0140-6736(20)30251-8. [DOI] [PMC free article] [PubMed] [Google Scholar]
- 2.Bashir M.F., MA B.J., Bilal, Komal B., Bashir M.A., Farooq T.H., Iqbal N., Bashir M. {Correlation between environmental pollution indicators and COVID-19 pandemic: A brief study in Californian context} {ENVIRONMENTAL RESEARCH}[J]. 2020;187:109652. doi: 10.1016/j.envres.2020.109652. [DOI] [PMC free article] [PubMed] [Google Scholar]
- 3.China COVID-19 Study. COVID-19 real-time data report URL:https://voice.baidu.com/act/newpneumonia/newpneumonia/?from=osari_pc_3 ; 2021 [accessed 15 November 2021].
- 4.Yip T.L., Huang Y., Liang C. {Built environment and the metropolitan pandemic: Analysis of the COVID-19 spread in Hong Kong} {BUILDING AND ENVIRONMENT} 2021;188:107471. doi: 10.1016/j.buildenv.2020.107471. [DOI] [PMC free article] [PubMed] [Google Scholar]
- 5.Fan D.i., Li Y.i., Liu W., Yue X.-G., Boustras G. {Weaving public health and safety nets to respond the COVID-19 pandemic} {SAFETY SCIENCE} 2021;134:105058. doi: 10.1016/j.ssci.2020.105058. [DOI] [PMC free article] [PubMed] [Google Scholar]
- 6.Chintalapudi N., Battineni G., Amenta F. COVID-19 virus outbreak forecasting of registered and recovered cases after sixty day lockdown in Italy: A data driven model approach. 2020/04/13/ J Microbiol Immunol Infect. 2020;53(3):396–403. doi: 10.1016/j.jmii.2020.04.004. [DOI] [PMC free article] [PubMed] [Google Scholar]
- 7.Barkur G., Vibha, Kamath G.B. {Sentiment analysis of nationwide lockdown due to COVID 19 outbreak: Evidence from India} {ASIAN JOURNAL OF PSYCHIATRY} 2020;51:102089. doi: 10.1016/j.ajp.2020.102089. [DOI] [PMC free article] [PubMed] [Google Scholar]
- 8.Lau, H., et al., {The positive impact of lockdown in Wuhan on containing the COVID-19 outbreak in China}. {JOURNAL OF TRAVEL MEDICINE}, 2020. {27} ({3}). [DOI] [PMC free article] [PubMed]
- 9.People's Daily. “China's attitude and measures towards the epidemic are admirable.” URL:https://baijiahao.baidu.com/s?id=1659465579094630859&wfr=spider&for=pc;2020 [accessed 20 February 2020].
- 10.2020 Energy Insider, Energy Networks Australia. Commercial down v residential up: COVID-19’s electricity impact. URL:https://www.energynetworks.com.au/news/energy-insider/2020-energy-insider/commercial-down-v-residential-up-covid-19s-electricity-impact/;2020 (accessed April 19, 2020).
- 11.World Economic Forum. COVID-19: America hasn’t used this little energy in 16 years. URL:https://www.weforum.org/agenda/2020/04/united-states-eneregy-electricity-power-coronavirus-covid19/;2020 (accessed April 19, 2020).
- 12.AleaSoft Energy Forecasting. Fall in demand and prices of the European electricity markets due to the COVID 19 crisis. URL: https://aleasoft.com/fall-demand-prices- european-electricity-markets-due-covid-19-crisis/ ;2020 (accessed April 19, 2020).
- 13.World Economic Forum. Here’s how energy demand has changed during the UK’s lockdown. URL:https://www.weforum.org/agenda/2020/04/we-analysed-electricity-demand-and-found-coronavirus-has-turned-weekdays-into-weekends/;2020 (accessed April 19, 2020).
- 14.S&P Global Platts. Yep E, Odaka M, Kanoi S, Kumagi T. Japan, Singapore lockdowns to stifle Asian gas, power demand further, COVID-19: Coronavirus outbreak. URL:https://www.spglobal.com/platts/en/market-insights/latest-news/natural-gas/040720-japan-singapore-lockdowns-to-stifle-asian-gas-power-demand-further ;2020 (accessed April 19, 2020).
- 15.ET Energy World. Coronavirus impact: Within ten days, 26 percent fall in India’s energy consumption, URL:https://energy.economictimes.indiatimes.com/news/power/coronavirus-impact-within-ten-days-26-per-cent-fall-in-indias- energy-consumption/74854825;2020 (accessed April 19, 2020).
- 16.T&D World. Postelwait J. China’s electricity demand dropped almost 8% after COVID-19 Measures. URL:https://www.tdworld.com/electric-utility-operations/article/21127472/chinas-electricity-demand-dropped-almost-8-after-covid19- measures; 2020 (accessed April 19, 2020).
- 17.IEA. Electricity Market Report - December 2020 URL:https://www.iea.org/reports/electricity-market-report-december-2020 ; (accessed December 20 2020).
- 18.Ruan Guangchun, Wu Jiahan, Zhong Haiwang, Xia Qing, Xie Le. {Quantitative assessment of US bulk power systems and market operations during the COVID-19 pandemic} {APPLIED ENERGY} 2021;286:116354. doi: 10.1016/j.apenergy.2020.116354. [DOI] [PMC free article] [PubMed] [Google Scholar]
- 19.Load data of New York city, USA. URL: http://mis.nyiso.com/public/P-58Blist. ;2020 (accessed Apri 25, 2020).
- 20.Tuohy A, Kelly A, Deaver B, Lannoye E, Brooks Daniel. Aidan Tuohy, Adrian Kelly, Brian Deaver, Eamonn Lannoye, Daniel Brooks, COVID-19 Bulk System Impacts, Demand Impacts and Operational and Control Center Pactices, EPRI Transmission Opearions and Planning, ID: 3002018602. URL:http://mydocs.epri.com/docs/public/ covid19/3002018602R2.pdf ;2020 (accessed April 25, 2020).
- 21.Energy Networks Australia. Commercial down v residential up: COVID-19’s electricity impact, 2020 Energy Insider. URL:https://www.energynetworks.com.au/news/energy-insider/2020-energy-insider/commercial-down-v-residential-up-covid-19s-electricity-impact/ ;2020 (accessed April 19, 2020).
- 22.Available online. Energy Networks Australia Commercial down v Residential up: COVID-190s Electricity Impact. URL:https://www.energynetworks.com.au/news/energy-insider/2020-energy-insider/commercial-down-v-residential-up-covid-19s-electricity-impact/; 2020 (accessed on 19 June 2020).
- 23.Le Quéré Corinne, Jackson Robert B., Jones Matthew W., Smith Adam J.P., Abernethy Sam, Andrew Robbie M., De-Gol Anthony J., Willis David R., Shan Yuli, Canadell Josep G., Friedlingstein Pierre, Creutzig Felix, Peters Glen P. Temporary reduction in daily global CO2emissions during the COVID-19 forced confinement. Nat. Clim. Chang. 2020;10(7):647–653. [Google Scholar]
- 24.Santiago I., Moreno-Munoz A., Quintero-Jiménez P., Garcia-Torres F., Gonzalez-Redondo M.J. Electricity demand during pandemic times: The case of the COVID-19 in Spain} {ENERGY POLICY} 2021;148:111964. doi: 10.1016/j.enpol.2020.111964. [DOI] [PMC free article] [PubMed] [Google Scholar]
- 25.Krarti Moncef, Aldubyan Mohammad. {Review analysis of COVID-19 impact on electricity demand for residential buildings} {RENEWABLE & SUSTAINABLE ENERGY REVIEWS} 2021;143:110888. doi: 10.1016/j.rser.2021.110888. [DOI] [PMC free article] [PubMed] [Google Scholar]
- 26.Li Lechen, Meinrenken Christoph J., Modi Vijay, Culligan Patricia J. {Impacts of COVID-19 related stay-at-home restrictions on residential electricity use and implications for future grid stability} {ENERGY AND BUILDINGS} 2021;251:111330. doi: 10.1016/j.enbuild.2021.111330. [DOI] [PMC free article] [PubMed] [Google Scholar]
- 27.Kawka Emily, Cetin Kristen. {Impacts of COVID-19 on residential building energy use and performance} {BUILDING AND ENVIRONMENT} 2021;205:108200. doi: 10.1016/j.buildenv.2021.108200. [DOI] [PMC free article] [PubMed] [Google Scholar]
- 28.Awada, M., et al., {Occupant health in buildings: Impact of the COVID-19 pandemic on the. [DOI] [PMC free article] [PubMed]
- 29.BUILDING AND ENVIRONMENT} 2022;{207:({A}). doi: 10.1016/j.buildenv.2021.108567. [DOI] [PMC free article] [PubMed] [Google Scholar]
- 30.Madurai Elavarasan Rajvikram, Shafiullah GM, Raju Kannadasan, Mudgal Vijay, Arif M.T., Jamal Taskin, Subramanian Senthilkumar, Sriraja Balaguru V.S., Reddy K.S., Subramaniam Umashankar. {COVID-19: Impact analysis and recommendations for power sector operation} {APPLIED ENERGY} 2020;279:115739. doi: 10.1016/j.apenergy.2020.115739. [DOI] [PMC free article] [PubMed] [Google Scholar]
- 31.Rouleau Jean, Gosselin Louis. {Impacts of the COVID-19 lockdown on energy consumption in a Canadian social housing building} {APPLIED ENERGY} 2021;287:116565. doi: 10.1016/j.apenergy.2021.116565. [DOI] [PMC free article] [PubMed] [Google Scholar]
- 32.Saha Jay, Chouhan Pradip. Indoor air pollution (IAP) and pre-existing morbidities among under-5 children in India: are risk factors of coronavirus disease (COVID-19)?} {ENVIRONMENTAL POLLUTION [J]. 2020;266:115250. doi: 10.1016/j.envpol.2020.115250. [DOI] [PMC free article] [PubMed] [Google Scholar]
- 33.Bochenek Bogdan, Jankowski Mateusz, Gruszczynska Marta, Nykiel Grzegorz, Gruszczynski Maciej, Jaczewski Adam, Ziemianski Michal, Pyrc Robert, Figurski Mariusz, Pinkas Jarosław. Impact of Meteorological Conditions on the Dynamics of the COVID-19 Pandemic in Poland}. 2021;18(8):3951. doi: 10.3390/ijerph18083951. [DOI] [PMC free article] [PubMed] [Google Scholar]
- 34.Haque Syed Emdadul, Rahman Mosiur. {Association between temperature, humidity, and COVID-19 outbreaks in Bangladesh} {ENVIRONMENTAL SCIENCE & POLICY} 2020;114:253–255. doi: 10.1016/j.envsci.2020.08.012. [DOI] [PMC free article] [PubMed] [Google Scholar]
- 35.Stabile L., Pacitto A., Mikszewski A., Morawska L., Buonanno G. {Ventilation procedures to minimize the airborne transmission of viruses in classrooms} {BUILDING AND ENVIRONMENT} 2021;202:108042. doi: 10.1016/j.buildenv.2021.108042. [DOI] [PMC free article] [PubMed] [Google Scholar]
- 36.Ahlawat A., Wiedensohler A., Mishra S. K. {An Overview on the Role of Relative Humidity in Airborne Transmission of SARS-CoV-2 in Indoor Environments}. {AEROSOL AND AIR QUALITY RESEARCH} [J]. 2020,{20} ({9}): 1856-1861.
- 37.Casanova L.M., Jeon S., Rutala W.A., et al. Effects of air temperature and relative humidity on coronavirus survival on surfaces. [J] Applied and Environmental Microbiology. 2010;76(9):2712–2717. doi: 10.1128/AEM.02291-09. [DOI] [PMC free article] [PubMed] [Google Scholar]
- 39.Al Huraimel Khaled, Alhosani Mohamed, Kunhabdulla Shabana, Stietiya Mohammed Hashem. SARS-CoV-2 in the environment: Modes of transmission, early detection and potential role of pollutions. SCIENCE OF THE TOTAL ENVIRONMENT[J]. 2020;744:140946. doi: 10.1016/j.scitotenv.2020.140946. [DOI] [PMC free article] [PubMed] [Google Scholar]
- 40.Magazzino Cosimo, Mele Marco, Schneider Nicolas. {The relationship between air pollution and COVID-19-related deaths: An application to three French cities} {APPLIED ENERGY} 2020;279:115835. doi: 10.1016/j.apenergy.2020.115835. [DOI] [PMC free article] [PubMed] [Google Scholar]
- 41.Kaliszewski Miron, Włodarski Maksymilian, Młyńczak Jarosław, Kopczyński Krzysztof. Comparison of Low-Cost Particulate Matter Sensors for Indoor Air Monitoring during COVID-19 Lockdown[J] Sensors. 2020;20(24):7290. doi: 10.3390/s20247290. [DOI] [PMC free article] [PubMed] [Google Scholar]
- 42.Ding J., Yu C. W., Cao S. {HVAC systems for environmental control to minimize the COVID-19 infection}. {INDOOR AND BUILT ENVIRONMENT} [J]. 2020,{29}({9, SI}): 1195-1201.
- 43.Yuan Su, Linwei Wang, Wei Feng, Nan Zhou, Luyuan Wang. Analysis on green building performance in cold coastal climates- An in-depth evaluation of green buildings in Dalian, China, Renewable and Sustainable Energy Reviews, Volume 146, August 2021, 20211111149.
- 44.Awada Mohamad, Becerik-Gerber Burcin, Hoque Simi, O'Neill Zheng, Pedrielli Giulia, Wen Jin, Wu Teresa. {Ten questions concerning occupant health in buildings during normal operations and extreme events including the COVID-19 pandemic} {BUILDING AND ENVIRONMENT} 2021;188:107480. doi: 10.1016/j.buildenv.2020.107480. [DOI] [PMC free article] [PubMed] [Google Scholar]
- 45.Balocco C., Leoncini L. {Energy Cost for Effective Ventilation and Air Quality for Healthy Buildings: Plant Proposals for a Historic Building School Reopening in the Covid-19 Era}. {SUSTAINABILITY}[J]. 2020,{12} ({20}).
- 46.The Central People's Government of the People's Republic of China. Notice on Doing a Good Job in the Prevention and Control of the Novel Coronavirus Pneumonia Epidemic. http://www.gov.cn/zhengce/zhengceku/2020-01/23/content_5471921.htm.
- 47.Dalian Municipal People's Government. The 52nd Press Conference on the Prevention and Control of the New Coronary Pneumonia Epidemic. https://www.dl.gov.cn/art/2020/12/22/art_460_508807.html.
- 48.China Weather Net. Dalian City Weather Forecast. URL:http://www.weather.com.cn/ ; 2020 [accessed on November 9, 2020].
- 49.“Civil Building Heating Ventilation and Air Conditioning Design Code” GB50736.
- 50.Liu Dawei, Dong Meizhi, Zhen Wei. Analysis of the impact of the epidemic on the energy consumption of Beijing based on the data of the energy-saving monitoring platform[J] Energy Conservation and Environmental Protection. 2020;03:38–39. [Google Scholar]
- 51.He Guojun, Pan Yuhang, Tanaka Takanao. The short-term impacts of COVID-19 lockdown on urban air pollution in China} {NATURE SUSTAINABILITY} 2020;3(12):1005–1011. [Google Scholar]
- 52.Wang Qiang, Su Min. {A preliminary assessment of the impact of COVID-19 on environment? A case study of China} {SCIENCE OF THE TOTAL ENVIRONMENT} 2020;728:138915. doi: 10.1016/j.scitotenv.2020.138915. [DOI] [PMC free article] [PubMed] [Google Scholar]
- 53.Dharmaraj Selvakumar, Ashokkumar Veeramuthu, Hariharan Sneha, Manibharathi Akila, Show Pau Loke, Chong Cheng Tung, Ngamcharussrivichai Chawalit. {The COVID-19 pandemic face mask waste: A blooming threat to the marine environment} {CHEMOSPHERE} 2021;272:129601. doi: 10.1016/j.chemosphere.2021.129601. [DOI] [PMC free article] [PubMed] [Google Scholar]