Figure 6.
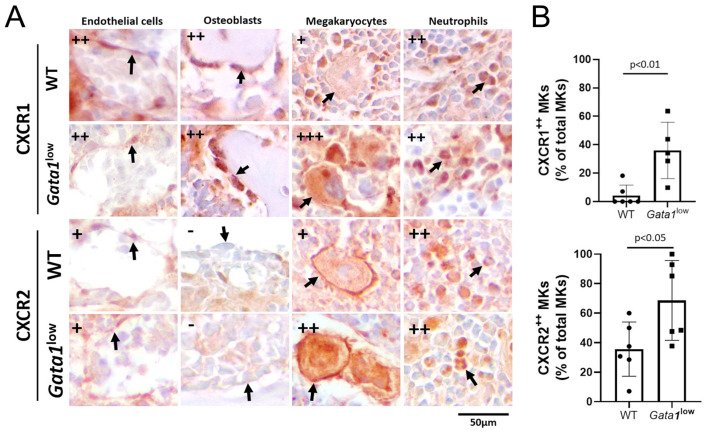
Malignant megakaryocytes express great levels of CXCR1 and CXCR2. (A) Representative sections from the bone marrow of wild-type and Gata1low littermates immunostained with antibodies per CXCR1 and CXCR2, showing the level of these receptors in endothelial cells, osteoblasts, megakaryocytes, and neutrophils (indicated with arrows). Semiquantitative estimates (−, +, or ++) of the intensity of the staining in the different cells are provided on the top left. Original magnification 40×. Representative sections stained only with the secondary antibodies, are shown in Figure S6 (Supplementary Materials), as negative controls. (B) Percentage of megakaryocytes expressing high levels of CXCR1 and CXCR2. The proinflammatory cytokines were quantified as described in Figure S2B (Supplementary Materials) on five randomly selected areas per femur from three–four mice per experimental group. Statistical analysis was performed by t-test, and statistically significant p values among groups are indicated within the panels. Abbreviations: CXCR1 and 2: CXC motif chemokine receptor 1 and 2; WT: wild-type; MKs: megakaryocytes.

