

Abstract
OBJECTIVES
To describe the prevalence of smoking and alcohol use and abuse in an impoverished rural region of western Kenya.
METHODS
Picked from a population-based longitudinal database of demographic and health census data, 72 292 adults (≥ 18 years) were asked to self-report their recent (within the past 30 days) and lifetime use of tobacco and alcohol and frequency of recent ‘drunkenness’.
RESULTS
Overall prevalence of ever smoking was 11.2% (11.0–11.5) and of ever drinking, 20.7% (20.4–21.0). The prevalence of current smoking was 6.3% (6.1–6.5); 5.7% (5.5–5.9) smoked daily. 7.3% (7.1–7.5) reported drinking alcohol within the past 30 days. Of these, 60.3% (58.9–61.6) reported being drunk on half or more of all drinking occasions. The percentage of current smokers rose with the number of drinking days in a month (P < 0.0001). Tobacco and alcohol use increased with decreasing socio-economic status and amongst women in the oldest age group (P < 0.0001).
CONCLUSIONS
Tobacco and alcohol use are prevalent in this rural region of Kenya. Abuse of alcohol is common and likely influenced by the availability of cheap, home-manufactured alcohol.
Appropriate evidence-based policies to reduce alcohol and tobacco use should be widely implemented and complemented by public health efforts to increase awareness of their harmful effects.
Keywords: drinking alcohol, smoking, rural, western Kenya
Introduction
Worldwide, tobacco use continues to be the leading cause of preventable death (World Health Organization 2011c), and almost 4% of deaths are attributed to the harmful use of alcohol (Rehm et al. 2007; World Health Organization 2011c). Alcohol use is a causal factor in 60 types of disease and injury, a contributory factor to 200 other diseases (such as cancers, liver cirrhosis, hypertension and pancreatitis) and is associated with violence, suicides, child abuse/neglect and workplace absenteeism (Corrao et al. 2004; Borges et al. 2006; Lau et al. 2008; World Health Organization 2011c). People with alcohol-associated diseases smoke more than people with non-alcohol-related disease, suggesting a synergism between alcohol-related harm and cigarette smoking (Lau et al. 2008).
Globally, tobacco-related illnesses kill up to half of its users or approximately six million people annually (World Health Organization 2011b). The prevalence of smoking is increasing amongst people in low- and middle-income countries (LMIC), and by 2030, tobacco use is predicted to result in more than eight million deaths worldwide, and 80% of these premature deaths occurring in LMIC (World Health Organization 2011c). Smoking and alcohol consumption substantially contribute towards chronic diseases, which are estimated to cause more than 60% of deaths globally, with more than 80% of these occurring in LMIC (Lopez & Mathers 2006; Abegunde et al. 2007). Without effective prevention and control programmes, as the economies of LMIC grow, so will risk factors for disorders such as cardiovascular diseases (including smoking). When coupled with the current burden of infectious diseases, global health inequalities will be further exacerbated (Ezzati et al. 2005). The need for action to deal with the growing burden of non-communicable diseases in African countries has been well documented (Mayosi et al. 2009; Alwan et al. 2010).
Despite the expected contribution of tobacco use and the harmful use of alcohol to morbidity and mortality, epidemiological data are still lacking for many countries, especially countries with less established market economies (Degenhardt et al. 2008; Giovino et al. 2012). In Kenya, epidemiological data on smoking and harmful use of alcohol are available for selected populations such as adults attending medical facilities (Ndetei et al. 2009; Othieno et al. 2009) and adolescents (Mugisha et al. 2003; Ogwell et al. 2004) and from small-scale surveys (NACADA Authority 2007, 2010). Other research on tobacco and alcohol use in sub-Saharan Africa have identified these behaviours as risk factors or variables that impact treatment of communicable diseases (Kalichman et al. 2006; Chersich et al. 2007, 2009; Amuha et al. 2009; Abaynew et al. 2011). The lack of comprehensive data representative of the Kenyan population limits our ability to assess the magnitude of the problem.
The aim of our study was to estimate the prevalence of smoking and alcohol use amongst adults according to poverty level, marital status, sex and age in a rural population in western Kenya. Our study area has an ongoing Health and Demographic Surveillance System (HDSS), thereby providing an opportunity to sample across a population with known sociodemographic characteristics. As of September 2012, this epidemiological study is the largest study examining factors associated with alcohol and tobacco use in a sub-Saharan African country.
Methods
Study site and population
The population is described in detail elsewhere (Cohen & Atieno-Odhiambo 1989; Phillips-Howard et al. 2003; Odhiambo et al. 2012). Briefly, the study site comprises 385 villages spread over a 700 km2 area along the shores of Lake Victoria, Nyanza Province in western Kenya. The area is rural and includes Asembo (Rarieda District), Wagai and Yala (Gem District), and Karemo (Siaya District) (Figure 1). The population are Luo with polygynous families living in compounds comprised of a separate house for each wife and her children. Most are subsistence farmers.
Figure 1.

Map of study area.
Health and demographic surveillance system and data processing
The HDSS is a population-based system that is used to longitudinally record demographic data of more than 220 000 individuals. A household census of the total population, where field staff visit households and survey individuals to collect demographic information, occurs three times each year from January to April, May to August and September to December. Census information comprises births, deaths, in- and out-migrations, pregnancies, morbidity, parental survival status, immunisation status for children under 2 years, religion, marriage and ethnicity. Education and socio-economic status (SES) are collected once every 2 years. Economic indicators gathered for each household include the occupation of the head of household, primary source of drinking water, use of cooking fuel, ownership of material assets and livestock possessions (Meltzer et al. 2003). From these economic indicators, a household SES index was calculated as a weighted average of the indicators using multiple correspondence analysis (MCA). MCA provides a composite asset index score for categorical variables and does not presume indicator values are normally distributed. The MCA household SES index was then used to rank households within our study population by quintiles ranging from 1 (poorest) to 5 (least poor) households (Filmer & Pritchett 2001; McKenzie 2005; Booysen et al. 2008).
In 2011, we added a module for adults aged 18 years and older to measure their use of alcohol and tobacco. Alcohol and tobacco use data presented in this article are from household interviews conducted in parallel with the HDSS second round census from May to August 2011. If an individual was not at home, a senior adult informant in the household was asked to serve as a proxy and report on the absent individual’s alcohol consumption and smoking behaviour. Whenever possible, individuals were interviewed privately due to the sensitive nature of questions regarding drinking and smoking.
We asked participants (i) if they ever consumed alcohol, (ii) the number of days alcohol was consumed in the past 7 days, and if they reported no alcohol use in the past 7 days, then we asked (iii) about the past 30 days. Because of restrictions in the number of questions that could be added to the survey, we did not use existing tools such as the CAGE questionnaire (Sendagire et al. 2012). In Kenya, consumption of local brew is common (NACADA Authority 2007). The alcohol content of such beverages can vary widely, as does the size of cups, and drinkers generally have their cups topped up as they drink. These factors would render any effort to measure quantity of alcohol consumed based on alcohol content and volume highly inaccurate. Instead, participants who reported drinking in the past 30 days were also asked about the number of days in the past 30 that they were ‘drunk’. Local vernacular was used by field staff to define ‘drunk’ as any time in which the participant exhibited behaviour readily associated with excessive alcohol consumption (e.g. difficulty in walking straight, slurred or incoherent speech or a sense of feeling ‘tipsy’). Responses on the number of days alcohol was consumed in the past 7 days and the number of days the drinker was ‘drunk’ in the past 7 days were multiplied by 4.3 (52 weeks/12 months) to obtain past-30-day estimates.
The categories presented for the number of days drinking in the past 30 days are based on the calculated tertiles amongst those who drank. Tertiles were 1–7, 8–17 and >17 days per month. For smoking, we calculated the proportion of people that ever smoked, had smoked at least 100 cigarettes in their lifetime and current smoking (i.e. reported smoking at least 100 cigarettes and reported smoking at the time of the interview) (Lau et al. 2008). We calculated smoking and drinking prevalence and 95% confidence intervals and present estimates stratified by gender, age, wealth index and marital status. We performed crude and adjusted logistic regression and calculated 95% confidence intervals to assess factors related to current smoking and problem drinking, those who drank on at least 8 days during the past 30 and were drunk at least half of the times they drank.
Ethical considerations
Surveillance activities and informed consent procedures were reviewed by the Kenyan Medical Research Institute (KEMRI) and Centers for Disease Control and Prevention (CDC) scientific and ethics committees. The protocol for this analysis was reviewed and approved by CDC. Due to low literacy levels in Luo and English in the study area, participants are orally informed of their right to withdraw before each census takes place and acknowledge their consent through their signature or thumb print. Data are stored securely, without names, and can only be accessed by people authorised to do so; data are stored at KEMRI/CDC Research and Public Health Collaboration campus at Kisian in western Kenya.
Results
Overall, interviews on 72 292 individuals were conducted. The majority of respondents were female (56.9%), between 18 and 29 years of age (35.8%), married or cohabitating (57.2%) and had a primary education (63.9%). In comparison with men, a greater proportion of women were 40 years or older (50.6% vs. 41.0%, P < 0.0001), widowed (28.4% vs. 3.4%, P < 0.0001) and had no formal education (18.6% vs. 4.2%, P < 0.0001) (Table 1).
Table 1.
Characteristics of the study population by gender
| Gender | ||||||
|---|---|---|---|---|---|---|
| Male | Female | Total | ||||
| n | n | N | ||||
| Total | 31 188 | %* | 41 104 | %* | 72 292 | %* |
| Respondent | ||||||
| Proxy | 19 018 | 61.0 | 17 707 | 43.1 | 36 725 | 50.8 |
| Self | 12 170 | 39.0 | 23 397 | 56.9 | 35 567 | 49.2 |
| Age category | ||||||
| 18–29 | 12 656 | 40.6 | 13 216 | 32.2 | 25 872 | 35.8 |
| 30–39 | 5733 | 18.4 | 7060 | 17.2 | 12 793 | 17.7 |
| 40–49 | 3850 | 12.3 | 6183 | 15.0 | 10 033 | 13.9 |
| 50–59 | 3439 | 11.0 | 6007 | 14.6 | 9446 | 13.1 |
| 60+ | 5510 | 17.7 | 8638 | 21.0 | 14 148 | 19.6 |
| Marital status | ||||||
| Single | 10 630 | 34.2 | 5737 | 14.0 | 16 367 | 22.7 |
| Married/cohabitating | 18 252 | 58.6 | 23 022 | 56.1 | 41 274 | 57.2 |
| Divorced | 1177 | 3.8 | 628 | 1.5 | 1805 | 2.5 |
| Widow | 1068 | 3.4 | 11 629 | 28.4 | 12 697 | 17.6 |
| Highest education completed | ||||||
| None | 1318 | 4.2 | 7631 | 18.6 | 8949 | 12.4 |
| Primary | 20 064 | 64.5 | 25 983 | 63.5 | 46 047 | 63.9 |
| Secondary | 8311 | 26.7 | 6610 | 16.1 | 14 921 | 20.7 |
| Post-secondary | 1434 | 4.6 | 710 | 1.7 | 2144 | 3.0 |
Percentages exclude missing data.
Amongst adults 18 years and older, the overall prevalence of ever drinking alcohol was 20.7% (20.4–21.0) and that of ever smoking was 11.2% (11.0–11.5) (Table 2). The prevalence of drinking alcohol in the past 30 days was 7.3% (7.1–7.5) amongst all individuals and 34.6% (33.9–35.4) amongst ever drinkers. In total, the prevalence of current smoking was 6.3% (6.1–6.5) and 5.7% (5.5–5.9) smoked daily. The prevalence of both smoking and drinking was two to three times higher amongst men than women. Overall, 1.7% of persons reportedly had smoked daily and drank alcohol on 18 or more days in the past 30 days (the highest tertile calculated for persons who reported drinking in the past 30 days).
Table 2.
Alcohol and smoking prevalence by gender
| Gender | |||||||||
|---|---|---|---|---|---|---|---|---|---|
| Male | Female | Total | |||||||
| Yes (%)* | No (%)* | Unknown | Yes (%)* | No (%)* | Unknown | Yes (%)* | No (%)* | Unknown | |
| Ever smoke | 4945 (16.4) | 25 126 (83.6) | 1117 | 2978 (7.4) | 37 445 (92.6) | 681 | 7923 (11.2) | 62 571 (88.8) | 1798 |
| Smoked 100 cigarettes lifetime | 4401 (14.7) | 25 473 (85.3) | 1314 | 2516 (6.2) | 37 806 (93.8) | 782 | 6917 (9.9) | 63 279 (90.1) | 2096 |
| Smokes now | 3382 (11.2) | 26 689 (88.8) | 1117 | 1042 (2.6) | 39 381 (97.4) | 681 | 4424 (6.3) | 66 070 (93.7) | 1798 |
| Smokes every day | 3066 (10.2) | 26 959 (89.8) | 1163 | 928 (2.3) | 39 486 (97.7) | 690 | 3994 (5.7) | 66 445 (94.3) | 1853 |
| Ever drink | 9191 (31.0) | 20 443 (69.0) | 1554 | 5269 (13.1) | 34 810 (86.9) | 1025 | 14 460 (20.7) | 55 253 (79.3) | 2579 |
| Drank in the past 30 days | 4079 (14.2) | 24 694 (85.8) | 2415 | 931 (2.3) | 38 946 (97.7) | 1227 | 5010 (7.3) | 63 640 (92.7) | 3642 |
| Did not get drunkf | 799 (19.6) | 290 (31.1) | 1089 (21.7) | ||||||
| Drunk <50% when drinking† | 733 (18.0) | 169 (18.2) | 902 (18.0) | ||||||
| Drunk 50%+ when drinking† | 2547 (62.4) | 472 (50.7) | 3019 (60.3) | ||||||
| Ever drink and ever smoke | 4569 (15.1) | 25 675 (84.9) | 944 | 2309 (5.7) | 38 211 (94.3) | 584 | 6878 (9.7) | 63 886 (90.3) | 1528 |
| Smokes daily and drinks 18+ days in a month | 1027 (3.4) | 29 217 (96.6) | 944 | 166 (0.4) | 40 354 (99.6) | 584 | 1193 (1.7) | 69 571 (98.3) | 1528 |
Percentages exclude missing data.
Percentages calculated amongst those who drank in the past 30 days.
Amongst the 34.6% of ‘ever drinkers’ that drank in the past 30 days, 60.3% reported being drunk on half or more of all drinking occasions. Table 3 shows that the trend for being ‘drunk’ on half or more of all drinking occasions increased as the number of reported days of drinking in the past 30 days increased (P < 0.0001). Amongst those who reported drinking on 18 days or more, two-thirds reported being ‘drunk’ on half or more of all occasions when they drank. Amongst those who drank in the past 30 days, the per cent of current smokers significantly increased from 40.9% to 61.3% with increasing number of days in a month drinking (P < 0.0001).
Table 3.
Per cent of time drunk by the number of days drinking and current smoking status amongst those who drank in the past 30 days
| Days in a month drinking | ||||||||
|---|---|---|---|---|---|---|---|---|
| 1–7 | 8–17 | 18+ | Total | |||||
| n | %* | n | %* | n | %* | n | %* | |
| Total | 1338 | 1674 | 1998 | 5010 | ||||
| % of time drunk when drinking | ||||||||
| Did not get drunk | 506 | 37.8 | 395 | 23.6 | 188 | 9.4 | 1089 | 21.7 |
| <50% | 147 | 11.0 | 282 | 16.8 | 473 | 23.7 | 902 | 18.0 |
| 50%+† | 685 | 51.2 | 997 | 59.6 | 1337 | 66.9 | 3019 | 60.3 |
| Smokes now | ||||||||
| Yes† | 545 | 40.9 | 825 | 49.5 | 1222 | 61.3 | 2592 | 51.9 |
| No | 789 | 59.1 | 842 | 50.5 | 770 | 38.7 | 2401 | 48.1 |
| Unknown | 4 | 0 | 7 | 11 | ||||
Percentages exclude missing data.
P < 0.0001 (test of trend).
For male individuals, 61.0% of interviews were from proxy respondents (Table 1). In comparison with self-respondents, individuals represented by proxies were younger (median age 30 years vs. 46, P < 0.0001) and had lower prevalence of ever smoking (6.5% vs. 15.9%, P < 0.0001), current smoking (4.6% vs. 7.9%, P < 0.0001) and ever drinking (13.8% vs. 27.4%). Drinking alcohol in the past 30 days was more common amongst individuals with proxy respondents (49.8% vs. 32.1%, P < 0.0001). Table 4 includes estimates of crude and adjusted associations between current smoking, problem drinking and select factors. After adjusting for cofactors, proxy report was not associated with current smoking but it was significantly associated with problem drinking (OR = 1.93, P < 0.0001).
Table 4.
Crude and adjusted multivariate logistic regression models for current smokers and problem drinkers
| Crude OR (lower CL, upper CL) | Adjusted OR (lower CL, upper CL) | |
|---|---|---|
| Currently smokes | ||
| Ever drink | 44.37 (40.21, 48.95) | 28.28 (25.51, 31.36) |
| Gender | ||
| Male | 4.79 (4.46, 5.14) | 3.40 (3.12, 3.70) |
| Female | Referent | Referent |
| Age | ||
| 18–29 | Referent | Referent |
| 30–39 | 3.77 (3.38, 4.21) | 1.99 (1.76, 2.26) |
| 40–49 | 4.06 (3.62, 4.55) | 2.23 (1.95, 2.54) |
| 50–59 | 4.95 (4.43, 5.54) | 2.59 (2.28, 2.95) |
| 60+ | 5.30 (4.78, 5.88) | 1.83 (1.62, 2.06) |
| Wealth index | ||
| 1 | Referent | Referent |
| 2 | 0.63 (0.57, 0.69) | 0.62 (0.56, 0.70) |
| 3 | 0.50 (0.46, 0.55) | 0.51 (0.46, 0.58) |
| 4 | 0.36 (0.33, 0.40) | 0.36 (0.32, 0.40) |
| 5 | 0.28 (0.25, 0.30) | 0.28 (0.25, 0.31) |
| Respondent | ||
| Proxy | 0.57 (0.53, 0.60) | 0.98 (0.90, 1.06) |
| Self | Referent | Referent |
| Drunk 50%+ of time when drinking 8+ days in past 30 days | ||
| Currently smokes | 5.58 (5.08, 6.13) | 4.52 (4.09, 5.00) |
| Gender | ||
| Male | 4.39 (3.89, 4.96) | 2.67 (2.34, 3.05) |
| Female | Referent | Referent |
| Age | ||
| 18–29 | Referent | Referent |
| 30–39 | 1.32 (1.14, 1.54) | 1.17 (0.99, 1.38) |
| 40–49 | 1.29 (1.10, 1.51) | 1.30 (1.10, 1.55) |
| 50–59 | 1.04 (0.89, 1.21) | 1.22 (1.03, 1.45) |
| 60+ | 0.51 (0.44, 0.59) | 0.75 (0.64, 0.88) |
| Wealth index | ||
| 1 | Referent | Referent |
| 2 | 0.99 (0.85, 1.14) | 0.85 (0.72, 1.00) |
| 3 | 1.01 (0.88, 1.17) | 0.86 (0.73, 1.01) |
| 4 | 0.98 (0.85, 1.12) | 0.86 (0.74, 1.01) |
| 5 | 0.78 (0.68, 0.89) | 0.70 (0.60, 0.82) |
| Respondent | ||
| Proxy | 2.34 (2.14, 2.56) | 1.93 (1.74, 2.14) |
| Self | Referent | Referent |
Figures 2 and 3 are illustrations of smoking and drinking indicators by SES index category from 1 (poorest) to 5 (least poor). All smoking and drinking indicators significantly fell with rising SES index. The prevalence of daily smoking was more than triple (11.0% vs. 3.3%, P < 0.0001), and the prevalence of being drunk on 50% or more on all occasions when drinking was more than double (6.3% vs. 2.9%, P = 0.01) amongst the poorest compared to the least poor SES index quintiles.
Figure 2.
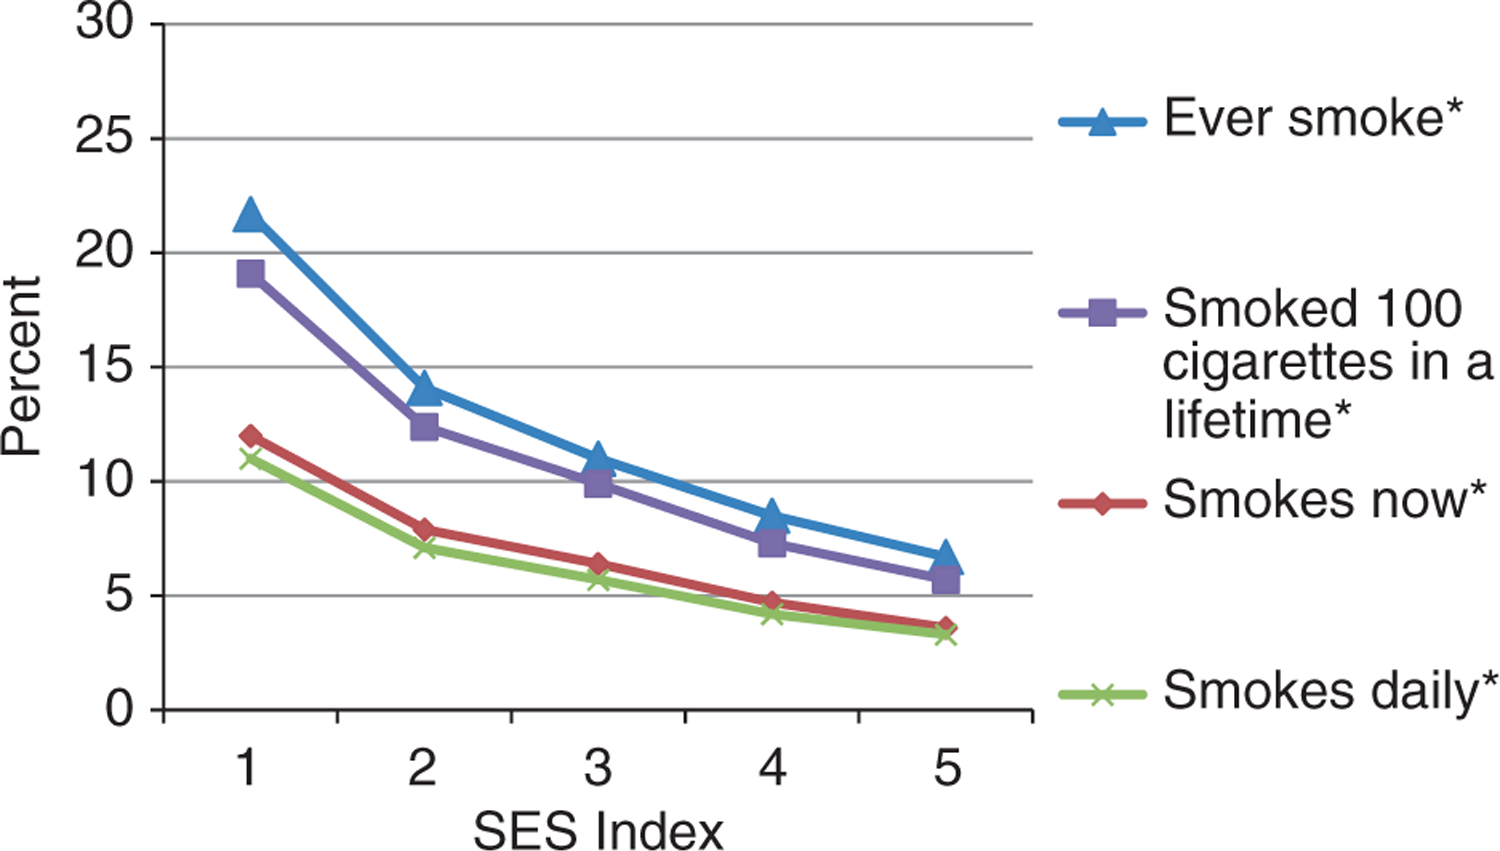
Smoking characteristics by socio-economic status (SES) index (one poorer to five least poor) amongst the study population. *P < 0.0001 (test of trend).
Figure 3.
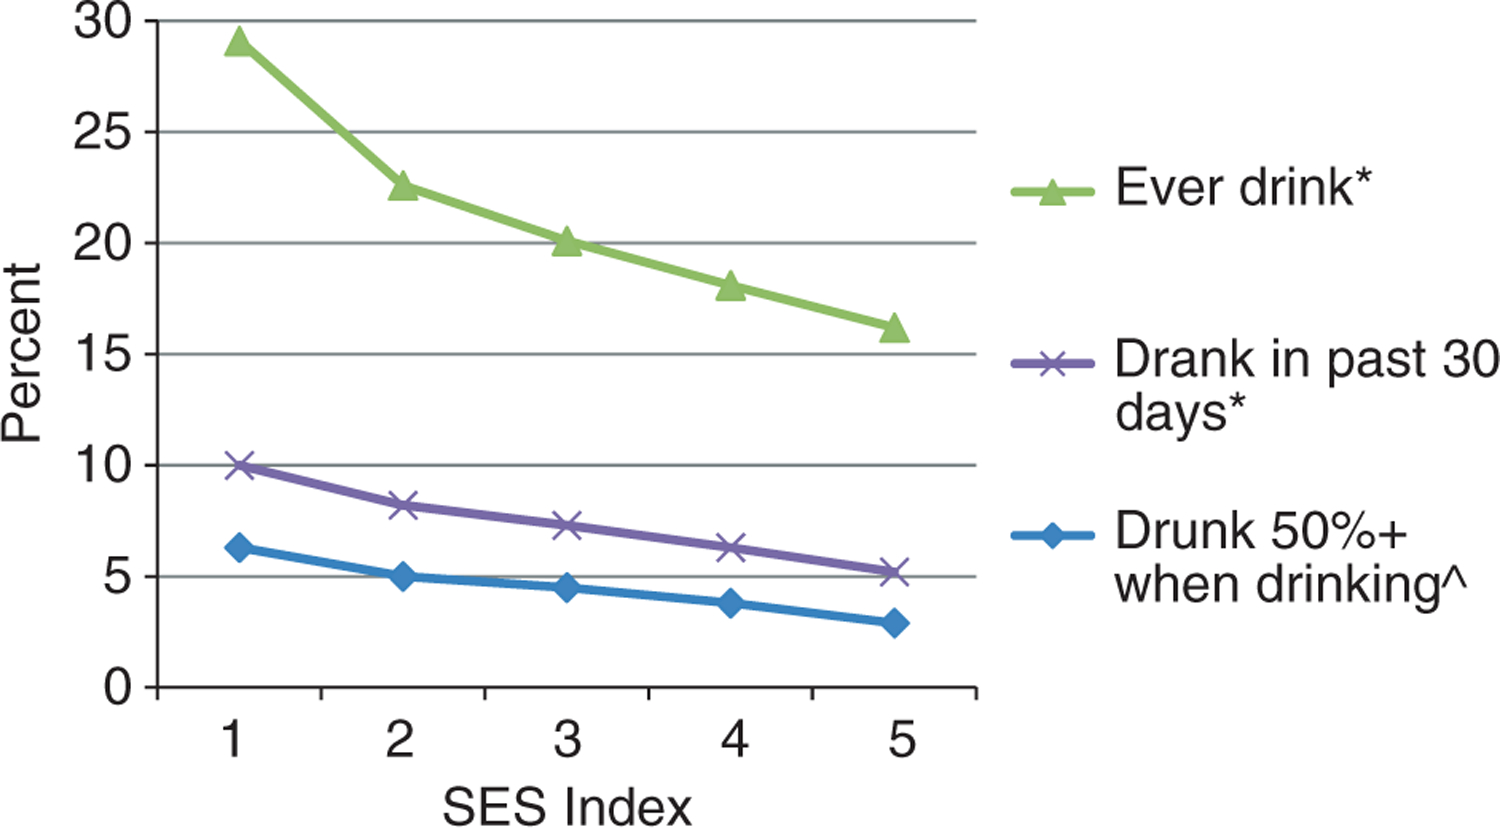
Drinking characteristics by socio-economic status (SES) index (one poorer to five least poor) amongst study population. *P < 0.0001 (test of trend). ^P = 0.01 (test of trend).
The prevalence of smoking and drinking indicators by gender and age categories is shown in Figures 4 and 5. For men, both smoking and drinking indicators substantially increased between the age groups of 18–29 years and 30–39 years and began to level off or dropped for those aged 60 years or older. For women, the percentage of persons smoking remained small but increased significantly after 50 years of age. Drinking indicators amongst women rose significantly with increasing age. Amongst women 60 years or older, 88.6% of the current smokers were daily smokers and 51.0% of those who drank in the past 30 days were drunk on half or more of occasions when drinking. Widowed followed by married/cohabitating women had the highest prevalence of ever smoking and drinking. The percentage of widowed women who ever smoked and drank alcohol was more than tripled from the ages of 50–59 (7.6%) to those aged 60 years and older (24.1%).
Figure 4.
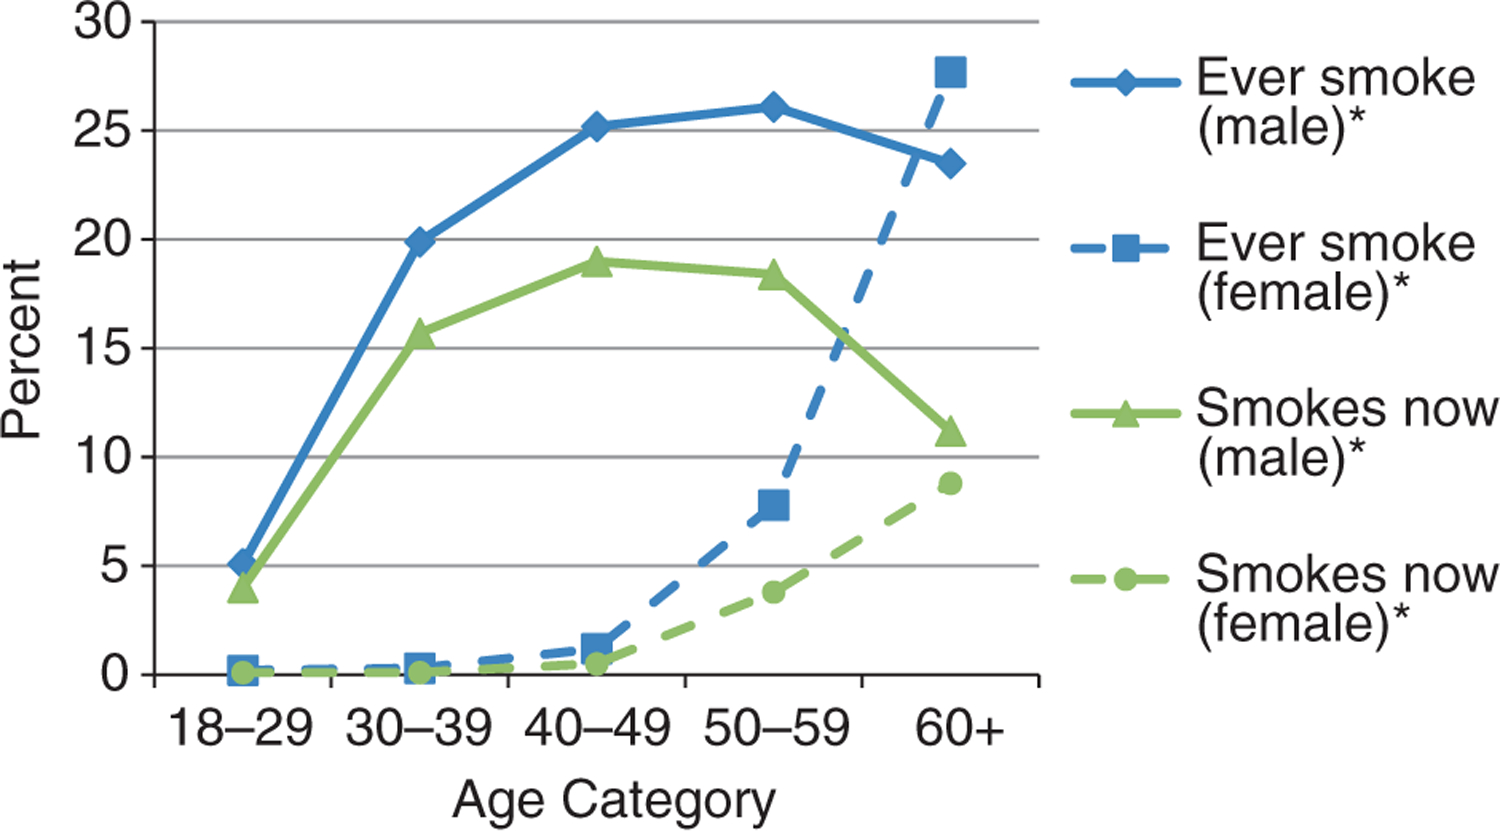
Lifetime and current smoking status by age category and gender amongst study population. *P < 0.0001 (test of trend).
Figure 5.
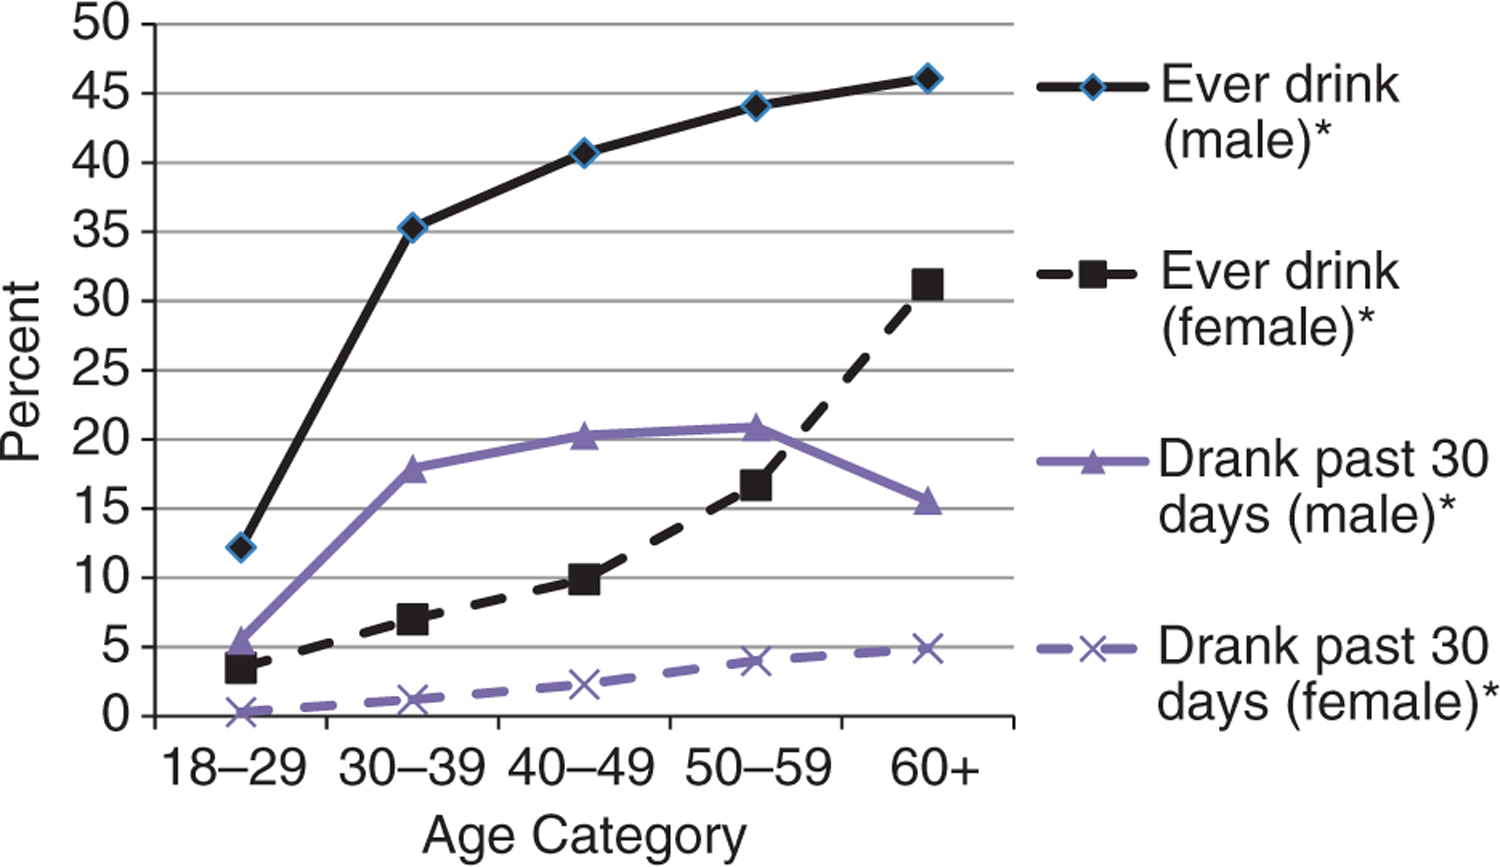
Lifetime and recent drinking status (past 30 days) by age category and gender amongst study population. *P < 0.0001 (test of trend).
Crude and adjusted associations between selected factors and current smoking and problem drinking are presented in table 4. After adjustment, ever drinking (OR = 28.28, P < 0.0001), men (OR = 3.40, P < 0.0001), older age groups and increasing wealth index were significantly associated with current smoking. Current smoking (OR = 4.52, P < 0.0001), men (OR = 2.67, P < 0.0001), for all age groups 40 years and above (see Table 4), and the highest wealth index quintile (OR = 0.70, P = 0.0001) were significantly associated with problem drinking.
Discussion
Based on our analyses, both smoking and alcohol use are prevalent in this region of Kenya. Drinking alcohol, however, is more prevalent than smoking, which is consistent with previous data for Nyanza province (NACADA Authority 2007; Kenya National Bureau of Statistics (KNBS) 2010). Alcohol, such as chang’aa (a traditional spirit) and busaa (a traditional beer), may be easier to obtain, as it is made in households and sold cheaply in this rural setting (Papas et al. 2010). Traditional home brewing of alcohol occurs in many countries in Africa (Willis 2002; Macintyre & Bloss 2011). In Kenya, chang’aa, which literally means ‘kill me quick’, is the most popular form of alcohol in Nyanza province (NACADA Authority 2007) and is made from millet and corn. Chang’aa, which costs approximately 20 Kenyan shillings or USD$0.25 a glass, is a fifth to a tenth of the cost of commercially manufactured brews and is therefore more accessible to residents. Chang’aa poses serious health concerns as it causes death or blindness from methanol poisoning or from other toxic substances and colourants added to enhance alcohol content.
Our prevalence estimates of smoking and drinking for residents of the HDSS site in Nyanza Province are lower than previously reported national estimates for Kenya. Based on the 2003 World Health Survey, amongst rural residents, 26.2% ever drank alcohol and 12.7% currently smoke (World Health Organization 2003). The Kenyan National Agency for the Campaign Against Drugs Authority (NACADA) reported 38.8% ever drinking and 20.0% ever smoking for rural residents in 2007 (NACADA Authority 2007). One reason for the lower estimates in our study may be due to responses from proxies who may not have known an individuals’ past drinking and smoking behaviours. Alternatively, the Kenyan government legalised home brews through the Alcoholic Drinks Control Act in 2010. The Act is intended to take business away from illicit brewers, control production, reduce exposure through limiting outlets and to control the time and mode of consumption and the age of use (NACADA 2010). It is possible that this survey reflects a reduction in alcohol consumption since the enactment of the new law.
The main determinants of alcohol-related harm are the volume of alcohol consumed and the pattern of consumption, particularly instances of heavy (‘binge’) drinking (World Health Organization 2011a). Here, a finding of importance is the high percentage of those who become drunk when drinking, particularly men and people of lower SES. Although both lifetime and current drinkers are a minority in this community, those that state they consume alcohol do so to excess. This finding is consistent with data from the 2008 to 2009 Kenyan Demographic Health Survey where 34% and 65% of women reported that their husbands/partners were drunk ‘often’ and ‘sometimes’, respectively (Kenya National Bureau of Statistics (KNBS) 2010). Clausen and colleagues explain this ‘all or none’ pattern present in some African countries including Kenya, where individuals are either heavy drinkers or abstainers. This differentiation may be a result of a significant percentage of individuals who are outliers participating in a behaviour outside the social norm, while the majority abstain from the behaviour as demonstrated by the high prevalence of persons reporting that they do not drink (Clausen et al. 2009). While it is possible that drinkers specifically consume alcohol to get drunk, a person’s ability to regulate their drunkenness is complicated by the fact that home-brewed alcohol varies considerably in terms of its ethanol concentration (Papas et al. 2010). The pattern we observed for alcohol use may extend to smoking as well, given the high percentages of individuals who smoke daily and smoked more than 100 cigarettes in a lifetime, relative to the majority that reported never smoking.
The prevalence of current smoking amongst women overall is higher than what has been reported nationally in Kenya by the World Health Survey (1.0%) and the NACADA (1.3%) (World Health Organization 2003; NACADA Authority 2007). These higher rates in women, however, are driven by the substantial increase in smoking amongst women aged 50 years and older. Our finding is consistent with other studies of tobacco smoking in neighbouring Tanzania, Rwanda and Malawi, where the prevalence amongst women was greatest for the over 50 years of age group (Jagoe et al. 2002; Negin et al. 2011). Increasing age in women has also been found to be associated with higher odds of currently drinking, although this was not significant for Kenya (Martinez et al. 2011). Reasons for this trend of smoking and drinking in older women in rural Kenya are unclear as are the public health implications, although anecdotally locals suggest older women do not have the same cultural restrictions as younger women.
In this impoverished region, the poorest had significantly higher rates of drinking and smoking. This trend holds for smoking data in the World Health Survey (World Health Organization 2003) and for men in rural Nyanza province in the Kenya Demographic Health Survey (KDHS)1 (Kenya National Bureau of Statistics (KNBS) 2010). However, it is counter to data reported by NACADA, which showed higher rates of both alcohol and smoking in wealthier individuals (NACADA Authority 2007). The difference in prevalence between our data and the NACADA data may be due to the greater accessibility of commercially produced alcohol and cigarettes by wealthier, urban households in Kenya, which our study did not include. However, the low cost of traditional home-brewed alcohol makes it accessible for even the poorest members of the community. Our findings are consistent with other studies that have found higher rates of smoking and drinking amongst the poorest individuals (De Silva et al., 2010; Neufeld et al. 2005; Aekplakorn et al. 2008).
Our study has several limitations. First, drinking and smoking frequencies are based on self-report from either individuals or their proxy. Proxies may not be knowledgeable of an individual’s smoking and drinking behaviours, particularly over ones lifetime. With the exception of number of days drinking in the last 30 days, proxy responses yielded lower rates of drinking and smoking behaviours than did self-report responses. Household interviews occurred during daylight hours when those working outside the home were not present, and therefore, individuals represented by proxy respondents may have different risk behaviours than those who were directly interviewed. This is supported by those represented by proxies were significantly younger than those represented by themselves. In our adjusted multivariate models, relative to self-report, proxies were associated with problem drinking but not current smoking, which may indicate that problem drinking is less socially desirable. Given the tendency for individuals to underestimate drinking behaviours in surveys (Stockwell et al. 2004), data from proxies may be more reliable.
Another limitation results from the need to multiply out responses for past 7-day drinking and past 7-day drunk to estimate drinking and drunkenness in the past 30 days. Although there may have been differential recall bias based on the different time frames and past 7-day alcohol consumption may not represent the full 30 days, we considered the benefits of obtaining a single variable to outweigh the limitation of substratifying analyses. Regardless of time frame, the majority of individuals were drinking to be drunk, and this proportion increased with greater drinking frequency. Lastly, the alcohol and smoking data generated were limited to assessing frequency of use. In this preliminary prevalence study, we were unable to explore the types or quantity of alcohol or cigarettes consumed. This limitation precluded a greater understanding of drunkenness and associated risk factors. Development of future studies with more detailed consumption behaviour data would form a basis for ascertaining health risks and potential interventions.
In summary, we documented a high prevalence of drinking until drunk amongst current drinkers, 1 in 10 men smoke daily and both smoking and problem drinking were greatest amongst the poor and older women in an impoverished community with high rates of HIV, malaria and TB. Given the prominent role that drinking and smoking also have on a multitude of diseases and conditions, having baseline data is necessary to identify trends and focus points for intervention. In recent studies in East Africa, alcohol abuse was related to defaulting from TB treatment (Muture et al. 2011; Sendagire et al. 2012). Based on our data, programmes and interventions are needed to promote responsible alcohol consumption and tobacco use cessation and prevent the initiation of these behaviours. Policies should be evidence based and appropriate both regionally and nationally and should regulate the availability and cost of alcohol by controlling illicit production and alcohol marketing activities. Complementary initiatives that promote public health awareness of alcohol-related harm should be employed across all levels of the population. Other recommendations include monitoring alcohol attributable morbidity and mortality to evaluate the alcohol-related burden and increasing the capacity of services to prevent and treat abuse of alcohol, including alcohol use screening initiatives (World Health Organization 2010).
Acknowledgements
We wish to acknowledge the staff at Kenyan Medical Research Institute (KEMRI) CDC who have spent countless hours collecting and processing data from the Health and Demographic Surveillance System (HDSS) in Kisumu, Kenya. The Health HDSS is supported through funding by the KEMRI CDC collaboration.
Footnotes
Although neither representative nor significant, the highest reported smoking prevalence was in the poorest quintile, while the lowest was in the richest. This is the inverse for Kenya overall in the KDHS, which shows an increasing trend with the exception of the highest quintile. The numbers of women smoking were too small for meaningful comparisons.
References
- Abaynew Y, Deribew A & Deribe K (2011) Factors associated with late presentation to HIV/AIDS care in South Wollo ZoneEthiopia: a case–control study. AIDS Research and Therapy 8, 8. [DOI] [PMC free article] [PubMed] [Google Scholar]
- Abegunde DO, Mathers CD, Adam T, Ortegon M & Strong K (2007) The burden and costs of chronic diseases in low-income and middle-income countries. Lancet 370, 1929–1938. [DOI] [PubMed] [Google Scholar]
- Aekplakorn W, Hogan MC, Tiptaradol S, Wibulpolprasert S, Punyaratabandhu P & Lim SS (2008) Tobacco and hazardous or harmful alcohol use in Thailand: joint prevalence and associations with socioeconomic factors. Addictive Behaviors 33, 503–514. [DOI] [PubMed] [Google Scholar]
- Alwan A, Maclean DR & Riley LM et al. (2010) Monitoring and surveillance of chronic non-communicable diseases: progress and capacity in high-burden countries. Lancet 376, 1861–1868. [DOI] [PubMed] [Google Scholar]
- Amuha MG, Kutyabami P, Kitutu FE, Odoi-Adome R & Kalyango JN (2009) Non-adherence to anti-TB drugs among TB/HIV co-infected patients in Mbarara Hospital Uganda: prevalence and associated factors. African Health Sciences 9 (Suppl 1), S8–S15. [PMC free article] [PubMed] [Google Scholar]
- Booysen F, van der Berg S, Burger R, Maltitz Mv & Rand Gd (2008) Using an asset index to assess trends in poverty in seven sub-saharan African countries. World Development 36, 1113–1130. [Google Scholar]
- Borges G, Cherpitel C & Orozco R et al. (2006) Multicentre study of acute alcohol use and non-fatal injuries: data from the WHO collaborative study on alcohol and injuries. Bulletin of the World Health Organization 84, 453–460. [DOI] [PMC free article] [PubMed] [Google Scholar]
- Chersich MF, Luchters SM, Malonza IM, Mwarogo P, King’ola N & Temmerman M (2007) Heavy episodic drinking among Kenyan female sex workers is associated with unsafe sex, sexual violence and sexually transmitted infections. International Journal of STD and AIDS 18, 764–769. [DOI] [PubMed] [Google Scholar]
- Chersich MF, Rees HV, Scorgie F & Martin G (2009) Enhancing global control of alcohol to reduce unsafe sex and HIV in sub-Saharan Africa. Global Health 5, 16. [DOI] [PMC free article] [PubMed] [Google Scholar]
- Clausen T, Rossow I, Naidoo N & Kowal P (2009) Diverse alcohol drinking patterns in 20 African countries. Addiction 104, 1147–1154. [DOI] [PubMed] [Google Scholar]
- Cohen D & Atieno-Odhiambo E (1989) Siaya: The Historical Anthropology of an African Landscape. James Currey, Ltd., London. [Google Scholar]
- Corrao G, Bagnardi V, Zambon A & La Vecchia C (2004) A meta-analysis of alcohol consumption and the risk of 15 diseases. Preventive Medicine 38, 613–619. [DOI] [PubMed] [Google Scholar]
- Degenhardt L, Chiu WT & Sampson N (2008) Toward a global view of alcohol, tobacco, cannabis, and cocaine use: findings from the WHO World Mental Health Surveys. PLoS Medicine 5, e141. [DOI] [PMC free article] [PubMed] [Google Scholar]
- Ezzati M, Vander Hoorn S & Lawes CM et al. (2005) Rethinking the “diseases of affluence” paradigm: global patterns of nutritional risks in relation to economic development. PLoS Medicine 2, e133. [DOI] [PMC free article] [PubMed] [Google Scholar]
- Filmer D & Pritchett LH (2001) Estimating wealth effects without expenditure data–or tears: an application to educational enrollments in states of India. Demography 38, 115–132. [DOI] [PubMed] [Google Scholar]
- Giovino GA, Mirza SA & Samet JM (2012) Tobacco use in 3 billion individuals from 16 countries: an analysis of nationally representative cross-sectional household surveys. The Lancet 380, 668–679. [DOI] [PubMed] [Google Scholar]
- Jagoe K, Edwards R, Mugusi F, Whiting D & Unwin N (2002) Tobacco smoking in Tanzania, East Africa: population based smoking prevalence using expired alveolar carbon monoxide as a validation tool. Tobacco Control 11, 210–214. [DOI] [PMC free article] [PubMed] [Google Scholar]
- Kalichman SC, Simbayi LC & Kagee A et al. (2006) Associations of poverty, substance use, and HIV transmission risk behaviors in three South African communities. Social Science and Medicine 62, 1641–1649. [DOI] [PubMed] [Google Scholar]
- Kenya National Bureau of Statistics (KNBS) & ICF Macro (2010) Kenya Demographic and Health Survey 2008–09. KNBS and ICF Macro, Calverton, MD. [Google Scholar]
- Lau K, Freyer-Adam J & Coder B et al. (2008) Dose–response relation between volume of drinking and alcohol-related diseases in male general hospital inpatients. Alcohol and Alcoholism 43, 34–38. [DOI] [PubMed] [Google Scholar]
- Lopez AD & Mathers CD (2006) Measuring the global burden of disease and epidemiological transitions: 2002–2030. Annals of Tropical Medicine and Parasitology 100, 481–499. [DOI] [PubMed] [Google Scholar]
- Macintyre K & Bloss E (2011) Alcohol brewing and the African tuberculosis epidemic. Medical Anthropology 30, 126–135. [DOI] [PubMed] [Google Scholar]
- Martinez P, Roislien J, Naidoo N & Clausen T (2011) Alcohol abstinence and drinking among African women: data from the World Health Surveys. BMC Public Health 11, 160. [DOI] [PMC free article] [PubMed] [Google Scholar]
- Mayosi BM, Flisher AJ, Lalloo UG, Sitas F, Tollman SM & Bradshaw D (2009) The burden of non-communicable diseases in South Africa. Lancet 374, 934–947. [DOI] [PubMed] [Google Scholar]
- McKenzie D (2005) Measuring inequality with asset indicators. Journal of Population Economics 18, 229–260. [Google Scholar]
- Meltzer MI, Terlouw DJ & Kolczak MS (2003) The household-level economics of using permethrin-treated bed nets to prevent malaria in children less than five years of age. American Journal of Tropical Medicine and Hygiene 68(4 Suppl), 149–160. [PubMed] [Google Scholar]
- Mugisha F, Arinaitwe-Mugisha J & Hagembe BON (2003) Alcohol, substance and drug use among urban slum adolescents in Nairobi, Kenya. Cities 20, 231–240. [Google Scholar]
- Muture BN, Keraka MN, Kimuu PK, Kabiru EW, Ombeka VO & Oguya F (2011) Factors associated with default from treatment among tuberculosis patients in nairobi province, Kenya: a case control study. BMC Public Health 11, 696. [DOI] [PMC free article] [PubMed] [Google Scholar]
- NACADA (2010) The Alcohol Drinks Control Act, 2010. Available from: http://www.nacada.go.ke/2010/09/the-alcoholic-drinks-control-act-2010/.
- NACADA Authority (2007) Rapid Situation Assessment of Drug and Substance Abuse in Kenya. National Agency for the Campaign Against Drugs Authority, pp. 59. [Google Scholar]
- NACADA Authority (2010) Alcohol Use in Central Province of Kenya. National Agency for the Campaign against Drugs Authority, pp. 59. [Google Scholar]
- Ndetei DM, Khasakhala LI, Ongecha-Owuor FA, Kuria MW, Mutiso V & Kokonya DA (2009) Prevalence of substance abuse among patients in general medical facilities in Kenya. Substance Abuse 30, 182–190. [DOI] [PubMed] [Google Scholar]
- Negin J, Cumming R, de Ramirez SS, Abimbola S & Sachs SE (2011) Risk factors for non-communicable diseases among older adults in rural Africa. Tropical Medicine & International Health 16, 640–646. [DOI] [PubMed] [Google Scholar]
- Neufeld K, Peters D, Rani M, Bonu S & Brooner R (2005) Regular use of alcohol and tobacco in India and its association with age, gender, and poverty. Drug and Alcohol Dependence 77, 283–291. [DOI] [PubMed] [Google Scholar]
- Odhiambo F et al. (2012) Profile: the KEMRI/CDC health and demographic surveillance system – Western Kenya. International Journal of Epidemiology 41, 977–87. [DOI] [PMC free article] [PubMed] [Google Scholar]
- Ogwell A, Aström A & Haugejorden O (2004) Socio-demographic factors of pupils who use tobacco in randomly-selected primary schools in Nairobi province, Kenya. East African medical journal 80, 235–241. [DOI] [PubMed] [Google Scholar]
- Othieno C, Kathuku D & Ndetei D (2009) Substance abuse in outpatients attending rural and urban health centres in Kenya. East African medical journal 77, 592–595. [DOI] [PubMed] [Google Scholar]
- Papas R, Sidle J & Wamalwa E et al. (2010) Estimating alcohol content of traditional brew in western Kenya using culturally relevant methods: the case for cost over volume. AIDS and Behavior 14, 836–844. [DOI] [PMC free article] [PubMed] [Google Scholar]
- Phillips-Howard PA, Nahlen BL & Alaii JA et al. (2003) The efficacy of permethrin-treated bed nets on child mortality and morbidity in western Kenya I. Development of infrastructure and description of study site. American Journal of Tropical Medicine and Hygiene 68(4 Suppl), 3–9. [PubMed] [Google Scholar]
- Rehm J, Klotsche J & Patra J (2007) Comparative quantification of alcohol exposure as risk factor for global burden of disease. International Journal of Methods in Psychiatric Research 16, 66–76. [DOI] [PMC free article] [PubMed] [Google Scholar]
- Sendagire I, Van der Loeff MS, Kambugu A, Konde-Lule J & Cobelens F (2012) Urban movement and alcohol intake strongly predict defaulting from tuberculosis treatment: an operational study. PLoS ONE 7, e35908. [DOI] [PMC free article] [PubMed] [Google Scholar]
- Stockwell T, Donath S, Cooper-Stanbury M, Chikritzhs T, Catalano P & Mateo C (2004) Under-reporting of alcohol consumption in household surveys: a comparison of quantity–frequency, graduated–frequency and recent recall. Addiction 99, 1024–1033. [DOI] [PubMed] [Google Scholar]
- Willis J (2002) Potent Brews: A Social History of Alcohol in East Africa 1850–1999. The British Institute in East Africa, London. [Google Scholar]
- World Health Organization (2003) World Health Survey – Kenya. World Health Organization, Geneva, Switzerland. [Google Scholar]
- World Health Organization (2010) Global Strategy to Reduce the Harmful Use of Alcohol. World Health Organization, Geneva. [DOI] [PMC free article] [PubMed] [Google Scholar]
- World Health Organization (2011a) WHO Report on the Global Tobacco Epidemic. World Health Organization, Geneva. [Google Scholar]
- World Health Organization (2011b) Tobacco Fact Sheet N°339. Available from: http://www.who.int/mediacentre/factsheets/fs339/en/index.html. [accessed 7 February 2012].