

Abstract
BACKGROUND:
Primary immunodeficiency disorders (PIDDs) describe a myriad of diseases caused by inherited defects within the immune system. As the number of identified genetic defects associated with PIDDs increases, understanding the incidence and outcomes of PIDD patients becomes imperative.
OBJECTIVE:
To characterize the frequency of new diagnoses, patterns of health care utilization, rates of hematopoietic stem cell transplantation (HSCT), and mortality in pediatric patients with PIDDs.
METHODS:
A retrospective cohort analysis of the Pediatric Health Information System database from 2004 to 2018 for pediatric inpatients with an International Classification of Diseases, Ninth and 10th Revisions (ICD-9/ICD-10). code associated with PIDD.
RESULTS:
A total of 17,234 patients with a PIDD were hospitalized from 2004 to 2018. There were 2.8 new PIDD diagnoses and 6.3 PIDD hospitalizations per 1,000 discharges; these metrics were unchanged during the study period. The number of new diagnoses for B-cell and antibody defects significantly increased over time. The number of new PIDD diagnoses significantly increased in adolescents or adults and decreased in infants. T-cell disorders had the highest number of intensive care unit admissions. There were 747 PIDD patients who underwent HSCT; complications of HSCT significantly decreased over time. Mortality rates significantly decreased in all PIDD patients and in patients receiving HSCT.
CONCLUSIONS:
The total hospitalizations and incidence of PIDDs within the hospitalized pediatric population were unchanged. There were significant changes in the class of PIDD diagnosed, the age at diagnosis, and health care utilization metrics. Mortality significantly decreased over time within the PIDD cohort.
Keywords: Primary immunodeficiency, Pediatrics, Hematopoietic stem cell transplant, Mortality
INTRODUCTION
Primary immunodeficiency is a term that encompasses several diseases caused by inherited defects in the immune system. Clinical presentation of primary immunodeficiency disorders (PIDDs) represents a spectrum of immune system dysfunction, ranging from recurrent or opportunistic infections to autoimmune and autoinflammatory conditions. In the 2009 International Union of Immunologic Societies (IUIS) Primary Immunodeficiency Diseases Classification committee report, approximately 150 inborn errors of immunity were described.1,2 Over the next decade, with the furthered phenotypic characterization of PIDDs coupled with widespread utilization of cost-effective unbiased sequencing approaches, the number of identified genetic defects associated with PIDDs nearly tripled.2–7 The 2019 IUIS committee report described 430 known inborn errors of immunity that contribute to 404 PIDDs.2,8
As the number of genetic defects associated with PIDDs increases, understanding the prevalence and incidence of PIDD diagnosis becomes imperative. Using a national telephone survey, one study estimated the prevalence of PIDDs in the United States to be 1 PIDD patient in every 1,200 individuals.9 A more recent retrospective study using the Kids’ Inpatient Database (KID) found that the prevalence of pediatric PIDDs in the United States was 126 cases per 100,000 individuals, slightly higher than previous estimates.10 In addition, multiple national surveys and registries have been formed in an attempt to quantify the number of patients living with PIDDs.11–18 One recent study collated these individual registries on a global scale; this analysis found 104,614 patients with PIDDs enrolled in registries.19 This total, though, likely underrepresents the global burden of PIDDs because extrapolation of the findings from the survey-based studies in the United States would suggest a national burden alone of 6 to 8 million individuals with diagnosed PIDDs.9,10,19 In contrast with PIDD prevalence, PIDD incidence has yet to be fully characterized. One study based in the Mayo Clinic found a rate of diagnosis of 4.6 per 100,000 person-years.20 However, the incidence of PIDDs has yet to be studied longitudinally on the national level.
Increasing prevalence is impacted not only by increasing number of new diagnoses but also by longer survival in known patients affected by PIDDs. One factor contributing to increased survival in a subset of patients with PIDDs is the use of hematopoietic stem cell transplantation (HSCT). The HSCT has been utilized for PIDDs since the 1960s and remains the only curative option for certain conditions, such as severe combined immunodeficiency (SCID), Wiskott-Aldrich syndrome, neutrophil defects, and others.21 Survival of PIDD patients receiving HSCT has improved over time with advances in conditioning regimens, supportive care measures, and therapeutic options for graft-versus-host disease (GVHD), with one study estimating a 90% 5-year survival rate.22–24 However, it is unclear whether improvements in survival apply to all populations equally. When evaluated by diagnosis, one study found patients with SCID receiving HSCT have improved 1- and 3-year survival rates since 2000, whereas transplanted patients with non-SCID diagnoses have had unchanged survival rates.25
Given the multiple factors impacting the prevalence and incidence of the PIDD population in the past decade, we sought to evaluate trends in diagnosis, health care utilization, HSCT rates and complications, and mortality using the Pediatric Health Information System (PHIS) database.
METHODS
Data collection
The PHIS is a comparative pediatric administrative database maintained by the Children’s Hospital Association with participation of more than 52 children’s hospitals across the United States. The PHIS database collects clinical data and resource utilization metrics for emergency department, observation, and inpatient encounters. Individual patients are given a unique medical record number that is linked to multiple encounter numbers, which can allow for longitudinal tracking of each individual patient. Following each hospital discharge, the information from that encounter is added to the PHIS database. From 2004 to 2018, there were a total of 6.1 million discharges included. The PHIS database was queried for inpatient admissions containing an International Classification of Diseases, Ninth Revision (ICD-9) or 10th Revision (ICD-10) diagnosis code corresponding to a PIDD from 2004 to 2018 (Table I). Patients with a known cause of secondary immunodeficiency were excluded: human immunodeficiency virus (ICD-9 codes: V08, 042, V65.44, 079.53, 795.71; ICD-10 codes: B20), metabolic disorders and nutritional deficiencies (ICD-9 codes: 260–273.9; ICD-10 codes: E40–E46, E50–E64, E70–E88), and malignancies (ICD-9 codes: 140–199, 200–203.8, 204.1–207.8; ICD-10 codes: C000–C96Z). In patients with multiple specific PIDD diagnoses, the patient’s data were included for each corresponding diagnosis during the analysis. Unspecified diagnosis codes were only utilized in the absence of a specific code (eg, a patient with diagnoses of DiGeorge syndrome and Other deficiency of cell-mediated immunity was analyzed as DiGeorge syndrome). All patient information was deidentified and handled in a secure manner as approved by the institutional review board (STUDY19100181).
TABLE I.
ICD-9/ICD-10 PIDD codes associated with primary immunodeficiency diagnoses included in study
| Class | Diagnosis | ICD-9 | ICD-10 |
|---|---|---|---|
| B cell | Hypogammaglobulinemia, unspecified | 279.00 | — |
| Hereditary hypogammaglobulinemia | — | D80.0 | |
| Nonfamilial hypogammaglobulinemia | — | D80.1 | |
| Selective immunoglobulin A [IgA] immunodeficiency | 279.01 | D80.2 | |
| Selective IgM immunodeficiency | 279.02 | D80.4 | |
| Selective deficiency of IgG subclasses | — | D80.3 | |
| Other selective immunoglobulin deficiencies | 279.03 | — | |
| Congenital hypogammaglobulinemia | 279.04 | — | |
| Common variable immunodeficiency (CVID) | 279.06 | D83.9 | |
| CVID with predominant abnormalities of B-cell number/function | — | D83.0 | |
| CVID with predominant immunoregulatory T-cell disorders | — | D83.1 | |
| CVID with autoantibodies to B or T cells | — | D83.2 | |
| Other common variable immunodeficiencies | — | D83.8 | |
| Antibody deficiency with near-normal immunoglobulins or with hyperimmunoglobulinemia | — | D80.6 | |
| Transient hypogammaglobulinemia of infancy | — | D80.7 | |
| Immunodeficiency following hereditary defective response to Epstein-Barr virus | — | D82.3 | |
| Other immunodeficiencies with predominantly antibody defects | — | D80.8 | |
| Immunodeficiency with predominantly antibody defects, unspecified | — | D80.9 | |
| Other deficiency of humoral immunity | 279.09 | — | |
| T cell | Immunodeficiency with predominant T-cell defect, unspecified | 279.10 | — |
| DiGeorge syndrome | 279.11 | D82.1 | |
| Wiskott-Aldrich syndrome | 279.12 | D82.0 | |
| Nezelof syndrome | 279.13 | D81.4 | |
| Hyperimmunoglobulin E [IgE] syndrome | — | D82.4 | |
| Combined | Combined immunity deficiency | 279.2 | D81.9 |
| Severe combined immunodeficiency [SCID] with reticular dysgenesis | — | D81.0 | |
| Severe combined immunodeficiency [SCID] with low T- and B-cell numbers | — | D81.1 | |
| Severe combined immunodeficiency [SCID] with low or normal B-cell numbers | — | D81.2 | |
| Adenosine deaminase [ADA] deficiency | — | D81.3 | |
| Purine nucleoside phosphorylase [PNP] deficiency | — | D81.5 | |
| Major histocompatibility complex class I deficiency | — | D81.6 | |
| Major histocompatibility complex class II deficiency | — | D81.7 | |
| Immunodeficiency with increased IgM | 279.05 | D80.5 | |
| Neutrophil | Functional disorders of polymorphonuclear neutrophils | 288.1 | D71 |
| Genetic anomalies of leukocytes | 288.2 | D72.0 | |
| Lymphocyte function antigen-1 [LFA-1] defect | — | D84.0 | |
| Complement | Defects in the complement system | — | D84.1 |
| Unspecified | Unspecified immunity deficiency | 279.3 | — |
| Other specified disorders involving the immune mechanism | 279.8 | — | |
| Other deficiency of cell-mediated immunity | 279.19 | — | |
| Unspecified disorder of immune mechanism | 279.9 | — | |
| Immunodeficiency with short-limbed stature | — | D82.2 | |
| Immunodeficiency associated with other specified major defects | — | D82.8 | |
| Immunodeficiency associated with major defect, unspecified | — | D82.9 | |
| Other specified immunodeficiencies | — | D84.8 | |
| Immunodeficiency, unspecified | — | D84.9 |
Study outcomes
The primary outcome of this study was the annual incidence of new PIDD diagnoses, defined as the annual number of first-time hospitalizations for patients with a PIDD code with all PHIS discharges serving as the denominator. Secondary outcomes included demographics, associated diagnoses, length of stay, intensive care unit (ICU) admissions, billed charges, HSCT rate, complications associated with HSCT, and mortality. The encounter during which a patient received HSCT was identified and an additional subgroup analysis was performed. In addition, within the HSCT group, common complications such as adenovirus, aspergillosis, bacteremia, candidiasis, central line infection, cytomegalovirus (CMV), Epstein-Barr virus, GVHD, and veno-occlusive disease/sinusoidal obstruction syndrome were recorded. Mortality rates were defined by the number of mortalities per total number of PIDD patients hospitalized per year. Publicly available data regarding HSCT in individuals younger than 18 years were used from the Center for International Blood and Marrow Transplant Research (CIBMTR) for comparison. The data presented here are preliminary and were obtained from the Coordinating Center of the Center for International Blood and Marrow Transplant Research. The analysis has not been reviewed or approved by the Statistical or Scientific Committees of the CIBMTR. The views expressed in this article are that of the authors and do not reflect the position of the CIBMTR.
Statistics
Continuous variables were analyzed using median with interquartile range. Descriptive and categorical statistics were analyzed with a χ2 test. Univariate linear regression was performed on temporally associated data, with categorical time serving as the independent variable. Statistical analyses were performed in Tableau and Graphpad Prism (v. 8.4.2, Graphpad Software). Statistical significance was characterized by P less than .05.
RESULTS
Demographics
From 2004 to 2018, a total of 17,234 patients (55% male) with PIDDs accounted for 35,581 hospitalizations (Table II). The preponderance of patients (30.4%) presented during the first year of life.
TABLE II.
Demographics of PIDD patients
| Demographics | Patients, n (%) (n = 17,234) |
|---|---|
| Year, n (%) | |
| 2004 | 1,230 (7.1) |
| 2005 | 1,060 (6.2) |
| 2006 | 1,131 (6.6) |
| 2007 | 1,097 (6.4) |
| 2008 | 1,052 (6.1) |
| 2009 | 1,052 (6.1) |
| 2010 | 1,098 (6.4) |
| 2011 | 1,159 (6.7) |
| 2012 | 1,117 (6.5 ) |
| 2013 | 1,323 (7.7) |
| 2014 | 1,426 (8.3) |
| 2015 | 1,292 (7.5) |
| 2016 | 1,078 (6.3) |
| 2017 | 1,049 (6.1) |
| 2018 | 1,070 (6.2) |
| Biological sex, n (%) | |
| Male | 9,509 (55.2) |
| Female | 7,725 (44.8) |
| AAP Age title, n (%) | |
| Neonate (<30 d) | 2,399 (13.9) |
| Infancy (30 d–0.9 y) | 2,845 (16.5) |
| Early childhood (1–4.9 y) | 3,996 (23.2) |
| Late childhood (5–12.9 y) | 4,518 (26.2) |
| Adolescent (13–17.9 y) | 2,691 (15.6) |
| Adult (≥18 y) | 785 (4.6) |
| Race, n (%) | |
| White | 8,113 (47.1) |
| Black | 1,815 (10.5) |
| Asian | 382 (2.2) |
| American Indian | 119 (0.7) |
| Pacific Islander | 74 (0.4) |
| Other | 1,890 (11.0) |
| Missing | 4,841 (28.0) |
| Ethnicity, n (%) | |
| Hispanic/Latino | 2,940 (17.1) |
| Not Hispanic/Latino | 9,024 (52.4) |
| Unknown | 5,270 (30.6) |
| Income, median (IQR) | $42,431 ($33,936–$55,539) |
AAP, American Academy of Pediatrics; IQR, interquartile range.
Prevalence and incidence of hospitalization
There were 6.3 hospitalizations and 2.8 new diagnoses per 1,000 discharges for PIDD patients, which remained stable during the study period (P < .05; Figure 1, A). T-cell disorders (33%), B-cell disorders (30%), and unspecified immunodeficiency disorders (26%) were the most common classes coded for on the initial presentation (Figure 1, B). The incidence of B-cell and antibody defect diagnosis codes significantly increased over the study period, whereas T-cell diagnoses decreased (Figure 1, C; P < .05 and P < .0005, respectively). Changes in hospitalization rates for the specific diagnosis codes hypogammaglobulinemia, selective IgM (immunoglobulin M) deficiency, DiGeorge syndrome, and Wiskott-Aldrich syndrome contributed to those changes (Figure E1; available in this article’s Online Repository at www.jaci-inpractice.org). Complement disorders, which were given a specific code in the ICD-10, significantly increased over 2015 to 2018 (Figure 1, C; p<0.002). Combined, neutrophil, and unspecified disorder code use did not change over the study period (Figure 1, C).
FIGURE 1.
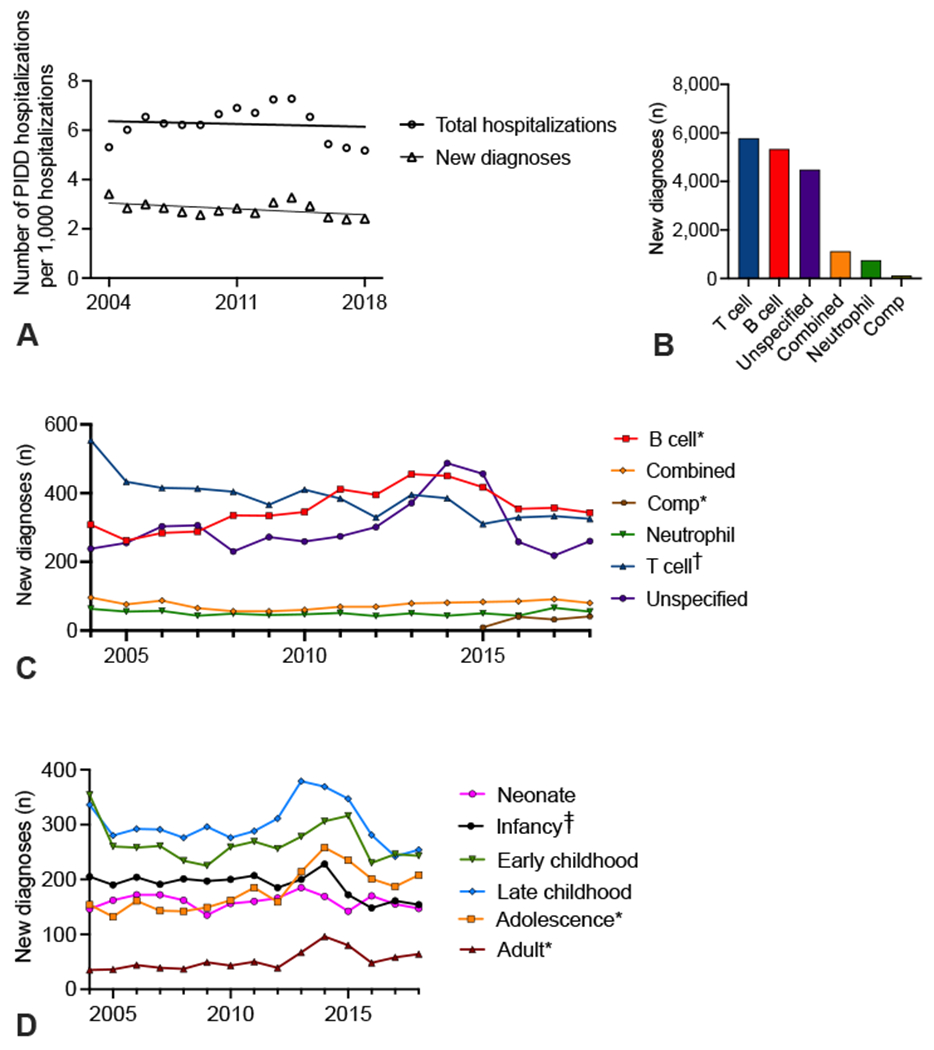
Incidence of PIDD diagnoses by class and age. (A) Hospitalizations and new diagnoses for PIDDs per 1,000 hospital discharges in the PHIS database. (B) New diagnoses per class of PIDDs. (C) New diagnoses of PIDDs per year. (D) Number of new diagnoses of PIDDs per year for various American Acadamey of Pediarics age groups. *P < .01; †P <.005; ‡P < .05 by linear regression. Comp, Complement disorders.
The age at which patients were first diagnosed changed over time. The number of patients with a new PIDD diagnosis during the adolescent and adult years significantly increased, whereas the diagnosis during infancy decreased (Figure 1, D; P < .01 and P < .05, respectively). Per PIDD class, there was a significant increase in the number of neonates diagnosed with combined immunodeficiency, whereas T-cell disorders had significant decreases in diagnosis in multiple childhood age groups (Figure E2; available in this article’s Online Repository at www.jaci-inpractice.org).
Patients with PIDDs were admitted to the hospital with several concomitant conditions as measured by the coded primary diagnosis on the encounter (Table E1; available in this article’s Online Repository at www.jaci-inpractice.org). The most common indication for hospitalization was respiratory disease followed by congenital anomalies (Table E1).
Resource utilization
The median length of stay for all hospitalizations was 4 days whereas first-time hospitalizations had a median length of stay of 5 days. By class, combined immunodeficiencies had the longest median length of stay (6 days), which was unchanged over the duration of the study period (P = .61). B-cell, T-cell, neutrophil, and unspecified immunodeficiencies had a median length of stay of 4 days each, all of which significantly decreased during the study period (P < .05 for all analyses).
There were 11,606 hospitalizations (30%) and 5,634 first-time hospitalizations (33%) requiring ICU admission. T-cell disorders accounted for the majority (57%) of ICU admissions (Figure 2, A), with DiGeorge syndrome representing the PIDD code with the most frequent ICU admissions (data not shown). During the study period, B-cell disorders had an increase in ICU admissions per year (Figure 2, B; P < .003).
FIGURE 2.

Health care utilization of PIDD patients. (A) Number of ICU admissions by PIDD diagnosis class. (B) ICU admissions by PIDD class annually. (C) Billed charges per PIDD class. (D) Billed charges by PIDD class annually. *P < .005; †P < .0005 by linear regression. Comp: Complement disorders.
During the study period, the median billed charges for a hospitalization with a PIDD diagnosis was $38,740. T-cell B-cell disorders accounted for 41% and 31% of all billed charges, respectively (Figure 2, C). The total billed charges for patients with PIDDs had a significant yearly increase over the study period (data not shown). Yearly analysis of the median billed charges per admission demonstrated a significant increase for each individual class of PIDDs (Figure 2, D; P ≤ .001 for all analyses).
Hematopoietic stem cell transplantation (HSCT)
A total of 747 patients (71% male) with a PIDD received HSCT during the study period (Table III). These patients accounted for 2,895 hospitalizations with a median of 3 hospitalizations per patient (including transplant). The preponderances of patients were infants (36%) and Caucasians (49%). The number of HSCTs in 2016 to 2018 was lower than in 2015 and earlier, coincident with the change from ICD-9 to ICD-10 diagnosis codes (Table III). In comparison, the CIBMTR database had approximately 200 HSCTs performed for pediatric primary immunodeficiency from 2014 to 2018. The capture rate using the PHIS database decreased following adoption of ICD-10 codes (Figure E3; available in this article’s Online Repository at www.jaci-inpractice.org).
TABLE III.
Demographics for PIDD patients receiving bone marrow transplantation
| Demographics | Patients, n (%) (n = 747) |
|---|---|
| Year, n (%) | |
| 2004 | 34 (4.6) |
| 2005 | 47 (6.3) |
| 2006 | 46 (6.2) |
| 2007 | 46 (6.2) |
| 2008 | 52 (7.0) |
| 2009 | 51 (6.8) |
| 2010 | 61 (8.2) |
| 2011 | 71 (9.5) |
| 2012 | 72 (9.6) |
| 2013 | 68 (9.1) |
| 2014 | 63 (8.4) |
| 2015 | 53 (7.1) |
| 2016 | 30 (4.0) |
| 2017 | 23 (3.1) |
| 2018 | 30 (4.0) |
| Biological sex, n (%) | |
| Male | 531 (71.1) |
| Female | 216 (28.9) |
| AAP Age title, n (%) | |
| Neonate (<30 d) | 53 (7.1) |
| Infancy (30 d–0.9 y) | 270 (36.1) |
| Early childhood (1–4.9 y) | 218 (29.2) |
| Late childhood (5–12.9 y) | 131 (17.5) |
| Adolescent (13–17.9 y) | 52 (7.0) |
| Adult (≥18 y) | 23 (3.1) |
| Race, n (%) | |
| White | 370 (49.5) |
| Black | 58 (7.8) |
| Asian | 22 (2.9) |
| American Indian | 7 (0.9) |
| Pacific Islander | 4 (0.5) |
| Other | 100 (13.4) |
| Missing | 186 (24.9) |
| Ethnicity, n (%) | |
| Hispanic/Latino | 139 (18.6) |
| Not Hispanic/Latino | 437 (58.5) |
| Unknown | 171 (22.9) |
| Income, median (IQR) | $41,680 ($16,274–$139.188) |
AAP, American Academy of Pediatrics; IQR, interquartile range.
The HSCT was performed most frequently on patients with combined immunodeficiency diagnosis codes over the study period (Figure 3, A). The number of combined, B-cell, and neutrophil immunodeficiency cases treated with an HSCT performed was unchanged over time (Figure 3, B). T-cell deficiencies, however, were treated less frequently with HSCTs (Figure 3, B; p<0.05). The HSCT rate per specific diagnosis code also changed over time (Figure E4; available in this article’s Online Repository at www.jaci-inpractice.org).
FIGURE 3.

HSCT in PIDD patients. (A) Number of HSCTs performed by PIDD class. (B) HSCT by PIDD class annually. (C) Age at HSCT by year. (D) Age at HSCT per PIDD class annually. (E) Median length of stay for HSCT patients. B, D, E: *P < .05 by linear regression. Comp, Complement disorders.
The average age at transplantation increased significantly over the study period (Figure 3, C). When evaluated by PIDD class, only neutrophil disorders had a significant increase in the age at transplant (Figure 3, D; p<0.05). Combined immunodeficiencies had a 66% reduction in the age at transplant; transplant occurred at a median of 252 days in 2004 to 2006 compared with a median of 87 days in 2018 (Figure 3, D; P < .05).
The median length of stay for the initial HSCT encounter was 48 days. However, the length of stay for initial HSCT encounter decreased significantly (Figure 3, E; P < .05). For patients receiving HSCT, the number of ICU admissions, the median billed charges, and the total billed charges did not change over time (data not shown).
The most common complication associated with HSCT in the PIDD population was bacteremia (14%) followed by CMV (13.6%) (Figure 4, A). The percentage of patients with adenovirus, bacteremia, and candidiasis all significantly decreased over the study period (Figure 4, B). Bacteremia was most common in T-cell immunodeficiencies and least common in neutrophil disorders (Figure 4, C). Candidiasis was most commonly seen in combined immunodeficiencies, whereas patients with neutrophil or unspecified disorders had the highest rates of CMV infection (Figure 4, C).
FIGURE 4.

HSCT complications in PIDD patients. (A) Number of PIDD patients with individual complications post-HSCT. (B) Linear regression of rate of adenovirus, bacteremia, and candidiasis in PIDD patients receiving HSCT. The CMV, GVHD, central line infections, Epstein-Barr virus (EBV), aspergillosis, and veno-occlusive disease/sinusoidal obstruction syndrome (VOD/SOS) rates were unchanged. (C) Rates of complications per PIDD class. C: *P < .05; ‡P < .01 by χ2 analysis.
Mortality rates
A total of 836 mortalities (4.85%) were identified for patients with PIDDs from 2004 to 2018. Mortality rates significantly decreased over the study period (Figure 5, A; P < .0001). T-cell and B-cell defects had the highest total number of mortalities during the study period, whereas combined immunodeficiencies had the highest mortality rate (Figure 5, B, C). Mortality rates decreased significantly over time for neutrophil, T-cell, and unspecified disorders (Figure 5D; P < .02 for all analyses). Reductions in neutrophil and T-cell mortality rates were largely driven by reductions in mortality associated with the specific diagnosis code Functional disorders of polymorphonuclear neutrophils and DiGeorge syndrome, respectively (data not shown; P = .01 and P < .0001, respectively).
FIGURE 5.
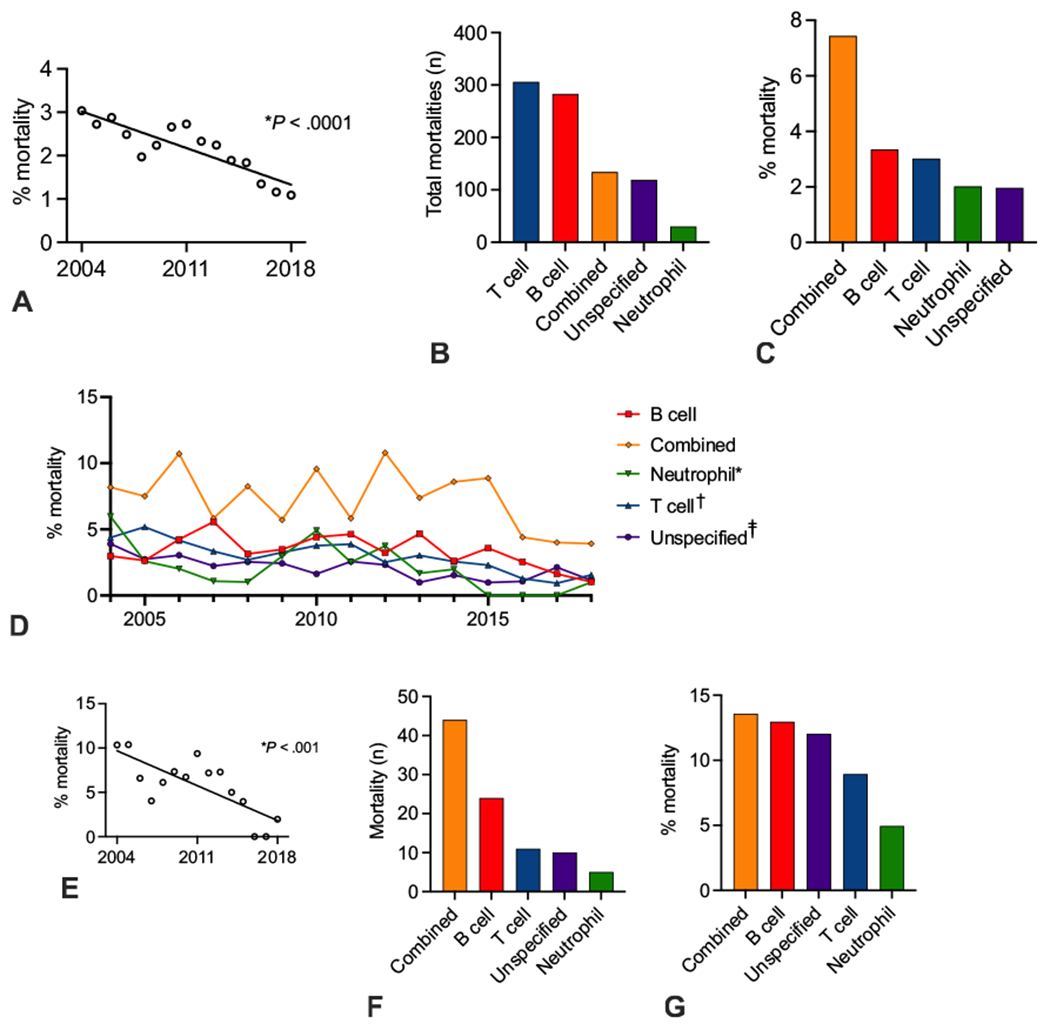
Mortality in PIDD patients. (A) Linear regression of mortality rates in PIDD patients. (B, C) Mortality number and mortality rate by PIDD class. (D) Mortality rate by PIDD class per year. D: *P < .05; †P < .0005; ‡P < .005 by linear regression. (E) Linear regression of mortality rates in PIDD patients receiving HSCT. (F, G) Mortality number and mortality rate in patients receiving HSCT by PIDD class.
For patients receiving HSCTs, the mortality rate per year significantly decreased over the study period (Figure 5, E; P < .001). Per PIDD class for HSCT recipients, combined immunodeficiencies had the largest number of total mortalities (Figure 5, F). Neutrophil disorders had the lowest number of total mortalities and the lowest mortality rate (Figure 5, F, G).
DISCUSSION
The current study details trends within the changing landscape of pediatric PIDDs. The estimated incidence of PIDDs was 2.8 new diagnoses per 1,000 discharges with a total hospitalization rate of 6.3 patients per 1,000 discharges. The incidence and hospitalization rate of total PIDDs within the pediatric population were unchanged during the study period. These data suggest that, in the setting of an expansion of known PIDDs, the incidence of first-time hospitalization remained the same.2 The incidence of first-time hospitalization rates among pediatric inpatients is quite high compared with a nationwide prevalence estimates of 1 per 1,000 patients. This may represent an improved capture with the use of the PHIS database rather than registries (which requires patient enrollment) or other databases without means for longitudinal analyses. In addition, the population in our study (ie, pediatric inpatients) is more restrictive than prior populations in survey-based studies, which could account for the increased incidence.
Interestingly, the PIDD incidence in the adolescent and adult population at pediatric hospitals increased over the study period, whereas diagnosis rates in infants decreased. These findings corroborate a national survey in 2007 by the Immune Deficiency Foundation, which found that only 40% of patients with PIDDs were diagnosed under the age of 18 years.26 However, expediency in diagnosis is often critical in PIDD patients because older age at time of PIDD diagnosis has been previously associated with increased mortality.20 To that end, expansion of genetic testing to younger age groups within pediatric patients could have important implications in the identification and treatment of PIDDs. One group has proposed screening of infants with unusual infections and/or hematological abnormalities with whole exome sequencing; these authors described a screening protocol in infancy in which genetic defects causing PIDDs were found in 2% of subjects, with direct therapeutic implications in 69% of patients found to have an underlying diagnosis.27 Collectively, these data may suggest that the promise of genetic testing for PIDD diagnosis is not yet being reflected in terms of earlier diagnosis.
Although overall incidence in infants decreased, diagnosis of combined immunodeficiencies in neonates rose dramatically over the study period, associated with significant decreases in early/late childhood combined diagnoses. These findings occur in the setting of widespread implementation of newborn screening, suggesting that this initiative has been fruitful in earlier diagnosis of combined immunodeficiencies.28,29 T-cell disorder diagnosis rates decreased significant over time, including in infants, which contributes to the overall decrease in diagnosis in infancy. These changes in diagnostic rates to the T-cell disorder population require additional study.
There were, however, changes in incidence within specific classes of PIDDs in all age groups. The incidence of PIDDs associated with B-cell and antibody defects significantly increased, whereas T-cell disorder incidence decreased by year. However, the distribution of PIDD diagnoses found in the current study demonstrates similar frequencies of B- and T-cell disorders compared with data published from the Kids’ database, which demonstrated approximately 13,000 hospitalizations for both classes of immunodeficiency from 2003 to 2012.10 Prior registry studies, however, have shown antibody defects comprise the majority of case (51.9%), whereas cellular and humoral immune defects account for 10.8% of cases.19 Interestingly, these data may suggest that T-cell disorders are overrepresented within the hospitalized pediatric population. In addition, this discrepancy may represent an enrollment bias associated with registry studies.
T-cell disorders represented the highest total percentage of ICU admissions and billed charges, accounting for $2.5 billion over the study period. Despite the relatively low aggregate of health care costs, the average cost of a PIDD admission demonstrates how expensive care is for these patients. In comparison with 1 2016 study of cost per admission using a pediatric database, PIDDs had similar average billed charges to multiple significant trauma ($37,900/admission) and myeloproliferative disorders ($29,800/admission).30 Billed charges per admission significantly increased for all classes of PIDDs, a finding consistent with the overall increased in health care expenditures for pediatrics.31 Total billed charges for patients receiving HSCT, interestingly, did not significantly change over the study period.
There were several intriguing findings regarding HSCT patients. First, the age at transplantation varied based on underlying disease class. Combined immunodeficiency patients, in conjunction with increased numbers of diagnosis in neonates, had a significant reduction in age at the time of transplant, which has been shown to be a key predictor for outcome. Several studies have demonstrated that HSCT under the age of 3.5 months was associated with improved survival rates in SCID patients.28,32,33 Neutrophil defects, though, were treated with HSCT at an increasingly older age, perhaps reflecting the overall trend in age at diagnosis. However, time to transplant and age at transplant has not yet been extensively studied in disorders of neutrophils in a similar fashion to that of combined immunodeficiency and could represent an area of future investigation.
Promisingly, mortality among all PIDD patients has significantly decreased over the study period. During our study period, T-cell, neutrophil, and unspecified immunodeficiencies all had significant reduction in mortality rates. These data are the first to demonstrate such a change because prior studies have showed stable mortality rates amongst PIDD patients.10,34 Mortality rates amongst PIDD patients receiving HSCT significantly decreased over time, perhaps driven by significant decreases in rates of common post-HSCT complications such as bacteremia or by improvements in conditioning or other pre-HSCT variables.
The current study has several limitations. First, these data underrepresent the true incidence of PIDD because the PHIS database does not include every pediatric care center. Likewise, there are potential cases of PIDD that never require admission to a tertiary-care children’s hospital and are managed as outpatients and/or in nonacademic centers. One possible limitation is that, as diagnostic methods improve, these conditions may be identified more on an outpatient basis prior to an inpatient admission with an acute illness. A meaningful percentage of patients had unspecified immunodeficiencies, reflecting the limitations of either diagnostic capabilities or coding classifications used in the ICD-9/ICD-10. Furthermore, classifying immunodeficiencies based on the possible affected cell type (eg, B cell vs neutrophil) can be reductive to the underlying genetic mutation and pathophysiology. As molecular identification and classification within the field of PIDD increases, this granularity is more likely to be reflected within the billing code systems allowing for more detailed studies. Finally, the number of HSCTs included in the PHIS database decreased in 2016 associated temporally with the change to ICD-10 codes. Reliance on accurate code use by providers is a limitation of the PHIS database. In addition, these findings demonstrate that changes to coding schemas can lead to poor capture of particular procedures during the transitional period. Given the lower capture rates toward the latter half of the study, conclusions about the HSCT population should be focused on the overall trends, whereas caution should be applied to analyses on individual statistics from the latter years.
However, the current study characterizes the incidence, comorbidities, financial implications, HSCT rates, and mortality of pediatric PIDDs in the United States. Additional study in the adult population to evaluate similar outcomes is warranted. Future studies could compare PHIS inpatient data with a national dataset containing outpatient encounters (eg, Medicaid) to fully capture rates of PIDD diagnoses and evaluate for increasing outpatient encounters. In regards to genetic diagnosis, the PHIS database is limited by no recorded diagnostic method. In future projects, hospital data captured by PHIS could be combined with more granular diagnostic data from the U.S. Immunodeficiency Network (USIDNET). Likewise, further analyses of the outcomes of HSCT in the pediatric PIDD population using additional databases (eg,. CIBMTR) or registries is warranted because the PHIS database had lower HSCT capture rates following ICD-9 to ICD-10 changes in 2015 to 2016. Investigations using multivariate regressions to identify the various factors contributing to these trends and outcomes could be beneficial in furthering our understanding of improved patient care for this unique population.
Supplementary Material
What is already known about this topic?
The number of described primary immunodeficiencies is increasing. Incidence of primary immunodeficiency has not yet been studied on a national level. Prior inpatient database studies demonstrated prevalence and stable mortality rates of primary immunodeficiency patients.
What does this article add to our knowledge?
The incidence of pediatric primary immunodeficiency is 2.8 per 1,000 hospital discharges. Diagnosis of B-cell disorders increased. T-cell diagnoses had the highest health care utilization. Mortality is decreasing in the primary immunodeficiency population.
How does this study impact current management guidelines?
The current study highlights several key trends in the pediatric primary immunodeficiency population, including stable incidence, increasing health care utilization, decreasing complications following hematopoietic stem cell transplantation, and decreasing mortality.
Acknowledgments
The authors would like to thank Brian Campfield, MD and Michael Zhang, MD/PhD for their critical review of the manuscript. We would like to thank Jim Zullo, BSE/MSIS, for assistance with obtaining the PHIS data as well as his expertise.
Research reported in this publication was supported by the Eunice Kennedy Shriver National Institute Of Child Health & Human Development of the National Institutes of Health under Award Number K12HD000S50. The content is solely the responsibility of the authors and does not necessarily represent the official views of the National Institutes of Health.
Abbreviations used
- CIBMTR
Center for International Blood and Marrow Transplant Research
- CMV
Cytomegalovirus
- GVHD
Graft-versus-host disease
- HSCT
Hematopoietic stem cell transplantation
- PHIS
Pediatric Health Information System
- PIDDs
Primary immunodeficiency disorders
- SCID
Severe combined immunodeficiency
Footnotes
Conflicts of interest: The authors declare that they have no relevant conflicts of interest.
REFERENCES
- 1.International Union of Immunological Societies Expert Committee on Primary ImmunodeficienciesNotarangelo LD, Fischer A, Geha RS, Casanova J-L, Chapel H, et al. Primary immunodeficiencies: 2009 update. J Allergy Clin Immunol 2009;124:1161–78. [DOI] [PMC free article] [PubMed] [Google Scholar]
- 2.Tangye SG, Al-Herz W, Bousfiha A, Chatila T, Cunningham-Rundles C, Etzioni A, et al. Human inborn errors of immunity: 2019 update on the classification from the International Union of Immunological Societies Expert Committee. J Clin Immunol 2020;40:24–64. [DOI] [PMC free article] [PubMed] [Google Scholar]
- 3.Fusaro M, Rosain J, Grandin V, Lambert N, Hanein S, Fourrage C, et al. Improving the diagnostic efficiency of primary immunodeficiencies with targeted next-generation sequencing. J Allergy Clin Immunol 2021;147:734–7. [DOI] [PubMed] [Google Scholar]
- 4.Conley ME, Casanova J-L. Discovery of single-gene inborn errors of immunity by next generation sequencing. Curr Opin Immunol 2014;30:17–23. [DOI] [PMC free article] [PubMed] [Google Scholar]
- 5.Picard C, Fischer A. Contribution of high-throughput DNA sequencing to the study of primary immunodeficiencies. Eur J Immunol 2014;44:2854–61. [DOI] [PubMed] [Google Scholar]
- 6.Meyts I, Bosch B, Bolze A, Boisson B, Itan Y, Belkadi A, et al. Exome and genome sequencing for inborn errors of immunity. J Allergy Clin Immunol 2016;138:957–69. [DOI] [PMC free article] [PubMed] [Google Scholar]
- 7.Casanova J-L, Abel L Human genetics of infectious diseases: unique insights into immunological redundancy. Semin Immunol 2018;36:1–12. [DOI] [PMC free article] [PubMed] [Google Scholar]
- 8.Picard C, Bobby Gaspar H, Al-Herz W, Bousfiha A, Casanova J-L, Chatila T, et al. International Union of Immunological Societies: 2017 primary Immunodeficiency Diseases Committee report on inborn errors of immunity. J Clin Immunol 2018;38:96–128. [DOI] [PMC free article] [PubMed] [Google Scholar]
- 9.Boyle JM, Buckley RH. Population prevalence of diagnosed primary immunodeficiency diseases in the United States. J Clin Immunol 2007;27(5):497–502. [DOI] [PubMed] [Google Scholar]
- 10.Rubin Z, Pappalardo A, Schwartz A, Antoon JW. Prevalence and outcomes of primary immunodeficiency in hospitalized children in the united states. J Allergy Clin Immunol Pract 2018;6:1705–17010.e1. [DOI] [PubMed] [Google Scholar]
- 11.Aghamohammadi A, Mohammadinejad P, Abolhassani H, Mirminachi B, Movahedi M, Gharagozlou M, et al. Primary immunodeficiency disorders in Iran: update and new insights from the third report of the national registry.. J Clin Immunol 2014;34:478–90. [DOI] [PubMed] [Google Scholar]
- 12.Leiva LE, Zelazco M, Oleastro M, Carneiro-Sampaio M, Condino-Neto A, Costa-Carvalho BT, et al. Primary immunodeficiency diseases in Latin America: the second report of the LAGID registry. J Clin Immunol 2007;27:101–8. [DOI] [PubMed] [Google Scholar]
- 13.Waltenburg R, Kobrynski L, Reyes M, Bowen S, Khoury MJ. Primary immunodeficiency diseases: practice among primary care providers and awareness among the general public, United States, 2008. Genet Med 2010;12:792–800. [DOI] [PubMed] [Google Scholar]
- 14.Marschall K, Hoernes M, Bitzenhofer-Grüber M, Jandus P, Duppenthaler A, Wuillemin WA, et al. The Swiss National Registry for Primary Immunodeficiencies: report on the first 6 years’ activity from 2008 to 2014. Clin Exp Immunol 2015;182:45–50. [DOI] [PMC free article] [PubMed] [Google Scholar]
- 15.Iwata C, Hayakawa H. Registry of cases with primary immunodeficiency syndrome in Japan [in Japanese]. Nihon Rinsho Meneki Gakkai Kaishi 2002;25:289–301. [PubMed] [Google Scholar]
- 16.Lougaris V, Pession A, Baronio M, Soresina A, Rondelli R, Gazzurelli L, et al. The Italian Registry for Primary Immunodeficiencies (Italian Primary Immunodeficiency Network; IPINet): twenty years of experience (1999–2019). J Clin Immunol 2020;40:1026–37. [DOI] [PMC free article] [PubMed] [Google Scholar]
- 17.Baumgart KW, Britton WJ, Kemp A, French M, Roberton D. The spectrum of primary immunodeficiency disorders in Australia. J Allergy Clin Immunol 1997;100:415–23. [DOI] [PubMed] [Google Scholar]
- 18.Pedraza Á, Vargas-Rumilla MI, Ramírez-Roa JL. Registry of primary immunodeficiencies in children at a fourth level hospital. Bogota, 2010–2016 [in Spanish]. Rev Alerg Mex 2018;65:341–8. [DOI] [PubMed] [Google Scholar]
- 19.Abolhassani H, Azizi G, Sharifi L, Yazdani R, Mohsenzadegan M, Delavari S, et al. Global systematic review of primary immunodeficiency registries. Expert Rev Clin Immunol 2020;16:717–32. [DOI] [PubMed] [Google Scholar]
- 20.Joshi AY, Iyer VN, Hagan JB, St Sauver JL, Boyce TG. Incidence and temporal trends of primary immunodeficiency: a population-based cohort study. Mayo Clin Proc 2009;84:16–22. [DOI] [PMC free article] [PubMed] [Google Scholar]
- 21.Szabolcs P, Cavazzana-Calvo M, Fischer A, Veys P. Bone marrow transplantation for primary immunodeficiency diseases. Pediatr Clin North Am 2010;57:207–37. [DOI] [PubMed] [Google Scholar]
- 22.Castagnoli R, Delmonte OM, Calzoni E, Notarangelo LD. Hematopoietic stem cell transplantation in primary immunodeficiency diseases: current status and future perspectives. Front Pediatr 2019;7:295. [DOI] [PMC free article] [PubMed] [Google Scholar]
- 23.Slatter MA, Gennery AR. Hematopoietic cell transplantation in primary immunodeficiency—conventional and emerging indications. Expert Rev Clin Immunol 2018;14:103–14. [DOI] [PubMed] [Google Scholar]
- 24.Laberko A, Gennery AR. Clinical considerations in the hematopoietic stem cell transplant management of primary immunodeficiencies. Expert Rev Clin Immunol 2018;14:297–306. [DOI] [PubMed] [Google Scholar]
- 25.Parikh SH, Satwani P, Ahn KW, Sahr NA, Fretham C, Abraham AA, et al. Survival trends in infants undergoing allogeneic hematopoietic cell transplant. JAMA Pediatr 2019;173:e190081. [DOI] [PMC free article] [PubMed] [Google Scholar]
- 26.Immune Deficiency Foundation. Primary Immunodeficiency Diseases in America: 2007. The Third National Survey of Patients. Immune Deficiency Foundation; 2009. [Google Scholar]
- 27.Sun J, Yang L, Lu Y, Wang H, Peng X, Dong X, et al. Screening for primary immunodeficiency diseases by next-generation sequencing in early life. Clin Transl Immunology 2020;9:e1138. [DOI] [PMC free article] [PubMed] [Google Scholar]
- 28.Heimall J, Cowan MJ. Long term outcomes of severe combined immunodeficiency: therapy implications. Expert Rev Clin Immunol 2017;13:1029–40. [DOI] [PMC free article] [PubMed] [Google Scholar]
- 29.Chong HJ, Maurer S, Heimall J. What to do with an abnormal newborn screen for severe combined immune deficiency. Immunol Allergy Clin North Am 2019;39:535–46. [DOI] [PubMed] [Google Scholar]
- 30.Moore BJ, Freeman WJ, Jiang HJ. Costs of pediatric hospital stays, 2016: statistical brief #250. Healthcare Cost and Utilization Project (HCUP) Statistical Briefs. Rockville, MD: Agency for Healthcare Research and Quality; 2006. [PubMed] [Google Scholar]
- 31.Bui AL, Dieleman JL, Hamavid H, Birger M, Chapin A, Duber HC, et al. Spending on children’s personal health care in the United States, 1996–2013. JAMA Pediatr 2017;171:181–9. [DOI] [PMC free article] [PubMed] [Google Scholar]
- 32.Pai S-Y, Logan BR, Griffith LM, Buckle RH, Parrott RE, Dvorak CC, et al. Transplantation outcomes for severe combined immunodeficiency, 2000–2009. N Engl J Med 2014;371:434–46. [DOI] [PMC free article] [PubMed] [Google Scholar]
- 33.Railey MD, Lokhnygina Y, Buckley RH. Long-term clinical outcome of patients with severe combined immunodeficiency who received related donor bone marrow transplants without pretransplant chemotherapy or post-transplant GVHD prophylaxis. J Pediatr 2009;155:834–840.e1. [DOI] [PMC free article] [PubMed] [Google Scholar]
- 34.Fernández Pérez ER, Hunter M, Katial RK. United States trends in mortality rates for primary immunodeficiency diseases. J Allerg Clin Immunol Pract 2019;7:1045–8. [DOI] [PubMed] [Google Scholar]
Associated Data
This section collects any data citations, data availability statements, or supplementary materials included in this article.