

Abstract
Pancreatic cancer cells with limited access to free amino acids can grow by scavenging extracellular protein. In a murine model of pancreatic cancer, we performed a genome-wide CRISPR screen for genes required for scavenging-dependent growth. The screen identified key mediators of macropinocytosis, peripheral lysosome positioning, endosome-lysosome fusion, lysosomal protein catabolism, and translational control. The top hit was GCN2, a kinase that suppresses translation initiation upon amino acid depletion. Using isotope tracers, we show that GCN2 is not required for protein scavenging. Instead, GCN2 prevents ribosome stalling but without slowing protein synthesis; cells still use all of the limiting amino acids as they emerge from lysosomes. GCN2 also adapts gene expression to the nutrient-poor environment, reorienting protein synthesis away from ribosomes and toward lysosomal hydrolases, such as cathepsin L. GCN2, cathepsin L, and the other genes identified in the screen are potential therapeutic targets in pancreatic cancer.
In brief
Pancreatic tumors are nutrient poor. They grow in part by taking up extracellular proteins by macropinocytosis and degrading them in lysosomes. Nofal et al. report the results of a genome-wide screen for scavenging-dependent growth. Beyond macropinocytosis, this mode of growth depends on proper lysosome trafficking, expression of the key lysosomal hydrolase cathepsin L, and regulation of translation by top screen hit GCN2.
Graphical Abstract
INTRODUCTION
Protein synthesis requires amino acids. Typically, mammalian cells have a steady supply of circulating amino acids, but where vasculature has been disrupted, nutrients can become scarce. This is the case in human pancreatic ductal adenocarcinomas (PDAC), which are fibrotic and poorly perfused and have low levels of glutamine, serine, and some other amino acids (Kamphorst et al., 2015). Nevertheless, pancreatic cancer grows robustly, fueled in part by a non-canonical source of amino acids—extracellular protein (Commisso et al., 2013; Davidson et al., 2017; Kamphorst et al., 2015). PDAC tumors almost universally harbor activating mutations in the small GTPase KRas, and oncogenic K-Ras signaling drives constitutive macropinocytosis, a process whereby cells engulf extracellular material in bulk (Bar-Sagi and Feramisco, 1986). Protein is taken up in macropinosomes, trafficked to lysosomes, and degraded into amino acids (Commisso et al., 2013; Davidson et al., 2017). “Protein scavenging” can support the growth of cultured pancreatic cells in a medium completely lacking free amino acids if the medium is supplemented with a physiological level of serum albumin (Kamphorst et al., 2015).
Pancreatic cancer is a devastating disease. With the current standard-of-care chemotherapy regimen, 5-year survival is less than 10% (Siegel et al., 2019). Better therapies are desperately needed. One approach is to target proteins required for growth fed by protein scavenging. Which proteins are these? They presumably include those required for macropinocytosis.
Many different proteins can stimulate macropinocytosis. Besides K-Ras, a number of small GTPases have been implicated in the process, including the Rac1 and other Rho GTPases; the Arf GTPases Arf1 and Arf6; and the Rab GTPases Rab5 and Rab34 (Egami et al., 2014). Phosphatidylinositol 3-kinase (PI3K) and phospholipase C also play key roles in the process (Egami et al., 2014). These signaling proteins, in various combinations, induce macropinocytosis by mobilizing the actin cytoskeleton. Inhibition of actin polymerization blocks macropinocytosis (Amyere et al., 2000), as does inhibition of PI3K signaling (Palm et al., 2017). Other signaling proteins are also sufficient to activate protein uptake by macropinocytosis, but it is unclear if any of them is necessary. Even cells in which all three isoforms of Ras (K-Ras, H-Ras, and N-Ras) have been deleted exhibit robust extracellular protein uptake when stimulated with platelet-derived growth factor (Palm et al., 2017).
Two recent papers reported additional proteins involved in the activation of macropinocytosis in pancreatic cancer cells. Yao et al. used proteomics and an in vivo screen to identify syndecan 1 as a critical mediator of K-Ras-driven macropinocytosis (Yao et al., 2019). Ramirez et al. performed a high-throughput imaging screen that revealed a key role for the vacuolar ATPase (VATPase) (Ramirez et al., 2019). Both syndecan 1 and the VATPase are recruited to the plasma membrane by K-Ras, and both stimulate macropinocytosis in part through Rac1.
The screens mentioned earlier focused specifically on macropinocytosis, but other processes are also required for protein scavenging. Protein in macropinosomes must be delivered to lysosomes, acidic organelles that house a wide array of degradative enzymes, before it can be degraded (Commisso et al., 2013; Kamphorst et al., 2015). This trafficking likely involves transport along microtubules, vesicle docking, and membrane fusion. Lysosomal hydrolases are also presumably required to degrade the protein that has been successfully delivered to lysosomes.
Certain regulatory proteins may be particularly essential in cells reliant on protein scavenging. For example, the master pro-anabolic kinase mTORC1 impairs cell growth by protein scavenging (Palm et al., 2015), without dramatically affecting the protein scavenging rate (Nofal et al., 2017), at least in part by causing imbalances between nutrient availability and growth signaling.
GCN2 is another kinase that regulates biosynthesis in response to nutrient availability. mTORC1 and GCN2 have opposing roles—mTORC1 activates translation initiation in the presence of amino acids (Ma and Blenis, 2009), and GCN2 suppresses translation initiation when one or more amino acids are lacking. To achieve this, GCN2 physically associates with actively translating ribosomes and is activated by either (1) direct binding of uncharged tRNA to GCN2 (Dong et al., 2000; Wek et al., 1995) or (2) binding to the ribosomal P stalk, which may change conformation upon ribosome stalling (Inglis et al., 2019). Upon activation, GCN2 phosphorylates subunit α of the translation initiation factor eIF2, which prevents recycling of eIF2 from its inactive GDP-bound form to its active GTP-bound form and thereby limits translation initiation (Hinnebusch, 2005).
Besides slowing translation initiation and consequently avoiding ribosome stalling (Darnell et al., 2018), the main downstream effect attributed to GCN2 is translational induction of ATF4 by circumventing inhibitory upstream open reading frames (uORFs) in the Atf4 transcript (Harding et al., 2000). ATF4, a transcription factor, subsequently activates the expression of hundreds of stress response genes, including genes involved in the biosynthesis of non-essential amino acids, such as asparagine (Ye et al., 2010). However, it is unclear if GCN2 induces any gene expression changes that adapt cells to a general lack of amino acids (including essential amino acids). The broader effects of GCN2 on translation are also understudied. How much does GCN2-mediated suppression of translation initiation slow translation overall? And do the gene-specific regulatory effects of GCN2 extend beyond Atf4 and a few other genes with uORFs?
CRISPR-based screening technologies have enabled systematic identification of the genes required for cells to survive and proliferate in various conditions of interest (Shalem et al., 2014; Wang et al., 2014). Here, we apply this technology to pancreatic cancer cells cultured in a leucine-free medium supplemented with a physiological concentration of albumin as “protein food.” These cells can assimilate leucine only through protein scavenging. The screen identified, in addition to macropinocytosis, other cellular activities that are required for effective growth via protein scavenging, including peripheral lysosome positioning, endosome-lysosome fusion, cathepsin-mediated lysosomal protein degradation, and the suppression of translation initiation. The top hit was Gcn2, which we show is not required for protein scavenging per se but rather for the regulation of amino-acid consumption in scavenging-dependent cells. We find that GCN2 slows translation initiation just to the point of minimizing ribosome stalling, without decreasing the overall protein synthesis rate. Finally, we present evidence that GCN2 broadly controls which proteins are synthesized, favoring those useful under amino acid limitation.
RESULTS
Genome-wide screen elucidates scavengingdependent growth
To systematically identify genes essential for growth using extracellular protein in place of amino acids, we performed genome-wide CRISPR-based screens on KRPC-A cells in medium lacking leucine and supplemented with extracellular protein. These cells were generated by culturing KRPC cells, which were derived from genetically engineered murine pancreatic tumors driven by the K-RasG12D mutation (Lito et al., 2014), for several months in a leucine-free medium supplemented with a physiological concentration of serum protein. Leucine is an essential amino acid; therefore, cells cultured in this medium are growth limited by their ability to extract leucine from extracellular protein via macropinocytosis and lysosomal degradation. Having adapted to growth in this condition, KRPC-A cells exhibit high protein scavenging rates and double roughly every 24 h in the leucine-free medium (Nofal et al., 2017).
We infected KRPC-A cells with expression cassettes containing the Cas9 endonuclease and a library of single-guide RNAs (sgRNAs), which targeted 18,855 genes with 184,371 unique sgRNAs (Table S1). We split the infected cells into three populations to be cultured separately. One population was cultured in leucine-free medium supplemented with bovine serum albumin (50 g/L). The other two (control) populations were grown in amino-acid-replete medium with or without albumin. We cultured each population for 12 doublings and then extracted genomic DNA. Guide sequences were amplified and sequenced, and the relative abundances of all individual guide sequences were compared across populations (Figure 1A). We performed this screen twice.
Figure 1. Genome-wide loss-of-function screen illuminates cellular machinery required for scavenging-driven growth.

(A) Screen design. KRPC-A cells were transduced with a genome-scale lentiviral sgRNA library to generate a population of pooled knockouts. Each gene was targeted by at least 10 unique sgRNAs. Infected cells were switched to standard amino-acid-replete medium (DMEM), amino-acid-replete medium supplemented with 50 g/L cell-culture-grade bovine serum albumin, or leucine-free medium supplemented with 50 g/L albumin. After 12 population doublings, knockout frequencies in each condition were determined using high-throughput sequencing.
(B) For each gene, a specific essentiality score was calculated. Genes with negative specific essentiality scores were more essential in the leucine-free medium than in the amino-acid-replete medium. To identify genes with statistically significant specific essentiality scores, we compared the distribution of scores for all genes with the distribution of scores for non-detected genes (as determined by RNA sequencing). 413 genes were specifically essential in the leucine-free medium at FDR < 0.1.
(C–F) The top hits of the screen (the 100 genes with the highest specific essentiality scores) fell into two categories—protein scavenging machinery (C and D) and regulators of protein synthesis (E and F). Selected top hits are highlighted in scatter plots of specific essentiality scores from two independent replicates of the genome-wide screen (C and E) and depicted in schematics (D and F).
(G–I) Gcn2 knockout cells (G), Vasp knockout cells (H), and Vps39 knockout cells (I) were transduced with retroviral vectors expressing either enhanced green fluorescent protein (EGFP) or the corresponding sgRNA-resistant human cDNA. These paired cell lines were cultured in either amino-acid-replete medium for 24 h or leucine-free medium for 48 h, and growth was measured by comparing the total cell volume at initial and final time points. All media were supplemented with 50 g/L albumin (BSA). Error bars represent 95% confidence intervals (n = 3). *p < 0.05, **p < 0.01, ***p < 0.001.
For each gene, we calculated a “specific essentiality” score from the log-ratios of sequencing reads for all sgRNAs targeting that gene as follows:
After averaging the scores from the two replicates for each gene, we used the distribution of specific essentiality scores of genes whose transcripts were not detected in this cell line as an empirical null distribution. We found 413 genes that were specifically essential for growth in the leucine-free medium at a false-discovery rate of 10% (Figure 1B; Table S2).
One of the top 10 hits was Ankfy1, which encodes a protein called Rabankyrin-5. Rabankyrin-5 is a Rab5 effector protein that localizes to macropinosomes and serves as a positive control in this screen, as the overexpression of Rabankyrin-5 has been shown to increase macropinocytosis (Schnatwinkel et al., 2004). The Rab protein family is a family of small GTPases that regulate vesicle trafficking throughout the cytoplasm. Rab5 is thought to localize mainly to early endosomes (not the plasma membrane), and, although Rabankyrin-5 seems to be required for macropinocytosis, the underlying mechanism is unclear. Rab5 (Rab5c) was significantly but weakly essential for scavenging-dependent growth; there are two other Rab5 isoforms (Rab5a and Rab5b) that can likely partially compensate for its loss. Among all Rab proteins, the most specifically essential was Rab35, which has been implicated in cytokinesis, recycling from early endosomes, exosome secretion, and recently in macropinocytosis (Chesneau et al., 2012; Hsu et al., 2010; Kouranti et al., 2006; Salvatore et al., 2018).
Examination of the totality of the top screen hits elucidated the cellular machinery required for growth fueled by protein scavenging in remarkable detail (Figure 1). As expected, several components of the actin cytoskeleton are essential. β-actin (Actb), a subunit of the actin filament capping protein (Capzb), and a protein that promotes actin filament elongation (Vasp) were all top 10 hits. Several members of the ARP2/3 complex, which promotes actin filament branching, are also specifically essential in amino-acid-deprived cells (Figures 1C and 1D).
The top 20 screen hits also included two signaling genes that regulate the actin cytoskeleton: Ankfy1 and Myo9b. Myo9b, which, to the best of our knowledge, has not been implicated in macropinocytosis previously, encodes an unconventional myosin that localizes to membrane ruffles. Myo9b is a bifunctional protein; it is a myosin with a RhoGAP domain that promotes Rac signaling (Hanley et al., 2010; Kong et al., 2015).
K-Ras and Rac (Rac1) themselves were not screen hits because they were also required in the amino-acid-rich medium. Similarly, several vacuolar ATPase components, such as Atp6v1 and Atp6v1e1, were essential for scavenging-dependent growth but not hits because the V-ATPase is essential even in the aminoacid-rich medium. On the other hand, syndecan 1 (Sdc1) was not essential for growth on extracellular protein per our screen, indicating the sufficiency of alternative macropinocytosis-activation mechanisms in KRPC-A cells.
The list of hits also highlights two complexes involved in vesicle trafficking—six HOPS complex genes and six BORC complex genes were significantly more essential in cells fueled by protein scavenging (Figures 1C and 1D). The HOPS complex mediates fusion of endosomes and lysosomes (Sato et al., 2000; Seals et al., 2000), and the BORC complex is required for the peripheral positioning of lysosomes (Pu et al., 2015). The significance of lysosome positioning remains unknown; perhaps lysosomes at the periphery of the cell facilitate the degradation of macromolecules taken up from the extracellular space.
Of the 413 specifically essential genes, two encode lysosomal proteases—the cysteine proteases cathepsin L and cathepsin B. Mice with either Ctsl or Ctsb knocked out are viable, but the double-knockout mice die 4 weeks after birth because of neuronal loss and brain atrophy (Felbor et al., 2002). This indicates that the two proteases have partially redundant functions, but other lysosomal proteases cannot compensate for their loss. Ctsl scored substantially higher than Ctsb, suggesting that it is particularly important in cells fueled by extracellular protein scavenging.
Once cells have taken up extracellular proteins, trafficked them to lysosomes, and degraded them, the resulting amino acids can be used for protein synthesis. Our screens identify several genes involved in the regulation of protein synthesis. In one replicate of the screen, the gene with the highest specific essentiality score was Gcn2. In the other replicate, it was Gcn1 (Figures 1E and 1F). In yeast, Gcn1p binds to both Gcn2p and ribosomes and is required for the activation of Gcn2p (Garcia-barrio et al., 2000; Marton et al. 1993). By comparison, the canonical downstream effector of GCN2 signaling Atf4 was only weakly essential in amino-acid-deprived cells.
Two negative regulators of mTORC1 were also specifically essential for growth without leucine—the TSC complex (Tsc1 and Tsc2) and the GATOR1 complex (Nprl2, Nprl3, and Depdc5) (Figures 1E and 1F). The TSC complex blocks mTORC1 activation in the absence of growth factors, and the GATOR1 complex blocks mTORC1 activation in the absence of amino acids (Condon and Sabatini, 2019). It is now well-established that mTORC1 signaling persists in amino-acid-starved cells scavenging extracellular proteins and that hyperactive growth signaling causes cell death in this setting (Nofal et al., 2017; Palm et al., 2015). The fact that the TSC and GATOR1 complex genes were hits indicates that they do meaningfully suppress mTORC1 signaling in protein-scavenging cells, just not enough to suppress growth signaling to optimally low levels.
Finally, there were some genes that were notably not essential for growth fueled by protein scavenging. Several genes involved in macroautophagy (Atg5, Atg7, Atg10, and Atg12) were not specifically essential in amino-acid-deficient conditions. In fact, cells with any one of these genes knocked out proliferated faster than the population average in the leucine-free medium, suggesting that macroautophagy is somehow deleterious in scavengingdependent cells.
Overall, unlike macroautophagy, which relies on a large set of dedicated proteins, it seems that protein scavenging is largely achieved by cellular proteins that are also involved in other cellular processes. Our screen did not identify any single “scavenging protein” that can serve as a genetic handle to study this process in murine tumor models. Nevertheless, the screen hits represent potential therapeutic targets worthy of additional study.
Validation of top screen hits
To validate the hits of the screen as genes essential for growth by protein scavenging, we chose three genes with high specific essentiality scores, each of which represents a cellular process required for scavenging-dependent growth—Gcn2, the top hit, is involved in the regulation of protein synthesis, Vasp in macropinocytosis, and Vps39 in endosome-lysosome fusion. We infected KRPC-A cells with CRISPR-Cas9 vectors targeting each of these genes with sgRNA sequences validated by the screen. For each of the resulting knockout populations, we picked single colonies with complete protein loss. We then ectopically expressed either the human version of the knocked out gene (which is not affected by the sgRNA targeting the mouse gene) or enhanced green fluorescent protein (EGFP) (as a control) to generate pairs of wild-type (WT) and knockout (KO) cell lines from the same clonal background (Figure S1). We assayed the growth of these cell lines in amino-acid-replete and leucinefree media supplemented with albumin. As expected, the three KO cell lines showed no discernible growth difference relative to the corresponding WT cell lines in the amino-acid-replete medium, but all three had clear growth defects in the leucine-free medium (Figures 1G–1I).
Notably, all knockout lines tested still exhibited some growth in the leucine-free medium, roughly doubling in 48 h. It remains unclear how cells achieve actin filament elongation without Vasp, or vesicle trafficking to lysosomes without Vps39, but these results indicate that protein scavenging is a robust process.
GCN2 prevents ribosome stalling
Because GCN2 was the top hit, we decided to focus on understanding its role in supporting growth on the extracellular protein. We noticed that Gcn2 KO cells do not have an apparent growth defect for the first 24 h of amino acid deprivation but begin to die thereafter (Figure 2A). To test for GCN2 activity in the early stages of amino acid removal, we switched Gcn2 WT and Gcn2 KO cells to a leucine-free medium supplemented with albumin and extracted the cellular protein after 2 h. As expected, we detected an increase in eIF2α phosphorylation and ATF4 levels selectively in wild-type cells (Figure 2B).
Figure 2. GCN2 prevents ribosome stalling in cells growing on extracellular protein.

(A) Gcn2 WT and Gcn2 KO cells were switched to either amino-acid-replete medium or leucine-free medium, each supplemented with 50 g/L bovine serum albumin (BSA). Total cell volumes were measured using packed cell volume tubes. Error bars show 95% confidence intervals. *p < 0.05, **p < 0.01, ***p < 0.001.
(B) Gcn2 WT and Gcn2 KO cells were switched to either the amino-acid-replete medium2 or the leucine-free medium, each supplemented with 50 g/L BSA. After 2 h, cellular protein was extracted, and GCN2 abundance and signaling was analyzed by western blotting. Results are representative of 3 independent experiments.
(C) Polysome profiles of Gcn2 WT and Gcn2 KO cells switched to either amino-acid-replete medium or leucine-free medium, each supplemented with 50 g/L BSA, for 1 h. Cell lysates were loaded onto 10%–50% sucrose gradients and spun at 35,000 g for 2.5 h at 4°C before measurement. Profiles were normalized such that the area under each curve was equal.
(D) Ribosome profiling was performed in each of the cell lines and conditions in (C), and codon occupancies were calculated such that for each sample, thepercent occupancies for all 64 codons sum to 100%. Differences in occupancy between leucine-deprived cells and cells cultured in the amino-acid-rich medium are plotted. CUC and CUU are two of the six leucine codons.
Phosphorylation of eIF2α inhibits translation initiation (Hinnebusch, 2005), thereby reducing the pool of actively translating ribosomes. This can be visualized by polysome profiling—separation on a sucrose gradient of ribosomes that have been locked in place on mRNAs by cycloheximide. In polysome profiles, the monosome peak reflects free ribosomes and mRNAs bound by single ribosomes, whereas the polysome peaks reflect mRNAs bound by multiple ribosomes. In the amino-acid-replete medium, the polysome profiles of Gcn2 WT and Gcn2 KO cells were the same. Upon leucine deprivation, Gcn2 WT cells rapidly shifted toward monosomes, as expected. In contrast, Gcn2 KO cells shifted toward polysomes. These differences were strongest over the first few hours of leucine deprivation. After 24 h, the polysome profiles of Gcn2 WT and Gcn2 KO cells converged (Figure S2), likely reflecting compensation over this longer timescale by a different eIF2α kinase (HRI, PKR, or PERK) (Zhang et al., 2002).
A likely cause of the polysome accumulation in the leucine-deprived Gcn2 KO cells is ribosome stalling, a known consequence of GCN2 deficiency (Darnell et al., 2018). We assessed ribosome stalling directly via ribosome profiling. 1 h of leucine deprivation caused ribosomes to stall at two of the six leucine codons—CUC and CUU. Gcn2 KO cells exhibited substantially more stalling than Gcn2 WT cells (Figure 2D). Thus, although both WT and Gcn2 KO cells initially continue to grow through leucine deprivation, GCN2 is required early on to avoid ribosome stalling and subsequent cell death.
GCN2 is not required for protein scavenging
We were curious to know if GCN2 enhances protein scavenging. To explore this, we used a method that employs stable isotope tracers to measure protein scavenging rate. Conceptually, the simplest tracer strategy would be to feed isotope-labeled extracellular protein (e.g., serum albumin) and monitor the appearance of labeled amino acids. However, since labeled proteins are not readily available, we instead employed isotope-labeled amino acids and unlabeled serum albumin (Figure 3A) (Nofal et al., 2017). Here, we define the protein scavenging rate in terms of the rate of amino acid released from lysosomes. Extracellular protein that has been taken up by macropinocytosis but has not been degraded does not contribute to this rate.
Figure 3. GCN2 is not required for protein scavenging.

(A) Stable isotope tracer strategy to measure protein scavenging rate. Cells are grown for 5 population doublings with labeled essential amino acids to label cellular proteins. Unlabeled serum albumin is then added to the medium, and uptake and degradation of this extracellular protein yields unlabeled amino acid monomers. Because cytosolic amino acids are in rapid exchange with a much bigger pool of extracellular amino acids, most of these unlabeled amino acids end up in the medium, where they can be readily sampled and measured. Thus, the rate of secretion of unlabeled amino acids serves as a proxy for protein scavenging rate.
(B) Unlabeled valine secretion over 24 h in Gcn2, Vasp, and Vps39 knockout cells expressing either EGFP or the corresponding sgRNA-resistant human cDNA. For each cell line, rates were normalized to the amino-acid-replete condition with re-expression. All media were supplemented with 50 g/L bovine serum albumin (BSA). See Figure S3 for phenylalanine and lysine secretion. Error bars represent 95% confidence intervals (n = 3). *p < 0.05, **p < 0.01, ***p < 0.001.
The first step in this method is the thorough labeling of cellular proteins, which is achieved over five doublings in a medium containing 13C- and 15N-labeled amino acids. Cells are then switched to a labeled amino acid medium that is supplemented with unlabeled albumin. At this point, amino acids in cellular protein, as well as free amino acids inside and outside the cell, are labeled; only amino acids in the extracellular protein are unlabeled. Protein scavenging releases these unlabeled amino acids into the cytosol, and because cytosolic amino acids are in rapid exchange with a much bigger pool of extracellular amino acids, most of these unlabeled amino acids end up in the medium. Accordingly, the rate of appearance of unlabeled extracellular amino acids in the medium is a reliable proxy for the protein scavenging rate. (This isotope tracer strategy works best for amino acids that are used exclusively for protein synthesis, such as histidine, lysine, phenylalanine, threonine, and valine) (Nofal et al., 2017).
We applied this method to measure protein scavenging over 24 h in Gcn2, Vasp, and Vps39 WT and KO cell lines. As expected, Vasp KO cells and Vps39 KO cells degrade extracellular protein at a significantly slower rate than the corresponding WT cells. In contrast, Gcn2 KO cells scavenge protein at the same rate, both in amino-acid-replete medium and in leucine-free medium (Figures 3B and S3).
GCN2 does not slow the overall rate of protein synthesis
Given its lack of impact on protein scavenging rate, we suspected that GCN2 sustains scavenging-dependent growth by regulating protein synthesis. Our default hypothesis was that GCN2 promotes growth on the extracellular protein by slowing protein synthesis and thereby preserving limited amino acid pools. To explore this hypothesis, we innovated an isotope tracer strategy to measure both the protein scavenging rate and the protein synthesis rate in the same batch of cells. Each of these two rate measurements individually requires only one set of isotope tracers. However, making both measurements simultaneously requires labeled amino acids in two isotopic flavors (in addition to the unlabeled isotope). For example, for valine, we use uniformly 13C- and 15N-labeled valine (m+6) as Flavor 1 and valine labeled with 8 deuterium atoms (m+8) as Flavor 2. The abundance of each of these two labeled flavors of valine as well as unlabeled valine can be readily individually quantified by LC-MS. The ability to distinctly measure three forms of each amino acid enables two isotope tracer strategies—one for protein synthesis, one for protein scavenging—to be implemented simultaneously.
Cellular protein is first labeled (over five doublings) with isotope flavor 1 (L1)-labeled amino acids. We then switch the cells to a medium containing isotope flavor 2 (L2)-labeled amino acids for 2 h. During these 2 h, free L1-labeled amino acids inside cells are replaced with free L2-labeled amino acids. Finally, we switch cells to a medium containing free L2-labeled amino acids and unlabeled albumin. At this point, amino acids within intracellular protein are L1-labeled, free amino acids (both inside and outside cells) are L2-labeled, and the extracellular albumin is unlabeled. Cells are then cultured for 24 h, after which amino acids are extracted from the medium and from cellular protein (by acid hydrolysis) and analyzed by LC-MS. Using the resulting LC-MS data, the protein synthesis rate can be calculated based on the residual L1 labeling in cellular protein, and the protein scavenging rate can be calculated based on the accumulation of unlabeled amino acids summed across the cellular protein and the extracellular medium (Figure 4A and 4B; STAR Methods).
Figure 4. In cells reliant on protein scavenging, protein synthesis rate is limited by scavenging, not GCN2 signaling.

(A) Stable isotope tracer strategy to simultaneously measure the protein synthesis rate and protein scavenging rate. Cells are grown for 5 population doublings inmedium with 13C- and 15N-labeled essential amino acids (isotope flavor 1). After five population doublings, free amino acids and cellular proteins are almost completely labeled. Cells are then switched to medium containing a second, distinct set of amino acid tracers (isotope flavor 2). This medium is also supplemented with unlabeled serum albumin. As cells grow, new protein is marked by a combination of Flavor 2 and unlabeled amino acids (from protein scavenging), whereas old protein is marked by Flavor 1, enabling calculation of protein synthesis rate. Protein scavenging rate can be calculated by summing the unlabeled amino acids incorporated into cellular proteins and secreted into the medium.
(B) Example unprocessed valine data from Gcn2 WT and Gcn2 KO cells cultured in the leucine-free medium supplemented with 50 g/L bovine serum albumin (BSA). Ion counts are converted to nmol by comparing with known standards. Complete unprocessed valine data underlying the rates in (C–E) are shown in the Figure S4.
(C and D) (C) Protein synthesis rates and (D) protein scavenging rates of Gcn2 WT and Gcn2 KO cells cultured in amino-acid-replete and leucine-free media supplemented with the indicated amounts of serum albumin.
(E) Direct comparison of protein synthesis rates and scavenging rates of Gcn2 WT and KO cells cultured in leucine-free media. Error bars represent 95% confidence intervals (n = 3). Error was calculated by averaging three independent rate estimates derived from three different amino acids (lysine, phenylalanine, and valine).
We applied this method to Gcn2 WT and Gcn2 KO cells cultured in a leucine-free medium supplemented with various concentrations of serum albumin. This experiment revealed that GCN2 has no impact on either the protein synthesis rate or the protein scavenging rate in these cells (Figures 4C, 4D, and S4). Direct comparison of the independently measured protein synthesis rates and protein scavenging rates revealed a linear relationship with a slope of ~1 (Figure 4E). These observations were independently verified using an 35S-methionine incorporation assay to measure the overall translation (Figure S4). Our data support the conclusion that GCN2 does not slow protein synthesis in amino-acid-deprived cancer cells. Rather, these cells, with or without GCN2, synthesize proteins at the maximum possible rate (every leucine generated by protein scavenging is used for protein synthesis). Thus, GCN2 decreases the pool of actively translating ribosomes, curbing stalling (Figure 2), without reducing protein synthesis.
To support this finding further, we calculated the expected life-time in the cytosol of the limiting amino acid (leucine) released by protein scavenging. In KRPC-A cells cultured in a leucine-free medium supplemented with 50 g/L albumin, intracellular leucine was present at only ~10 pmol per μL cell volume (10 μM); this is ~100× less than the leucine concentration in these cells cultured in standard DMEM (Kamphorst et al., 2015). Meanwhile, protein scavenging provides 40 nmol leu per μL cell volume per hour in KRPC-A cells, producing the observed 10 pmol leucine per mL cell volume roughly every second. Thus, free leucine generated by KRPC protein scavenging is used almost immediately.
GCN2 adapts the proteome to growth on extracellular protein
Given that GCN2 does not impact the rate of protein synthesis globally, we combined stable isotope tracers with proteomics to explore its effects on the synthesis of specific proteins. First, the cellular protein was labeled by growing cells for five doublings in medium containing uniformly 13C-labeled lysine and arginine. Then, cells were switched to an unlabeled medium supplemented with 50 g/L albumin, either with or without leucine, and after the indicated amount of time, cellular protein was extracted and analyzed by quantitative mass spectrometry, which differentiates between “old” labeled protein and “new” unlabeled protein (Figure 5A; STAR Methods). This strategy is well-suited to highlight differences in protein synthesis across conditions because old proteins, which were synthesized before cells were switched to the condition of interest, would otherwise overwhelm the signal from new proteins. This is because aminoacid-deprived cells grow slowly—cells that have grown in the leucine-free medium for 24 h still had more old protein than newly synthesized protein (Figure 5B). The measurement of new proteins at a separate m/z captures the effects of GCN2 on protein synthesis without the background of old proteins. These combined isotope tracer-proteomics data also support the conclusion that GCN2 does not slow protein synthesis in aminoacid-deprived KRPC-A cells (Figures 5B and S5).
Figure 5. GCN2 suppresses the synthesis of anabolic proteins in favor of catabolic proteins.

(A) Stable isotope tracer strategy to measure the synthesis of individual proteins by proteomics. Cells are grown for 5 population doublings in medium with 13Clabeled lysine and arginine. After five population doublings, free amino acids and cellular proteins are almost completely labeled. Cells are then switched to medium containing unlabeled amino acids and supplemented with unlabeled serum albumin. As cells grow, new protein is marked by unlabeled lysine and arginine, whereas old protein is marked by labeled lysine and arginine, enabling independent measurement of each by quantitative proteomics. After 24 h, protein is extracted, digested, TMT-labeled, and analyzed by mass spectrometry (STAR Methods).
(B) Unlabeled (newly synthesized) fractions of all measured proteins in Gcn2 WT and Gcn2 KO cells grown in amino-acid-replete or leucine-free medium supplemented with 50 g/L serum albumin for the indicated times.
(C) Histograms show differences in unlabeled protein present after 24 h in leucine-free medium supplemented with 50 g/L bovine serum albumin (BSA) in Gcn2 WT versus Gcn2 KO cells (top) or untreated KRPC-A cells versus KRPC-A cells treated with 5 μM GCN2iB (bottom). The top row (Gcn2 WT versus Gcn2 KO) is an average of three independent biological replicates; the bottom is a single biological replicate.
(D) Rank plot showing the differences in unlabeled protein present after 24 h in the leucine-free medium supplemented with 50 g/L BSA in Gcn2 WT versus Gcn2 KO cells for each top screen hit measured (74 of the top 100). The leucine transporter SLC7A5; the mannose-6-phosphate receptor IGF2R, which transports lysosomal hydrolases to the lysosome; and the lysosomal hydrolase cathepsin L are three of the top seven most upregulated proteins by GCN2.
(E) Cathepsin L abundances, measured by quantitative proteomics, in Gcn2 WT and Gcn2 KO cells cultured in amino-acid-replete or leucine-free medium supplemented with 50 g/L BSA for 24 h. Measurements from three biological replicates are shown for the leucine-free condition, and a pair-wise t test was performed to show significance.
(F) Western blot showing cathepsin L levels after switching from the amino-acid-replete medium to the leucine-free medium supplemented with 50 g/L BSA. The36 kDa band represents inactive pro-cathepsin L and the 30 kDa band represents mature cathepsin L.
GCN2 is known to induce ATF4, which activates the expression of a number of well-documented targets (Han et al., 2013). Using our method, we found that under leucine-deprived conditions, the induction of these ATF4 targets was impaired in Gcn2 KO cells, as expected. With this methodological validation in hand, we looked for an impact on other major classes of proteins. Unexpectedly, we observed that Gcn2 KO cells displayed increased the synthesis of ribosomal proteins and suppressed the synthesis of lysosomal hydrolases (Figure 5C). The small-molecule inhibitor GCN2iB replicated the effects of Gcn2 knockout, ruling out clonal differences as the cause and verifying that the effects depend acutely on GCN2 catalytic activity (Figure 5C). These proteins have not, to the best of our knowledge, been identified as GCN2 targets previously, and the mechanism by which GCN2 regulates their expression remains to be determined. The lysosomal hydrolases appear not to be ATF4 targets, as none of them were detected by ChIP-seq using ATF4 as the bait (Han et al., 2013). Importantly, this pattern of protein expression changes aligns with a potential physiological function of GCN2—by diverting limited amino acids away from anabolic machinery and toward catabolic proteins, GCN2 adapts the proteome to the amino-acid-deficient environment.
This conclusion was further supported by analysis of the impact of GCN2 on the expression of proteins that were hits in the CRISPR screen. Among the top 100 screen hits (74 of which were found in our proteomics data), the leucine transporter SLC7A5, which is a known ATF4 target (Han et al., 2013), was most elevated in Gcn2 WT cells relative to Gcn2 KO cells. Other hits that were higher in Gcn2 WT cells were the critical lysosomal hydrolase cathepsin L and the mannose-6-phosphate receptor IGF2R, which is responsible for transporting cathepsin L and other hydrolases to the lysosome (Figure 5D). Under leucinefree conditions, cathepsin L levels were 30%–40% higher in Gcn2 WT cells than Gcn2 KO cells in each of three separate experiments (Figure 5E), and western blots for cathepsin L showed that cathepsin L levels increased selectively in Gcn2 WT cells after leucine depletion. This was true for both pro-cathepsin L, which has not yet been cleaved and activated at acidic pH, and mature cathepsin L (Figure 5F). In summary, at least in the KRPC-A cell background, in addition to suppressing the synthesis of ribosomes, GCN2 promotes the synthesis of lysosomal hydrolases and the protein required to transport these hydrolases to the lysosome.
To understand if GCN2 modulates the synthesis of specific proteins by directly modulating the translation of specific transcripts, we re-examined the ribosome profiling data that we originally collected to examine stalling (Figure 2). After switching cells to a leucine-deprived medium for 1 h, we compared transcript levels and ribosome footprint levels for ~9,000 transcripts. As expected, we found that, upon leucine deprivation, GCN2 upregulates the translation efficiency of its canonical downstream effector Atf4 (Figure S6A) as well as a handful of other genes also known to be induced by eIF2 phosphorylation, including Ppp1r15a and Ifrd1. ATF4 was a weak hit in the CRISPR screen for genes essential for growth via protein scavenging, and the other genes were not hits. It is worth noting that we attempted to generate Atf4 KO cell lines and screened over 100 potential knockout clones, none of which turned out to be clean knockouts, suggesting that, at least in the KRPC-A background, ATF4 is required for the survival and expansion of single cells.
Beyond known GCN2 targets, our data revealed that GCN2 also affects the translation of transcripts encoding ribosomal proteins. The number of ribosomes bound to these transcripts decreases upon leucine deprivation in Gcn2 WT cells but not in Gcn2 KO cells (Figures S6A and S6B). This result could not be explained by stalling preferentially occurring on ribosome-encoding mRNAs, suggesting a GCN2-mediated decrease in translational efficiency of these transcripts (Figures S6C and S6D). The mechanism underlying this GCN2-dependent reduction remains unclear, but the effect is to favor the translation of other proteins that have more value to amino-acid-limited cells. Collectively, these data suggest that GCN2 adapts the proteome to amino-acid-poor conditions, facilitating scavenging-dependent growth.
Small-molecule targeting of GCN2 and cathepsin L
We further explored the functional significance of GCN2 and cathepsin L using small-molecule inhibitors. Experiments were conducted in either amino-acid-replete or leucine-free medium, each supplemented with albumin, and were repeated in K-RasG12D MEFs, which behaved similar to KRPC-A cells. GCN2 inhibition blocked cell growth specifically in the leucine-free medium, with little toxicity in the amino-acid-rich medium. This did not reflect a general increase in susceptibility of leucine-deprived cells to kinase inhibition. For example, a PI3K inhibitor blocked the growth of cells in leucine-free medium and amino-acid-replete medium to similar extents. Similar to GCN2 inhibition, cathepsin L inhibition slowed the growth of leucine-deprived cells without any substantial effect on cells in the amino-acidrich medium, whereas hydroxychloroquine, the classical antimalarial agent that inhibits lysosomal activity and was recently tested in clinical trials for pancreas cancer, was similarly toxic in the amino-acid-replete medium and the leucine-free medium (Figures 6 and S7). Thus, the pharmacological inhibition of GCN2 and cathepsin L selectively hits cells dependent on protein scavenging, supporting further exploration of these targets in PDAC.
Figure 6. Small-molecule targeting of GCN2 and cathepsin L.

KRPC-A cells were cultured in amino-acid-replete and leucine-free media in varying concentrations of GCN2iB (GCN2 inhibitor); GDC0941 (PI3-kinase class 1A inhibitor); cathepsin L inhibitor; and hydroxychloroquine. All media were supplemented with 50 g/L bovine serum albumin (BSA). Error bars represent 95% confidence intervals (n = 3).
DISCUSSION
Pancreatic cancer cells driven by K-Ras signaling can grow in amino-acid-poor conditions by scavenging extracellular protein. A number of studies suggest that this process supports pancreatic tumor growth (Commisso et al., 2013; Davidson et al., 2017; Kamphorst et al., 2015; Palm et al., 2015), but our understanding of its importance in vivo remains limited by the fact that we do not know of any gene that is specifically required in cells dependent on protein scavenging—in other words, we do not know how to make “scavenging knockout” tumors. Such scavenging-specific genes would also be potential therapeutic targets.
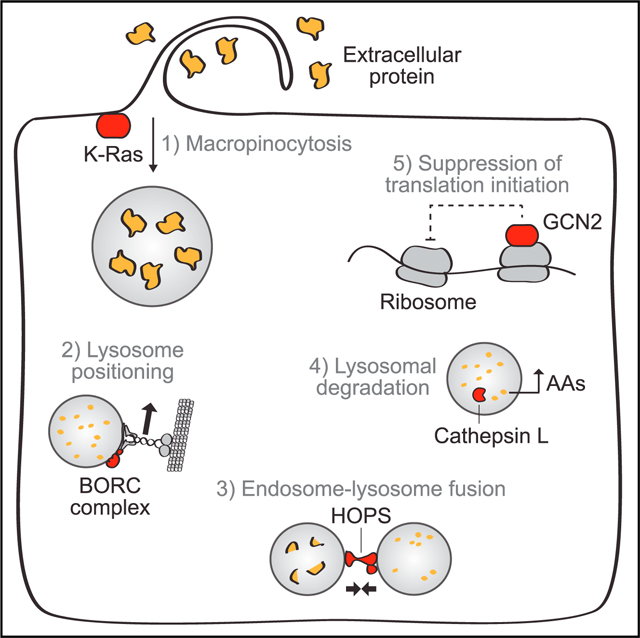
Recently, two groups published screens motivated to find such genes. One study used proteomics to identify proteins upregulated to the cell surface by K-Ras, then screened them for essentiality in murine pancreatic tumors. The other scored a genome-wide siRNA library based on uptake of a fluorescent macropinocytosis substrate. Both of these screens were designed to identify genes involved in macropinocytosis itself. Our proliferation-based screen identified genes required for the full process of scavenging-dependent growth. One important finding is that such genes are distributed across multiple additional biological processes, including peripheral lysosome positioning, endosome-lysosome fusion, lysosomal protein catabolism, and the suppression of translation initiation (Figure 7).
Figure 7. Cellular proteins critical for growth fueled by protein scavenging.

Growth dependent on protein scavenging as an amino acid supply route relies on a few major cellular activities, which are illustrated with select hits of our screen depicted in red and proteins previously identified as critical depicted in blue. Extracellular protein is taken up by macropinocytosis, which is stimulated by oncogenic K-Ras signaling (Commisso et al., 2013). Two recent papers identified syndecan 1 and plasma membrane-localized V-ATPase as key mediators of this process. Both stimulate Rac1, which then mobilizes the actin cytoskeleton to achieve protein uptake (Ramirez et al., 2019; Yao et al., 2019). Our screen identified Vasp as a key cytoskeletal protein and Rabankyrin-5 as another key protein involved in macropinocytosis. Protein taken in by macropinocytosis must then be catabolized in lysosomes. Our screen identified multiple members of the BORC complex, which mediates peripheral positioning of lysosomes, and of the HOPS complex, which is required for efficient endosome-lysosome fusion. Other hits included the lysosomal hydrolases, cathepsin B and L, which convert lysosomal protein into free amino acids. Finally, amino acids generated by lysosomal catabolism must be used productively. To enable efficient elongation, aminoacid-limited cells must suppress translation inhibition, either by tuning mTORC1 activity (Palm et al., 2015) or by activating GCN2, which minimizes ribosome stalling without suppressing the overall protein synthesis. GCN2 also promotes the synthesis of catabolic proteins critical for growth in amino-acid-poor conditions. Together, these five cellular activities enable sustained growth using extracellular protein as an amino acid source.
In fact, our screen suggests that some of the most critical cellular proteins for growth on extracellular protein—including GCN2—are dispensable for protein scavenging. GCN2 supports scavenging-dependent growth in at least two other ways. First, it suppresses translation initiation to prevent ribosome stalling. Darnell et al. suggest that differential stalling may be a form of translational control (Darnell et al., 2018). Our view is that stalling is a deleterious consequence of overloading ribosomes on transcripts when the amino acid supply is limited. Interestingly, although GCN2 is widely assumed to prevent stalling by slowing protein synthesis, in amino-acid-limited cancer cells, it does not actually do so. We found that with or without GCN2, amino-aciddeprived cancer cells synthesize protein at the maximum possible rate—the protein scavenging rate. In other words, these cells consume all of the limiting amino acid as it becomes available. Rather, GCN2 changes the limiting step of translation from elongation to initiation, preventing excessive ribosomes from initiating translation but leaving enough active ones to achieve maximal protein synthesis.
Second, GCN2 modulates relative protein synthesis rates more broadly than previously appreciated, favoring the synthesis of catabolic proteins (like lysosomal hydrolases) over anabolic ones (like ribosomal subunits). In doing so, GCN2 increases the long-term supply of amino acids while decreasing the long-term demand for them, thereby preventing ribosome stalling by a second, distinct mechanism. The molecular mechanisms underlying the GCN2-mediated negative regulation of ribosomal subunit synthesis and positive regulation of lysosomal hydrolase synthesis remain to be explored. It is tempting to speculate that they might involve the suppression of mTORC1, which is also known to regulate ribosomal protein synthesis and lysosome biogenesis.
Among the lysosomal hydrolases whose synthesis is increased by GCN2 is cathepsin L. The gradual depletion of cathepsin L, the most essential lysosomal hydrolase for scavenging-dependent growth, could result in the inability to degrade extracellular protein. Notably, cathepsin L turns over rapidly in these cells—less than 25% of the initial protein is present after 24 h, implying a half-life of less than 6 h (Figure 5E). Although cathepsin L levels averaged over millions of cells are only modestly lower in Gcn2 KO cells, these levels are likely heterogeneous. It is possible that the depletion of cathepsin L occurs in only a subset of these cells at any given time, and these are the cells that die. The gradual depletion of cathepsin L in a minority of cells could result in substantial cell death over time, without drastically affecting per-cell protein scavenging rates averaged over the whole population. Further investigation is needed to explore this possibility.
Our results are particularly important in light of the recent clinical studies of hydroxychloroquine (HCQ) in pancreas cancer. HCQ neutralizes the lumen of acidic organelles, such as lysosomes. A randomized phase II trial of HCQ in combination with gemcitabine and Nab-paclitaxel showed that HCQ improved response rates but not disease free or overall survival (Karasic et al., 2019). More recently, the combination of HCQ and the MEK inhibitor trametinib has shown promise (Bryant et al., 2019; Kinsey et al., 2019). This combination induced a deep regression in one patient with advanced PDAC (Kinsey et al., 2019) and is now being evaluated in a clinical trial (NCT03825289). We found that hydroxychloroquine is toxic even in cells cultured under amino-acid-replete conditions (Figures 6 and S7), which is consistent with the general importance of properly functioning lysosomes. In contrast, we can specifically impair scavenging-dependent growth by targeting the screen hits GCN2 and cathepsin L, the lysosomal protease.
Several other screen hits also warrant attention. Rabankyrin-5, which was previously shown to boost macropinocytosis (Schnatwinkel et al., 2004), is a potential genetic handle for protein scavenging. The BORC complex, which mediates the peripheral positioning of lysosomes (Pu et al., 2015), is another interesting subject for future exploration—why is lysosome positioning important for protein scavenging? Can this be therapeutically targeted? Finally, DHX29, an RNA helicase required for translation of mRNAs with stable secondary structures (Pisareva et al., 2008), was selectively essential under amino-acid-deficient conditions. This suggests an important and understudied role for mRNA structure in the regulation of stress-responsive transcripts. Collectively, our screen hits highlight the diversity of vulnerabilities of amino-acid-deprived cancer cells, which extend from macropinocytosis into unrelated, and perhaps unexpected, areas of cell biology. All deserve due diligence in the effort toward a PDAC cure.
STAR★METHODS
RESOURCE AVAILABILITY
Lead contact
Further information and requests for resources and reagents should be directed to and will be fulfilled by Josh Rabinowitz (joshr@princeton.edu).
Materials availability
Cell lines and plasmids generated in this study will be made available by the lead contact upon request.
Data and code availability
Source data statement: Raw RNAseq and ribosome profiling data have been deposited in the Sequence Read Archive (SRA) and are publicly available as of the date of publication. key resources table Proteomics data has been deposited in the PRIDE Archive database and is publicly available as of the date of publication. Accession numbers are listed in the key resources table. All other data reported in this paper will be shared by the lead contact upon request.
Code statement: This paper does not report original code.
Any additional information required to reanalyze the data reported in this paper is available from the lead contact upon request.
KEY RESOURCES TABLE
| REAGENT or RESOURCE | SOURCE | IDENTIFIER |
|---|---|---|
|
| ||
| Antibodies | ||
|
| ||
| Rabbit monoclonal anti GCN2 | Cell Signaling Technology (CST) | Cat# 3302; RRID: AB_2277617 |
| Rabbit monoclonal anti Vasp | CST | Cat# 3132; RRID: AB_2213393 |
| Mouse monoclonal anti eIF2α | CST | Cat# 2103; RRID: AB_836874 |
| Rabbit monoclonal anti Phospho-eIF2α | CST | Cat# 3398; RRID: AB_2096481 |
| Rabbit monoclonal anti ATF-4 | CST | Cat# 11815; RRID: AB_2616025 |
| Goat polyclonal anti Mouse/Rat Cathepsin L | R&D Systems | Cat# AF1515; RRID: AB_2087690 |
| Rabbit monoclonal anti β-Actin (HRP Conjugate) | CST | Cat# 5125; RRID: AB_1903890 |
| Rabbit monoclonal anti Vinculin (HRP Conjugate) | CST | Cat# 18799; RRID: AB_2714181 |
| Goat monoclonal anti-rabbit IgG, HRP-linked | CST | Cat# 7074; RRID: AB_2099233 |
| Horse monoclonal anti-mouse IgG, HRP-linked | CST | Cat# 7076; RRID: AB_330924 |
|
| ||
| Chemicals, peptides, and recombinant proteins | ||
|
| ||
| DMEM high glucose, no pyruvate | GIBCO | 10–017 CV |
| Fetal bovine serum (FBS) | Sigma-Aldrich | Cat# F2442 |
| Dialyzed FBS | Sigma-Aldrich | Cat# F0392 |
| Phosphate buffered saline | Thermo Fisher Scientific (TFS) | Cat# SH3025601 |
| Trypsin-EDTA (0.05%) | TFS | Cat# 25300–054 |
| DMEM powder w/ low glucose, w/o Amino acids, pyruvate | US Biological | Cat# D9800–13 |
| Bovine Serum Albumin, lyophilized, BioReagent | Sigma-Aldrich | Cat# A9418 or A1470 |
| NotI-HF | New England Biolabs (NEB) | Cat# R3189 |
| XhoI | NEB | Cat# R0146 |
| T4 DNA Ligase | NEB | Cat# M0202 |
| NEB HiFi DNA Assembly Master Mix | NEB | Cat# E2621 |
| NEB 10-beta Competent E. coli (High Efficiency) | NEB | Cat# C3019 |
| Polybrene Infection / Transfection Reagent | EMD Millipore | Cat# TR-1003 |
| U-13C6, U-15N3 Histidine:HCl:H2O | Cambridge Isotopes Laboratories (CIL) | Cat# CNLM-758 |
| U-13C6, U-15N2 Lysine:2HCl | CIL | Cat# CNLM-291 |
| U-13C9, 15N Phenylalanine | CIL | Cat# CNLM-575 |
| U-13C4, 15N Threonine | CIL | Cat# CNLM-587 |
| U-13C5, 15N Valine | CIL | Cat# CNLM-442 |
| Ring-2,4–2H2, alpha,beta,beta-2H3 Histidine | CIL | Cat# DLM-7855 |
| 4,4,5,5–2H4 Lysine:2HCl | CIL | Cat# DLM-2640 |
| Ring-2H5 Phenylalanine | CIL | Cat# DLM-1258 |
| 4–13C, 2,3–2H2 Threonine | CIL | Cat# CDLM-9307 |
| U-2H8 Valine | CIL | Cat# DLM-488 |
| U-13C6, U-15N4 Arginine:HCl | CIL | Cat# CNLM-539 |
| Methionine, Cell Labeling Grade, L-[35S]-,>600 Ci (22.2 TBq) mmol, 50 mM Tricine, 10 mM BME, 5 mCi | PerkinElmer | Cat# NEG009L005MC |
| Lysyl Endopeptidase | FUJIFILM Wako Pure Chemical Corporation | Cat# 125–05061 |
| Sequencing Grade Trypsin | Promega | Cat# V5111 |
| TMT11–131C Label Reagent | TFS | Cat# A37724 |
| GCN2iB | MedChemExpress | Cat# HY-112654 |
| GDC0941 (PI3K inhibitor) | Cayman Chemical | Cat# 11600 |
| Cathepsin L inhibitor | Santa Cruz Biotechnology | Cat# sc-3132 |
| Hydroxychloroquine Sulfate | Tocris | Cat# 5648 |
|
| ||
| Critical commercial assays | ||
|
| ||
| QIAshredder | QIAGEN | Cat# 79654 |
| RNeasy Plus Mini Kit | QIAGEN | Cat# 74134 |
| PrepX RNA-Seq for Illumina Library Kit | Takara | Cat# 640096 |
| Pierce BCA Protein Assay Kit - Reducing | TFS | Cat# 23250 |
| Agent Compatible | ||
|
| ||
| Deposited data | ||
|
| ||
| Raw Sequencing Data | This paper | SRA: PRJNA757010 |
| Raw Proteomics Data | This paper | ProteomeXchange: PXD028143 |
|
| ||
| Experimental models: Cell lines | ||
|
| ||
| KRPC-A cells | (Nofal et al., 2017) | N/A |
| K-RasG12D MEFs | Craig Thompson, MSKCC | N/A |
|
| ||
| KRPC-A Gcn2 KO | This paper | N/A |
| KRPC-A Gcn2 KO + FLAG-EGFP | This paper | N/A |
| KRPC-A Gcn2 KO +hGCW2 | This paper | N/A |
| KRPC-A Vasp KO + FLAG-EGFP | This paper | N/A |
| KRPC-A Vasp KO +hVASP | This paper | N/A |
| KRPC-A Vps39 KO +FLAG-EGFP | This paper | N/A |
| KRPC-A Vps39 KO +FLAG-hVPS39 | This paper | N/A |
|
| ||
| Oligonucleotides | ||
|
| ||
| sgRNA PCR Forward Primer: AATGATACGGCGACCACCGAGATC TACACCGACTCGGTGCCACTTTT |
Integrated DNA Technologies (IDT) |
N/A |
| sgRNA PCR Reverse Primer: CAAGCA GAAGACGGCATACGAGATCnnnnnnTT TCTTGGGTAGTTTGCAGTTTT (“nnnnnn” denotes the sample barcode sequence) |
IDT | N/A |
| Custom HiSeq Read 1 primer: CGGT GCCACIIIIICAAGTTGATAACGG ACTAGCCTTATTTTAACTTGCTATTT CTAGCTCTAAAAC |
IDT | N/A |
| Custom HiSeq Indexing primer: TTTCA AGTTACGGTAAGCATATGATAGTCCA TTTTAAAACATAATTTTAAA |
IDT | N/A |
| sgEif2ak4_4 (forward): CACCgGGCTACCCACAGAGAAATGG |
IDT | N/A |
| sgEif2ak4_4 (reverse): AAACCCATTTCTCTGTGGGTAGCCc |
IDT | N/A |
| sgVasp_8 (forward): CACCgCTTGCGGCCAACAACTCGGA |
IDT | N/A |
| sgVasp_8 (reverse): AAACTCCGAGTTGTTGGCCGCAAGc |
IDT | N/A |
| sgVps39_1 (forward): CACCgGAACTGGACAGACATCCCAG |
IDT | N/A |
| sgVps39_1 (reverse): AAACCTGGGATGTCTGTCCAGTTCc |
IDT | N/A |
| Eif2ak4_ORF_PCR (forward): ATCTCGAGGCCACCATGGCTGGG GGCCGTGGGGC |
IDT | N/A |
| Eif2ak4_ORF_PCR (reverse): TATTA TTATGCGGCCGCTTAAAATAAGATT CTGTAGTAGTCATCTCTATAGCTG |
IDT | N/A |
| Vasp_ORF_PCR (forward): AT CTCGAGGCCACCATGAGCGA GACGGTCATCTGTTCCAGC |
IDT | N/A |
| Vasp_ORF_PCR (reverse):ATGCGGCCGC TTAGGGAGAACCCCGCTTCCTCAGC |
IDT | N/A |
| FLAG-Vps39_ORF_PCR (forward): GGTACGGGAATTCCTGCAGGC CTCGAGGCCACCATGGACTA CAAAGACGATGACGACAAGC ACGACGCTTTCGAGCCAG |
IDT | N/A |
| Vps39_ORF_PCR (reverse): GGGGGGGGCGGAATTTAC GTAGCGGCCGCTTAGTCAG CTGGGTTTACCTCTTTGG |
IDT | N/A |
|
| ||
| FLAG-EGFP_ORF_PCR (forward): A TCTCGAGGCCACCATGGACTAC AAAGACGATGACGACAAGGT GAGCAAGGGCGAGGAG |
IDT | N/A |
| EGFP_ORF_PCR (reverse):ATGC GGCCGCTTACTTGTACAGCT CGTCCATGCCGAG |
IDT | N/A |
|
| ||
| Recombinant DNA | ||
|
| ||
| lentiCRISPR v2 | (Shalem et al., 2014) | Addgene Plasmid #52961 |
| pMXs-3XFLAG-EGFP-OMP25 | (Chen et al., 2016) | Addgene #83354 |
| Human EIF2AK4 ORF plasmid | Origene | Cat# RC212459 |
| Human VASP ORF plasmid | Origene | Cat# RC203544L1 |
| Human VPS39 ORF plasmid | Origene | Cat# RC209854 |
| psPAX2 (lentiviral packaging plasmid) | Trono Lab Packaging and Envelope Plasmids | Addgene #12260 |
| pMD2.G (VSV-G expressing plasmid) | Trono Lab Packaging and Envelope Plasmids | Addgene #12259 |
| Gag/pol | (Reya et al., 2003) | Addgene #14887 |
| Mouse genome-wide sgRNA library | This paper | N/A |
| lentiCRISPR v2-sgEif2ak4_4 | This paper | N/A |
| lentiCRISPR v2-sgVasp_8 | This paper | N/A |
| lentiCRISPR v2-sgVps39_1 | This paper | N/A |
| pMXs-hEIF2AK4 | This paper | N/A |
| pMXs-hVASP | This paper | N/A |
| pMXs-FLAG-hVPS39 | This paper | N/A |
| pMXs-FLAG-EGFP | This paper | N/A |
|
| ||
| Other | ||
|
| ||
| HEK293FT cells | TFS | Cat# R70007 |
EXPERIMENTAL MODEL AND SUBJECT DETAILS
Cell lines and culture
All cell lines used in this study are listed in the key resources table. KRPC-A cells (adapted KRPC cells) were derived from genetically engineered murine pancreatic tumors. They were adapted to grow robustly in amino acid-deficient medium supplemented with serum protein by serially passaging KRPC cells (Lito et al., 2014) in leucine-free DMEM supplemented with 50 g/L bovine serum albumin (BSA) for several months, as described previously (Nofal et al., 2017).
All cells were propagated in DMEM with 25 mM glucose and 4 mM glutamine and without pyruvate (Mediatech). DMEM was supplemented with 10% fetal bovine serum (FBS) (Sigma), unless specified otherwise.
METHOD DETAILS
Custom media preparation
Custom media were prepared using DMEM powder containing all DMEM salts and vitamins, low glucose, and no amino acids or pyruvate (US Biological). Glucose was added to a final concentration of 25 mM glucose, and sodium bicarbonate to a final concentration of 2.0 g/L. Pyruvate was not added to any media. In all custom media, unless specified otherwise, amino acid concentrations were identical to DMEM (glutamine: 4 mM; isoleucine, leucine, lysine, threonine, and valine: 0.8 mM; arginine, glycine, serine, phenylalanine: 0.4 mM; cystine, histidine, methionine, and tyrosine: 0.2 mM; and tryptophan: 0.078 mM). Bovine serum albumin (Sigma A9418 or A1470) was added where specified. All custom media were adjusted to pH 7.2 immediately before sterile filtration and supplemented with 5% dialyzed FBS (Sigma) unless specified otherwise. To facilitate custom media preparation, concentrated (20100X) amino acid stock solutions were prepared and stored at 4°C. Such solutions were used to add all amino acids except glutamine (unstable) and tyrosine (insoluble), which were added directly in powder form.
Genome-wide CRISPR-Cas9 screens
Screens were performed with a mouse-genome-wide sgRNA library containing 188,310 sgRNAs targeting 18,986 genes as well as 199 control sgRNAs targeting intergenic regions (Table S1). sgRNAs were designed and cloned into lentiCRISPR v2 (Addgene #52961) as described previously (Wang et al., 2016a). Lentivirus containing the genome-wide sgRNA library was produced in HEK293T cells and added to KRPC-A cells as described previously (Wang et al., 2016b). Briefly, 200 million KRPC-A cells were infected, and infected cells were selected with puromycin for 48 h. Cells were then seeded into either amino acid-replete DMEM without supplemental albumin, amino acid-replete DMEM with 50 g/L albumin, or leucine-free DMEM with 50 g/L albumin. All media were supplemented with 5% dialyzed FBS. Cells were propagated in each of these three conditions for 12 doublings, with fresh media added every day and at least 500-fold coverage of the library maintained after each passage. After 12 doublings, genomic DNA was extracted, and sgRNA inserts were amplified by polymerase chain reaction (PCR) as described previously (Wang et al., 2016b). The resultant PCR products were purified and sequenced on an Illumina HiSeq using custom primers (listed in the key resources table), enabling comparison of relative sgRNA population frequencies between populations.
Knockout cell lines
sgRNAs targeting murine Gcn2 (Eif2ak4), Vasp, and Vps39 were selected based on their performance in the genome-wide screens. Oligonucleotide pairs (listed in the key resources table) were cloned into lentiCRISPR v2 (Addgene #52961) following the standard cloning protocol (http://genome-engineering.org). HEK293FT cells were transfected with the lentiCRISPR v2 plasmid of interest, psPAX2 (Addgene #12260), and pMD2.G (Addgene #12259). Medium was replaced after 12–16 h, and lentivirus was harvested after 36 h. KRPC-A cells were infected with lentivirus in the presence of 5 μg/mL polybrene. Infected cells were selected and maintained in 2 μg/mL puromycin, and clonal knockout cell lines were produced by isolation of single cells from this infected population.
Overexpression cell lines
We cloned sequences for human EIF2AK4 and VASP from Origene expression plasmids (plasmids and oligonucleotides are listed in the key resources table) into the backbone of pMXs-3XFLAG-EGFP-OMP25 (Addgene #83354) at the XhoI and NotI sites using T4 DNA Ligase and NEB 10-beta competent cells. Human VPS39 – FLAG-tagged at the N-terminus – was cloned into the same backbone using Gibson Assembly, because the ORF contains an XhoI site. EGFP – FLAG-tagged once at the N-terminus – was amplified from and reinserted into the backbone of pMXs-3XFLAG-EGFP-OMP25. HEK293FT cells were transfected with the expression plasmid of interest, pMD2.G (Addgene #12259), and gag/pol (Addgene #14887). KRPC-A cells were infected with lentivirus in the presence of 5 μg/mL polybrene. Infected cells were selected and maintained in 10 μg/mL blasticidin.
Western blotting
Cells were washed 3× with PBS, then lysed with ice-cold RIPA buffer (Cell Signaling) with cOmplete protease inhibitor and PhosSTOP phosphatase inhibitor cocktails (Roche). Soluble lysate fractions were isolated by centrifugation at 16,000 g for 10 min. Relative protein content was estimated using total cellular volume as a surrogate, and equal amounts of protein per sample were analyzed by western blot.
Proliferation assays
200K cells were seeded in standard 60 mm tissue culture dishes in DMEM supplemented with 5% FBS. After 24 h, cells were washed once with PBS and switched to amino-acid-deficient medium supplemented with 50 g/L albumin. Cell volume was measured using Packed Cell Volume tubes (Techno Plastic Products). Cells were imaged using a Nikon ECLIPSE Ts2 inverted microscope with a Lumenera INFINITY 1 CMOS camera.
Ribosome profiling
Ribosome profiling was performed as described previously (McGlincy and Ingolia, 2017) with modifications detailed below. Cells were seeded in150mm tissue culture dishes in 5% dialyzed FBS and grown to 60–80% confluence in the specified media.Immediately before extraction, cells were washed once rapidly withice coldPBS with 100 μg/Ml cycloheximide,which was aspirated thoroughly. Then 1 mL of lysis buffer(20mM TrispH7.5, 150mM NaCl, 15mMMgCl2, 5mMCaCl, 1% TritonX-100, 1mMDTT, 100μg/mL cycloheximide, 20U/ mLDNase I,and the cOmplete protease inhibitor cocktail(Roche)) was added.Cells were scraped in to the lysis buffer,and the lysate was transferred to a 2 mL Eppendorf tube. Lysates were homogenized by passing them three times through a 26G needle and clarified by centrifugation at 16,000 g for 10 min at 4°C. 600 μL of lysate was digested with 4μL of RNase I at 4°C for 45 min. Ribosomes were pelleted from lysates by ultracentrifugation (100,000 g) through a 1 M sucrose cushion for 1 h at 4°C. Footprints were isolated from a 15% TBE-Urea gel, dephosphorylated with PNK for 1 h at 37°C, then ligated to one of six barcoded linkers (NI-810 to NI-815) (McGlincy and Ingolia,2017). Ligation products were then pooled and purified from a second 15% TBE-Urea Gel. rRNA was then depleted using the RiboZero Gold rRNA Removal Kit (Human/Mouse/Rat), and libraries were reverse transcribed with Super Script III at 55°C for 30 min, and template RNA was degraded with 100 mM NaOH at 70°C for 20 min. cDNAs were isolated from a third 15% TBE-Urea gel, then circularized with CircLigase I and amplified with Kapa Hifi HotStart ReadyMix using NI-NI-798 as the forward primer and a standard indexed reverse library primer (McGlincyand Ingolia, 2017). Libraries were sequenced on an Illumina NovaSeq 6000 using the standard protocol. Reads weremapped to the Mouse Genome (GRCm38 from Illumina’s iGenomes)using STAR RNA-seq alignment software (Dobin etal., 2013). Read counts were generated using FeatureCounts from the Subread software package (Liao et al., 2014).
Polysome Profiling
Cells were cultured and lysed, and lysates were homogenized and clarified as described above (see ribosome profiling). 600 mL of each lysate was loaded onto a pre-chilled 10–50% sucrose gradient, which was prepared using a Gradient Master (BioComp). Lysates loaded on gradients were then placed in a SW 41 Ti swinging-bucket rotor and centrifuged at 35,000 g for 2.5 h at 4°C in an Optima XE-100 Ultracentrifuge (Beckman Coulter). Polysomes were visualized using a Gradient Fractionator (BioComp) coupled to an EM-1 Econo UV Monitor (BioRad) measuring absorbance at 254 nm.
Stable-isotope-labeled amino acids for simultaneous measurement of protein synthesis rate and protein scavenging rate
For simultaneous measurement of protein synthesis rate and protein scavenging rate, two sets of stable-isotope-labeled amino acids were used. We term these two sets of amino acids “isotope flavor 1 (L1)” and “isotope flavor 2 (L2).” Both sets contain five amino acids: histidine, lysine, phenylalanine, threonine, and valine. These amino acids are essential (i.e. they cannot be synthesized from glucose and glutamine) and are strictly used for protein synthesis in cultured cells. For each of these amino acids, each isotope-labeled form is at least two mass units heavier than the unlabeled form and at least two mass units different from the other isotope-labeled form. For example, L1-labeled valine is 6 mass units heavier than the unlabeled valine, and L2-labeled valine is 8 mass units heavier. The specific isotope-labeled amino acids used in this study are listed below, but others can be used in their place, as long as they are two mass units heavier than the unlabeled and two mass units different from each other. These labeled amino acids are used in place of unlabeled amino acids at standard DMEM concentrations.
The L1-labeled amino acids are uniformly 13C,15N-labeled histidine (m+9); lysine:2HCl (m+8); phenylalanine (m+10); threonine (m+5); and valine (m+6).
The L2-labeled amino acids are Ring-2,4-2H2,alpha,beta,beta-2H3 histidine (m+5); 4,4,5,5-2H4 Lysine:2HCl (m+4); Ring-2H5 phenylalanine (m+5); 4-13C,2,3-2H2 threonine (m+3); and uniformly 2H-labeled valine (m+8).
Simultaneous measurement of protein synthesis rate and protein scavenging rate
Cells were grown for five doublings in medium containing L1-labeled amino acids supplemented with 10% dialyzed FBS. After five doublings, cells were seeded at low cell density in 60 mm tissue culture dishes in L1-labeled medium supplemented with 5% dialyzed FBS. After 24 h, cells were washed once with PBS and switched to medium containing L2-labeled amino acids supplemented with 50 g/L albumin and 5% dialyzed FBS. After 2 h, cells were again washed once with PBS and switched to fresh L2-labeled medium with the specified modifications (leucined ropout, albumin supplementation).After24h,aminoacidsinthemediumandcellularproteinwereextracted, and total cellular volume was measured using Packed Cell Volume tubes (Techno Plastic Products).
Amino acid extraction from medium and preparation for LC-MS analysis
50 μL of medium was directly added to 200 μL of HPLC-grade methanol. This mixture was vortexed then centrifuged at 16,000 g for 5 min. 200 μL supernatant was transferred to a new tube. 5 μL triethylamine and 1 mL benzyl chloroformate were added sequentially, and the resulting mixture was vortexed and incubated at room temperature for 30 min.
Extraction and hydrolysis of cellular protein and preparation of resulting amino acids for LC-MS analysis
Medium was aspirated and plates were rinsed three times with room temperature PBS before addition of 0.5 mL 0.05% trypsin. After sufficient trypsinization, 1 mL PBS was added, and the mixture was transferred to a microcentrifuge tube. Cells were then pelleted by centrifugation at 1,000 g for 5 min, and the pellet was washed once with PBS. After careful removal of the supernatant, cell pellets were resuspended in 350 μL lysis buffer (25 mM HEPES pH 7.2, 10 mM EDTA, 2% SDS, and cOmplete protease inhibitor cocktail (Roche)) and vortexed thoroughly. Lysates were sonicated, then centrifuged at 16,000 g for 5 min.
Protein was then purified from the supernatant using methanol-chloroform extraction. In a 2 mL Eppendorf tube, 400 μL methanol, 200 μL chloroform, and 300 μL water were sequentially added to 100 μL supernatant; the mixture was vortexed thoroughly after addition of each. The mixture was then centrifuged at 16,000 g for 2 min. After the upper layer was carefully discarded, 300 mL methanol was added, and the mixture was vortexed thoroughly. The mixture was then centrifuged again at 16,000 g for 2 min. The supernatant was carefully discarded, and the pellet was air-dried. Once dry, 200 μL 6 M HCl was added, and samples were incubated overnight at 110°C. Acid was then evaporated completely under nitrogen flow, and amino acids were resuspended in 200 μL HPLC-grade methanol and prepared for LC-MS analysis with derivatization as described above.
LC-MS analysis
Samples were diluted such that amino acids fell within the linear range of a triple quadrupole mass spectrometer (TSQ Quantum Discovery Max; Thermo Scientific), operating in negative multiple reaction monitoring mode, coupled to C18 high-performance reversed-phase ion pair liquid chromatography (Lu et al., 2006, 2008). Data were analyzed using open-source software (Melamud et al., 2010).
Calculation of absolute amino acid amounts
Absolute amounts of amino acids in the medium were determined by comparison of peak intensities in samples of interest and samples from fresh medium, in which absolute amounts of amino acids are known.
Absolute amounts of amino acids in cellular protein were estimated using total cell volume, which is measured using Packed Cell Volume tubes (Techno Plastic Products). Assuming that 70% of cell volume is water and protein is 60% of cellular dry weight, 18% of total wet volume is protein. Using the known frequencies of each amino acid in mouse protein, the molar amount of each amino acid per unit cell volume can be calculated (Table S3).
Protein scavenging rate computation
In the isotope labeling scheme described above (see simultaneous measurement of protein synthesis rate and protein scavenging rate assay), extracellular protein is unlabeled and all other amino acids are either L1-labeled or L2-labeled. Protein scavenging yields unlabeled amino acids in a background of labeled amino acids. The rate of protein scavenging is defined as the release rate of unlabeled amino acids from lysosomes.
To derive an expression for the release rate of unlabeled amino acids, we start with the following basic relationship: any cellular reaction rate (in units of moles per unit time per unit cell volume) is equal to the total amount of product being produced by this reaction in all cells (in units of moles per unit time) divided by the total volume of all cells. In this case, for a given amino acid, the cellular rate of unlabeled amino acid release is equal to the combined rate of unlabeled amino acid release in all cells divided by the total cell volume:
| (Equation 1) |
After integrating this equation with respect to time, the cellular release rate of unlabeled amino acids from lysosomes is equal to the total amount of unlabeled amino acid released by all cells over the course of the experiment divided by the time-integral of total cellular volume:
| (Equation 2) |
Unlabeled amino acids released by lysosomes have four possible fates: i) they can remain inside the cell in monomeric form, ii) they can be secreted into the extracellular space, iii) they can be incorporated into new cellular protein, and iv) they can be catabolized and used to synthesize other biomolecules.
| (Equation 3) |
Of these four fates, two can be ignored. First, because the aggregate cell volume is very small relative to the volume of the medium in each dish, and because the amino acid concentrations are similar in cells and in the medium, the absolute amount of amino acid monomers in cells is negligible relative to the absolute amount of amino acid monomers in the medium. Second, catabolism of the relevant amino acids (histidine, lysine, phenylalanine, threonine, and valine) is negligible in the cell lines used in this study. Thus, the two quantitatively important fates of unlabeled amino acids produced by protein scavenging are i) secretion into the extracellular space and ii) incorporation into new cellular protein. The equation for the rate of release of unlabeled amino acids from lysosomes is simplified accordingly:
| (Equation 4) |
The first term in the numerator – the amount of unlabeled amino acids in the medium at the end of the experiment – is directly measurable. The second term in the numerator – the amount of unlabeled amino acids in cellular protein at the end of the experiment – can be determined by multiplying the fraction of unlabeled amino acids in cellular protein by the absolute amount of cellular protein in that sample (see calculation of absolute amino acid amounts).
The third term in the numerator is included to account for unlabeled amino acid contaminants at t = 0 h. The amount of contaminating unlabeled amino acids in the medium at t = 0 h is negligible and does not need to be accounted for. However, because cellular protein still contains a small but meaningful fraction of unlabeled amino acids after five doublings in L1-AA medium and two hours in L2-AA medium, the unlabeled amino acids in cellular protein at the end of pre-labeling (t = 0 h) must be subtracted from the amount of unlabeled amino acids in cellular protein at the end of the experiment. This correction is included in Equation 5:
| (Equation 5) |
Dividing the amino acid release rate by the number of times the amino acid being used for the calculation appears in bovine serum albumin yields an estimate of protein scavenging rate in terms of moles of albumin degraded per unit time per unit cell volume:
| (Equation 6) |
To convert this rate into the rate of leucine yielded by protein scavenging, we multiply the rate by the number of leucine molecules per albumin (61):
| (Equation 6) |
Proxy for protein scavenging rate
In practice, labeling patterns and abundances of amino acids in the medium are much easier to measure than those of amino acids incorporated into cellular protein, and in many cases (i.e. when a highly quantitative estimate of protein scavenging is not required), the rate of secretion of unlabeled amino acids into the medium can serve as a satisfactory proxy for the protein scavenging rate:
| (Equation 7) |
Importantly, to use this proxy, one must assume that a fixed fraction of the unlabeled amino acids released by lysosomes end up in the medium. This is a reasonable assumption as long as the cells being compared are growing at similar rates.
Protein synthesis rate computation
The general strategy used to calculate protein synthesis rate is somewhat different from the strategy used to calculate protein scavenging rate. Specifically, to calculate scavenging rate, we calculate the sum of all products of scavenging, and divide that by the time integral of total cellular volume. On the other hand, to calculate synthesis rate, we first compute the rate of growth in units of inverse time using the L1-labeling of cellular protein. For example, if cellular protein starts 100% L1-labeled, and after 24 h, cellular protein is 50% L1-labeled, then the cellular protein pool doubles roughly every 24 h. We fit these data to compute a rate constant. We then multiply this relative rate by the ratio of the molar amount of amino acid in cellular protein to total cell volume (we assume this ratio is fixed over time – i.e. cells have a constant amount of protein per unit cell volume). This converts the rate from units of inverse time to moles of amino acid over unit cell volume and time. These are the same units as the protein scavenging rate, allowing direct comparison.
Assuming cell growth is exponential and protein content per cell is fixed, the growth of total cellular protein should also be exponential:
| (Equation 8) |
This equation can be rearranged such that the rate k is described in terms of the ratio of total protein after a given time to total protein at the initial time-point:
| (Equation 9) |
Total cellular protein at these two time-points could be measured directly, but measurements based on standard protein assays are typically too noisy to reliably estimate small changes in total protein. Instead we use the amino acid labeling of cellular protein to estimate the relative growth of the total protein pool. For cells grown as described above (see simultaneous measurement of protein synthesis rate and protein scavenging rate), cellular protein at the start of the experiment is predominantly L1-labeled, and new protein is not (it is unlabeled or L2-labeled). Thus, the fractional growth of protein at any given time relative to the amount of protein at the initial time-point can be approximated as total protein over L1-labeled protein, or the inverse of the L1-labeled protein fraction:
| (Equation 10) |
This equation makes two assumptions that can be corrected for. First, the equation assumes that protein starts completely L1-labeled, but this is not the case: usually, 5–10% of protein at the initial time-point is unlabeled or L2-labeled. Thus, even at the initial time point, according to Equation (10), it appears as if there is 5–10% growth. This can be corrected for by simply multiplying the L1 fraction at the initial time-point:
| (Equation 11) |
Second, intracellular protein degradation is assumed to be negligible. Indeed, we see little intracellular protein degradation relative to protein synthesis or even protein scavenging, but still enough to warrant a correction. When intracellular protein is degraded, some L1-labeled amino acids initially incorporated in cellular protein are secreted into the medium. Thus, the pool of L1-labeled protein shrinks during the experiment, leading to overestimation of the protein synthesis rate. By measuring the molar amount of L1-labeled amino acids secreted into the medium, we can calculate how much the L1-labeled cellular protein pool shrunk during the experiment, and correct for it:
| (Equation 12) |
Notably, the correction in Equation 12 makes this protein synthesis rate a net protein synthesis rate – i.e. the rate of intracellular protein synthesis subtracted by the rate of intracellular protein degradation. This net protein synthesis rate is the relevant rate to compare with the protein scavenging rate, as scavenging limits net protein synthesis, not absolute protein synthesis, in aminoacid deficient conditions.
Combining Equations 9 and 12:
| (Equation 13) |
To convert this rate constant into one with the appropriate units, it is multiplied by the fixed ratio of nmol leu in cellular protein to unit cell volume.
| (Equation 14) |
This rate has the same units as and thus can be compared directly with the protein scavenging rate above.
35S-methionine-based protein synthesis measurements
Cells seeded at low density in 6-well plates were switched to either amino acid-replete or leucine-free medium supplemented with the indicated concentration of bovine serum albumin. 5 μCi 35S-Methionine was then added to each well. After 24 h, cells were trypsinized, cell pellets washed once with PBS, and then resuspended in 200 μL PBS, of which 100 μL was immersed in Ultima Gold scintillation fluid and measured using a liquid scintillation counter. Control samples to which 5 mCi 35S methionine was added for only 10 min prior to cell pellet harvesting were used to estimate background due to unincorporated 35S methionine.
Isotope tracer-proteomics and proteomic analysis
Medium containing uniformly 13C,15N-labeled lysine and arginine was prepared. Cells were grown for five doublings in this labeled medium supplemented with 10% dialyzed FBS. Cells were then seeded in 100 mm tissue culture dishes in this labeled medium supplemented with 5% dialyzed FBS. After 24 h, cells were switched to the specified unlabeled media. Cells were then grown as specified, washed three times with room temperature PBS, and lysed with 350 μL lysis buffer (25 mM HEPES pH 7.2, 10 mM EDTA, 2% SDS, and the cOmplete protease inhibitor cocktail (Roche)). Proteomics was performed as described previously (Gupta et al., 2018). Briefly, lysate protein was quantified using a reducing agent-compatible BCA Protein Assay (Thermo Scientific). 100 mg of protein was cysteine-protected with N-ethylmaleimide and purified using methanol-chloroform extraction. Purified protein was digested with lysyl endopeptidase and sequencing grade trypsin, labeled with TMT tags (TMT11–131C Label Reagent), prefractionated using a medium pH reverse phase HPLC separation using a C18 column (Agilent), and analyzed using the MultiNotch MS3 method on an Orbitrap Fusion Lumos (Thermo Scientific). Proteomics data was analyzed as described previously (Sonnett et al., 2018).
To calculate the amount of newly synthesized protein relative to the starting amount of protein at the initial time point, filters were first applied to remove poorly or incompletely measured peptides and proteins from the dataset. Any protein for which only light or only heavy peptides were measured was removed. Any peptide with an isolation specificity of less than 0.75 was removed. Finally, any light peptide which did not show at least three-fold more signal in the light-only control sample compared to the heavy-only control sample was discarded, and vice versa. For each remaining protein, the median ratio of heavy signal to light signal summed over all TMT channels (measured in MS1) was calculated, and the signal for all light peptides and all heavy peptides (measured in MS3) were summed to generate a total light signal and a total heavy signal for every protein in every individual TMT channel. These total signals were then adjusted such that the total light signal and the total heavy signal across all channels was in accordance with the heavy-tolight ratio measured in MS1. At this point, total abundance and heavy and light fractions can be calculated for every remaining protein in every channel. All proteins which were less than 85% labeled in the labeled control sample or more than 15% labeled in the unlabeled control sample were removed.
Data from a special subset of proteins can be used to estimate the growth of the pool of all proteins in a population of cells. Namely, proteins that are not meaningfully degraded (or secreted) can be used for this purpose. For these proteins, the interpretation of the data is straightforward: the labeled pool is the initial pool, so the total pool size (relative to the initial) is the inverse of the labeled fraction. We are confident that such proteins exist because the global rate of intracellular protein degradation is much smaller than the global rate of protein synthesis in these cells (Figure S4). To isolate a subset of proteins that can be used to estimate protein synthesis, first, proteins whose levels change a lot between conditions were excluded (only proteins whose levels remain roughly constant across conditions are useful for this application). All but the 500 proteins (out of 5000) with the lowest deviations in protein levels across all samples measured were filtered out. Of these remaining 500, we selected the 50 proteins with the lowest unlabeled fractions. Unlabeled fractions of these 50 stable proteins were then converted into estimates of relative growth.
RNA sequencing
RNA was extracted from 100 mL cell lysate prepared for ribosome profiling (STAR Methods see ribosome profiling) with an RNeasy Plus Mini Kit (QIAGEN). RNA sequencing libraries were prepared using the PrepX RNA-seq library preparation protocol (Takara Bio) on an Apollo 324 automated system, and sequenced on an Illumina NovaSeq 6000 using the standard protocol. Read alignment and quantification were done using the Galaxy instance at the Lewis-Sigler Institute at Princeton University (Afgan et al., 2018). Reads were mapped to the Mouse Genome (GRCm38 from Illumina’s iGenomes) using STAR RNA-seq alignment software (Dobin et al., 2013). Read counts were generated using FeatureCounts from the Subread software package (Liao et al., 2014).
Pharmacological inhibitor experiments
Cells were seeded in 24-well tissue culture plates in DMEM supplemented with 5% FBS. Media containing inhibitors was prepared such that DMSO concentration was constant in each experiment. After 24 h, cells were washed once with PBS and switched to the specified medium with the specified inhibitor concentration. After the indicated time in culture, cells were washed twice with PBS, and standard DMEM supplemented with 10% FBS and 0.1 mg/mL resazurin, but without additional BSA, was added. After 2 h, absorbance was measured.
QUANTIFICATION AND STATISTICAL ANALYSIS
Statistical analysis
For proliferation, protein scavenging rate, and protein synthesis rate experiments, p-values were calculated using two-tailed unpaired t-tests. 95% confidence intervals were calculated as the standard error of the mean multiplied by 1.96. For comparison of log-ratio distributions in the ribosomal profiling and proteomics datasets, p-values were calculated using two-tailed t tests.
Supplementary Material
Highlights.
Genome-wide screen illuminates processes supporting growth fueled by protein scavenging
In addition to macropinocytosis, lysosome trafficking and catabolic capacity are key
The protein kinase GCN2, which suppresses translation initiation, is the top screen hit
GCN2 prevents ribosome stalling without slowing the overall rate of protein synthesis
ACKNOWLEDGMENTS
The authors thank Britt Adamson, Amanda Amodeo, Eileen White, Shawn Davidson, Bryan King, and Robert Marmion for useful discussion, Lillia Ryazanova (supported by the Lewis-Sigler Collaboration Fund and the Princeton Catalysis Initiative) for help with proteomics, and Gary Laevsky for imaging support. The authors also thank Craig Thompson and Scott Lowe for generously providing cell lines. lentiCRISPR v2 was a gift from Feng Zhang (Addgene plasmid # 52961). This work was supported by grants from the NIH (R01 CA163591 and DP1 DK113643) and from the Stand Up To Cancer (Dream Team Translational research grant SU2C-AACR-DT2016) to J.D.R., by fellowship support from the NIH (F31 CA186513) to M.N., by support from the Howard Hughes Medical Institute to D.M.S., by an NIH grant (R35GM128813) to M.W., by support from the NIH (T32GM007388) to A.N.F., by an NIH grant (R01 DK109714) to T.G.A., and by an NIH grant (DP1 AI124669) to Z.G. Stand Up To Cancer is a program of the Entertainment Industry Foundation, administered by the American Association for Cancer Research.
DECLARATION OF INTERESTS
J.D.R. is an advisor and stockholder in Kadmon Pharmaceuticals, Colorado Research Partners, L.E.A.F. Pharmaceuticals, Bantam Pharmaceuticals, Barer Institute, and Rafael Pharmaceuticals; a paid consultant of Pfizer; a founder, director, and stockholder of Farber Partners, Serien Therapeutics, and Sofro Pharmaceuticals; a founder and stockholder in Toran Therapeutics and Raze Therapeutics; inventor of patents held by Princeton University; and a director of the Princeton University-PKU Shenzhen collaboration. D.M.S. and T.W. are co-founders of KSQ Therapeutics, which is using CRISPR-based genetic screens to identify drug targets. Z.G. is the founder of ArrePath.
Footnotes
SUPPLEMENTAL INFORMATION
Supplemental information can be found online at https://doi.org/10.1016/j.cels.2021.09.014.
REFERENCES
- Afgan E, Baker D, Batut B, Van Den Beek M, Bouvier D, Cech M, Chilton J, Clements D, Coraor N, Grüning BA, et al. (2018). The Galaxy platform for accessible, reproducible and collaborative biomedical analyses: 2018 update. Nucleic Acids Res 46, W537–W544. [DOI] [PMC free article] [PubMed] [Google Scholar]
- Amyere M, Payrastre B, Krause U, Van Der Smissen P, Veithen A, and Courtoy PJ (2000). Constitutive macropinocytosis in oncogene-transformed fibroblasts depends on sequential permanent activation of phosphoinositide 3-kinase and phospholipase C. Mol. Biol. Cell 11, 3453–3467. [DOI] [PMC free article] [PubMed] [Google Scholar]
- Bar-Sagi D, and Feramisco JR (1986). Induction of membrane ruffling and fluid-phase pinocytosis in quiescent fibroblasts by ras proteins. Science 233, 1061–1068. [DOI] [PubMed] [Google Scholar]
- Bryant KL, Stalnecker CA, Zeitouni D, Klomp JE, Peng S, Tikunov AP, Gunda V, Pierobon M, Waters AM, George SD, et al. (2019). Combination of ERK and autophagy inhibition as a treatment approach for pancreatic cancer. Nat. Med 25, 628–640. [DOI] [PMC free article] [PubMed] [Google Scholar]
- Chen WW, Freinkman E, Wang T, Birsoy K, and Sabatini DM (2016). Absolute quantification of matrix metabolites reveals the dynamics of mitochondrial metabolism. Cell 166, 1324–1337, e11. [DOI] [PMC free article] [PubMed] [Google Scholar]
- Chesneau L, Dambournet D, Machicoane M, Kouranti I, Fukuda M, Goud B, and Echard A. (2012). An ARF6 / Rab35 GTPase cascade for endocytic recycling and successful cytokinesis. Curr. Biol 22, 147–153. [DOI] [PubMed] [Google Scholar]
- Commisso C, Davidson SM, Soydaner-Azeloglu RG, Parker SJ,Kamphorst JJ, Hackett S, Grabocka E, Nofal M, Drebin JA, Thompson CB, et al. (2013). Macropinocytosis of protein is an amino acid supply route in Ras-transformed cells. Nature 497, 633–637. [DOI] [PMC free article] [PubMed] [Google Scholar]
- Condon KJ, and Sabatini DM (2019). Nutrient regulation of mTORC1 at a glance. J. Cell Sci 132, jcs222570. [DOI] [PMC free article] [PubMed] [Google Scholar]
- Darnell AM, Subramaniam AR, and O’Shea EK (2018). Translational control through differential ribosome pausing during amino acid limitation in mammalian cells. Mol. Cell 71, 229–243, e11. [DOI] [PMC free article] [PubMed] [Google Scholar]
- Davidson SM, Jonas O, Keibler MA, Hou HW, Luengo A, Mayers JR, Wyckoff J, Del Rosario AM, Whitman M, Chin CR, et al. (2017). Direct evidence for cancer-cell-autonomous extracellular protein catabolism in pancreatic tumors. Nat. Med 23, 235–241. [DOI] [PMC free article] [PubMed] [Google Scholar]
- Dobin A, Davis CA, Schlesinger F, Drenkow J, Zaleski C, Jha S, Batut P, Chaisson M, and Gingeras TR (2013). STAR: ultrafast universal RNA-seq aligner. Bioinformatics 29, 15–21. [DOI] [PMC free article] [PubMed] [Google Scholar]
- Dong J, Qiu H, Garcia-Barrio M, Anderson J, and Hinnebusch AG (2000). Uncharged tRNA activates GCN2 by displacing the protein kinase moiety from a bipartite tRNA-binding domain. Mol. Cell 6, 269–279. [DOI] [PubMed] [Google Scholar]
- Egami Y, Taguchi T, Maekawa M, Arai H, and Araki N. (2014). Small GTPases and phosphoinositides in the regulatory mechanisms of macropinosome formation and maturation. Front. Physiol 5, 374. [DOI] [PMC free article] [PubMed] [Google Scholar]
- Felbor U, Kessler B, Mothes W, Goebel HH, Ploegh HL, Bronson RT, and Olsen BR (2002). Neuronal loss and brain atrophy in mice lacking cathepsins B and L. Proc. Natl. Acad. Sci. USA 99, 7883–7888. [DOI] [PMC free article] [PubMed] [Google Scholar]
- Garcia-barrio M, Dong J, Ufano S, and Hinnebusch AG (2000). Association of GCN1-GCN20 regulatory complex with the N-terminus of eIF2alpha kinase GCN2 is required for GCN2 activation 19, 1887–1899. [DOI] [PMC free article] [PubMed] [Google Scholar]
- Gupta M, Sonnett M, Ryazanova L, Presler M, and Wuhr M. (2018). Quantitative proteomics for Xenopus Embryos I. Sample Preparation Xenopus, 175–194. [DOI] [PMC free article] [PubMed] [Google Scholar]
- Han J, Back SH, Hur J, Lin YH, Gildersleeve R, Shan J, Yuan CL, Krokowski D, Wang S, Hatzoglou M, et al. (2013). ER-stress-induced transcriptional regulation increases protein synthesis leading to cell death. Nat.Cell Biol 15, 481–490. [DOI] [PMC free article] [PubMed] [Google Scholar]
- Hanley PJ, Xu Y, Kronlage M, Grobe K, Scho n, P., Song J, Sorokin L, Schwab A, and Ba€hler M. (2010). Motorized RhoGAP myosin IXb (Myo9b) controls cell shape and motility. Proc. Natl. Acad. Sci. USA 107, 12145–12150. [DOI] [PMC free article] [PubMed] [Google Scholar]
- Harding HP, Novoa I, Zhang Y, Zeng H, Wek R, Schapira M, and Ron D. (2000). Regulated translation initiation controls stress-induced gene expression in mammalian cells. Mol. Cell 6, 1099–1108. [DOI] [PubMed] [Google Scholar]
- Hinnebusch AG (2005). Translational regulation of GCN4 and the general amino acid control of yeast. Annu. Rev. Microbiol 59, 407–450. [DOI] [PubMed] [Google Scholar]
- Hsu C, Morohashi Y, Yoshimura S, Manrique-Hoyos N, Jung S, Lauterbach MA, Bakhti M, Grønborg M, Möbius W, Rhee J, et al. (2010). Regulation of exosome secretion by Rab35 and its GTPase-activating proteins TBC1D10A–C. J. Cell Biol 189, 223–232. [DOI] [PMC free article] [PubMed] [Google Scholar]
- Inglis AJ, Masson GR, Shao S, Perisic O, Mclaughlin SH, Hegde RS, and Williams RL (2019). Activation of GCN2 by the ribosomal P-stalk. Proc.Natl. Acad. Sci. USA 116, 4946–4954. [DOI] [PMC free article] [PubMed] [Google Scholar]
- Kamphorst JJ, Nofal M, Commisso C, Hackett SR, Lu W, Grabocka E, Vander Heiden MG, Miller G, Drebin JA, Bar-Sagi D, et al. (2015). Human pancreatic cancer tumors are nutrient poor and tumor cells actively scavenge extracellular protein. Cancer Res 75, 544–553. [DOI] [PMC free article] [PubMed] [Google Scholar]
- Karasic TB, O’Hara MH, Loaiza-Bonilla A, Reiss KA, Teitelbaum UR, Borazanci E, De Jesus-Acosta A, Redlinger C, Burrell JA, Laheru DA, et al. (2019). Effect of gemcitabine and nab-paclitaxel with or without hydroxychloroquine on patients With advanced pancreatic cancer: a Phase 2 Randomized Clinical Trial. JAMA Oncol 5, 993–998. [DOI] [PMC free article] [PubMed] [Google Scholar]
- Kinsey CG, Camolotto SA, Boespflug AM, Guillen KP, Foth M, Truong A, Schuman SS, Shea JE, Seipp MT, Yap JT, et al. (2019). Protective autophagy elicited by RAF → MEK → ERK inhibition suggests a treatment strategy for RAS-driven cancers. Nat. Med 25, 620–627. [DOI] [PMC free article] [PubMed] [Google Scholar]
- Kong R, Yi F, Wen P, Liu J, Chen X, Ren J, Li X, Shang Y, Nie Y, Wu K, et al. (2015). Myo9b is a key player in SLIT / ROBO-mediated lung tumor suppression. J. Clin. Invest 125, 4407–4420. [DOI] [PMC free article] [PubMed] [Google Scholar]
- Kouranti I, Sachse M, Arouche N, Goud B, and Echard A. (2006). Rab35 regulates an endocytic recycling pathway essential for the terminal steps of cytokinesis. Curr. Biol 16, 1719–1725. [DOI] [PubMed] [Google Scholar]
- Liao Y, Smyth GK, and Shi W. (2014). FeatureCounts: an efficient general purpose program for assigning sequence reads to genomic features. Bioinformatics 30, 923–930. [DOI] [PubMed] [Google Scholar]
- Lito P, Saborowski A, Yue J, Solomon M, Joseph E, Gadal S, Saborowski M, Kastenhuber E, Fellmann C, Ohara K, et al. (2014). Disruption of CRAF-Mediated MEK activation is required for effective mek inhibition in KRAS mutant tumors. Cancer Cell 25, 697–710. [DOI] [PMC free article] [PubMed] [Google Scholar]
- Lu W, Bennett BD, and Rabinowitz JD (2008). Analytical strategies for LC-MS-based targeted metabolomics. J. Chromatogr. B Analyt. Technol. Biomed. Life Sci 871, 236–242. [DOI] [PMC free article] [PubMed] [Google Scholar]
- Lu W, Kimball E, and Rabinowitz JD (2006). A high-performance liquid chromatography-tandem mass spectrometry method for quantitation of nitrogen-containing intracellular metabolites. J. Am. Soc. Mass Spectrom 17, 37–50. [DOI] [PubMed] [Google Scholar]
- Ma XM, and Blenis J. (2009). Molecular mechanisms of mTOR- mediated translational control. Nat. Rev. Mol. Cell Biol 10, 307–318. [DOI] [PubMed] [Google Scholar]
- Marton MJ, Crouch D, and Hinnebusch AG (1993). GCN1, a translational activator of GCN4 in Saccharomyces cerevisiae, is required for phosphorylation of eukaryotic translation initiation factor 2 by protein kinase GCN2. Mol. Cell. Biol 13, 3541–3556. [DOI] [PMC free article] [PubMed] [Google Scholar]
- McGlincy NJ, and Ingolia NT (2017). Transcriptome-wide measurement of translation by ribosome profiling. Methods 126, 112–129. [DOI] [PMC free article] [PubMed] [Google Scholar]
- Melamud E, Vastag L, and Rabinowitz JD (2010). Metabolomic analysis and visualization engine for LC-MS data. Anal. Chem 82, 9818–9826. [DOI] [PMC free article] [PubMed] [Google Scholar]
- Nofal M, Zhang K, Han S, and Rabinowitz JD (2017). mTOR inhibition restores amino acid balance in cells dependent on catabolism of extracellular protein. Mol. Cell 67, 936–946, e5. [DOI] [PMC free article] [PubMed] [Google Scholar]
- Palm W, Araki J, King B, Dematteo RG, and Thompson CB (2017). Critical role for PI3-kinase in regulating the use of proteins as an amino acid source. Proc. Natl. Acad. Sci. USA 114, E8628–E8636. [DOI] [PMC free article] [PubMed] [Google Scholar]
- Palm W, Park Y, Wright K, Pavlova NN, Tuveson DA, and Thompson CB (2015). The utilization of extracellular proteins as nutrients is suppressed by mTORC1. Cell 162, 259–270. [DOI] [PMC free article] [PubMed] [Google Scholar]
- Pisareva VP, Pisarev AV, Komar AA, Hellen CUT, and Pestova TV (2008). Translation initiation on mammalian mRNAs with structured 50UTRs requires DExH-box protein DHX29. Cell 135, 1237–1250. [DOI] [PMC free article] [PubMed] [Google Scholar]
- Pu J, Schindler C, Jia R, Jarnik M, Backlund P, and Bonifacino JS (2015). BORC, a multisubunit complex that regulates lysosome positioning.Dev. Cell 33, 176–188. [DOI] [PMC free article] [PubMed] [Google Scholar]
- Ramirez C, Hauser AD, Vucic EA, and Bar-Sagi D. (2019). Plasma membrane V-ATPase controls oncogenic RAS-induced macropinocytosis. Nature 576, 477–481. [DOI] [PMC free article] [PubMed] [Google Scholar]
- Reya T, Duncan AW, Ailles L, Domen J, Scherer DC, Willert K, Hintz L, Nusse R, and Weissman IL (2003). A role for Wnt signalling in selfrenewal of haematopoietic stem cells. Nature 423, 409–414. [DOI] [PubMed] [Google Scholar]
- Salvatore C, Malinverno C, Neumann B, Tischer C, Palamidessi A, Frittoli E, Panagiotakopoulou M, Disanza A, Malet-Engra G, Nastaly P, et al. (2018). A RAB35-p85/PI3K axis controls oscillatory apical protrusions required for efficient chemotactic migration. Nat. Commun 9, 1475. [DOI] [PMC free article] [PubMed] [Google Scholar]
- Sato TK, Rehling P, Peterson MR, and Emr SD (2000). Class C Vps protein complex regulates vacuolar SNARE pairing and is required for vesicle docking/fusion. Mol. Cell 6, 661–671. [DOI] [PubMed] [Google Scholar]
- Schnatwinkel C, Christoforidis S, Lindsay MR, Uttenweiler-Joseph S, Wilm M, Parton RG, and Zerial M. (2004). The Rab5 effector Rabankyrin-5 regulates and coordinates different endocytic mechanisms. PLoS Biol 2, E261. [DOI] [PMC free article] [PubMed] [Google Scholar]
- Seals DF, Eitzen G, Margolis N, Wickner WT, and Price A. (2000). A Ypt/ Rab effector complex containing the Sec1 homolog Vps33p is required for homotypic vacuole fusion. Proc. Natl. Acad. Sci. USA 97, 9402–9407. [DOI] [PMC free article] [PubMed] [Google Scholar]
- Shalem O, Sanjana NE, Hartenian E, Shi X, Scott DA, Mikkelson TS, Heckl D, Ebert BL, Root DE, Doench JG, and Zhang F. (2014). Genome-scale CRISPR-Cas9 knockout screening in human cells. Science 343, 84–87. [DOI] [PMC free article] [PubMed] [Google Scholar]
- Siegel RL, Miller KD, and Jemal A. (2019). Cancer statistics, 2019. CA Cancer J. Clin 69, 7–34. [DOI] [PubMed] [Google Scholar]
- Sonnett M, Gupta M, Nguyen T, and Wuhr M. (2018). Quantitative proteomics for Xenopus Embryos II, data analysis. Methods Mol. Biol 1865, 195–215. [DOI] [PMC free article] [PubMed] [Google Scholar]
- Wang T, Lander ES, and Sabatini DM (2016a). Single guide RNA library design and construction. Cold Spring Harb. Protoc 2016, pdb.prot090803. [DOI] [PMC free article] [PubMed] [Google Scholar]
- Wang T, Lander ES, and Sabatini DM (2016b). Viral packaging and cell culture for CRISPR-based screens. Cold Spring Harb. Protoc 2016, pdb.prot090811. [DOI] [PMC free article] [PubMed] [Google Scholar]
- Wang T, Wei JJ, Sabatini DM, and Lander ES (2014). Genetic screens in human cells using the CRISPR-Cas9 system. Science 343, 80–84. [DOI] [PMC free article] [PubMed] [Google Scholar]
- Wek SA, Zhu S, and Wek RC (1995). The histidyl-tRNA synthetase-related sequence in the eIF-2 alpha protein kinase GCN2 interacts with tRNA and is required for activation in response to starvation for different amino acids. Mol. Cell. Biol 15, 4497–4506. [DOI] [PMC free article] [PubMed] [Google Scholar]
- Yao W, Rose JL, Wang W, Seth S, Jiang H, Taguchi A, Liu J, Yan L, Kapoor A, Hou P, et al. (2019). Syndecan 1 is a critical mediator of macropinocytosis in pancreatic cancer. Nature 568, 410–414. [DOI] [PMC free article] [PubMed] [Google Scholar]
- Ye J, Kumanova M, Hart LS, Sloane K, Zhang H, De Panis DN, Bobrovnikova-Marjon E, Diehl JA, Ron D, and Koumenis C. (2010). The GCN2-ATF4 pathway is critical for tumour cell survival and proliferation in response to nutrient deprivation. EMBO J 29, 2082–2096. [DOI] [PMC free article] [PubMed] [Google Scholar]
- Zhang P, Mcgrath BC, Reinert J, Olsen DS, Lei L, Gill S, Wek SA, Vattem KM, Wek RC, Kimball SR, et al. (2002). The eIF2alpha kinase is required for adaptation to amino acid deprivation in mice. Mol. Cell. Biol 22, 6681–6688. [DOI] [PMC free article] [PubMed] [Google Scholar]
Associated Data
This section collects any data citations, data availability statements, or supplementary materials included in this article.
Supplementary Materials
Data Availability Statement
Source data statement: Raw RNAseq and ribosome profiling data have been deposited in the Sequence Read Archive (SRA) and are publicly available as of the date of publication. key resources table Proteomics data has been deposited in the PRIDE Archive database and is publicly available as of the date of publication. Accession numbers are listed in the key resources table. All other data reported in this paper will be shared by the lead contact upon request.
Code statement: This paper does not report original code.
Any additional information required to reanalyze the data reported in this paper is available from the lead contact upon request.
KEY RESOURCES TABLE
| REAGENT or RESOURCE | SOURCE | IDENTIFIER |
|---|---|---|
|
| ||
| Antibodies | ||
|
| ||
| Rabbit monoclonal anti GCN2 | Cell Signaling Technology (CST) | Cat# 3302; RRID: AB_2277617 |
| Rabbit monoclonal anti Vasp | CST | Cat# 3132; RRID: AB_2213393 |
| Mouse monoclonal anti eIF2α | CST | Cat# 2103; RRID: AB_836874 |
| Rabbit monoclonal anti Phospho-eIF2α | CST | Cat# 3398; RRID: AB_2096481 |
| Rabbit monoclonal anti ATF-4 | CST | Cat# 11815; RRID: AB_2616025 |
| Goat polyclonal anti Mouse/Rat Cathepsin L | R&D Systems | Cat# AF1515; RRID: AB_2087690 |
| Rabbit monoclonal anti β-Actin (HRP Conjugate) | CST | Cat# 5125; RRID: AB_1903890 |
| Rabbit monoclonal anti Vinculin (HRP Conjugate) | CST | Cat# 18799; RRID: AB_2714181 |
| Goat monoclonal anti-rabbit IgG, HRP-linked | CST | Cat# 7074; RRID: AB_2099233 |
| Horse monoclonal anti-mouse IgG, HRP-linked | CST | Cat# 7076; RRID: AB_330924 |
|
| ||
| Chemicals, peptides, and recombinant proteins | ||
|
| ||
| DMEM high glucose, no pyruvate | GIBCO | 10–017 CV |
| Fetal bovine serum (FBS) | Sigma-Aldrich | Cat# F2442 |
| Dialyzed FBS | Sigma-Aldrich | Cat# F0392 |
| Phosphate buffered saline | Thermo Fisher Scientific (TFS) | Cat# SH3025601 |
| Trypsin-EDTA (0.05%) | TFS | Cat# 25300–054 |
| DMEM powder w/ low glucose, w/o Amino acids, pyruvate | US Biological | Cat# D9800–13 |
| Bovine Serum Albumin, lyophilized, BioReagent | Sigma-Aldrich | Cat# A9418 or A1470 |
| NotI-HF | New England Biolabs (NEB) | Cat# R3189 |
| XhoI | NEB | Cat# R0146 |
| T4 DNA Ligase | NEB | Cat# M0202 |
| NEB HiFi DNA Assembly Master Mix | NEB | Cat# E2621 |
| NEB 10-beta Competent E. coli (High Efficiency) | NEB | Cat# C3019 |
| Polybrene Infection / Transfection Reagent | EMD Millipore | Cat# TR-1003 |
| U-13C6, U-15N3 Histidine:HCl:H2O | Cambridge Isotopes Laboratories (CIL) | Cat# CNLM-758 |
| U-13C6, U-15N2 Lysine:2HCl | CIL | Cat# CNLM-291 |
| U-13C9, 15N Phenylalanine | CIL | Cat# CNLM-575 |
| U-13C4, 15N Threonine | CIL | Cat# CNLM-587 |
| U-13C5, 15N Valine | CIL | Cat# CNLM-442 |
| Ring-2,4–2H2, alpha,beta,beta-2H3 Histidine | CIL | Cat# DLM-7855 |
| 4,4,5,5–2H4 Lysine:2HCl | CIL | Cat# DLM-2640 |
| Ring-2H5 Phenylalanine | CIL | Cat# DLM-1258 |
| 4–13C, 2,3–2H2 Threonine | CIL | Cat# CDLM-9307 |
| U-2H8 Valine | CIL | Cat# DLM-488 |
| U-13C6, U-15N4 Arginine:HCl | CIL | Cat# CNLM-539 |
| Methionine, Cell Labeling Grade, L-[35S]-,>600 Ci (22.2 TBq) mmol, 50 mM Tricine, 10 mM BME, 5 mCi | PerkinElmer | Cat# NEG009L005MC |
| Lysyl Endopeptidase | FUJIFILM Wako Pure Chemical Corporation | Cat# 125–05061 |
| Sequencing Grade Trypsin | Promega | Cat# V5111 |
| TMT11–131C Label Reagent | TFS | Cat# A37724 |
| GCN2iB | MedChemExpress | Cat# HY-112654 |
| GDC0941 (PI3K inhibitor) | Cayman Chemical | Cat# 11600 |
| Cathepsin L inhibitor | Santa Cruz Biotechnology | Cat# sc-3132 |
| Hydroxychloroquine Sulfate | Tocris | Cat# 5648 |
|
| ||
| Critical commercial assays | ||
|
| ||
| QIAshredder | QIAGEN | Cat# 79654 |
| RNeasy Plus Mini Kit | QIAGEN | Cat# 74134 |
| PrepX RNA-Seq for Illumina Library Kit | Takara | Cat# 640096 |
| Pierce BCA Protein Assay Kit - Reducing | TFS | Cat# 23250 |
| Agent Compatible | ||
|
| ||
| Deposited data | ||
|
| ||
| Raw Sequencing Data | This paper | SRA: PRJNA757010 |
| Raw Proteomics Data | This paper | ProteomeXchange: PXD028143 |
|
| ||
| Experimental models: Cell lines | ||
|
| ||
| KRPC-A cells | (Nofal et al., 2017) | N/A |
| K-RasG12D MEFs | Craig Thompson, MSKCC | N/A |
|
| ||
| KRPC-A Gcn2 KO | This paper | N/A |
| KRPC-A Gcn2 KO + FLAG-EGFP | This paper | N/A |
| KRPC-A Gcn2 KO +hGCW2 | This paper | N/A |
| KRPC-A Vasp KO + FLAG-EGFP | This paper | N/A |
| KRPC-A Vasp KO +hVASP | This paper | N/A |
| KRPC-A Vps39 KO +FLAG-EGFP | This paper | N/A |
| KRPC-A Vps39 KO +FLAG-hVPS39 | This paper | N/A |
|
| ||
| Oligonucleotides | ||
|
| ||
| sgRNA PCR Forward Primer: AATGATACGGCGACCACCGAGATC TACACCGACTCGGTGCCACTTTT |
Integrated DNA Technologies (IDT) |
N/A |
| sgRNA PCR Reverse Primer: CAAGCA GAAGACGGCATACGAGATCnnnnnnTT TCTTGGGTAGTTTGCAGTTTT (“nnnnnn” denotes the sample barcode sequence) |
IDT | N/A |
| Custom HiSeq Read 1 primer: CGGT GCCACIIIIICAAGTTGATAACGG ACTAGCCTTATTTTAACTTGCTATTT CTAGCTCTAAAAC |
IDT | N/A |
| Custom HiSeq Indexing primer: TTTCA AGTTACGGTAAGCATATGATAGTCCA TTTTAAAACATAATTTTAAA |
IDT | N/A |
| sgEif2ak4_4 (forward): CACCgGGCTACCCACAGAGAAATGG |
IDT | N/A |
| sgEif2ak4_4 (reverse): AAACCCATTTCTCTGTGGGTAGCCc |
IDT | N/A |
| sgVasp_8 (forward): CACCgCTTGCGGCCAACAACTCGGA |
IDT | N/A |
| sgVasp_8 (reverse): AAACTCCGAGTTGTTGGCCGCAAGc |
IDT | N/A |
| sgVps39_1 (forward): CACCgGAACTGGACAGACATCCCAG |
IDT | N/A |
| sgVps39_1 (reverse): AAACCTGGGATGTCTGTCCAGTTCc |
IDT | N/A |
| Eif2ak4_ORF_PCR (forward): ATCTCGAGGCCACCATGGCTGGG GGCCGTGGGGC |
IDT | N/A |
| Eif2ak4_ORF_PCR (reverse): TATTA TTATGCGGCCGCTTAAAATAAGATT CTGTAGTAGTCATCTCTATAGCTG |
IDT | N/A |
| Vasp_ORF_PCR (forward): AT CTCGAGGCCACCATGAGCGA GACGGTCATCTGTTCCAGC |
IDT | N/A |
| Vasp_ORF_PCR (reverse):ATGCGGCCGC TTAGGGAGAACCCCGCTTCCTCAGC |
IDT | N/A |
| FLAG-Vps39_ORF_PCR (forward): GGTACGGGAATTCCTGCAGGC CTCGAGGCCACCATGGACTA CAAAGACGATGACGACAAGC ACGACGCTTTCGAGCCAG |
IDT | N/A |
| Vps39_ORF_PCR (reverse): GGGGGGGGCGGAATTTAC GTAGCGGCCGCTTAGTCAG CTGGGTTTACCTCTTTGG |
IDT | N/A |
|
| ||
| FLAG-EGFP_ORF_PCR (forward): A TCTCGAGGCCACCATGGACTAC AAAGACGATGACGACAAGGT GAGCAAGGGCGAGGAG |
IDT | N/A |
| EGFP_ORF_PCR (reverse):ATGC GGCCGCTTACTTGTACAGCT CGTCCATGCCGAG |
IDT | N/A |
|
| ||
| Recombinant DNA | ||
|
| ||
| lentiCRISPR v2 | (Shalem et al., 2014) | Addgene Plasmid #52961 |
| pMXs-3XFLAG-EGFP-OMP25 | (Chen et al., 2016) | Addgene #83354 |
| Human EIF2AK4 ORF plasmid | Origene | Cat# RC212459 |
| Human VASP ORF plasmid | Origene | Cat# RC203544L1 |
| Human VPS39 ORF plasmid | Origene | Cat# RC209854 |
| psPAX2 (lentiviral packaging plasmid) | Trono Lab Packaging and Envelope Plasmids | Addgene #12260 |
| pMD2.G (VSV-G expressing plasmid) | Trono Lab Packaging and Envelope Plasmids | Addgene #12259 |
| Gag/pol | (Reya et al., 2003) | Addgene #14887 |
| Mouse genome-wide sgRNA library | This paper | N/A |
| lentiCRISPR v2-sgEif2ak4_4 | This paper | N/A |
| lentiCRISPR v2-sgVasp_8 | This paper | N/A |
| lentiCRISPR v2-sgVps39_1 | This paper | N/A |
| pMXs-hEIF2AK4 | This paper | N/A |
| pMXs-hVASP | This paper | N/A |
| pMXs-FLAG-hVPS39 | This paper | N/A |
| pMXs-FLAG-EGFP | This paper | N/A |
|
| ||
| Other | ||
|
| ||
| HEK293FT cells | TFS | Cat# R70007 |