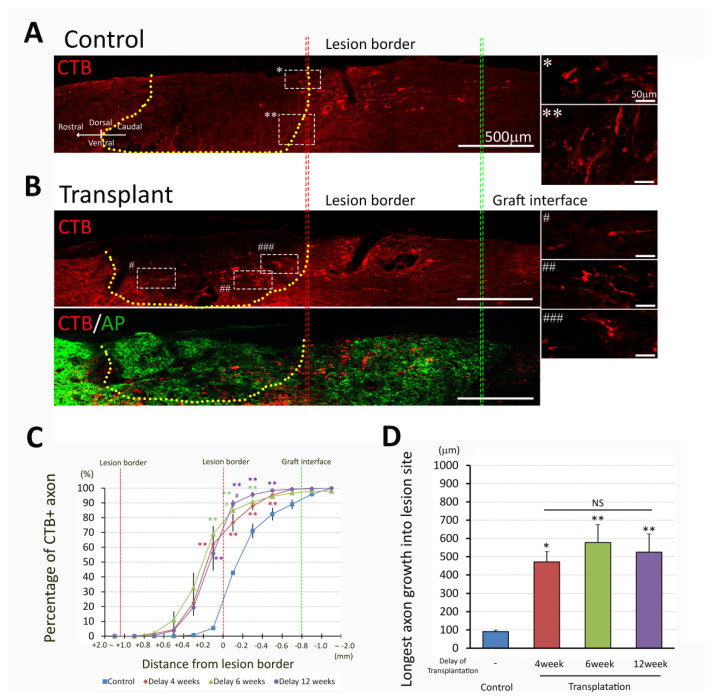
Figure 6.
Sensory axon regeneration after NPC transplantation. Most axons in control group (A) stopped (*) or changed direction (**) at the lesion boundary (insert with higher magnification), while CTB-labeled axons extended into the lesion site in transplanted group (B) at 5 weeks post transplantation with delay of 4 weeks (Signs #, ##, ### indicate the locations of white dish-line boxes in the left panel B which match the insert with a higher magnification in the right panel B). Double labeling of the CTB and AP markers indicates that there are CTB+ axons throughout the graft (B). Quantitative analysis of the distribution of CTB+ axons (C) and longest axon growth into the lesion/transplant site (D) were compared with 4 weeks delayed transplant and survival for 3- and 5-week post transplantation. Both transplanted groups showed a higher percentage of CTB+ axons 200 µm caudal to the lesion border as well as 200 µm and 400 µm within the lesion area (C, **, p < 0.005 compared to their respective controls). Furthermore at 200 µm within the lesion area, the 5 weeks delayed transplantation group demonstrated a significantly greater proportion of CTB+ axons than the 3 weeks delayed transplantation group (#, p < 0.05). Data are presented as mean ± SEM. Statistical significance was set at p < 0.05 (C; two-way ANOVA with Bonferroni post-hoc test, D; one-way ANOVA with post-hoc Bonferroni test). * p < 0.05; ** p < 0.005. NS: no significant difference compared to transplantation groups at 4, 6, and 12 weeks delayed after lesion. Lesion/transplant area is identified with a yellow dish-line.

