

Abstract
Background
Unconditional cash transfers (UCTs; provided without obligation) for reducing poverty and vulnerabilities (e.g. orphanhood, old age, or HIV infection) are a social protection intervention addressing a key social determinant of health (income) in low‐ and middle‐income countries (LMICs). The relative effectiveness of UCTs compared with conditional cash transfers (CCTs; provided only if recipients follow prescribed behaviours, e.g. use a health service or attend school) is unknown.
Objectives
To assess the effects of UCTs on health services use and health outcomes in children and adults in LMICs. Secondary objectives are to assess the effects of UCTs on social determinants of health and healthcare expenditure, and to compare the effects of UCTs versus CCTs.
Search methods
For this update, we searched 15 electronic academic databases, including CENTRAL, MEDLINE and EconLit, in September 2021. We also searched four electronic grey literature databases, websites of key organisations and reference lists of previous systematic reviews, key journals and included study records.
Selection criteria
We included both parallel‐group and cluster‐randomised controlled trials (C‐RCTs), quasi‐RCTs, cohort studies, controlled before‐and‐after studies (CBAs), and interrupted time series studies of UCT interventions in children (0 to 17 years) and adults (≥ 18 years) in LMICs. Comparison groups received either no UCT, a smaller UCT or a CCT. Our primary outcomes were any health services use or health outcome.
Data collection and analysis
Two review authors independently screened potentially relevant records for inclusion, extracted data and assessed the risk of bias. We obtained missing data from study authors if feasible. For C‐RCTs, we generally calculated risk ratios for dichotomous outcomes from crude frequency measures in approximately correct analyses. Meta‐analyses applied the inverse variance or Mantel‐Haenszel method using a random‐effects model. Where meta‐analysis was impossible, we synthesised results using vote counting based on effect direction. We assessed the certainty of the evidence using GRADE.
Main results
We included 34 studies (25 studies of 20 C‐RCTs, six CBAs, and three cohort studies) involving 1,140,385 participants (45,538 children, 1,094,847 adults) and 50,095 households in Africa, the Americas and South‐East Asia in our meta‐analyses and narrative syntheses. These analysed 29 independent data sets. The 24 UCTs identified, including one basic universal income intervention, were pilot or established government programmes or research experiments. The cash value was equivalent to 1.3% to 81.9% of the annualised gross domestic product per capita. All studies compared a UCT with no UCT; three studies also compared a UCT with a CCT. Most studies carried an overall high risk of bias (i.e. often selection or performance bias, or both). Most studies were funded by national governments or international organisations, or both.
Throughout the review, we use the words 'probably' to indicate moderate‐certainty evidence, 'may/maybe' for low‐certainty evidence, and 'uncertain' for very low‐certainty evidence.
Health services use
We assumed greater use of any health services to be beneficial. UCTs may not have impacted the likelihood of having used any health service in the previous 1 to 12 months, when participants were followed up between 12 and 24 months into the intervention (risk ratio (RR) 1.04, 95% confidence interval (CI) 1.00 to 1.09; I2 = 2%; 5 C‐RCTs, 4972 participants; low‐certainty evidence).
Health outcomes
At one to two years, UCTs probably led to a clinically meaningful, very large reduction in the likelihood of having had any illness in the previous two weeks to three months (RR 0.79, 95% CI 0.67 to 0.92; I2 = 53%; 6 C‐RCTs, 9367 participants; moderate‐certainty evidence). UCTs may have increased the likelihood of having been food secure over the previous month, at 13 to 36 months into the intervention (RR 1.25, 95% CI 1.09 to 1.45; I2 = 85%; 5 C‐RCTs, 2687 participants; low‐certainty evidence). UCTs may have increased participants' level of dietary diversity over the previous week, when assessed with the Household Dietary Diversity Score and followed up 24 months into the intervention (mean difference (MD) 0.59 food categories, 95% CI 0.18 to 1.01; I2 = 79%; 4 C‐RCTs, 9347 participants; low‐certainty evidence). Despite several studies providing relevant evidence, the effects of UCTs on the likelihood of being moderately stunted and on the level of depression remain uncertain. We found no study on the effect of UCTs on mortality risk.
Social determinants of health
UCTs probably led to a clinically meaningful, moderate increase in the likelihood of currently attending school, when assessed at 12 to 24 months into the intervention (RR 1.06, 95% CI 1.04 to 1.09; I2 = 0%; 8 C‐RCTs, 7136 participants; moderate‐certainty evidence). UCTs may have reduced the likelihood of households being extremely poor, at 12 to 36 months into the intervention (RR 0.92, 95% CI 0.87 to 0.97; I2 = 63%; 6 C‐RCTs, 3805 participants; low‐certainty evidence). The evidence was uncertain for whether UCTs impacted livestock ownership, participation in labour, and parenting quality.
Healthcare expenditure
Evidence from eight cluster‐RCTs on healthcare expenditure was too inconsistent to be combined in a meta‐analysis, but it suggested that UCTs may have increased the amount of money spent on health care at 7 to 36 months into the intervention (low‐certainty evidence).
Equity, harms and comparison with CCTs
The effects of UCTs on health equity (or unfair and remedial health inequalities) were very uncertain. We did not identify any harms from UCTs. Three cluster‐RCTs compared UCTs versus CCTs with regard to the likelihood of having used any health services or had any illness, or the level of dietary diversity, but evidence was limited to one study per outcome and was very uncertain for all three.
Authors' conclusions
This body of evidence suggests that unconditional cash transfers (UCTs) may not impact a summary measure of health service use in children and adults in LMICs. However, UCTs probably or may improve some health outcomes (i.e. the likelihood of having had any illness, the likelihood of having been food secure, and the level of dietary diversity), two social determinants of health (i.e. the likelihoods of attending school and being extremely poor), and healthcare expenditure. The evidence on the relative effectiveness of UCTs and CCTs remains very uncertain.
Keywords: Adult; Child; Humans; Developing Countries; Health Services; HIV Infections; HIV Infections/prevention & control; Outcome Assessment, Health Care; Poverty
Plain language summary
Does giving money to people, in low‐ and middle‐income countries, without conditions attached lead to better health and other life improvements?
Review question
In some low‐ and middle‐income countries (LMICs), governments and other organisations sometimes give money to poor or vulnerable people (for example, older people or orphans), without requiring them to do anything in particular to receive the money ('unconditional cash transfers'). In other programmes, people can only receive this money if they engage in required behaviours, such as using health services or sending their children to school ('conditional cash transfers'). This review aimed to find out whether receiving unconditional cash transfers would improve people's use of health services and their actual health, compared with not receiving an unconditional cash transfer, receiving a smaller unconditional amount or receiving a conditional cash transfer. It also aimed to assess the effects of unconditional cash transfers on daily living conditions that determine health and healthcare spending, such as attending school, owning livestock, having a job or being extremely poor.
Background
Unconditional cash transfers are a type of social protection intervention that addresses income. It is unknown whether unconditional cash transfers are more, less or equally effective as conditional transfers. We reviewed the evidence on the effect of unconditional cash transfers on health service use and health outcomes among children and adults in LMICs.
What did we find?
We included experimental and selected non‐experimental studies of unconditional cash transfers in people of all ages in LMICs. We included studies that compared people who received an unconditional cash transfer with those who did not receive a transfer. We looked for studies that examined health services use and health outcomes.
We found 34 studies (25 experimental and 9 non‐experimental ones) with 1,140,385 participants (45,538 children and 1,094,847 adults) and 50,095 households in Africa, the Americas and South‐East Asia. Governments or experimental researchers organised the unconditional cash transfer programmes. Most studies were funded by national governments or international organisations, or both.
Key results
We use the following terms to indicate our level of confidence in the evidence we found:
‐ 'probably' for evidence about which we are moderately confident; ‐ 'may' for evidence about which we have little confidence; and ‐ 'uncertain' for evidence about which we are not confident.
An unconditional cash transfer:
‐ may not have changed the likelihood of people having used any health service in the previous 1 to 12 months; ‐ probably led to a clinically meaningful, very large reduction in people's risk of having had any illness in the previous 2 weeks to 3 months; ‐ may have increased the likelihood of people having had secure access to food over the previous month; ‐ may have increased the average number of different food groups that people in the household consumed over the previous week; ‐ probably led to an important, moderate increase in the likelihood of children attending school; ‐ may have reduced people's risk of living in extreme poverty; ‐ may have increased the amount of money people spent on health care.
Despite several studies providing relevant evidence, the effects of unconditional cash transfers on the likelihood of children being stunted (having reduced growth and development) and on people's depression levels remain uncertain. No study estimated the effects of unconditional cash transfers on dying.
We are uncertain whether unconditional cash transfers impacted livestock ownership, participation in child labour, adult employment and parenting quality. The effects of unconditional transfers on differences in health were very uncertain. We did not identify any harms arising from unconditional cash transfers.
Three experimental studies reported evidence on the impact of an unconditional transfer compared with a conditional transfer on the likelihood of having used any health services, the likelihood of having had any illness or the average number of food groups consumed in the household. However, only one study provided evidence for each of these outcomes, and it was very uncertain for all three.
In general, where we had little or no confidence in the evidence, this was because people in the studies likely knew what 'treatment' they were getting (that is, a cash transfer or no cash transfer), and it was also likely that the researchers collecting information also knew which groups of people were recipients and which were not. Additionally, our confidence in the evidence was limited because in half of the studies, researchers were unable to collect follow‐up information from a considerable percentage of participants.
Conclusions
This body of evidence suggests that unconditional cash transfers may not impact health services use among children and adults in low‐ and middle‐income countries. Unconditional cash transfers probably or may improve:
‐ some health outcomes (such as the likelihood of having had any illness, the likelihood of having secure access to food, and diversity in one's diet);
‐ two social determinants of health (namely, the likelihood of attending school and living in extreme poverty);
‐ healthcare expenditure.
The evidence on the health effects of unconditional cash transfers compared with those of conditional transfers is uncertain.
How up to date is the evidence? Current to September 2021.
Summary of findings
Summary of findings 1. Summary of findings: unconditional cash transfer versus no unconditional cash transfer: primary outcomes.
| Unconditional cash transfer versus no unconditional cash transfer: primary outcomes | ||||||
|
Patient or population: children (0 to 17 years) and adults (≥ 18 years) or households Settings: low‐ and middle‐income countries Intervention: an unconditional cash transfer for reducing poverty or vulnerabilities, or both Comparison: no unconditional cash transfer | ||||||
| Outcome | Illustrative comparative risks* (95% CI) | Relative effect (95% CI) | Number of participants (number of studies) | Certainty of the evidence (GRADE) | Comments | |
| Risk with no unconditional cash transfer | Risk with an unconditional cash transfer | |||||
| Has used any health service in previous 1 to 12 months Follow‐up: 12 months to 24 months | 487 per 1000 | 506 per 1000 (487 to 531) | RR 1.04 (1.00 to 1.09) | 4972 participants (5 C‐RCTs) | ⊕⊕⊝⊝ Lowa,b |
Better indicated by a higher value. In conclusion, a UCT may not have an effect on this outcome. |
|
Is moderately stunted Assessed with: height‐for‐age z‐score ≤ −2 SD Follow‐up: 24 months |
337 per 1000 | 344 per 1000 (307 to 384) | RR 1.02 (0.91 to 1.14) | 3298 participants (3 C‐RCTs) | ⊕⊝⊝⊝ Very lowa,c | Better indicated by a lower value. A fourth C‐RCT reported a very large, clinically meaningful decrease in the risk of incident stunting (as measured through proxy of non‐recovery from severe acute malnutrition). A fifth C‐RCT reported an increase in the height‐for‐age score of an uncertain size. One further C‐RCT reported very uncertain evidence. In conclusion, we are very uncertain about the effect of a UCT on this outcome. |
| Has died | No evidence available on this outcome | |||||
| Has had any illness in previous 2 weeks to 3 months Follow‐up: 12 months to 24 months | 370 per 1000 | 292 per 1000 (248 to 340) | RR 0.79 (0.67 to 0.92) | 9367 participants (6 C‐RCTs) | ⊕⊕⊕⊝ Moderatea | Better indicated by a lower value. A seventh C‐RCT reported that a UCT probably reduced the risk of having had an acute respiratory disease, and an eighth C‐RCT reported that a UCT led to a large, clinically meaningful reduction in the risk of illness or injury in the household. In conclusion, a UCT probably had a large, clinically meaningful, beneficial effect on this outcome. |
| Has been food secure in previous month Follow‐up: range 13 months to 36 months | 710 per 1000 |
875 per 1000 (774 to 1030 |
RR 1.25 (1.09 to 1.45) | 2687 participants (5 C‐RCTs) | ⊕⊕⊝⊝ Lowa,d | Better indicated by a higher value. Three additional C‐RCTs studied the effect of a UCT on different measures (often a composite index of food security) or did not report an effect estimate accepted by Cochrane (or the data to calculate it). The two C‐RCTs with reportable estimates reported a reduction in food security. In conclusion, a UCT may perhaps have had a beneficial effect on this outcome. |
|
Level of dietary diversity in previous week
Assessed with: Household Dietary Diversity Score (or the number of food categories consumed) Follow‐up: 24 months |
The mean level of dietary diversity was 1.46 food categories consumed | The mean level of dietary diversity over the previous week in the intervention group was 0.59 food categories consumed higher (0.18 to 1.01 higher) |
— | 9347 households (4 C‐RCTs) | ⊕⊕⊝⊝ Lowa,d | Better indicated by a higher value. Using vote counting based on direction of effect, both additional C‐RCTs of individual study participants reported an increase in dietary diversity. Of the three additional C‐RCTs of households, two reported an increase and one reported a decrease in a single or composite measure of dietary diversity. In conclusion, a UCT may perhaps have had a beneficial effect on this outcome. |
|
Level of depression
Assessed with: Center for Epidemiologic Studies Depression (CES‐D) Score (0 to 60 points) or Geriatric Depression Score (GDS) Follow‐up: range 15 months to 47 months |
Not pooled | Not pooled | Not pooled | 9497 participants and 667 households (5 C‐RCTs) | ⊕⊝⊝⊝ Very lowa,c | Better indicated by a lower value. Using vote counting based on effect direction, three additional C‐RCTs of individual study participants reported a decrease in level of depression, one additional C‐RCT of households reported an increase in level of depression, and one further C‐RCT with an unclear population reported a decrease in level of depression, as measured using the CES‐D or GDS score. In conclusion, we are very uncertain about the effect of a UCT on this outcome. |
| *The basis for the assumed risk is the median control group risk across studies. The corresponding risk (and its 95% confidence interval) is based on the assumed risk in the comparison group and the relative effect of the intervention (and its 95% CI). CI: confidence interval; C‐RCT: cluster‐randomised controlled trial; OR: odds ratio; RR: risk ratio; SD: standard deviation; UCT: unconditional cash transfer | ||||||
| GRADE Working Group grades of evidence High certainty: further research is very unlikely to change our confidence in the estimate of effect. Moderate certainty: further research is likely to have an important impact on our confidence in the estimate of effect and may change the estimate. Low certainty: further research is very likely to have an important impact on our confidence in the estimate of effect and is likely to change the estimate. Very low certainty: we are very uncertain about the estimate. | ||||||
aSerious risk of bias indicated by no allocation concealment, no blinding, potential contamination, and/or confounding (minus one grade). bSerious imprecision indicated by the 95% confidence interval of the estimate or estimates ranging from no meaningful change to a meaningful benefit (minus one grade). cVery serious imprecision indicated by the 95% confidence estimate or estimates ranging from a meaningful benefit to a meaningful harm (minus two grades). dSerious inconsistency indicated by 60% > I² < 90% (minus one grade).
Summary of findings 2. Summary of findings: unconditional cash transfer versus no unconditional cash transfer: secondary outcomes.
| Unconditional cash transfer versus no unconditional cash transfer: secondary outcomes | ||||||
|
Patient or population: children (0 to 17 years) and adults (≥ 18 years) or households Settings: low‐ and middle‐income countries Intervention: an unconditional cash transfer for reducing poverty or vulnerabilities, or both Comparison: no unconditional cash transfer | ||||||
| Outcome | Illustrative comparative risks* (95% CI) | Relative effect (95% CI) | Number of participants (number of studies) | Certainty of the evidence (GRADE) | Comments | |
| Risk with no unconditional cash transfer | Risk with an unconditional cash transfer | |||||
| Social determinant of health | ||||||
| Owned livestock in previous year Follow‐up: 24 or 36 months | Not pooled | Not pooled | Not pooled | 7324 households (4 C‐RCTs) | ⊕⊝⊝⊝ Very lowa,b,c | Better indicated by a higher value. Because of the very high level of statistical heterogeneity, we do not report totals from the meta‐analysis. One C‐RCT reported a very large increase in the likelihood of owning a goat/sheep. The second C‐RCT reported no evidence for an effect of a UCT. Two further C‐RCTs provided very uncertain evidence. In conclusion, we are very uncertain about the effect of a UCT on this outcome. |
| Attends school Follow‐up: range 12 months to 36 months | 676 per 1000 | 716 per 1000 (703 to 736) | RR 1.0 6 (1.04 to 1.09) | 7136 participants (8 C‐RCTs) | ⊕⊕⊕⊝ Moderatea | Better indicated by a higher value. In conclusion, a UCT probably led to a moderate, clinically meaningful, beneficial effect on this outcome. |
| Engages in child labour Follow‐up: 24 or 36 months | 299 per 1000 | 272 per 1000 (239 to 307) | RR 0.9 1 (0.80 to 1.03) | 2448 participants (3 C‐RCTs) | ⊕⊝⊝⊝ Very lowa,d | Better indicated by a lower value. In conclusion, we are very uncertain about the effect of a UCT on this outcome. |
| Adult works Follow‐up: 24 or 36 months | 798 per 1000 | 798 per 1000 (758 to 838) | RR 1.00 (0.95 to 1.06) | 1700 participants (2 C‐RCTs) | ⊕⊝⊝⊝ Very lowa,d | Better indicated by no change or a higher value. In conclusion, we are very uncertain about the effect of a UCT on this outcome. |
| Parenting quality Assessed with: Home Observation Measurement of the Environment (HOME) Score Follow‐up: range 15 months to 27 months | The mean parenting quality was 2.40 HOME Scores | The mean parenting quality in the intervention group was 0.22 HOME Scores higher (0.60 lower to 1.01 higher) |
— | 1118 participants (1 C‐RCT) | ⊕⊝⊝⊝ Very lowa,c | Better indicated by a higher value. In conclusion, we are very uncertain about the effect of a UCT on this outcome. |
| Is extremely poor Follow‐up: 24 or 36 months | 812 per 1000 | 747 per 1000 (706 to 787) | RR 0.9 2 (0.87 to 0.97 ) | 3805 households (6 C‐RCTs) | ⊕⊕⊝⊝ Lowa,e | Better indicated by a lower value. In conclusion, a UCT may reduce the likelihood of living in extreme poverty. |
|
Amount of money spent on health care in last month Assessed with: various currencies Follow‐up: range 7 months to 36 months |
Not pooled | Not pooled | — | 9231 participants and 19,860 households (8 C‐RCTs) |
⊕⊕⊝⊝ Lowa,f | Better indicated by a higher value. Because of the very high level of heterogeneity, we did not combine the studies in a meta‐analysis. Using vote counting based on direction of effects, 6 C‐RCTs reported an increase in healthcare expenditure, and 2 C‐RCTs reported a decrease in this outcome. In conclusion, a UCT may increase the amount of money spent on health care. |
| *The basis for the assumed risk is the median control group risk across studies. The corresponding risk (and its 95% confidence interval) is based on the assumed risk in the comparison group and the relative effect of the intervention (and its 95% CI). CI: confidence interval; C‐RCT: cluster‐randomised controlled trial; RR: risk ratio; SD: standard deviation; UCT: unconditional cash transfer | ||||||
| GRADE Working Group grades of evidence High certainty: further research is very unlikely to change our confidence in the estimate of effect. Moderate certainty: further research is likely to have an important impact on our confidence in the estimate of effect and may change the estimate. Low certainty: further research is very likely to have an important impact on our confidence in the estimate of effect and is likely to change the estimate. Very low certainty: we are very uncertain about the estimate. | ||||||
aSerious risk of bias indicated by no allocation concealment, no blinding, potential contamination, and/or confounding (minus one grade). bVery serious inconsistency indicated by I² ≥ 90% (minus two grades). cSerious imprecision indicated by the 95% confidence interval of the estimate or estimates ranging from a meaningful harm to no meaningful change (minus one grade). dVery serious imprecision indicated by the 95% confidence estimate or estimates ranging from a meaningful benefit to a meaningful harm (minus two grades). eSerious inconsistency indicated by 60% > I² < 90% (minus one grade). fSerious inconsistency indicated by different measurements and estimates across studies.
Summary of findings 3. Summary of findings: unconditional cash transfers versus conditional cash transfers: primary outcomes.
| Unconditional cash transfers versus conditional cash transfers: primary outcomes | ||||||
|
Patient or population: children (0 to 17 years) and adults (≥ 18 years) or households Settings: low‐ and middle‐income countries Intervention: an unconditional cash transfer for reducing poverty or vulnerabilities, or both Comparison: a conditional cash transfer | ||||||
| Outcome |
Illustrative comparative risks* (95% CI) |
Relative effect (95% CI) | Number of participants (number of studies) | Certainty of the evidence (GRADE) | Comments | |
| Risk with a conditional cash transfer | Risk with an unconditional cash transfer | |||||
|
Has used any health service in previous 1 to 12 months Assessed with: number of routine preventive health services visits Follow‐up: 8 months after 24 months of the intervention |
The mean number of routine preventive health services visits was 1.02 | The mean number of routine preventive health services visits was 0.51 lower (0.83 to 0.19 lower) |
— | 2559 participants (1 C‐ RCT) | ⊕⊝⊝⊝ Very lowa,b | Better indicated by a higher value. In conclusion, we are very uncertain about the effect of a UCT on this outcome. |
| Is moderately stunted | No evidence available on this outcome | |||||
| Has died | No evidence available on this outcome | |||||
| Has had any illness in previous 2 weeks to 3 months Follow‐up: range 12 months to 24 months | 440 per 1000 | 488 per 1000 (418 to 550) | RR 1.11 (0.95 to 1.25) | 3896 participants (1 C‐ RCT) | ⊕⊝⊝⊝ Very lowa,c | Better indicated by a lower value. In conclusion, we are very uncertain about the effect of a UCT on this outcome. |
| Has been food secure | No evidence available on this outcome | |||||
|
Level of dietary diversity in previous week
Assessed with: number of times the participant ate protein‐rich food, last week Follow‐up: 12 months |
The mean level of dietary diversity was unclear | The mean number of times ate protein‐rich food in the intervention group was 0.06 lower (0.55 lower to 0.44 higher) |
— | 3896 participants (1 C‐ RCT) | ⊕⊝⊝⊝ Very lowa,c | Better indicated by a higher value. In conclusion, we are very uncertain about the effect of a UCT on this outcome. |
| Level of depression | No evidence available on this outcome | |||||
| *The basis for the assumed risk is the median control group risk across studies. The corresponding risk (and its 95% confidence interval) is based on the assumed risk in the comparison group and the relative effect of the intervention (and its 95% CI). CI: confidence interval; C‐ RCT: cluster‐ randomised controlled trial; RR: risk ratio; SD: standard deviation; UCT: unconditional cash transfer | ||||||
| GRADE Working Group grades of evidence High certainty: further research is very unlikely to change our confidence in the estimate of effect. Moderate certainty: further research is likely to have an important impact on our confidence in the estimate of effect and may change the estimate. Low certainty: further research is very likely to have an important impact on our confidence in the estimate of effect and is likely to change the estimate. Very low certainty: we are very uncertain about the estimate. | ||||||
aSerious risk of bias indicated by no allocation concealment, no blinding, potential contamination, and/or confounding (minus one grade). bVery serious indirectness (minus two grades). cVery serious imprecision indicated by the 95% confidence estimate or estimates ranging from a meaningful benefit to a meaningful harm (minus two grades).
Background
Description of the condition
This review focuses on the effect of unconditional cash transfers (UCTs), an increasingly prominent type of social protection intervention, on the use of health services and health outcomes in low‐ and middle‐income countries (LMICs). More specifically, we have reviewed UCTs that principally aim to reduce poverty, vulnerabilities or both. This includes universal basic income interventions, where every citizen receives an unconditional basic income (Painter 2016). For national governments, international organisations, nongovernmental organisations and civil society, both poverty and vulnerabilities in LMICs remain central concerns (Alvaredo 2013). We have already reviewed the evidence on the effect of once‐off or short‐term UCTs for assistance in humanitarian disasters (Pega 2015a), including those that aim to bring immediate relief before, during or in the aftermath of climatic disasters, such as storms, heat waves and droughts (Pega 2015b).
Poverty
Globally, in 2017, extreme poverty (defined as a daily income of US dollars (USD) 1.90 or less) affected 9.2% of the population, with an estimated 689 million people living in extreme poverty (World Bank 2020a). The proportion of the global population living in extreme poverty has steadily declined over the last 25 years, but has persisted at problematic levels in several LMICs (World Bank 2020a). Moreover, according to the World Bank, the decline in poverty in LMICs has recently reversed, driven by climate change, armed conflict and the global economic recession brought on by the COVID‐19 pandemic (World Bank 2020a). As part of the 2030 Agenda for Sustainable Development, the United Nations aim to achieve, as Goal 1, the end to "poverty in all its forms everywhere", by 2030 (UNGA 2015).
Poverty is an important social determinant of health (CSDH 2008; McDonough 2005). It is a direct cause of multiple adverse health outcomes (CSDH 2008; McDonough 2005). Poverty is also an indirect cause of poor health, by affecting environmental and other social determinants of health, such as access to clean air, drinking water and sanitation, as well as education, labour force participation and housing (CSDH 2008; McDonough 2005).
Vulnerabilities
Vulnerabilities commonly tackled by UCTs include being an orphan, being an older person, living with a disability or being affected by HIV (Arnold 2011; Garcia 2012). Over 100 million children in LMICs have lost one or both of their parents to conflict, HIV or other causes (Stover 2007). Many live in poverty or have other vulnerabilities, such as having to work to secure sufficient income (Stover 2007). The number of older people in LMICs has steadily increased, driven by lower fertility rates and increased life expectancy. Old age is associated with multiple vulnerabilities (including poverty and disability), especially in LMICs that do not have universal old age pensions. Living with HIV (or in a family affected by HIV) is also associated with multiple vulnerabilities, including stigma, unemployment and poverty. These diverse and interconnected circumstances are central social determinants of health in LMICs (CSDH 2008).
Description of the intervention
Social protection
Social protection is defined as "protecting individuals and households during periods when they cannot engage in gainful employment or obtain enough income to secure their livelihoods – due to unemployment, sickness, chronic ill health or disability, old age or care responsibilities" (UNRISD 2010, p 16). In what has been called the "quiet revolution", social protection policies have increasingly gained prominence on development agendas around the world (Barrientos 2008, p 4). These policies comprise three types of interventions; namely, labour market, social insurance and social assistance interventions (Arnold 2011). Social assistance interventions are "noncontributory transfer programs targeted in some manner to the poor and those vulnerable to poverty and shocks" to ensure an adequate standard of living (Grosh 2008, p 4). Types of social assistance interventions include cash transfers, in‐kind transfers, fee waivers, subsidies and public works programmes, amongst others.
The World Health Organization (WHO) Commission on Social Determinants of Health, together with other experts, have recommended specific policies promoting social protection over the life course to policymakers as effective interventions for addressing the social determinants of health (e.g. poverty and vulnerabilities) and improving individual and population health and health equity in LMICs (CSDH 2008; Marmot 2010; Marmot 2012; WHO 2011). The Commission advised "[g]overnments, where necessary with help from donors and civil society organizations, and where appropriate in collaboration with employers, [to] build universal social protection systems and increase their generosity towards a level that is sufficient for healthy living" (CSDH 2008, p 87). Development banks, such as the World Bank, have also expressed the opinion that "social protection programs can have a direct positive impact on poor families as they help build human capital and productivity as a result of better health, more schooling, and greater skills" (World Bank 2012). In the Sustainable Development Agenda 2030, the United Nations' international development framework for 2015 to 2030, the 193 member states of the United Nations pledged under target 1.3 to "implement nationally appropriate social protection systems and measures for all, including floors, and by 2030 achieve substantial coverage of the poor and the vulnerable" (UNGA 2015, p 17), adding further health sector interest in cash transfers and their effects on health.
Cash transfers for reducing poverty or vulnerabilities
Cash transfers are cash payments provided by formal institutions (governmental, international or nongovernmental organisations) to selected recipients, generally for meeting their minimum consumption needs (Garcia 2012). They first gained popularity during the 1990s as interventions used by several Latin American countries to counter the negative effects of the 1980s debt crises (Arnold 2011; Garcia 2012). However, they have proliferated in many LMICs around the world, especially since the early 2000s (Arnold 2011; Garcia 2012). Today, cash transfers are common in middle‐income countries and in the WHO regions of the Americas (especially Latin America) and South‐East Asia, but they have only more recently been introduced in low‐income countries and in the WHO African, European, Eastern Mediterranean and Western Pacific regions (Garcia 2012). The primary funding agencies and administrators of cash transfers are national governments, international organisations (often development banks) and donors, as well as nongovernmental organisations (especially in Africa) (Garcia 2012). Between 2007 and 2010, development assistance spending on cash transfers more than sextupled (from USD 23 million to USD 150 million), mostly driven by increases in dedicated donor funding (Global Humanitarian Assistance 2012). An estimated total of 800 million to 1 billion (1000 million) people in LMICs received a cash transfer in 2011 (Arnold 2011).
The basic economic rationale for ongoing, regular cash transfers is that they provide a minimum income over an extended period of time. Such cash transfers aim to reduce poverty or vulnerabilities and promote wealth creation by enabling recipients to build human capital (including better health), accruing savings to purchase productive assets and obtaining access to loans with better conditions (Arnold 2011). Moreover, the additional income from cash transfers also prevents recipients from adverse personal or systemic income shocks and protects their standard of living by enabling them to maintain their spending on essential goods (e.g. food and medicines) and services (e.g. health services) during financially lean times, without needing to sell their assets or accrue debt (Arnold 2011). Furthermore, by providing additional income to poor or otherwise vulnerable people, cash transfers may also change opinions, attitudes and relationships among citizens and between them and their government (Arnold 2011). For example, a cash transfer may increase the economic standing (and hence, social status and inclusion) of the recipient group and may influence citizens' electoral support for the government, depending on such factors as the transfer's social acceptability and perceived fairness (Garcia 2012). Moreover, cash transfers may reduce poverty and vulnerabilities more effectively and cost‐effectively than other public sector investments (Fiszbein 2009). Compared with in‐kind transfers, cash transfers maximise utility by giving recipients greater flexibility to satisfy their specific needs rather than predetermining a commodity (Fiszbein 2009); they avert the high costs of storing and transporting goods (Lagarde 2009); and they are less prone to leakage through corruption (Lagarde 2009).
Cash transfer interventions have diverse objectives, designs and methods of implementation. However, they can be classified into two broad types based on their regularity and length. The first type, which this review focuses on, are regular transfers over extended periods of time to sustainably reduce income poverty and vulnerabilities (Arnold 2011; Garcia 2012). Most of these transfers primarily aim to reduce income poverty by addressing transitory poverty over the short term and, in turn, chronic and intergenerational poverty over the long term (Arnold 2011; Garcia 2012). Some cash transfers primarily (or as a second objective alongside poverty reduction) aim to reduce vulnerabilities in target populations (Arnold 2011; Garcia 2012). The second general type of cash transfer, which is outside the scope of this review, are once‐off, short‐term payments, provided after natural or humanitarian disasters, for immediate financial relief or to incentivise desirable actions, such as repatriation of refugees or reintegration of former soldiers after an armed conflict (Arnold 2011; Garcia 2012; Global Humanitarian Assistance 2012). We have already systematically reviewed the effect of UCTs for assistance in humanitarian disasters on the use of health services and health outcomes in children and adults in LMICs (Pega 2015a).
Unconditional cash transfers for reducing poverty or vulnerabilities
Cash transfers for reducing poverty or vulnerabilities can also be differentiated by their degree of conditionality into UCTs and conditional cash transfers (CCTs). UCTs have no conditions beyond a broadly‐defined eligibility category that defines a segment of the population, such as poor people or orphans, as eligible (Garcia 2012). They therefore include universal basic income interventions, which seek to provide a basic income universally to everybody without any targeting (Painter 2016). In contrast, CCTs are provided on the condition that recipients engage in prescribed behaviours (sometimes called co‐responsibilities), such as using certain health services or attending school (Garcia 2012). Most UCTs define eligibility criteria, but UCTs have no conditions or co‐responsibilities attached to their receipt (Garcia 2012).
'Fuzzy' cash transfers do not neatly fit into the traditional classification of UCTs versus CCTs (Baird 2013). For example, some cash transfers are designed to be conditional in theory, but because non‐compliance is not monitored, enforced or penalised, they are unconditional in practice. This review focuses on all cash transfers for reducing poverty or vulnerabilities that are de facto unconditional; that is, both genuine UCTs and fuzzy cash transfers that are essentially unconditional.
The underlying theory for the use of UCTs understands people living in poverty as rational actors, and assumes that providing them with additional income will result in them engaging in desired behaviours, through which they will eventually graduate from poverty and overcome their vulnerabilities (Arnold 2011). This theory expects UCTs to generate similar, beneficial behaviour change to CCTs, because recipients are motivated, empowered and able to engage in the behaviours that CCTs require. UCTs could also generate greater behaviour change, because they are more socially acceptable and less stigmatising for their recipients than CCTs. In contrast, the alternative theory underpinning the application of CCTs argues that "poor households lack full information on the long‐term benefits of preventive health care and education", and that conditions are required to ensure that the cash transfer generates the desired behaviours among its recipients (Arnold 2011, p 49). This theory expects CCTs to generate greater behaviour change than UCTs, because CCTs incentivise desired behaviours not only through income effects, but also through (imposed) substitution effects (Fiszbein 2009; Garcia 2012). It is sometimes also argued that conditioning cash transfers may increase their political feasibility (Garcia 2012).
Some experts have made the case for using cash transfers as policy tools specifically for addressing key social determinants of health (poverty and vulnerabilities) to improve the health of socioeconomically‐disadvantaged populations and, in turn, health and health equity in the population in LMICs (Forde 2012). However, the extent to which UCTs for reducing poverty and vulnerabilities also improve the use of health services and ultimately, health outcomes, is unknown.
Furthermore, the relative effectiveness and cost‐effectiveness of UCTs versus CCTs for improving the use of health services and health outcomes in LMICs is unclear (Baird 2012; Gaarder 2012; Robertson 2013). Some authors have hypothesised that UCTs, under certain conditions, are more effective (Schubert 2006). The reasons are that conditioning a cash transfer results in additional direct, indirect and opportunity costs to the recipients from having to comply with the conditions, as well as additional costs to the administrator for monitoring recipients' compliance with the conditions. Costs to recipients are often higher in people with a lower socioeconomic position, with a potential perverse effect on health equity. Furthermore, conditioning a cash transfer on the use of health services will not confer any health benefits if health services are inaccessible or of insufficient quality. In addition, if use of health services increases due to a conditional cash transfer (CCT) without adjustment on the supply side, overall quality of care may suffer. Moreover, attaching conditions to a cash transfer could increase the social stigma attached to the transfer, which could reduce its positive health effects.
On the other hand, implementing UCTs may be less politically feasible, especially in middle‐income countries, because of the perception that UCTs are merely a cash giveaway to the poor and vulnerable. For example, in the Philippines, policymakers decided to condition a cash transfer after deliberately considering the transfer's political feasibility (Friedman 2014). There could also be savings from not paying people eligible for a CCT who do not comply with the required conditions, and if these savings more than compensate for the CCT's additional administrative costs, then this would make the CCT more cost‐effective than an equivalent UCT programme (Baird 2011). Therefore, if UCTs are equally effective as CCTs, they may be the preferred option in LMICs (as long as their implementation is politically feasible). The reasons are that CCTs additionally require an adequate supply of services to meet the transfer conditions, potentially carrying higher costs for both the recipients and the administrator; they also require adequate compliance monitoring systems.
How the intervention might work
Figure 1 presents a conceptual model of the causal relationship between an unconditional cash transfer (UCT) and a health outcome. The primary causal pathway through which UCTs impact health is through income. There is some evidence suggesting that cash transfer programmes reduce the depth or severity of income poverty in children and adults in LMICs (Arnold 2011; Barrientos 2006). This reduced risk of income poverty in the recipient household may improve health outcomes all by itself. More specifically, income from publicly‐funded cash transfers may impact health at the individual level through five types of causal effects (Borjas 2013; Lundberg 2010; Pega 2012; Pega 2013; Pega 2015a).
1.
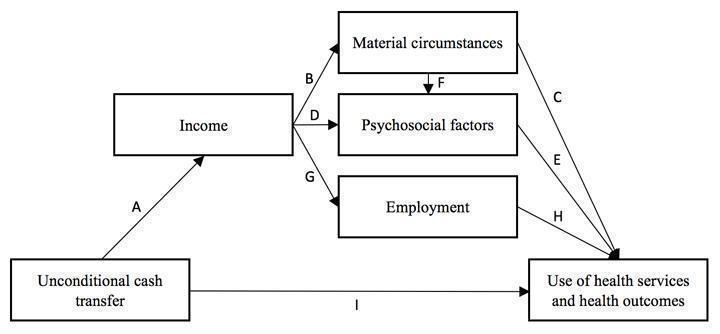
Conceptual framework of the causal relationship between an unconditional cash transfer for reducing poverty and vulnerabilities and the use of health services and health outcomes
Direct consumption effects (pathway A‐B‐C in Figure 1).
Direct status effects (pathway A‐D‐E).
Combined consumption and status effects (pathway A‐B‐F‐E).
Employment effects (pathway A‐G‐H).
Reduced financial risk (arrow I).
In direct consumption effects, income influences material conditions, which determine health through physical mechanisms (Lundberg 2010). For example, if recipients of a UCT used the additional income from the transfer to purchase goods and services that benefit their health, such as health services or nutritious food, then the UCT would be expected to improve health outcomes in the recipients. However, if recipients used the income from a UCT to purchase goods and services that damage their health, such as tobacco or alcohol, then the UCT would be expected to negatively affect health outcomes. Another consumption effect would be differential investment behaviour on the part of the household and greater diversification of economic activities into those carrying a higher risk but also higher expected returns, which may influence health outcomes.
With direct status effects, the additional income from a UCT impacts the health of recipients through psychosocial mechanisms associated with the recipients changing their relative income position (Lundberg 2010). For example, the additional income from a UCT could increase a recipient's income position (relative to relevant individuals or comparison groups), enhancing their social status, reducing psychosocial stress and, ultimately, improving physical and mental health outcomes.
Combined consumption and status effects impact health through both physical and psychological mechanisms, namely, material conditions and, in turn, social inclusion (Lundberg 2010). For example, if recipients used the additional income from a UCT to purchase goods and services that enhanced their inclusion in a social group (e.g. club membership), then this may positively impact their health. The level to which this social group promotes health is expected to mediate the level to which the additional income from the UCT increases health. So, social inclusion in groups promoting healthy behaviours (e.g. exercising and eating nutritious food) can have more positive health effects than social inclusion in groups promoting unhealthy behaviours (e.g. tobacco and alcohol use).
Employment effects impact health by enabling people to change or reduce hours of employment (Borjas 2013). For example, assuming that leisure time is a normal good, additional income from a UCT would be expected to reduce the number of hours the recipient works, which, in turn, may impact health outcomes. The level to which the UCT would be expected to increase health would depend on the level to which a reduction in employment changed health, which likely depends on such factors as the status and condition of the employment (Benach 2010a; Benach 2010b). For example, a UCT might increase health more in recipients who reduced their working hours in a job with negative or hazardous working conditions (e.g. through exposure to hazardous substances) than in employment with positive and health‐promoting working conditions (e.g. through increasing the recipients' sense of self‐efficacy and self‐worth).
Finally, UCTs may also directly affect health through welfare security from reduced financial risk (Pega 2012; Sjöberg 2010). Welfare security is a sense of psychological security from knowing that specific (or combinations of) cash transfers ensure income supplementation in times of financial hardship (Pega 2012; Sjöberg 2010). A recent study demonstrated that high‐income countries with cash transfers for the unemployed had higher levels of employment‐related welfare security and subjective well‐being than high‐income countries without such transfers (Sjöberg 2010).
The theory of a minimum income for healthy living hypothesises that income over a certain threshold is a prerequisite for good health (Morris 2000; Morris 2007). While minimum income thresholds have been calculated for selected populations in some high‐income countries, they have not yet been established for LMICs (Gorman 2007). A UCT would be expected to have a more beneficial health effect in recipients whose income it lifts above the minimum threshold than in recipients whose income remains below it, despite the transfer.
Why it is important to do this review
This is an update of our Cochrane Review published in 2017 on the effect of UCTs on health services use and health outcomes (Pega 2017). This review differs from previous reviews in that it specifically investigates the impact of UCTs ‐ whose primary aim is to reduce poverty and vulnerability ‐ on the use of health services and health outcomes in LMICs. It also synthesises existing evidence on the relative effectiveness of UCTs compared with CCTs for improving the use of health services and health outcomes in LMICs. Readers interested in the health‐ and healthcare‐related effects of UCTs in the context of humanitarian assistance are referred to the parallel Cochrane Review on the topic (Pega 2015a); a similar systematic review has also since been published (Doocy 2016). The systematic review evidence presented in this review is particularly important, considering the relatively low costs and administrative ease of implementing UCTs, compared with, for example, CCTs and in‐kind transfers.
Previous systematic reviews have synthesised evidence on the effects of CCTs for use of health services and health outcomes in LMICs (Gaarder 2010; Lagarde 2009; Owusu‐Addo 2014), and of in‐work tax credits (CCTs provisional on uptake or retention of employment) for health status improvements in adults (Pega 2013), and among children and adults (single parents) (Gibson 2018). However, these five reviews did not include UCTs.
The following 16 reviews have assessed a combination of various financial credit interventions, including potentially UCTs, for health improvements.
Boccia 2012 reviewed the effect of UCTs, CCTs and micro finance interventions on risk factors for tuberculosis.
Bassani 2013 reviewed the effect of UCTs, CCTs, voucher programmes and removal of user fees on the use of health services and health outcomes in children.
Manley 2013 reviewed the effect of UCTs, CCTs and public works programmes on nutrition.
Adato 2009, Heise 2013 and Pettifor 2012 evaluated the effects of UCTs and CCTs on the incidence of HIV in LMICs.
Ekezie 2017 reviewed evidence from RCTs on the effect of UCTs and CCTs on health outcomes among children and mothers in sub‐Saharan Africa.
Richterman 2018 synthesised evidence on the effect of UCTs and CCTs on clinical outcomes from tuberculosis.
Siddiqi 2018 reviewed the effect of UCTs and CCTs on health outcomes among children aged 0 to 12 months.
Owusu‐Addo 2019 synthesised the evidence on the effect of UCTs and CCTs on the social determinants of health and health inequalities in Sub‐Saharan Africa.
Leite 2019 reviewed the effect of UCTs and CCTs on intimate partner violence among women.
Cooper 2020 reviewed the differential effects by socioeconomic characteristics of UCTs and CCTs on health outcomes in LMICs.
Manley 2020 reviewed the effect of UCTs and CCTs on nutritional outcomes.
Durão 2020 reviewed the effect of UCTs, CCTs and other financial interventions on stunting, dietary diversity, and food security in LMICS. This Cochrane Review includes evidence syntheses on the effect of any type of UCT on some of the outcomes included in our original Cochrane Reviews on UCTs for assistance in humanitarian disasters (Pega 2015a), and for reducing poverty or vulnerabilities (Pega 2017; this current review updated version), but it also captures other financial interventions.
Awojobi 2020 reviewed evidence on the effect of UCTs and CCTs on maternal health outcomes in Africa and Latin America.
McGuire 2022 and Zimmerman 2021 synthesised evidence on the effect of UCTs and CCTs on mental health outcomes in LMICs among any population and children and young people, respectively.
Finally, at least three non‐systematic reviews have assessed the effect of UCTs and CCTs on the use of several health services and health outcomes (Arnold 2011; De Walque 2017; Sridhar 2006). UCTs, CCTs and other financial interventions may differ in their effect on health in LMICs (Baird 2012; Robertson 2013); therefore, the evidence should be reviewed separately for each of these types of interventions.
National governments, international organisations, nongovernmental organisations and civil society across sectors require systematic review evidence on the effectiveness of different types of cash transfers in improving the use of health services and health outcomes in LMICs. This information will enable them to prioritise, plan, cost and implement the most suitable and effective cash transfer type or types. This updated review provides such systematic review evidence for UCTs. It also provides evidence on the relative effectiveness of UCTs compared with CCTs.
Objectives
To assess the effects of UCTs on health services use and health outcomes in children and adults in LMICs. Secondary objectives are to assess the effects of UCTs on social determinants of health and healthcare expenditure, and to compare the effects of UCTs versus CCTs.
Methods
Criteria for considering studies for this review
Types of studies
Before we commenced the original review (Pega 2017), and this subsequent update, we developed a detailed protocol that laid out our eligibility criteria and methods (Pega 2014). In terms of experimental and quasi‐experimental studies, this review included parallel‐group and cluster‐randomised controlled trials (RCTs and C‐RCTs, respectively). Quasi‐RCTs (allocating participants, for example, by means of alternation or date of birth) were also eligible, but we did not identify any. In terms of observational studies, we included controlled before‐and‐after studies (CBAs) and cohort studies. We would also have included interrupted time series studies but did not find any that met the inclusion criteria. We included only CBAs that met the minimum methodological criteria defined in the Cochrane Effective Practice and Organisation of Care (EPOC) Group guidelines (Cochrane EPOC 2012): two or more sites in each intervention arm; intervention and control group were collected contemporaneously; and intervention and control sites were comparable (for example, we would have excluded studies that compared two urban with two rural sites). We included only cohort studies that at a minimum: had three or more repeated measurements and controlled (or attempted control) for either or both confounders (for example, through standardisation, stratification or matching) and reverse causation (for example, through instrumental variables (Greenland 2000) or marginal structural modelling (Pega 2016a)). We included instrumental variable analytic studies that used instruments for a UCT to estimate the effect of the UCT on health, but excluded instrumental variable analytic studies that used a UCT as an instrument to estimate the effect of income on health (Pega 2016b).
To assess the effectiveness of UCTs (primary review objective), we included studies with two types of comparators. First, we included studies comparing a group receiving a UCT with a group not receiving the UCT. Second, we included studies comparing a group receiving a UCT with a group receiving a considerably smaller income amount from the UCT. If a study compared a UCT with both comparator types, then we prioritised comparisons with the group that received no UCT over those receiving a smaller amount of the UCT. The comparison with no intervention is more consistent with the objectives of the review to evaluate intervention effectiveness, because receipt of any UCT may be more important for health effects than the amount of a UCT received (Baird 2011; Filmer 2011). Only one study compared a UCT to a less generous UCT (Haushofer 2013), but this study also compared the same UCT to no UCT, so we prioritised the latter comparison.
To assess the relative effectiveness of UCTs versus CCTs (secondary review objective), we also included studies comparing a group receiving a UCT with a group receiving a CCT in a comparable context and setting.
Types of participants
This review included both children (0 to 17 years) and adults (18 years or older) residing in LMICs, as defined by the World Bank (World Bank 2020b).
Types of interventions
This review included UCTs for reducing poverty or vulnerabilities, featuring these characteristics:
an in‐hand cash payment (possibly disbursed directly into a bank account, paid directly onto a mobile phone or provided in the form of a value card);
unconditional (i.e. the cash transfer may have certain eligibility criteria but does not have any de facto conditions attached to its receipt);
noncontributory (i.e. the cash transfer is not a payment from a social insurance system that recipients have previously contributed to);
provided by a formal institution (national governmental, international or nongovernmental organisation) or as part of a scientific study;
provided with the goal of reducing poverty or vulnerability (e.g. orphanhood, old age or HIV infection);
disbursed to an individual or household (i.e. communities do not receive the cash transfers); and
provided regularly (i.e. twice or more over a one‐year period) and over extended periods of time (i.e. eligible families in theory continue receiving the cash transfer over time until they become ineligible).
We included UCTs disbursed exclusively to women and those disbursed to all genders. We included fuzzy cash transfers as long as they were de facto unconditional (Baird 2013). For the included fuzzy cash transfers, we described the contexts that produced essentially no conditions, such as lack of monitoring, enforcement or penalisation of theoretical conditions. We excluded cash transfers designed to be unconditional but with de facto conditions attached to them due to contexts, such as clear messaging that implied conditions or administrative linking of enrolment in the cash transfer to certain conditions. We also excluded UCTs for assistance in humanitarian disasters (covered in Pega 2015a), because they address different causal pathways and therefore may have a different effect on use of health services and health outcomes. If we excluded a study due to the intervention being a CCT, a fuzzy cash transfer with de facto conditions, or a UCT for assistance in humanitarian disasters, then we noted this as a reason in the Characteristics of excluded studies table.
We included UCTs that were standalone interventions or had minor co‐interventions, but we excluded UCTs provided in combination with or alongside major co‐interventions. We judged a co‐intervention as minor if we considered it to be very unlikely that the intervention could have a noteworthy impact on the outcome or outcomes included in this review, based on the best available evidence we retrieved on this co‐intervention. For example, we would classify a short health educational intervention (e.g. one nutrition class) as minor, whereas a sustained, long‐term nutritional education programme (e.g. eight weekly nutrition classes delivered over a period of two months) would be classified as major.
In this review, we report the amount of income from the UCT in US dollars (USD). If the study record provided a UCT in a currency other than USD, we converted it to USD. To improve comparability in actual purchasing power across UCT amounts reported in this review, we adjusted for purchasing power parity, applying the methods recommended in Chapter 15.1 of the Cochrane Handbook for Systematic Reviews of Interventions (Shemilt 2011; hereafter referred to as the Cochrane Handbook). In line with economic theory, these adjustments approximate the total adjustment made on the currency exchange rate between countries that is required to allow the converted amount to have equal purchasing power in the currency across countries. Throughout the review, when we refer to amounts of UCT in USD, then these amounts were either provided as USD or provided in another currency but converted and adjusted for purchasing power parity.
Types of outcome measures
We chose outcomes to ensure comparability with the Lagarde 2009 review of the impact of CCTs on the use of health services and health outcomes in LMICs. Reporting at least one of our primary outcomes was an eligibility criterion. We excluded studies that only reported secondary outcomes. If a study reported measures for several included outcomes, then we included one measure for each of the reported outcomes in the review. If a study reported multiple measures for the same outcome, then we prioritised the most important measure, taking into consideration the need for consistency in measures across included studies. We prioritised measures that are more clinically important, such as the prevalence of a disease compared to the risk factors or behaviours for the disease. We prioritised measures that applied standard cut‐offs to determine clinically relevant outcomes (e.g. moderate stunting, defined as a height for age of up to 2 standard deviations below the median (WHO 2016)) over measures of the variable from which the measure was derived (e.g. height for age), because the former are more informative for decision‐making. Moreover, for complex measurement concepts (e.g. dietary diversity), we prioritised established, standard composite measures (e.g. the Household Dietary Diversity Score, or HDDS (Kennedy 2011)) over measures of components of the composite index (e.g. 'has eaten fruit'), and we prioritised these component measures over others that are less directly related to the prioritised standard composite measure (e.g. 'level of protein intake'). We included studies reporting outcomes for any time period. If a study reported multiple follow‐up periods, then we prioritised the longest follow‐up during the intervention. For example, if a study reported treatment effect estimates at 12 months and 24 months into the intervention (during) and at 8 months after a 24‐month intervention, then we prioritised the follow‐up at 24 months.
Primary outcomes
Eligible primary outcomes of the review were as follows.
-
Use of health services, including but not limited to:
registered birth;
growth checks;
up to date on vaccination calendar;
treatment for parasites; and
use of any health service (prioritised outcome).
-
Health outcomes, including but not limited to:
stunting (prioritised outcome);
underweight;
death (prioritised outcome);
disease or illness (prioritised outcome);
food security (prioritised outcome);
dietary diversity (prioritised outcome); and
depression (prioritised outcome).
Regarding the use of health services, we assumed that greater use of the included health services, which are primarily preventive ones, presents a benefit, but note that it could represent a negative outcome if understood as an indicator of illness (e.g. hospitalisation). The review included objective and subjective measures of the use of any health service. These measures were either administrative records or survey data of the use of health facilities or services, such as the number of routine preventive health clinic visits and the proportion of participants who were fully immunised or received parasite treatment. In this review, we considered neither the distance travelled, nor the travel time required to access the facilities or services, nor the appropriateness of these services.
For health outcomes, we included both subjective measures as rated by a clinician, participant or caregiver (e.g. self‐report of disease prevalence) and objective measures (e.g. clinical test for a specific disease). In the outcome domain of nutrition, for example, we prioritised standard composite indices of dietary diversity, such as the HDDS (i.e. total number of food groups consumed) (Kennedy 2011), over measures of consumption of macronutrients (e.g. 'ate protein'), and we prioritised the latter over micronutrients (e.g. intake of vitamins). We also included any potential harms that we identified, such as negative impacts on the listed primary or secondary outcomes (e.g. a UCT could increase the recipient's use of motorised transport, and this could lead to increased risk of death from a road traffic accident). We would have included mortality, but we found no study reporting on this outcome.
Measures of impact on equity in primary outcomes
To measure the effect of a UCT on equity in a primary outcome, we included and prioritised direct measures of absolute or relative inequality in the primary outcome, but did not find any such prioritised measures in studies included in this review. We also included treatment effect estimates for two or more subgroups defined by population characteristics along PROGRESS‐Plus categories (Cochrane Methods Equity Group 2022, i.e. age, education, ethnicity, gender, gender identity, geographic residency, labour force participation, place of residency, sexual orientation, socioeconomic status, social status and religious affiliation), because these measures enabled us to indirectly draw conclusions on the effects of UCTs on equity in primary outcomes by these characteristics.
Secondary outcomes
The secondary outcomes of the review were as follows.
-
Relevant social determinants of health:
livestock ownership;
school attendance;
participation in the labour force;
parenting quality; and
extreme poverty.
Expenditure on health care (i.e. measures of direct and indirect costs borne by the healthcare recipient).
Search methods for identification of studies
Electronic searches
Academic databases
Appendix 1 presents the search strategy for Ovid MEDLINE, 1946 to Present with Daily Updates. For this update, we adopted this strategy from the original Pega 2017 systematic review of the effect of UCTs on health services use and health outcomes in LMICs. We adapted the subject heading terminology and syntax of search terms to the requirements of the individual databases (see Appendix 2 for the adapted search strategies), also as per the original systematic review (Pega 2017). We sought records written in any language. Just before completion of the review (08 September 2021), we repeated the PubMed database search, to identify the most recent records published over the last six months (e.g. electronic publications ahead of print). For this update, we searched the following 15 databases in September 2021.
Cochrane Public Health Group Specialised Register (because this registry has not been updated since 2014, we did not need to re‐run the original search from 29 May 2015).
Cochrane Central Register of Controlled Trials (CENTRAL; 2021, Issue 8) in the Cochrane Library (searched on 08 September 2021).
Ovid MEDLINE, 1946 to Present with Daily Updates (1946 to 08 September 2021).
CINAHL (Cumulative Index to Nursing and Allied Health Literature; 1937 to 08 September 2021).
Business Source Complete (1990 to 08 September 2021).
EconLit (1969 to 08 September 2021).
3IE database (1990 to 08 September 2021).
PsycINFO (1920 to 08 September 2021).
PubMed (1920 to 08 September 2021).
Scopus (1995 to 08 September 2021).
Social Sciences Citation Index (1955 to 08 September 2021).
Sociological Abstracts (1952 to 08 September 2021).
The Campbell Library: the Campbell Collaboration (the Campbell Library, Volume 17, Issue 2; searched on 08 September 2021).
TRoPHI (Trials Register of Promoting Health Interventions; 1920 to 08 September 2021).
WHOLIS (the World Health Organization library catalogue; 1948 to 08 September 2021).
Grey literature databases
We also searched the following four grey literature databases up to September 2021.
EconPapers (www.econpapers.repec.org).
National Bureau of Economic Research (www.nber.org).
Social Science Research Network ‐ SSRN eLibrary (www.ssrn.com).
System for Information on Grey Literature in Europe ‐ Open‐Grey (www.opengrey.eu) (up to June 2020; this database was discontinued from 01 December 2020).
For grey literature databases searches that returned more than 500 hits, we screened the first 100 hits only, after ordering the hits for relevance if the database permitted this.
Internet search engines
We screened the first 30 hits on the Internet search engines Google Scholar and ReliefWeb up to September 2021.
Targeted Internet searching of key organisational websites
We searched the websites of the following eight key international, donor and nongovernmental organisations up to September 2021.
African Development Bank (www.afdb.org).
Asian Development Bank (www.adb.org).
European Bank for Reconstruction and Development (www.ebrd.com).
Inter‐American Development Bank (www.iadb.org).
World Bank (www.worldbank.org).
United Kingdom Department for International Development (www.gov.uk/government/organisations/department-for-international-development).
Cash Transfer Projects in Humanitarian Aid (www.sdc-cashprojects.ch).
Save the Children (www.savethechildren.org.uk).
We did not conduct a targeted search of the WHO website because we searched WHOLIS, which comprehensively indexes publications from this organisation.
Searching other resources
Previous reviews, academic journals and included records
We handsearched for eligible studies and records:
the 20 previous systematic reviews on cash transfers (potentially including unconditional ones) and health service use, health outcomes, or both (Adato 2009; Arnold 2011; Awojobi 2020; Bassani 2013; Boccia 2012; Cooper 2020; De Walque 2017; Durão 2020; Ekezie 2017; Heise 2013; Leite 2019; Manley 2013; Manley 2020; McGuire 2022; Owusu‐Addo 2019; Pettifor 2012; Richterman 2018; Siddiqi 2018; Sridhar 2006; Zimmerman 2021);
all the issues published in the year prior to finalising the review of those academic journals with the largest number of records of included studies (original systematic review: Journal of Nutrition, Quarterly Journal of Economics and The Lancet ‐ May 2016 to June 2017; this update of the systematic review: Food Policy, Global Food Security, Health Policy & Planning, Journal of Development Effectiveness and Journal of Development Studies ‐ March 2020 to February 2021); and
the reference lists of all included records.
Data collection and analysis
Selection of studies
Research librarians assisted the search for relevant literature in the databases, which returned the titles and abstracts of each record. One author (out of: FP, RP, EYL, SKL and SYL) initially screened the title and abstract of each identified record for relevance, eliminating obviously irrelevant records. We screened the full text of each record without an abstract to establish its relevance. We identified and excluded duplicate records.
At least two review authors (out of: FP, RP, EYL, SKL and SYL) then independently screened the abstract of each potentially relevant record in depth for eligibility. We retrieved records selected for full‐text screening. We had records written in a language other than those we speak (Dutch, English, French, German, Italian and Spanish) translated into English.
Two authors (out of: FP, RP, CB, EYL, SKL and SYL) then independently established whether a record undergoing full‐text screening met the inclusion criteria for the review. A third author (FP or SYL) resolved disagreements about the inclusion of controversial records. We documented the reasons for excluding the 30 studies that were closest to the inclusion criteria in the 'Characteristics of excluded studies' table.
Data extraction and management
Two data extractors (out of: FP, RP, CB and SYL) independently extracted data for each included study, using the Cochrane Public Health Group's data extraction form (CPH 2011), expanded for the complex intervention perspective that we adopt in this review, with the Cochrane‐Campbell Methods Group Equity Checklist added (Ueffing 2012). To ensure standardised data extraction, the data extractors first received training in data extraction, and they then piloted the dedicated form before commencing the extraction. One review author checked and resolved discrepancies between the data extraction forms of the two data extractors (FP or SYL).
At a minimum, we extracted data for the following categories: study eligibility (i.e. data required to assess eligibility along inclusion criteria); study details (including study objectives and methods); intervention groups (including group names and, for cluster‐RCTs, all intervention arms); outcomes; and results (including for subgroups).
Where information was available from the record on the context, implementation, cost and sustainability of the UCT, we also extracted this information. Where this information was not available directly from the record, but where the record cited another source that described it, we extracted the data from this other source. The types of contextual information we extracted included design features of the UCT such as its generosity (e.g. as assessed by the percentage contribution of an average income from the UCT to the national average total income) and population coverage (e.g. as measured by the coverage rate of the UCT amongst the total population). We reported this information on the context, implementation, cost and sustainability of the UCT in the tables of 'Characteristics of included studies'.
We also extracted data on key sociodemographic characteristics of participants at baseline and at the endpoint within the PROGRESS‐Plus framework (Cochrane Methods Equity Group 2022), for the purpose of assessing the interventions' equity impact. The extracted sociodemographic characteristics included age, education, ethnicity, gender, gender identity, geographic residency, labour force participation, place of residency, sexual orientation, socioeconomic status, social status and religious affiliation. As noted above, we additionally incorporated the Cochrane‐Campbell Methods Group Equity Checklist in our data extraction form (Ueffing 2012). We also recorded whether the intervention comprised dedicated strategies to support disadvantaged populations.
We extracted information on the comparator (i.e. definitions of the control group), again including contextual, implementation, cost and sustainability data. We extracted data on potential measured confounders and the methods for confounder control. We used Review Manager Web (RevMan Web) software to enter, store and manage the extracted data (RevMan Web 2020).
Assessment of risk of bias in included studies
Two members of the review author team independently assessed the risk of bias in the included studies. Where differences arose, a third review author (generally FP) resolved these discrepancies.
To assess the risk of bias in the included cluster‐RCTs, we applied the Cochrane risk of bias tool, including any special statistical considerations for this study design, such as risk of recruitment bias (Chapter 16.3, Higgins 2011). To assess the risk of bias in the included CBAs, we used the EPOC risk of bias criteria (Cochrane EPOC 2012), which is a version of the Cochrane risk of bias tool. We added assessments for the domains of risk of bias from misclassification and the risks of confounding and reverse causation.
As we have done previously (Pega 2013; Pega 2015a; Pega 2017), we assessed the specific features of cohort studies and the extent to which these may introduce bias (Centre for Reviews and Dissemination 2009; Appendix 3 in Joyce 2010). At minimum, we assessed the risk of bias in the following features: sampling strategy; sample representativeness; participant allocation; initial survey response; attrition; exposure measurement; outcome measurement; missing data; reporting; and control of key confounders and of reverse causation.
We assessed and reported risk of bias at the outcome level, first for each outcome for each study (i.e. risk of bias of an individual study) and then for each outcome across all studies (i.e. risk of bias in the whole body of evidence).
Measures of treatment effect
For dichotomous outcomes
The included studies estimated treatment effects on dichotomous outcomes with an odds ratio (OR) or a coefficient from either a logistic regression model (i.e. an estimate of the log OR), a probit regression model (i.e. an estimate of the difference in log odds) or a difference‐in‐differences (DD) model.
In their calculation of treatment effect estimates, several included studies erroneously treated dichotomous data as if they were continuous data. For example, data from the question 'Have you had a growth check in the last six months?' with the two response categories 'yes' and 'no' are dichotomous, so treating the variable 'percentage of participants who have had a growth check' as continuous in a linear regression model is erroneous because it is based on the assumption that the variable is normally distributed. Cochrane does not accept these erroneous treatment effect estimates, and we therefore could not report these estimates in this review.
Coefficients of a DD model were the most commonly reported treatment effect estimate for dichotomous outcomes in the several cluster‐RCTs included in this review (Wing 2018). These treatment effect estimates were generally derived by first subtracting the proportion of participants in the intervention group who had the outcome (i.e. had received a growth check) before the intervention was implemented (e.g. at the baseline survey) from the proportion of participants in the intervention group who had the outcome after the intervention was implemented (e.g. at the prioritised follow‐up survey). In a second step, this before‐and‐after difference in the intervention group was subtracted from the equivalent before‐and‐after difference in the control group to adjust for underlying trends in the outcome. In addition, most DD estimators were also adjusted for potential confounders using regression analyses. These DD estimates can be interpreted as the average difference in the outcome in the intervention group from before and after the intervention, adjusted for underlying time trends in the outcome that occurred in the control group and adjusted for confounders. However, these DD estimates, which are common in economic research and increasingly present in epidemiological studies (Dimick 2014), are not preferred treatment effect estimates for Cochrane Reviews.
In this review, if possible, we converted an odds ratio (OR) or coefficient from a logistic or probit regression model into a risk ratio (RR) estimate. If we were unable to convert an OR or a coefficient from a logistic or a probit regression model into an RR (i.e. where we could not retrieve the baseline risk in the control group before treatment with a UCT), we reported the OR that was provided in the study record or the OR that we calculated from the coefficients reported in the study record. If we could not retrieve the baseline risk from the same study but were able to retrieve a baseline risk for the outcome from another study from the same setting and context, then we used this baseline risk for our conversion and reported the source of the assumed baseline risk.
If a cluster‐RCT reported a DD estimate only for a dichotomous outcome, as was common for econometric studies included in this review, and if we were able to retrieve the crude frequency measures for the outcome in the treatment and control groups from the study record or the principal study author, then we converted these crude frequencies into RR estimates. We calculated this RR using an approximately correct analysis for cluster‐RCTs, as recommended in the Cochrane Handbook (Chapter 23.1, Higgins 2021). In more detail, we calculated the effective sample sizes from: the crude frequencies of the outcome; the number of clusters in the cluster‐RCT; and an intra‐cluster correlation coefficient (ICC). We sourced the ICC from the only included study that reported such coefficients (Robertson 2012), and we used the median ICC across all included outcomes (i.e. ICC = 0.07). We calculated the RR by entering the effective sample sizes that we had calculated into analyses in RevMan Web (RevMan Web 2020). If we were not able to calculate an RR for a study, we reported in the review that we were unable to extract or calculate an acceptable treatment effect estimate, and we did not report any treatment effect estimate for the outcome from that study.
Mean differences (MDs) of proportions, which Cochrane also does not accept, were reported in one included study (namely, Baird 2010). For these measures, we sought and were granted access to the original micro‐data for this study, and we re‐analysed these data. Because the included outcomes from Baird 2010 were measured at three time points for each individual, nested within enumeration areas, we used a three‐level multilevel model to estimate the effect of the UCT among participants in the UCT intervention group, compared with the comparator (i.e. the control group or the CCT group). Multilevel models are a generalisation of the linear model used in traditional regression analysis (Diez‐Roux 2000; Raudenbush 2001). Several authors have shown that ignoring the hierarchical structure of a data set can lead to inferential errors and that estimating random‐effects coefficients can more adequately model data structures typically obtained in field research (Diez‐Roux 2000; Raudenbush 2001). We performed the analyses using HLM7.01 and Stata (Scientific Software International 2015; StataCorp 2015). To investigate the potential effect of exposure to the UCT treatment on the likelihood of the outcome, we adopted a step‐up approach (Raudenbush 2002), conducting different sets of analyses. The first set of analyses investigated the crude relationship of the UCT in comparison to the control group and the likelihood of experiencing the outcome. We then added sociodemographic variables because they could potentially act as confounders of the relationship between the main exposure and outcome. The covariates added in the multilevel model were the same ones we adjusted for in the original analysis presented in the study record (i.e. student's age, whether the father lived within the household, whether the girl previously had sex, and time point of data collection).
For continuous outcomes
All included studies reported a treatment effect on a continuous outcome variable as a mean difference (MD) between the intervention group and the control group or as the coefficient of a DD regression model. As with dichotomous outcomes, DD estimates were the before‐and‐after difference in the intervention group minus the before‐and‐after difference in the control group, and they can be interpreted as the average difference in the outcome in the intervention group from before and after the intervention, adjusted for underlying time trends in the outcome that occurred in the control group (see above). In this review, we reported the MD or DD estimates for studies with continuous outcomes. Several included studies reported MDs and DDs that were z‐transformed (i.e. standardised by being divided by 1 standard deviation (SD)), but we did not consider these measures to be equivalent to what is referred to as standardised MDs in Cochrane, and therefore we report these treatment effect measures as MDs of 1 SD and DDs of 1 SD, respectively.
Prioritisation of treatment effect estimates
If two or more studies used the same data and outcome (for example, two studies evaluated the same government programme), we prioritised for inclusion in the meta‐analysis the study with the study design that carried a relatively lower risk of bias.
If, for an included outcome, a study presented both a treatment effect estimate that was unadjusted for confounding and one that was adjusted for confounding, then we prioritised and reported the adjusted treatment effect estimate. If a study had presented only unadjusted treatment effect estimates, we would have adjusted the treatment effect measures for these variables as long as between‐group differences in covariates at baseline and potential confounding variables were reported; however, this situation did not occur in this review. If a study reported multiple models, each of which adjusted for a different number or set of potential confounders, then we prioritised the model that we judged to have adjusted most appropriately for the largest number and most relevant set of potential confounders.
In econometric studies, authors routinely present several competing additional specifications of a main regression model as robustness checks. In this review, we prioritised the treatment effect estimate from the conservative or 'baseline' model that we judged to be most appropriately and fully adjusted. For example, if a study reported an unadjusted regression model (i.e. the baseline model), the same model with stronger methods of confounder control (i.e. more appropriately adjusted baseline model) and an alternative model that used an alternative exposure variable (i.e. a robustness check), then we prioritised the adjusted regression model.
If a study presented an intention‐to‐treat and another (e.g. average causal) treatment effect estimate, then we reported the intention‐to‐treat estimate. Related to this, we prioritised estimates of the effect of being eligible for or receiving a UCT (i.e. a 'yes' versus 'no' dichotomous exposure variable) over estimates of the effect of the specific dollar amount of the UCT that the recipient was eligible for or received (i.e. a continuous exposure variable). The reason is that the former effect estimates carry a lower risk of certain biases. For example, violations of consistency in estimates of average treatment effects could occur whereby the dollar amount of the UCT is not irrelevant for treatment (VanderWeele 2009); for instance, USD 10 provided to a participant with an annual income of USD 15,000 is not equivalent to USD 10 provided to a participant with an annual income of USD 50,000.
Moreover, we prioritised original studies over pure replication studies, as long as the original study had collected the data both studies analysed. A pure replication study (as here defined) is "checking on others' published papers using their data" (Hamermesh 2007, p. 175). Our underlying assumption is that original studies would have had more comprehensive access to the analytical data sets than pure replication studies would have had. Where a pure replication study confirmed the results of the original study, we report it alongside the original study only. Where a pure replication study has not confirmed the original study's results, we explicitly report this in the Results section.
We reported the 95% confidence interval (CI) for each treatment effect measure, if feasible. If the study record(s) did not provide the 95% CI or the data required to calculate it (e.g. a standard error or a t‐value), we requested either the 95% CI or the data to calculate it from the principal study author via email. If we could not retrieve the 95% CI or the data required to calculate it, then we reported in the review the information about the statistical significance that the study record provided (e.g. an exact P value or the reported P value threshold).
In this review we report several treatment effect estimates or their standard deviations (SDs), or both, that differ from those reported in the included study records, generally because the previously published estimates were unadjusted for clustering in cluster‐RCTs (see Unit of analysis issues). We also report several treatment effect estimates or their SDs, or both, that have not been reported in study records. We have retrieved these new estimates or SDs, or both, directly from the study authors (see Dealing with missing data).
Unit of analysis issues
We screened all studies for unit of analysis issues from randomisation (or non‐random allocation) of participant clusters, treatment with multiple interventions, and multiple observations for the same outcome at different time points. If a study that randomised (or observed) participant clusters did not control for clustering effects in the analysis, we contacted the principal study author and requested treatment effects estimates and 95% CIs (or the standard errors to calculate the 95% CIs) that were adjusted for clustering.
If studies with multiple intervention groups compared multiple possible intervention group pairings (e.g. 'group A versus group B', 'group A versus group C' and 'group B versus group C'), then we did not use the same intervention group (e.g. 'group A') more than once in meta‐analyses (e.g. if we included 'group A versus group B', then we excluded 'group A versus group C').
For all treatment effect estimates with unit of analysis issues, our protocol required us to request from the principal study authors clustering‐adjusted treatment effect estimates (Pega 2014). It also required us to exclude from meta‐analysis all treatment effect estimates for which clustering‐adjusted treatment effect estimates could not be retrieved and to instead report these unadjusted effect estimates with the caveat that they may have suffered from unit of analysis issues (Pega 2014). Our screening of included studies identified three studies that had not adjusted treatment effect estimates for clustering and thus were at risk of unit of analysis issues (i.e. Leroy 2010; Luseno 2012; Miller 2008). Therefore, we requested clustering‐adjusted treatment effect estimates for these studies from the study authors, and the authors provided the requested treatment effect estimates for all three studies. This review reports these cluster‐adjusted treatment effect estimates that were free of unit of analysis issues.
Dealing with missing data
We requested all relevant missing information on the study methods, outcomes and statistical measures required for this review from the principal study authors by email (using the contact details provided in the latest eligible study record or requesting current email addresses from the authors' affiliated organisations). If a principal study author did not respond within a 14‐day period, we contacted second or last study authors by email.
For all included studies, we requested detailed information on the following data if missing.
Assumed risks (i.e. baseline risk in the control group).
Numbers of participants.
Standard deviations of continuous outcomes to be able to standardise treatment effect estimates.
Treatment effect estimates acceptable to Cochrane (i.e. ORs or RRs for dichotomous outcomes and MDs for continuous outcomes) and fully adjusted for confounding.
Standard errors that were fully adjusted for confounding and, if necessary, for unit of analysis issues (i.e. clustering).
We received the requested information, including the missing data, for 17 studies (Baird 2010; Bazzi 2012; Cunha 2014; Fernald 2011; Galiani 2014; Hessel 2018; Huang 2016; Leroy 2010; Luseno 2012; Miller 2008; Oxford Policy Management 2012; Pellerano 2014; Robertson 2012; Schady 2012; Seidenfeld 2013; Tiwari 2019; Ward 2010). If we could not obtain missing information and data, we analysed only the available data and addressed the potential impact of the missing information and data on the findings of the review in the Discussion section.
Assessment of heterogeneity
We did not meta‐analyse studies that differed considerably in their study designs (e.g. we did not combine a cluster‐RCT with a CBA or a cohort study), outcomes (e.g. we did not combine a Center for Epidemiologic Studies Depression Score measure with a Geriatric Depression Scale measure) or participants (e.g. we did not combine individual participants with households), but otherwise we considered the included studies sufficiently homogeneous across participants and interventions (including intervention design, context and implementation, including the reporting period and the follow‐up period) to potentially be combined in the same meta‐analysis. For studies with the same outcome and study design, we calculated the I² statistic using RevMan Web to assess their statistical heterogeneity for the purpose of more formally establishing the feasibility of meta‐analysis (RevMan Web 2020).
Assessment of reporting biases
Publication bias could have occurred if we failed to comprehensively identify all studies that were eligible for inclusion. For example, studies with unwelcome or null findings may not have progressed to publication in the academic literature and may therefore not have been indexed in the databases that we searched. To avoid missing eligible studies, we employed a comprehensive search strategy. Moreover, in addition to several academic databases, we also searched the Cochrane Central Register of Controlled Trials (CENTRAL) and the Cochrane Public Health Group Specialised Register; several databases of grey literature, dissertations, theses, and conference proceedings; and the websites of seven key organisations. Additionally, we asked independent policy and research experts, including the Review Advisory Board, to identify unpublished studies. We found and included in the review many eligible studies published in non‐academic, grey literature. Furthermore, the review also included articles written in any language to minimise the likelihood of language bias. Since the review did not identify 10 or more eligible studies reporting the same outcome, we did not produce a funnel plot and did not test for funnel plot asymmetry to assess the presence of publication bias for the outcome.
Data synthesis
Meta‐analysis
We combined studies that we considered sufficiently homogeneous across study design (including treatment effect estimate), intervention, outcome and participants in a meta‐analyses using RevMan Web 2020. We combined only studies with the same study design. For example, we combined two or more cluster‐RCTs but did not combine a cluster‐RCT with another study design, such as a CBA or a cohort study. Similarly, we did not combine studies with different types of treatment effect estimates (e.g. we did not combine an RR with an OR or an MD or DD with a standardised MD). We pooled only the same type of treatment effect (e.g. RRs only), whether or not they were crude or adjusted for the same or different confounders.
For dichotomous outcomes, we did not combine RRs and ORs in the same meta‐analysis. Rather, if feasible we converted ORs into RRs and then combined these converted RRs with the RRs extracted or calculated from other studies. If we were unable to convert ORs into RRs for the same dichotomous outcome for several studies, then we combined the ORs in the meta‐analysis, and then converted the overall OR from the meta‐analysis into an RR, if possible. For continuous outcomes, we assumed MDs and DDs to be sufficiently comparable to be combined, and we therefore combined MDs with DDs in the same meta‐analysis.
We combined only studies that reported the same outcome in meta‐analyses. If studies measured slightly different aspects of the same outcomes or measured the same outcome over slightly different reporting periods, we combined them in meta‐analysis and noted major differences when we reported the results of the meta‐analysis in the Effects of interventions section. We only combined all relevant studies of individual participants or of households with each other, and we did not combine individuals with households in the same meta‐analysis. If a meta‐analysis of individuals included both children and adults and if the effectiveness of the studied UCT was qualitatively different for children and for adults (e.g. for the outcome 'participation in the labour force', an increase in children engaging in child labour from a UCT would be a harm, whereas an increase in adults working from a UCT would be a benefit), then we displayed them as separate subgroups in the meta‐analysis and did not report overall totals.
If a study reported treatment effect estimates for an outcome separately for different subsamples (e.g. one estimate for children aged up to 5 years and another estimate for children aged 6 to 17 years), and if these subgroup comparisons did not use the same comparison groups (e.g. treated young children were compared with untreated young children, and treated older children were compared with untreated older children), then we combined the treatment effect estimates for the subsamples in the same meta‐analysis and defined the different subsamples when we reported the results of the meta‐analysis in the Effects of interventions section.
If we combined crude frequencies in a meta‐analysis to produce an RR for a dichotomous outcome (i.e. when we conducted approximately correct analyses of cluster‐RCTs according to Chapter 16.3 of the Cochrane Handbook (Higgins 2011)), we applied the Mantel‐Haenszel method with random‐effects models to address potential heterogeneity. In meta‐analyses of dichotomous data with RRs and in meta‐analyses of continuous outcomes with MD or DD effect estimates, we used the inverse variance method with random‐effects models. We did not adjust any treatment effect estimate that we report in this review in any way.
We present each meta‐analysis in a forest plot. For each study included in a meta‐analysis, the forest plot presents the number of participants in the intervention group and the control group. If a study reported a different number of participants for a measure taken before the intervention was conducted than for the measure taken after the intervention had been provided, then we prioritised and report in the forest plot the numbers of participants measured after the intervention. If a study did not report the number of participants separately for the intervention group and the control group but only reported the total number of participants, then we reported the number of participants in the forest plot as if the total number of participants were equally split between the intervention and control groups.
If a meta‐analysis was very highly statistically heterogenous (i.e. had an I² of 90% or higher), we turned totals in the meta‐analysis off in the forest plots and instead synthesised the studies narratively, as recommended in Chapter 9.5 of the Cochrane Handbook (Deeks 2020).
Other synthesis methods
If we could not meta‐analyse studies due to incomplete or incompatible statistical data (e.g. the standard error or data to calculate it were missing), we synthesised those results using vote counting based on the direction of effect, and displayed the results using effect direction plots (McKenzie 2020). Where we judged studies to be too heterogeneous to permit meta‐analysis (i.e. studies with considerably different study designs, interventions, outcomes, and/or participants, or those that had an I² of 90% or higher), we reported results separately for each study. If we could meta‐analyse an outcome for some studies but could not include other studies of the same outcome in the meta‐analysis, then we reported the results of the studies that could not be included in the meta‐analysis alongside the results from the meta‐analysis. To avoid introducing bias, we did not emphasise any one study in the review.
Subgroup analysis and investigation of heterogeneity
We planned to conduct subgroup analyses on the meta‐analyses or narrative syntheses of the primary outcomes by age (comparing children with adults), gender (comparing girls or women with boys or men) and WHO region (comparing Africa, the Americas and South‐East Asia). However, these subgroup analyses were infeasible because the review included an insufficient number of studies reporting intervention effects on primary outcomes among groups defined by these variables. If subgroup analyses in meta‐analyses had included a sufficiently large number of studies to conduct meaningful statistical testing, we would have conducted t‐tests and used the I² statistic to assess statistical significance using RevMan Web 2020.
Sensitivity analysis
We did not conduct any sensitivity analyses. The studies that we combined in meta‐analyses were relatively methodologically homogeneous and were generally of comparable quality, so there was no need to conduct sensitivity analyses to evaluate whether the sizes of the combined effect estimates were robust across studies. For the main comparison of UCTs with either no UCT or a UCT that provided a considerably smaller amount of income, all studies that we actually included in the review compared UCTs with no UCT. Consequently, there was also no need for sensitivity analyses to test for the effect of combining studies with both no UCT and a smaller UCT in meta‐analysis.
Summary of findings and assessment of the certainty of the evidence
We (all authors collectively) assessed the certainty of the evidence for each outcome. In following the Cochrane Public Health Group's best practice guidelines, we applied the GRADE considerations, assessing certainty based on study limitations (or risk of bias), consistency of effect estimates, imprecision, indirectness, publication bias and strength of effect (CPH 2011). For each outcome, we started the assessment at a rating of "high" certainty of evidence, because this was a body of experimental studies. For each domain, if we had very serious, serious and no serious concerns, we downgraded the certainty of evidence by two levels (‐2), one level (‐1) and no level (+/‐0), respectively. Because the evidence was experimental, upgrading domains were not applicable. We produced evidence profiles in the GRADEprofiler Guideline Development Tool software for our GRADE assessments (GRADEpro GDT).
We present results for the key measure of the seven most relevant primary outcomes of the review (i.e. use of health services and health outcomes) for the comparison of UCTs with no intervention in the main summary of findings table. In selecting the most important primary outcomes for presentation, we sought to ensure a range of outcomes covering the seven domains commonly regarded as central for improvements from UCTs: use of any health services, stunting, death, disease or illness, food security, nutritional diversity, and depression. Additionally, we also present secondary outcomes measures (i.e. social determinants of health and healthcare expenditure) and the relative effectiveness of UCTs compared with CCTs in additional, secondary summary of findings tables. These tables present the number of included studies, the treatment effect estimate, and a GRADE assessment of the overall certainty of the body of evidence for each outcome. We also developed the summary of findings tables with the GRADEprofiler Guideline Development Tool software (GRADEpro GDT).
Results
Description of studies
Results of the search
Figure 2 presents a PRISMA flowchart of the study selection. Overall, our searches identified a total of 60,496 records. Of these, a total of 34 studies with 106 records met the inclusion criteria for the systematic review.
2.

Flowchart of study selection
Searching the 15 electronic academic databases identified a total of 48,612 records. After removing duplicates, 34,219 unique records remained. In‐depth, full‐text screening identified 27 studies with 46 records that fulfilled the inclusion criteria (Abdoulayi 2014, 4 study records; Aizawa 2020; Amarante 2011; American Institutes for Research 2013; Baird 2010, 3 records; Beck 2015; Cunha 2014; d'Errico 2020; Fernald 2011; Galiani 2014; Grellety 2017; Haushofer 2013, 2 records; Hessel 2018; Huang 2016, 2 records; Leroy 2010, 2 records; Luseno 2012; Miller 2008; Ohrnberger 2019, 2 records; Paxson 2007; Pellerano 2014, 2 records; Robertson 2012, 3 records; Salinas‐Rodríguez 2014; Schady 2012; Seidenfeld 2013, 8 records; Smith 2017; Tiwari 2019; Wang 2019).
Searching other sources yielded a total of 11,884 additional records, namely 5257 records from additional database and Internet searches and 6627 records from handsearching. Of the 5257 records from additional database and Internet searches, 1246 records came from the six electronic grey literature databases, 60 records came from the one Internet search machine, and 3951 records originated from the websites of eight key organisations. Full‐text screening identified seven additional eligible studies with 21 records (Agüero 2007, 2 records; Akresh 2012, 5 records; Bazzi 2012; Olajide 2013, 5 records; Oxford Policy Management 2012, 3 records; Seidenfeld 2012, 4 records; Ward 2010, 2 records). It also identified 39 additional records of 15 previously identified studies (Abdoulayi 2014, 4 records; Amarante 2011, 2 records; American Institutes for Research 2013, 6 records; Baird 2010, 5 records; Galiani 2014; Haushofer 2013, 2 records; Luseno 2012; Miller 2008, 2 records; Paxson 2007; Pellerano 2014, 3 records; Robertson 2012; Schady 2012; Seidenfeld 2013, 8 records; Smith 2017; Wang 2019).
Seven pairs of included studies reported results from the same cluster‐RCT, and we treated these as follows.
Aizawa 2020 and Oxford Policy Management 2012 reported effect estimates for different measurements for the same included outcomes. We always prioritised Oxford Policy Management 2012 because it always reported the preferred outcome measurements.
Baird 2010 was replicated by Smith 2017 in a pure replication study (see Measures of treatment effect). We prioritised the included original study (Baird 2010), but considered the findings of the pure replication study to inform our risk of bias assessment.
d'Errico 2020 and Pellerano 2014 reported different measurements for the same included outcomes, and we always prioritised Pellerano 2014 as this study reported the preferred outcome measurements.
Fernald 2011 and Paxson 2007 analysed the same cluster‐RCT, and when both studies reported the same measurements for some included outcomes, we prioritised Paxson 2007 because it reported treatment effect estimates for the entire study sample, whereas Fernald 2011 reported results for only a selection of study participants.
Huang 2016 and Ward 2010 reported different outcomes, and we report analyses from both sets of studies in this review.
Luseno 2012 and Miller 2008 reported different outcomes, and we report analyses from both sets of studies in this review.
Haushofer 2013 was replicated by Wang 2019 (pure replication study), and we prioritised the original included study, but considered the replication study's findings when we assessed risk of bias.
In the Effects of interventions section, we do not report the deprioritised studies that did not contribute any data to our analysis; namely, Aizawa 2020, d'Errico 2020, Smith 2017, and Wang 2019.
Of the 6627 records from handsearches, 1169 records came from the 20 relevant previous reviews on cash transfers (potentially including UCTs) and health service use or health outcomes, or both (Adato 2009; Arnold 2011; Awojobi 2020; Bassani 2013; Boccia 2012; Cooper 2020; De Walque 2017; Durão 2020; Ekezie 2017; Heise 2013; Leite 2019; Manley 2013; Manley 2020; McGuire 2022; Owusu‐Addo 2019; Pettifor 2012; Richterman 2018; Siddiqi 2018; Sridhar 2006; Zimmerman 2021); 1920 records came from all issues published over the year prior to finalising the review in those academic journals with the largest number of records of included studies (original systematic review: Journal of Nutrition, Quarterly Journal of Economics and The Lancet ‐ May 2016 to June 2017; this update of the systematic review: Food Policy, Global Food Security, Health Policy & Planning, Journal of Development Effectiveness, and Journal of Development Studies ‐ March 2020 to February 2021); and 3538 records came from the reference lists of all included study records. These handsearches identified no additional eligible study or record.
Up to the last search for this systematic review in September 2021, we identified 12 additional recently published or recently indexed studies, or study records that we could not access, which may or may not fulfil the inclusion criteria of this review (Aguila 2020; Banarjee 2020; Chen 2019; Davis 2016; De Groot 2021; Haushofer 2018; Haushofer 2021; Ma 2020; Ohrnberger 2020; Oxford Policy Management, Makarere University 2013; Shangani 2017; Zheng 2020). We describe the characteristics of these studies in the Studies awaiting classification table.
Finally, searching the PubMed database for the most recent publications over the last six months near the end of the review update process identified no additional study or record that was published online ahead of print.
Included studies
We provide an overview of included study characteristics in Table 4 and describe the characteristics comprehensively in the Characteristics of included studies tables.
1. Overview of synthesis and included studies.
| No |
Study Country of conduct |
Study type | Key detail of intervention | Population (sample size: intervention/control)a | Primary outcome domains with available data | Specific outcomes measure | Time point of measurement | Method of synthesis |
| 1 |
Abdoulayi 2014 Malawi |
C‐RCT | Tailored to ultra‐poor and labour‐constrained households; 24‐month intervention | Households (3531: 1678/1853) | 1. Use of any health service* 2. Stunting* 3. Underweight 4. Disease or illness* 5. Food security* 6. Dietary diversity* 7. Depression* |
1. Sought treatment at public or private health facility in past two weeks 2. Is stunted 3. Is underweight 4. Had any illness or injury in past two weeks 5. Eats ≥ 1 meal/day 6. Child consumed Vitamin A‐rich foods in past day 7. CESD score |
24 months into the intervention | 1. NEE 2. MA 3. NEE 4. NEE 5. MA 6. NEE 7. NS |
| 2 |
Agüero 2007 South Africa |
C | Tailored to children (0 to 36 months); up to 36‐month intervention | Children (720: 245/475) | Stunting* | Current height for age | 36 months into the intervention | NS |
| 3 |
Aizawa 2020 Kenya |
C‐RCT | Tailored to households; 24‐month intervention | Households (3107: 1571/1536) | Dietary diversity* | Total consumption of energy, protein, carbohydrate, fat, fibre, Vitamin A, Vitamin B12, Vitamin C, folate, niacin, riboflavin, thiamine, iron, calcium, potassium, phosphorus, zinc, magnesium, sodium) | 24 months into the intervention | RE |
| 4 |
Akresh 2012 Burkina Faso |
C‐RCT | Tailored to children (0 to 59 months); 24‐month intervention; had 4 intervention groups (UCT to mother, UCT to father, CCT to mother, CCT to father) | Children (2559: 540 households in each intervention group/615 households in the control group; number of children in each condition unclear) | Use of any health service* | Number of routine health clinic visits, previous week | 24 months into the intervention | NS |
| 5 |
Amarante 2011 Uruguay |
CBA | Tailored to women adults; 1‐ to 32‐month intervention | Women (1,037,739: 50,939/20,872) | Underweight | Low birth weight, maternal weight at week 35 of pregnancy | 1 to 32 months into the intervention | NS |
| 6 |
American Institutes for Research 2013 Zimbabwe |
CBA | Tailored to children and adults; 47‐month intervention | Households (3063: 2029/1034), Children and adults (14,575: specific number of participants per condition unclear) | 1. Stunting* 2. Underweight 3. Diseases or illness in last 30 days ‐ adult and child* 4. Food security* 5. Dietary diversity* 6. Depression* |
1. ≤ 2 height for age z‐score 2. ‐2 weight for age z‐score 3. Prevalence of any disease 4. Household Food Insecurity Access Scale 5. HDDS score 6. CESD Score |
12 and 47 months into intervention | 1. NS 2. NS 3. MA 4. NS 5. NEE 6. NS |
| 7 |
Baird 2010 Malawi |
C‐RCT | Tailored to women aged 13 to 22 years; 24‐month intervention; had 2 intervention groups (UCT, CCT) and 3 control groups (spill‐over control group for UCT, spill‐over control group for CCT, pure control group) | Children or young adults (3896: 283 in UCT/506 in CCT/1495 in the pure control group) | 1. Disease or illness* 2. Dietary diversity* |
1. Having had any illness or the likelihood of having had a specific illness in the two weeks to three months prior to the interview. 2. Number of days had eaten protein‐rich food, last week |
12 months into the intervention and 2 to 6 months post‐intervention | 1. MA 2. NS |
| 8 |
Bazzi 2012 Indonesia |
CBA | Tailored to households; 12‐month intervention | Households (10,574: 1715/5301) | Use of health services* |
Number of outpatient visits |
12 months into the intervention | NS |
| 9 |
Beck 2015 India |
C‐RCT | Tailored to households | Households (2034: 938/1096) | 1. Vaccination calendar 2. Disease or illness* |
1. Households with complete vaccination coverage 2. Households with cases of illness or injury in last 3 months lasting more than 24 hours and needing treatment but not hospitalisation |
8 months | 1. NS 2. NS |
| 10 |
Cunha 2014 Mexico |
C‐RCT | Tailored to households and children (0 to 6 yrs); 24‐month intervention; had 3 intervention groups (UCT + education, in‐kind transfer + education, in‐kind transfer without education) | Households (5028; specific number of participants per condition unclear); Children (4550: specific number of participants per condition unclear) | 1. Stunting* 2. Underweight 3. Disease or illness* |
1. Current height 2. Current weight 3. Has had any illness |
26 months into the intervention | 1. NS 2. NS 3. MA |
| 11 |
d'Errico 2020 Lesotho |
C‐RCT | Tailored to households; 24‐month intervention | Households (1353: 607/746) | 1. Food security* 2. Dietary diversity* |
1. FC score 2. FC score |
24 months into the intervention | 1. NS 2. RE |
| 12 |
Fernald 2011 Ecuador |
C‐RCT | Tailored to children (12 to 35 months); 18‐ to 27‐month intervention | Children and adults (786: 530/256) | 1. Growth checks 2. Treatment for parasites 3. Dietary diversity* 4. Depression* 5. Stunting* |
1. Has had a growth check in previous 6 months 2. Has been given any parasite treatment previous year 3. FI score 4. CESD score 5. Height for age |
18 to 27 months into the intervention | 1. RE 2. NS 3. NS 4. RE 5. RE |
| 13 |
Galiani 2014 Mexico |
CBA | Tailored to households and adults; 12‐month intervention; had 3 control groups (no UCT in different households) | Households (3477: 1144/806) | Depression* |
GDS score |
12 months into the intervention | NS |
| 14 |
Grellety 2017 Democratic Republic of the Congo |
C‐RCT | Tailored to children (6 to 59 months) with symptoms of stunting and underweight; 6‐month intervention | Children (1481: 734/747) | 1. Stunting* 2. Underweight |
1. Did not achieve and maintain nutritional recovery from severe acute nutrition 2. Did not achieve and maintain nutritional recovery |
6 months into the intervention | 1. NS 2. NS |
| 15 |
Haushofer 2013 Kenya |
C‐RCT | Tailored to poor households in rural areas; 9‐month intervention; had 2 interventions (UCT paid monthly, UCT paid as once‐off lump sum) and 2 control groups (spill‐over and pure) | Households (1440: 258/63) | 1. Disease or illness* 2. Food security* 3. Dietary diversity* 4. Depression* |
1. Illness in previous 2 weeks to 3 months 2. FSI score 3. Number of times ate meat or fish in previous week 4. CESD score |
7 to 9 months into the intervention and up to 10 months after 9 months of intervention | 1. NEE 2. NS 3. NS 4. NS |
| 16 |
Hessel 2018 Columbia |
C | Tailored to older adults; up to 36‐month intervention | Older adults (22,297: 5954/16,343) | 1. Use of any health service* 2. Disease or illness* |
1 Visited the doctor 2. Self‐reported health problems |
36 months into the intervention | 1. NS 2. NS |
| 17 |
Huang 2016 Kenya |
C‐RCT | Tailored to children (0 to 17 yrs); 24‐month intervention | Children (2634: 1626/1008) | 1. Disease or illness* 2. Use of any health service* |
1. Children’s illness 2. Healthcare seeking |
24 months into the intervention | 1. MA 2. RE |
| 18 |
Leroy 2010 Mexico |
C‐RCT | Tailored to women (18 to 49 years) from households; on average 14‐month intervention; had 3 intervention groups (UCT + education, in‐kind transfer, in‐kind transfer + education) | Households (2876: 1492/1385); women (1509: 958/946) | 1. Underweight 2. Dietary diversity* |
1. Weight 2. Consumed any protein |
23 months into the intervention | 1. NS 2. NEE |
| 19 |
Luseno 2012 Malawi |
C‐RCT | Tailored to children (6 to 17 years); 12‐month intervention | Children (1649: 979/670) | 1. Use of any health service* 2. Disease or illness* |
1. Used a health services for child’s worst illness in the previous year 2. Had any disease or illness |
12 months into the intervention | 1. MA 2. MA |
| 20 | Miller 2008 Malawi | C‐RCT | Tailored to ultra‐poor, labour‐constrained households; 13‐month intervention | Households (819: 408/411) | 1. Food security* 2. Dietary diversity* |
1. Household had at least one member who had gone without adequate food for more than 8 days/month 2. HFD score |
13 months into the intervention | 1. NS 2. NS |
| 21 |
Ohrnberger 2019 South Africa |
C | Tailored to children (15 to 18 years) and adults; 72‐month intervention | Children and adults (10,925: 9505/1420) | Depression* | CESD score | 72 months into the intervention | NS |
| 22 |
Olajide 2013 Nigeria |
C‐RCT | Tailored to older adults (≥ 65 yr); 12‐month intervention | Older adults (6236: 3230/3096) | 1. Food security* 2. Depression* |
1. FSI score 2. GDS score |
12 months into the intervention | 1. NS 2. NS |
| 23 |
Oxford Policy Management 2012 Kenya |
C‐RCT | Tailored to children (0 to 17 years) and adults (18 to 54 years); 24‐month intervention | Children (6800 participants: 1571/1536 households; specific number of participants per condition unclear), adults (2440 participants: 1571/1536 households; specific number of participants per condition unclear) | 1. Use of any health service* 2. Stunting* 3. Underweight 4. Disease or illness* 5. Food security* 6. Dietary diversity* |
1. Did not consult formal healthcare provider when was ill/injured 2. Was moderate stunted 3. Was moderately underweight 4. Was ill/injured 5. Went entire days without eating solid foods during worst recent period of food shortage 6. HDDI score |
24 months into the intervention | 1. MA 2. MA 3. MA 4. MA 5. NS 6. MA |
| 24 |
Paxson 2007 Ecuador |
C‐RCT | Tailored to children (36 to 84 months at baseline) and mothers (24 years on average) in poor, non‐welfare families; 15‐ to 19‐month intervention | Children (2069: 79/39 parishes; number of participants per condition unclear) Mothers (2069: 79/39 parishes; number of participants per condition unclear) |
1. Growth checks 2. Treatment for parasites 3. Stunting* 4. Depression* |
1. Has had a growth check in last 6 months 2. Has been given any parasite treatment last year 3. Height for age 4. CESD scores |
15 to 19 months into the intervention | 1. MA 2. MA 3. MA 4. MA |
| 25 |
Pellerano 2014 Lesotho |
C‐RCT | Tailored to households; 24‐month intervention | Households (3102: 1540/1562) | 1. Registered birth 2. Growth checks 3. Vaccination calendar 4. Use of any health service* 5. Underweight 6. Disease or illness* 7. Food security* 8. Dietary diversity* |
1. Child aged 0 to 6 years with a birth certificate 2. Had any growth checks recorded in their Bukana health card 3. Is up to date on vaccination calendar 4. Consulted a healthcare provider 5. Is moderately underweight 6. Has had any illness in previous 2 weeks or 3 months 7. Had a FSI of ≥ 2 8. HDD score |
24 months into the intervention | 1. MA 2. MA 3. MA 4. MA 5. MA 6. MA 7. MA 8. MA |
| 26 |
Robertson 2012 Zimbabwe |
C‐RCT | Tailored to children (0 to 17 years) in poor households; had 2 intervention groups (UCT and CCT) | Children (2008: 763/637/608) | 1. Registered birth 2. Vaccination calendar |
1. Had birth registered 2. Was fully vaccinated |
14 to 16 months into the intervention | 1. NS 2. MA |
| 27 |
Salinas‐Rodríguez 2014 Mexico |
CBA | Tailored to older adults (70 to 74 years) | Older adults (5465: 1353/888) | Depression* | GDS score | 24 months into the intervention | NS |
| 28 |
Schady 2012 Ecuador |
C‐RCT | Tailored to adults (24 years on average) in poor households | Adults (1702: 51/26 parishes; number of participants per condition unclear) | Disease or illness* | Had anaemia | 50 to 57 months into the intervention | NEE |
| 29 |
Seidenfeld 2012 Zambia |
C‐RCT | Tailored to households | Households (3076: 1561/1517) | 1. Food security* 2. Dietary diversity* 3. Depression* |
1. Eats ≥ 1 meal/day 2. Ate meat/fish 5+ times last month 3. CESD score |
36 months into the intervention | 1. NS 2. NS 3. NS |
| 30 |
Seidenfeld 2013 Zambia |
C‐RCT | Tailored to households with ≥ 1 child | Households (2515: unclear number of households in intervention/control) | 1. Registered birth 2. Use of any health service* 3. Stunting* 4. Underweight 5. Disease or illness* 6. Food security* 7. Dietary diversity* |
1. Had birth registered 2. Had used any health service 3. Current height for age 4. Current weight for age 5. Had acute respiratory disease 6. FS score 7. HDD score |
24 months into the intervention | 1. NS 2. MA 3. NS 4. NS 5. NS 6. NS 7. MA |
| 31 |
Smith 2017 Malawai |
C‐RCT (pure replication of Baird 2010) | Tailored to children and young adults (13 to 22 years) who were never married; 24‐month intervention; had 2 intervention (UCT and CCT) and 3 control groups (no cash transfer spill‐over control for UCT and CCT, and pure control) | Children and young adults (3896: 283/1495) | Disease or illness* | Has human immunodeficiency virus, has herpes simplex type 2, has syphilis | 12 months into the intervention | 1. RE |
| 32 |
Tiwari 2019 Indonesia |
CBA | Tailored to households; 10‐month intervention | Households (8586: 2322/6264) | Dietary diversity* | HDD score | 25 to 29 months post‐intervention | NS |
| 33 |
Wang 2019 Kenya |
C‐RCT (pure replication of Haushofer 2013) | Tailored to poor households; 9‐month intervention; had 2 intervention (UCT paid monthly and as once‐off lump sum) and 2 control groups (no UCT to households in the same village as UCT receivers, and no UCT to households in different villages from UCT recipients) | Households (1440: 258/505) | 1. Food security* 2. Dietary diversity* 3. Depression* |
1. FSI score 2. Number of times ate meat/fish in previous week 3. CESD score |
7 to 9 months into the intervention and up to 10 months post‐intervention | 1. RE 2. RE 3. RE |
| 34 |
Ward 2010 Kenya |
C‐RCT | Tailored to children (0 to 17 years), 24‐month intervention; had 1 intervention and 3 control groups (spill‐over for intervention/control and pure control group) | Children (9231: 1540/754 pure control group) | 1. Growth checks 2. Vaccination 3. Use of any health services* 4. Stunting* 5. Underweight 6. Dietary diversity* |
1. Had growth check in previous 6 months 2. Currently fully vaccinated 3. Received treatment for child diarrhoea, acute respiratory infection or fever at a health facility 4. Is moderately stunted 5. Is moderately underweight 6. HDD score |
24 months post‐intervention | 1. MA 2. MA 3. MA 4. MA 5. MA 6. MA |
C: cohort study; CBA: controlled before‐and‐after study; CCT: conditional cash transfer; CESD: Centre for Epidemiological Studies Depression Scale; C‐RCT: cluster‐randomised controlled trial; GDS: Geriatric Depression Scale; HDDI: Household Dietary Diversity Index; HFD: Household Food Diversity; FC: Food Consumption Score; FI: Food Index; FSI: Food Security Index; MA: meta‐analysis of standardised effect sizes; NS: narrative synthesis; NEE: no effect estimate; RE: no effect estimate used (e.g., pure replication study); UCT: unconditional cash transfer
aCondition‐specific or effective sample size where available *Prioritised, primary outcome
Type of study
Of the 34 studies included in this review, 25 were studies of 20 cluster‐RCTs (Abdoulayi 2014; Aizawa 2020; Akresh 2012; Baird 2010; Beck 2015; Cunha 2014; d'Errico 2020; Fernald 2011; Grellety 2017; Haushofer 2013; Huang 2016; Leroy 2010; Luseno 2012; Miller 2008; Olajide 2013; Oxford Policy Management 2012; Paxson 2007; Pellerano 2014; Robertson 2012; Schady 2012; Seidenfeld 2012; Seidenfeld 2013; Smith 2017; Wang 2019; Ward 2010). The Aizawa 2020 and d'Errico 2020 studies reported data already presented in Oxford Policy Management 2012 and Pellerano 2014, respectively. The Smith 2017 and Wang 2019 studies were replication studies of Baird 2010 and Haushofer 2013, respectively. Huang 2016 and Ward 2010 reported different outcomes for one cluster‐RCT. The other nine included studies were observational ones: specifically, six were CBAs (Amarante 2011; American Institutes for Research 2013; Bazzi 2012; Galiani 2014; Salinas‐Rodríguez 2014; Tiwari 2019), and three were cohort studies (Agüero 2007; Hessel 2018; Ohrnberger 2019). Across included studies, we analysed 29 independent data sets. Cluster‐RCTs were common because – as some authors noted – by selecting clusters of individuals rather than individuals, there is less risk of bias from contamination. For each cluster‐RCT included in this review, we report the number of clusters and the type of clusters that were randomised to the intervention and control groups in the Characteristics of included studies.
Half (13 out of 25) of the included cluster‐RCTs derived treatment effects using DD methods (Abdoulayi 2014; Aizawa 2020; Cunha 2014; d'Errico 2020; Huang 2016; Leroy 2010; Miller 2008; Oxford Policy Management 2012; Paxson 2007; Pellerano 2014; Seidenfeld 2012; Seidenfeld 2013; Ward 2010). Difference‐in‐differences methods are common econometric methods for assessing the effect of a treatment on an outcome (Wooldridge 2010). In essence, as used in the included studies, they derive a treatment effect estimate by subtracting the before‐and‐after difference of the intervention group from that of the control group, thereby adjusting for underlying time trends of the outcome and for potential confounding that may have occurred despite random assignment or due to errors in random assignment of the intervention or interventions (see also Measures of treatment effect). The other half of the included cluster‐RCTs derived treatment effects using regression analytic methods to control for potential confounding (Akresh 2012; Baird 2010; Beck 2015; Fernald 2011; Grellety 2017; Haushofer 2013; Huang 2016; Luseno 2012; Robertson 2012; Schady 2012; Smith 2017; Wang 2019). All six CBAs used DD methods to estimate treatment effects (Amarante 2011; American Institutes for Research 2013; Bazzi 2012; Galiani 2014; Salinas‐Rodríguez 2014; Tiwari 2019). As is common in econometric studies, Amarante 2011 also used additional methods, such as discontinuity regression analytic methods, to derive alternative treatment effect estimates to check for robustness of results across methods. The three cohort studies also used regression analysis to derive treatment effects (Agüero 2007; Hessel 2018; Ohrnberger 2019), with two conducting instrumental variable analyses (Hessel 2018; Ohrnberger 2019). Most studies conducted intention‐to‐treat analyses by using eligibility for the UCT, as opposed to receipt of the UCT, as the exposure.
Participants
Overall, the included studies involved 1,140,385 participants (45,538 children and 1,094,847 adults) and 50,095 households in Africa, the Americas, and South‐East Asia. Just over half of the included studies (18 out of 34) estimated the effect of a UCT on primary outcomes among children (Abdoulayi 2014; Agüero 2007; Akresh 2012; Amarante 2011; American Institutes for Research 2013; Baird 2010; Cunha 2014; Fernald 2011; Grellety 2017; Huang 2016; Luseno 2012; Ohrnberger 2019; Paxson 2007; Pellerano 2014; Seidenfeld 2012; Seidenfeld 2013; Smith 2017; Ward 2010). In terms of age groups, almost all of these studies focused on children aged under (or just over) five years. The exceptions were Huang 2016 and Ward 2010, examining children aged 0 to 17 years; Seidenfeld 2012, examining children aged 4 to 17 years; Luseno 2012, examining children aged 6 to 17 years; Ohrnberger 2019 examining children aged 15 to 18 years; and Baird 2010 and Smith 2017, studying children or young adults aged 13 to 18 years. A total of 15 out of 34 studies examined treatment effects in either working‐age adults (11 studies: Abdoulayi 2014; Amarante 2011; American Institutes for Research 2013; Baird 2010; Leroy 2010; Ohrnberger 2019; Oxford Policy Management 2012; Paxson 2007; Schady 2012; Seidenfeld 2013; Smith 2017) or older adults (four studies: Galiani 2014; Hessel 2018; Olajide 2013; Salinas‐Rodríguez 2014). And just over one‐third of the included studies (14 out of 34) examined households, either solely (Aizawa 2020; Beck 2015; d'Errico 2020; Tiwari 2019; Wang 2019), or in addition to studying individual participants (Abdoulayi 2014; American Institutes for Research 2013; Haushofer 2013; Leroy 2010; Miller 2008; Oxford Policy Management 2012; Pellerano 2014; Seidenfeld 2012; Ward 2010).
Most studies with individual participants (22 out of 26) included participants of both sexes (Abdoulayi 2014; Agüero 2007; Akresh 2012; American Institutes for Research 2013; Beck 2015; Bazzi 2012; Cunha 2014; Fernald 2011; Galiani 2014; Grellety 2017; Hessel 2018; Huang 2016; Luseno 2012; Ohrnberger 2019; Olajide 2013; Oxford Policy Management 2012; Paxson 2007; Robertson 2012; Salinas‐Rodríguez 2014; Seidenfeld 2012; Seidenfeld 2013; Ward 2010). The other four studies exclusively examined either girls and young women (Baird 2010; Smith 2017), or all women (Leroy 2010; Schady 2012). Two studies exclusively examined participants living in extreme poverty (Luseno 2012; Miller 2008), and one study each involved only participants living below or just above the poverty line (Bazzi 2012), or living in poverty (undefined) (Hessel 2018).
About two‐thirds of the included studies (22 out of 34) examined participants in countries of the WHO Africa region (predominantly Kenya and Malawi) (Abdoulayi 2014; Agüero 2007; Aizawa 2020; Akresh 2012; American Institutes for Research 2013; Baird 2010; d'Errico 2020; Grellety 2017; Haushofer 2013; Huang 2016; Luseno 2012; Miller 2008; Ohrnberger 2019; Olajide 2013; Oxford Policy Management 2012; Pellerano 2014; Robertson 2012; Seidenfeld 2012; Seidenfeld 2013; Smith 2017; Wang 2019; Ward 2010). Eight studies were located in the WHO Americas region, all in Latin America (predominantly Ecuador and Mexico) (Amarante 2011; Cunha 2014; Fernald 2011; Galiani 2014; Hessel 2018; Leroy 2010; Paxson 2007; Schady 2012), and three studies took place in South‐East Asia (India and Indonesia) (Bazzi 2012; Beck 2015; Tiwari 2019). Studies included in this review covered the following 15 LMICs: Burkina Farso, Colombia, Democratic Republic of Congo, Ecuador, India, Indonesia, Kenya, Lesotho, Malawi, Mexico, Nigeria, South Africa, Uruguay, Zambia and Zimbabwe. Uruguay was classified as a middle‐income country for the years that it was studied in the included study that examined this country.
Interventions
The review included 22 different UCTs, including one basic income intervention (Beck 2015). Thirteen UCTs were established government programmes, four were pilot government programmes and five were experiments.
The government programmes were:
Colombia's Colombia Mayor (Hessel 2018);
Ecuador's Bono de Desarrollo Humano (three studies: Fernald 2011; Paxson 2007; Schady 2012);
Indonesia's Bantuan Langsung Tunai/Direct Cash Transfer Program (two studies: Bazzi 2012; Tiwari 2019);
Lesotho's Child Grants Programme (two studies: d'Errico 2020; Pellerano 2014);
Mexico's Programa de Apoyo Alimentario (two studies: Cunha 2014; Leroy 2010);
Mexico's Programa de Atención a Adultos Mayores en Zonas Rurales (Galiani 2014);
Mexico's 70 y Más (Salinas‐Rodríguez 2014);
Nigeria's Ekiti State Pension Program (Olajide 2013);
South Africa's Child Support Grant (two studies: Agüero 2007; Ohrnberger 2019);
Uruguay's Plan de Atención Nacional a la Emergencia Social (Amarante 2011);
Zambia's Multiple Category Targeting Grant (Seidenfeld 2012);
Zambia's Child Grant Program (Seidenfeld 2013); and
Zimbabwe's Harmonized Cash Transfer Programme (American Institutes for Research 2013).
The pilot government programmes were:
Burkina Faso's Nahouri Cash Transfer Pilot Project (Akresh 2012);
Kenya's Hunger Safety Net Pilot Programme (two studies: Aizawa 2020; Oxford Policy Management 2012);
Kenya's Cash Transfer Pilot Programme for Orphans and Vulnerable Children (two studies: Huang 2016; Ward 2010); and
Malawi's Social Cash Transfer Pilot Scheme (two studies: Luseno 2012; Miller 2008).
The UCT experiments were conducted in:
Democratic Republic of Congo, by an international organisation (Grellety 2017);
India, by a nongovernmental organisation (Beck 2015);
Kenya, by a nongovernmental organisation (two studies: Haushofer 2013; Wang 2019 (replication study));
Malawi, by a research organisation and an international organisation (two studies: Baird 2010; Smith 2017 (replication study)); and
Zimbabwe, by research organisations (Robertson 2012).
The duration of the interventions was most commonly 12 to 24 months, but studies collected outcomes at time points ranging from 7 months into the intervention in Haushofer 2013, to 57 months into the intervention in Schady 2012. The follow‐up in most studies was undertaken during and at the end of the intervention, at 12 to 24 months. In some cases, investigators assessed persistence of effects with follow‐up surveys after the intervention had ended (e.g. 8 months after the intervention was completed in the Akresh 2012 study or even 25 to 29 months after the intervention in the Tiwari 2019 study). However, as noted above, we prioritise the longest follow‐up during the intervention in this review.
Some UCTs primarily aimed to reduce poverty or vulnerabilities (generally by improving one or more of health, nutrition, food security and education), but most combined both of these objectives. Most UCTs were targeted to individuals, families, or households living in poverty or at risk of it. Governments or communities generally applied targeting through various indicators (e.g. income poverty or residency in a low‐income area) and using various mechanisms (including official surveying or selection through community committees). The amounts of cash transferred varied between 1.3% and 81.9% of the annual gross domestic product per capita. These total amounts were disbursed in regular payments made every month or every second month (except for every third month in Akresh 2012).
Three of the included interventions were fuzzy in that they had conditions attached to them in theory, but because programme administrators did not monitor or enforce compliance with conditions or penalise non‐compliance, they were de facto unconditional (Baird 2013). First, the Plan de Atención Nacional a la Emergencia Social was conditional on pregnant women and children attending regular health check‐ups and on children attending school regularly, but these conditions were not enforced (Amarante 2011). Second, the Bono de Desarrollo Humano was conditional on children attending preventive health check‐ups and school but did not monitor compliance (Fernald 2011; Paxson 2007; Schady 2012). Third, Kenya's Cash Transfer Pilot Programme for Orphans and Vulnerable Children was conditional on attendance of a health facility for immunisations among children aged 0 to 1 year, growth monitoring and vitamin supplements among children aged 0 to 5 years, school enrolment among children aged 6 to 18 years and attendance of awareness sessions among adult parents or caregivers, but non‐compliance was not penalised in 4 out of 7 clusters in this cluster‐RCT (Huang 2016; Ward 2010). Moreover, the Bantuan Langsung Tunai/Direct Cash Transfer Program had no conditions, but eligible recipients may have understood that ongoing programme participation was contingent on reported level of household socioeconomic status (Bazzi 2012; Tiwari 2019). However, we judged the risk of potential perceived conditionality as so low that we considered this cash transfer as unconditional for our review.
Participants received minor co‐interventions alongside four UCTs. UCT recipients received an electronic food card with a monthly value of approximately one‐fourth to one‐half of the value of the UCT in the Plan de Atención Nacional a la Emergencia Social (Amarante 2011). Workshops and social development activities were provided alongside the UCT in the Programa de Atención a Adultos Mayores en Zonas Rurales (Galiani 2014). In Lesotho, participants received a UCT for assistance in humanitarian disasters, the Emergency Food Grant, alongside the Child Grants Programme over a period of six months (Pellerano 2014). In addition, participants may have received cash transfers from other social protection interventions. In South Africa, for example, of participants in Ohrnberger 2019 who received the Child Grant Programme, 32% also received Old Age Pension, 15% Disability Grant, 4% Foster Care Grant and 1% Care Dependency Grant, at baseline. This may present a challenge to studies' ability to isolate the effect of a studied UCT from the effect of other cash transfers that may also be implemented in parallel or as part of a "policy package".
Programme uptake, when reported, was high, ranging between 78% and 100%. The included established government programmes often covered a considerable head count or proportion of the population. For example, the review included Indonesia's Direct Cash Transfer Program, the world's largest UCT programme with a population coverage of more than 19 million households (Bazzi 2012). Pilot government programmes and experiments often covered only fractions of the general population or smaller experimental samples. Studies rarely reported total costs of the included UCT interventions, but when they did, they were large for the established government programmes (e.g. approximately USD 250 million for the Plan de Atención Nacional a la Emergencia Social and USD 380 million for the Bantuan Langsung Tunai/Direct Cash Transfer Program).
All included studies compared a group eligible for or receiving a UCT with a group ineligible for or not receiving the UCT. The Haushofer 2013 was the only study that compared a group receiving a UCT with a group receiving a considerably smaller income amount from the UCT, but because this study also reported analyses of the UCT compared with no UCT, we prioritised the latter analyses. Three studies also compared both a UCT and a CCT with a control group and then tested for differences between the findings of these pair‐wise comparisons (Akresh 2012; Baird 2010; Robertson 2012).
Ongoing studies
We have not identified any ongoing studies.
Excluded studies
A total of 274 full‐text records of 218 studies underwent full‐text screening but did not fulfil the inclusion criteria. We document the reasons for excluding the 30 studies that were closest to the inclusion criteria in the Characteristics of excluded studies table (a full list of the excluded studies is available from the principal study author on request). We excluded 63 studies because they did not examine an eligible UCT for reducing poverty and vulnerabilities. These comprised UCTs for assistance in humanitarian disasters (e.g. Aker 2013), which we synthesised in our previous review (Pega 2015a), as well as studies of UCTs with major co‐interventions, such as the Livelihood Empowerment Against Poverty Program in Ghana, which provided a UCT together with health insurance coverage (Handa 2014). We excluded 74 studies because they did not examine one or more primary outcomes of this review, 32 studies because they did not examine an eligible study population, 40 studies because they used an ineligible study type, and 9 studies because they did not report any empirical data.
Risk of bias in included studies
For each included study, we detail the risk of bias in each domain in the study's individual risk of bias table. Figure 3 presents all individual risk of bias assessments of each included study. We judged the overall risk of bias in this review to be high, especially due to potential selection and performance bias. We considered most studies to carry a high risk of attrition bias, with just over half of all C‐RCTs reporting balanced samples at baseline. Almost all studies had a high risk of performance bias because participants cannot be blinded to UCT interventions (as is generally the case for most social interventions), with the risk of bias from contamination often unclear due to lack of assessment (e.g. C‐RCTs did not commonly include spill‐over control groups). About half of all studies carried an unclear risk of bias from allocation concealment due to insufficient reporting, and we judged most studied at unclear risk of bias from selective reporting due to the lack of published or retrievable study protocols. Most studies carried a low risk of selection bias from random sequence generation and a low risk of bias for other reasons such as misclassification, confounding and reverse causation. Most observational studies, however, carried a high risk of confounding.
3.
Risk of bias summary: review authors' judgements about each risk of bias item for each included study
Allocation
We considered most studies to carry a high risk of selection bias. We assessed selection bias based on the following four criteria: whether there was a documented random sequence generator to select participants into the study and allocate them to intervention or control arms; whether random allocation to the intervention group or the control group was appropriately concealed (e.g. in a sealed envelope); whether baseline differences existed between the intervention and the control group in outcome measurements; and whether baseline differences existed in population characteristics between the intervention and control group. For C‐RCTs, we also assessed the risk of recruitment bias due to participants having been recruited after allocation of clusters.
Based on the first criterion (i.e. random sequence generation documented), we judged 8 studies to have a high risk, 23 studies to have a low risk, and 3 studies to have an unclear risk of selection bias from random sequence generation.
Based on the second criterion (i.e. whether random allocation to the intervention group or the control group was appropriately concealed), we judged 1 study as high risk, 16 studies to be at low risk (i.e. generally because they allocated the cash transfers in public lotteries, e.g. toss of a coin, thereby protecting allocation concealment), and unclear risk for the remaining 17 studies. Finally, of the 20 C‐RCTs, we judged 7 to carry a high risk of recruitment bias, 10 to have a low risk, and 3 to have an unclear risk of this bias.
Based on the third criterion (i.e. no baseline differences between the intervention and the control group in outcome measurements), we judged 3 studies to be at high risk, 19 studies to carry low risk, and 12 studies to be at unclear risk of bias.
For the fourth criterion (i.e. no baseline differences between the intervention and the control group in population characteristics), 9 studies were at high risk, 17 studies were at low risk, and 8 studies were at unclear risk of bias.
Blinding
We assessed the risk of performance bias in the included studies based on whether participants and study personnel were blinded to the intervention. In studies where participants allocated to the intervention group were given a UCT, blinding of participants was virtually impossible. Similarly, blinding of study personnel is also not practical and was often reported ambiguously. Consequently, we judged the risk of performance bias to be high for all included experimental studies for all outcomes. For eight of the nine observational studies, we judged the risk of performance bias to be low; these studies used secondary data collected for purposes other than an assessment of the UCT, and therefore we regarded performance bias to be unlikely. The ninth observational study collected data specifically for estimating the effect of the UCT on health and other outcomes, as part of an impact evaluation for the UCT (American Institutes for Research 2013). Since study participants were not blinded and it was unclear if study personnel were blinded, we judged this study to be at high risk of performance bias.
Assessment of detection bias was based on a combination of whether outcome assessors (e.g. interviewers or medical study personnel) were blinded to participants' intervention status and used objective outcome measures. For self‐reported outcome measures, even those collected through a structured interview by blinded study personnel, we considered the participants themselves to be outcome assessors. For these outcomes, we considered if the outcome was affected by lack of blinding of participants in two ways: whether it influenced the participants' behaviour and expectations in a way that genuinely affected their outcomes, and if it led participants to report their outcomes in a way that over‐ or under‐reported what actually happened. Of the 30 studies with subjective outcomes measures, 12 had a high risk of bias (outcome assessor unblinded), 4 had a low risk of this detection bias (outcome assessor blinded), and 14 had an unclear risk of this bias (unclear if outcome assessor blinded). Of the 22 studies with objective outcome measures, 17 and 4 were at low and unclear risk of bias, respectively.
We also assessed the risk of contamination as a result of performance bias, detection bias or both. About half of all studies (19 out of 34) failed to report investigations of contamination levels (e.g. for C‐RCTs, did not include spill‐over control groups); we judged them to be at unclear risk of contamination bias. Based on reported levels of contamination, we assessed six studies each to be at high and low risk of contamination bias.
Incomplete outcome data
We judged 17 studies to have high risk of attrition bias, because: they lost a considerable percentage of participants to follow‐up; the proportion of participants lost to follow‐up in the intervention group differed considerably from that in the control group; and/or the report was missing a considerable percentage of clusters, participants and/or outcome values. We judged seven studies to be at low risk of attrition bias; we considered the levels of loss to follow‐up and missing data to be unlikely to have introduced noteworthy bias. Ten studies were at an unclear risk of attrition bias due to insufficient reporting. Reporting of missing outcomes was relatively poor across the included studies (e.g. only three studies reported the number or percentage of missing participants by outcome).
Selective reporting
We judged the risk of reporting bias to be unclear for virtually all studies. Several included studies (especially C‐RCTs) have comprehensive baseline reports, but they generally did not pre‐publish study protocols that would have enabled us to check for selective reporting. We could not access the pre‐published plans for the two replication studies, as the links provided in the study records had expired (Smith 2017; Wang 2019). Only three studies had accessible, pre‐published protocols or research proposals (Grellety 2017; Haushofer 2013; Olajide 2013). They reported the pre‐specified outcomes and analyses, suggesting a perhaps low risk of bias from selective reporting. However, for one study (Haushofer 2013), the study protocol was only registered in the American Economic Association's registry for randomised controlled trials on 28 June 2013 (RCT ID: AEARCTR‐0000019), which is after data collection for the trial had occurred between 1 May 2011 and 28 February 2013.
Other potential sources of bias
Misclassification bias of the exposure variable
Four of the six CBAs and all three cohort studies may have been at risk of exposure misclassification bias. Four of these studies used self‐reported receipt of a UCT collected in surveys as the exposure variable. Validation studies have shown that survey data on receipt of publicly funded financial credits can suffer from misclassification, at least in high‐income countries (Hjollund 2007). Overall, we judged this risk of bias for these four studies to have been low, considering that the study participants were likely aware of whether they received a UCT. However, three studies assigned exposure (receipt of UCT) via proxy of household members' or residential communities' eligibility for or receipt of the UCT. We judged these exposure assignments to have a high risk of bias from misclassification. Overall, we judged this risk of bias to have been high in observational studies.
Confounding
We judged all C‐RCTs to carry a low risk of confounding. Despite some C‐RCTs having baseline differences in outcome measurements, population characteristics or both, they robustly adjusted for these differences and several key confounders using regression analyses, minimising risk.
We judged four of the six included CBAs to be at a high risk of confounding, and the other two CBAs to have a low risk of confounding. The first CBA judged at high risk of confounding compared the before‐and‐after difference in the outcomes among participants receiving the UCT (exposed group) with the before‐and‐after differences in the outcomes among participants not receiving the UCT (unexposed group) (Amarante 2011). This DD approach adjusted for confounding by underlying time trends in the outcome. However, if the underlying time trend in the unexposed group differed from that in the exposed group, then the DD estimator is confounded. Since this is conceivable, we judged the likelihood of confounding from differences in underlying time trends in the outcome to be high in this study. The study did robustly control for several key confounders and included individual fixed‐effects to adjust for time‐invariant confounding in maternal characteristics that potentially may have confounded the cash transfer‐health relationship in children. However, it did not adjust for several other potential time‐invariant confounders (e.g. caregiver's motivation and cognitive abilities) or time‐varying confounders (e.g. changes in access to health services, fertility and income over time). Therefore, we judged its risk of confounding to be high.
Three other CBAs also determined a treatment effect estimate using similar DD methods and identification strategies as described for Amarante 2011 (American Institutes for Research 2013; Galiani 2014; Salinas‐Rodríguez 2014). Again, if the underlying time trends in the unexposed group differed from the exposed group (which is plausible), then the DD estimator was at a high risk of confounding.
Finally, we judged two CBAs to be at low risk for confounding because they used strong methods for confounder adjustment (Bazzi 2012; Tiwari 2019). They also used DD methods for confounded adjustment by underlying time trends in the outcome, which may have conferred a risk of confounding. One of the studies tested and found no statistically significant differences in these underlying time trends (Tiwari 2019). The studies, however, also used inverse probability of treatment weighting in addition to robustly adjusting for several potential confounders. One of the studies also used province‐level fixed‐effects to adjust for time‐invariant confounders of the provinces (Bazzi 2012). We judged this level of adjustment to suggest a low risk of confounding.
Of the three cohort studies, we judged one to be at high risk of confounding and two to be at low risk of confounding. The cohort study judged high risk of confounding was Agüero 2007. This study used regression analysis to robustly adjust for several potential confounders and used village‐level fixed‐effects to adjust for time‐invariant confounding by geographic residency. However, it did not adjust for several other potential time‐invariant confounders (e.g. caregiver's motivation and cognitive abilities) and time‐varying confounders (e.g. changes in access to health services, fertility and income over time). The two studies we judged as low risk of confounding ‐ Hessel 2018 and Ohrnberger 2019 ‐ analysed natural experiments (Craig 2017), using instrumental variables for the UCTs of interest (Greenland 2000). A natural experiment is an event not controlled by researchers that divides a population into groups that are exposed and unexposed to an intervention (Craig 2017). In these natural experiment studies, the study authors used this observed quasi‐experimental variation to estimate the effect of the intervention on an outcome (Craig 2017). We judged the assumptions made in these studies for the instrumental variable analyses to be reasonable and the effect estimates, therefore, to have been reasonably controlled for potential confounders, similar to in a randomised experiment.
Reverse causation
Reverse causation occurs in repeated measures studies when the outcome variable at earlier time points influences the intervention value at later time points. Because C‐RCTs randomly allocate clusters to the intervention or control group, reverse causation is generally not a concern. Observational studies of genuine natural experiments should also be controlled for reverse causation, as the intervention is quasi‐randomly assigned to participants (akin to in an RCT); we judged the risk of reverse causation as low for the two included cohort studies that were natural experiment studies (Hessel 2018; Ohrnberger 2019). The other included observational studies, however, may be at risk of reverse causation; the researchers (or nature) did not assign the intervention but purely observed it. None of the included six such observational studies controlled for reverse causation. Nevertheless, we judged the risk of reverse causation to be so negligible that we appraised all observational studies to only carry a low risk.
Effects of interventions
See: Table 1; Table 2; Table 3
Unconditional cash transfer versus no unconditional cash transfer
Table 4 provides an overview of the synthesis and included study characteristics. Table 5 presents an effect direction plot for the prioritised primary outcomes.
2. Effect direction plot.
| No | Study | Study type | Population (sample size: intervention/ control)a | Intervention duration | Prioritised primary outcome | ||||||
| Use of any health services | Stunting | Death | Disease or illness | Food security | Dietary diversity | Depression | |||||
| 1 | Abdoulayi 2014 | C‐RCT | Households (3531: 1678/1853) | 24 months | ▲* | v | |||||
| 2 | Agüero 2007 | C | Children (720: 245/475) | 36 months | <> | ||||||
| 3 | Aizawa 2020b | C‐RCT | Households (3107: 1571/1536) | 24 months | |||||||
| 4 | Akresh 2012 | C‐RCT | Children (2559: 540 households in each intervention group/615 households in the control group; number of children in each condition unclear) | 32 months | ▲* | ||||||
| 5 | Amarante 2011 | CBA | Women (1,037,739: 50,939/20,872) | 1 to 32 months | |||||||
| 6 | American Institutes for Research 2013 | CBA | Households (3063: 2029/1034), Children and adults (14,575: specific number of participants per condition unclear) | 12 months | Λc | ▼ | ◄► | ^c | ▲ | ||
| American Institutes for Research 2013(1) | ▲* | ||||||||||
| American Institutes for Research 2013(2) | ▼* | ||||||||||
| 7 | Baird 2010 | C‐RCT | Children or young adults (3896: 283 in UCT/506 in CCT/1495 in the pure control group) | 12/24 months | ▲ | ▲* | ▲ | ||||
| 8 | Bazzi 2012 | CBA | Households (10,574: 1715/5301) | 12 months | ▲ | ||||||
| 9 | Beck 2015 | C‐RCT | Households (2034: 938/1096) | 8 months | ▲* | ||||||
| 10 | Cunha 2014 | C‐RCT | Households (5028; specific number of participants per condition unclear); children (4550: specific number of participants per condition unclear) | 24 months | ▼ | ▲* | |||||
| 11 | d'Errico 2020b | C‐RCT | Households (1353: 607/746) | 24 months | |||||||
| 12 | Fernald 2011 | C‐RCT | Children and adults (786: 530/256) | 18 to 27 months | ▲ | ||||||
| 13 | Galiani 2014 | CBA | Households (3477: 1144/806) | 12 months | ▲* | ||||||
| 14 | Grellety 2017 | C‐RCT | Children (1481: 734/747) | 6 months | ▲* | ||||||
| 15 | Haushofer 2013 | C‐RCT | Households (1440: 258/63) | 7 to 9 months | <> | <> | ▲* | ▲ | |||
| 16 | Hessel 2018 | C | Older adults (22,297: 5954/16,343) | 36 months | |||||||
| Hessel 2018(3) | ▼ | <> | |||||||||
| Hessel 2018(4) | ▼ | <> | |||||||||
| 17 | Huang 2016 | C‐RCT | Children (2634: 1626/1008) | 24 months | ▲* | ||||||
| 18 | Leroy 2010 | C‐RCT | Women (1904: 958/946) | 23 months | |||||||
| 19 | Luseno 2012 | C‐RCT | Children (1649: 979/670) | 12 months | ▲ | ▲ | |||||
| 20 | Miller 2008 | C‐RCT | Households (819: 408/411) | 13 months | ▼ | ||||||
| 21 | Ohrnberger 2019 | C | Children and adults (10,925: 9505/1420) | 72 months | ▲* | ▲* | |||||
| 22 | Olajide 2013 | C‐RCT | Older adults (6236: 3230/3096) | 12 months | <> | ▼ | |||||
| 23 | Oxford Policy Management 2012 | C‐RCT | Children (6800 participants: 1571/1536 households; specific number of participants per condition unclear), adults (2440 participants: 1571/1536 households; specific number of participants per condition unclear) | 24 months | ▲ | ▲ | ▼ | ▼ | ▲ | ||
| 24 | Paxson 2007 | C‐RCT | Children (2069: 79/39 parishes; number of participants per condition unclear) Mothers (2069: 79/39 parishes; number of participants per condition unclear) |
15 to 19 months | ▲ | ▼ | |||||
| 25 | Pellerano 2014 | C‐RCT | Households (3102: 1540/1562) | 26 months | ▲ | ▲* | ▲* | ▲ | |||
| Pellerano 2014(5) | ▲ | ||||||||||
| Pellerano 2014(6) | ▲ | ||||||||||
| Pellerano 2014(7) | ▲ | ||||||||||
| 26 | Robertson 2012 | C‐RCT | Children (2008: 763/637/608) | 12 months | |||||||
| 27 | Salinas‐Rodríguez 2014 | CBA | Older adults (5465: 1353/888) | ▲* | |||||||
| 28 | Schady 2012 | C‐RCT | Adults (1702: 51/26 parishes; number of participants per condition unclear) | 57 months | <> | ||||||
| 29 | Seidenfeld 2012 | C‐RCT | Households (3076: 1561/1517) | 36 months | ▲* | ▲* | ▲* | ▼ | |||
| 30 | Seidenfeld 2013 | C‐RCT | Households (2515: unclear number of households in intervention/control) | 24/30/48 months | ◄► | ▼ | ▲* | ▲* | |||
| 31 | Smith 2017b | C‐RCT | Children and young adults (3896: 283/1495) | 12 months | |||||||
| 32 | Tiwari 2019 | CBA | Households (8586: 2322/6264) | 10 months | <> | ||||||
| Tiwari 2019(8) | ▲ | ||||||||||
| Tiwari 2019(9) | ▼ | ||||||||||
| 33 | Wang 2019b | C‐RCT | Households (1440: 258/505) | 7 to 9/19 months | |||||||
| 34 | Ward 2010 | C‐RCT | Children (9231: 1540/754 pure control group) | 24 months | ▲ | ▲ | ▲* | ||||
C: cohort study; CBA: controlled before‐and‐after study; C‐RCT: cluster‐randomised controlled trial ‐ : No primary outcomes reported (1): children; (2): adults; (3): men; (4): women; (5): adults aged 18‐59 years; (6): adults aged 60 years or older; (7): children aged 17 years or younger; (8): marginally poor households; (9): extremely poor households
a Condition‐specific or effective sample size where available bIncluded study that does not contribute effect estimates to the systematic review (e.g. pure replication study) cChange within intervention group only
Direction of arrow indicates direction of effect: upward arrow, such as ▲: beneficial effect; downward arrow, such as ▼: harmful effect; sideways arrow, such as ◄►: mixed effects/conflicting findings. Size of arrow indicates sample size: large arrow, such as ▲: > 300 participants; small arrow, such as ▲:< 300 participants; underlined arrow, such as ▲: unclear number of participants
Statistical significance of effect: *: P < 0.05; empty arrow, such as Λ: statistical significance unclear
Use of health services
Registered birth
Four C‐RCTs with an effective sample size of 2376 children assessed the effect of a UCT versus no UCT on the likelihood of having ever had one's birth registered at the time of the interview among participants, when followed up either 2 to 4 months after 12 months of the intervention, or at 24 months into the intervention (Pellerano 2014; Robertson 2012; Seidenfeld 2013; Ward 2010). The treatment effects for all four studies were DD estimates of proportions, which are not accepted by Cochrane because they erroneously treat a dichotomous outcome as a continuous outcome. As recommended in the Cochrane Handbook (Chapter 23.1, Higgins 2021), we calculated an RR for each study, conducting approximately correct analyses of cluster‐RCTs using the crude frequency measures reported in the study records (see detailed description in Measures of treatment effect). We considered the four studies to be sufficiently homogeneous in study design, treatment effect estimate, population, intervention, comparator and outcome to be combined. We conducted a meta‐analysis using the Maentel‐Haezel method with random effects to adjust for heterogeneity. However, the meta‐analysis (Analysis 1.1) suggested that the studies were highly statistically heterogeneous (i.e. I² = 95%). We were not able to reduce or explain the heterogeneity. As recommended in the Cochrane Handbook (Chapter 10.10, Deeks 2020; Chapter 12.1, McKenzie 2020), we therefore decided to not report totals from the meta‐analysis and to report the results of the studies individually. Of the four included studies, we assessed two each as having some concerns for risk of bias (Robertson 2012; Seidenfeld 2013), and high risk of bias (Pellerano 2014; Ward 2010), respectively. Here, we present results from all four studies in Figure 4 and summarise results from the two studies of moderate‐certainty evidence (based on GRADE). Both studies reported small decreases in the effect of the UCT on the outcome at either 2 to 4 months after 12 months of the intervention, or at 24 months into the intervention (Robertson 2012: RR 0.92, 95% CI 0.69 to 1.23; 224 participants (effective sample size); Seidenfeld 2013: RR 0.94, 95% CI 0.77 to 1.16; 1112 participants (effective sample size)).
1.1. Analysis.

Comparison 1: Unconditional cash transfer versus no unconditional cash transfer: health services use, Outcome 1: Has ever had birth registered
4.
Has ever had birth registered
Because we reported the results from all four studies individually and assessed the certainty of the evidence at the level of the individual study, we did not assess the certainty of the body of evidence at the level of the outcome.
Growth checks
Three C‐RCTs (four studies) assessed the treatment effect of a UCT on the likelihood of having had a growth check in the previous 6 months, at a follow‐up of 15 and 27 months into the intervention (Fernald 2011; Paxson 2007; Pellerano 2014; Ward 2010). As Fernald 2011 and Paxson 2007 reported results from the same C‐RCT, we prioritised Paxson 2007, as described in the section Results of the search. Paxson 2007 reported coefficients from confounder‐adjusted probit regression models that we converted into ORs. Pellerano 2014 and Ward 2010 reported treatment effect estimates that Cochrane does not accept (i.e. DD estimates of proportions), and to ensure comparability with the estimates of the other two studies, we calculated an OR for each of these two studies, conducting an approximately correct analysis of cluster‐RCTs using the crude frequency measures reported in the study records (Chapter 23, Higgins 2021). We considered the three studies with an effective sample size of 2261 children to be sufficiently homogeneous to be combined in a meta‐analysis.
Paxson 2007 reported treatment effect estimates separately for children according to household income. These analyses compared children from poor families in the intervention group with children from poor families in the control group and compared children from non‐poor families in the intervention group with children from non‐poor families in the control group. Because these two analyses used different control groups, we included them both in the meta‐analysis, adding them as separate analyses in the forest plot.
In relative terms, the point estimate from the meta‐analysis for the treatment effect was that a UCT led to moderately higher odds of having received a growth check, but the 95% CI allowed for both a non‐meaningful change and a moderate increase in the odds (OR 1.11, 95% CI 0.98 to 1.24; I² = 0%; 3 C‐RCTs, 2261 participants (effective sample size); Analysis 1.2). In absolute terms, assuming the baseline likelihood of 450 per 1000 participants, after receiving the UCT, an estimated 468 per 1000 participants (95% CI 446 to 491) had received a growth check.
1.2. Analysis.

Comparison 1: Unconditional cash transfer versus no unconditional cash transfer: health services use, Outcome 2: Has had a growth check in previous 6 months
We applied the GRADE approach to assess the certainty of the body of evidence of these three C‐RCTs at the level of the outcome. We focused our certainty of evidence assessment on the evidence from the three C‐RCTs combined in the meta‐analysis (Analysis 1.2). We started the assessment at a rating of 'high' certainty of evidence, because this was a body of experimental studies. We then assessed the certainty of evidence along five downgrading domains: (a) study limitations (or risk of bias); (b) inconsistency (or heterogeneity); (c) indirectness; (d) imprecision; and (e) publication bias. For each domain, if we had very serious, serious or no serious concerns, we downgraded the certainty of evidence by two levels (‐2), one level (‐1) and no level (+/‐0), respectively. Because the evidence was experimental, upgrading domains were not applicable. For this outcome, we describe the assessment for each domain, but for other outcomes we only describe our assessment for the domains for which we down‐ or upgraded the certainty of evidence. Regarding study limitations, because all four studies may have been at high risk of selection or recruitment bias, or both, and lacked blinding (see risk of bias tables in Characteristics of included studies), we downgraded the certainty of evidence for serious concerns for risk of bias (‐1). Regarding consistency, the percentage of the variability in effect estimates that was due to heterogeneity rather than sampling error was very low (i.e. I² > 0%), and we therefore did not have any serious concerns and did not downgrade the certainty of evidence for inconsistency (+/‐0). Regarding imprecision, the 95% CI of the pooled effect estimate suggested that the effect may range from no change to a moderate increase in the likelihood of having a growth check, and we therefore downgraded the evidence for serious concerns in this domain (‐1). We considered the measurement to capture the outcome well and did not identify signs of publication bias. We consequently did not downgrade the certainty of evidence for either indirectness (+/‐0), or publication bias (+/‐0). In summary, starting at 'high' for experimental evidence and downgrading by two levels in total, we assessed the body of evidence for this outcome as of 'low' certainty. In conclusion, a UCT may increase the likelihood of having received a growth check, but further research is very likely to have an important impact on our confidence in the estimate of effect and is likely to change the estimate.
Up to date on vaccination calendar
Four C‐RCTs assessed the effect of a UCT on the likelihood of being up to date for all vaccinations on the immunisation calendar at 8 to 24 months into the intervention. Three studies with an effective sample size of 563 children reported treatment effect estimates as DD estimates of proportions (Pellerano 2014; Robertson 2012; Ward 2010), so we calculated an RR for each study, conducting an approximately correct analysis for C‐RCTs using the crude frequency measures reported in the study records (Chapter 23, Higgins 2021). We considered the studies to be sufficiently homogeneous to be combined in a meta‐analysis. In relative terms, the point estimate from the meta‐analysis was no meaningful change in the likelihood of being fully vaccinated, but the 95% CI suggested that the effect may lie between a moderate reduction and a moderate increase in the likelihood (RR 1.02, 95% CI 0.90 to 1.15; I² = 3%; 3 C‐RCTs, 563 participants (effective sample size); Analysis 1.3). In absolute terms, assuming a likelihood before the intervention of 648 per 1000 participants (i.e. the median risk in the control group before the intervention in the three studies), after receiving the UCT, an estimated 661 per 1000 participants (95% CI 583 to 745) were fully up to date on their vaccinations.
1.3. Analysis.

Comparison 1: Unconditional cash transfer versus no unconditional cash transfer: health services use, Outcome 3: Is up to date on vaccination calendar
Beck 2015, a C‐RCT with 2034 households (effective sample size could not be calculated due to missing frequency counts), assessed the effect of a UCT on the odds of all children in the household being completely vaccinated (i.e. with bacillus Calmette‐Guérin (BCG), diphtheria, pertussis, tetanus, polio, measles, mumps and rubella) at an age of six months to five years, when followed up eight months into the intervention. We could not include this study in the meta‐analysis because of the different participants (households, not individual participants). The point estimate was a small increase in the odds, with the 95% CI suggesting that the effect may lie between a large reduction and a large increase in the odds (OR 1.04, 95% CI 0.60 to 1.82). Because the likelihood at baseline was unclear, we could not convert the OR into an RR.
We assessed the certainty of the evidence based on the three C‐RCTs combined in the meta‐analysis (Analysis 1.3). We started our assessment at 'high' for experimental evidence, downgraded this body of evidence for serious concerns for risk of bias (‐1) and very serious concerns for imprecision (‐2), did not consider upgrading domains, and arrived at a rating of 'very low' certainty of evidence. We are very uncertain about the effect of a UCT on the likelihood of having been fully vaccinated.
Treatment for parasites
One C‐RCT (two studies) assessed the effect of a UCT on the likelihood of having been given any parasite treatment in the previous year, at 15 to 27 months into the intervention (Fernald 2011; Paxson 2007). As above, since both studies reported results from the same cluster‐RCT, we included only the results from Paxson 2007. The study reported a coefficient from a confounder‐adjusted probit regression model that we converted into an OR. We again included the two separate treatment effect estimates for children from poor and non‐poor families reported in the study record as separate analyses in a meta‐analysis. In relative terms, the point estimate for the treatment effect was a large increase in the odds, with the 95% CI suggesting that the effect may lie between a moderate and a large increase in the odds (OR 1.28, 95% CI 1.06 to 1.54; I² = 35%; 1 C‐RCT, 1478 participants). We assumed a baseline likelihood of 450 per 1000 participants (i.e. in the absence of baseline data from Paxson 2007 for this outcome, we used the likelihood in the control group before the intervention in Fernald 2011). In absolute terms, after receiving the UCT, an estimated 513 per 1000 participants (95% CI 463 to 558) had received parasite treatment in the last year. We are not aware of international standards for judging change for this outcome, but we did judge this level of change to probably be clinically meaningful. We started our certainty of evidence assessment at 'high' for the experimental evidence, downgraded this body of evidence for serious concerns for risk of bias (‐1), did not consider the upgrading domains, and arrived at a rating of 'moderate' certainty of evidence. In conclusion, a UCT probably leads to a moderate, clinically meaningful increase in the likelihood of receiving treatment for parasites. Further research is likely to have an important impact on our confidence in the estimate of effect and may change the estimate.
Use of any health service
Nine studies assessed the effect of a UCT on a broad summary measure of the likelihood of having used any health service in the previous 1 to 12 months, at 12 to 36 months into the intervention: six C‐RCTs (seven studies) with an effective sample size of 4972 participants (Abdoulayi 2014; Huang 2016; Luseno 2012; Oxford Policy Management 2012; Pellerano 2014; Seidenfeld 2013; Ward 2010), plus one CBA in 9034 households (Bazzi 2012), and one cohort study in 22,297 participants (Hessel 2018).
Because the six C‐RCTs reported treatment effect estimates as DD estimates of proportions, we calculated RRs for each study, conducting approximately correct analyses using the crude frequency measures reported in the study records (Chapter 23, Higgins 2021). The Huang 2016 study assessed the same data from the same cluster‐RCT as Ward 2010, and we prioritised the data reported in the original study (Ward 2010). Abdoulayi 2014 did not report an acceptable treatment effect estimate, and we could not source the data needed to conduct an approximately correct analysis, so we could not report an effect estimate for this study. The other five C‐RCTs that could be combined in the approximately correct analysis differed somewhat in their outcomes (i.e. has used any health service for: any condition; worst illness; illness or injury; diarrhoea; and fever, cough or diarrhoea); reporting periods (i.e. one month, three months, and one year prior to the interview); and study population (i.e. children and adults). However, we considered them sufficiently homogeneous to combine in one meta‐analysis. Pellerano 2014 reported separate treatment effect estimates for three age groups (i.e. children aged up to 17 years, adults aged 18 years to 59 years, and adults aged 60 years and over), which we included separately in the meta‐analysis (Figure 5). In relative terms, the point estimate for the treatment effect was a small increase in the likelihood of using any health service, with the 95% CI suggesting that the effect estimate may lie between no change and a small increase in the likelihood (RR 1.04, 95% CI 1.00 to 1.09; I² = 2%; 5 C‐RCTs, 4972 participants (effective sample size); Analysis 1.5). In absolute terms, assuming a risk before the intervention of 487 per 1000 participants (i.e. the median risk in the control group before the intervention reported in the five studies), after receiving the UCT, an estimated 506 per 1000 participants (95% CI 487 to 531) had used any health service.
5.

Forest plot of comparison: 1 Unconditional cash transfer compared with no unconditional cash transfer for improving health service use, outcome: 1.5 Use of any health service in previous 1 to 12 months
1.5. Analysis.

Comparison 1: Unconditional cash transfer versus no unconditional cash transfer: health services use, Outcome 5: Has used any health service in previous 1 to 12 months
The two non‐experimental studies and their results are summarised in Table 6. These studies reported no evidence that a UCT had increased an indicator of health services use.
3. Effect estimates from included studies on the use of any health service (excluded from preferred analysis).
| No | Study | Study type | Outcome measure |
Absolute effect (95% CI) |
Participants | Comments |
| 1 | Bazzi 2012 | CBA | Number of outpatient health services visits per household member in the month prior to the interview Follow‐up: 12 months into the intervention |
MD ‐0.06 visits (‐0.20 to 0.07) |
10,574 households | Better indicated by a higher value. In absolute terms, assuming a risk before the intervention of 0.20 outpatient health services visits per household member (i.e. the risk in the control group before the intervention), after receiving the UCT, a household used an estimated 0.14 outpatient health services visits (95% CI 0.00 to 0.27) per member. |
| 2 | Hessel 2018 | C | Visited the doctor Follow‐up: up to 36 months into the intervention |
For men, RC 0.01 (‐0.12 to 0.14) |
22,297 participants (older adults) | Better indicated by a higher value. The study reported no evidence for an effect of receipt of the UCT on this measure of health services use among women and men. |
| For women, RC 0.15 (‐0.06 to 0.36) |
C: cohort study; CBA: controlled before‐and‐after study; CI: confidence interval; MD: mean difference; RC: regression coefficient; UCT: unconditional cash transfer
We assessed the certainty of evidence based on the five C‐RCTs combined in the meta‐analysis (Figure 5). We started the assessment at 'high' for the experimental evidence, downgraded this body of evidence for serious concerns for risk of bias (‐1) and imprecision (‐1), did not consider upgrading domains, and arrived at a rating of 'low' certainty of evidence. A UCT may perhaps not have a meaningful effect on the likelihood of using any health service, but further research is very likely to have an important impact on our confidence in the estimate of effect and is likely to change the estimate.
Health outcomes
Stunting
Ten studies (seven C‐RCTs (eight studies), one CBA and one cohort study) assessed the effect of a UCT on the risk of being moderately stunted or a less preferable outcome measure (i.e. height for age, mean height or malnutrition). Four C‐RCTs reported an estimate for the treatment effect of a UCT on the risk of being moderately stunted at the time of the interview, at 24 months into the intervention (Abdoulayi 2014; Oxford Policy Management 2012; Seidenfeld 2013; Ward 2010). These studies used the United Nations' Children's Fund (UNICEF)'s standard measure for moderate stunting: a height‐for‐age z‐score of less than 2 standard deviations under the median height for age in the reference population (UNICEF 2015). Because they reported treatment effects as DD estimates of proportions, we sought to calculate RRs for each study by conducting approximately correct analyses using the crude frequency measures reported in the study records (Chapter 23.1, Higgins 2021). For Abdoulayi 2014, we could not retrieve or calculate an acceptable effect estimate measure. We combined the other three C‐RCTs in a meta‐analysis. In relative terms, the point estimate was no meaningful effect on the risk, but the 95% CI suggested that the effect may be between a moderate risk reduction and a moderate risk increase (RR 1.02, 95% CI 0.91 to 1.14; I² = 0%; 3 C‐RCTs, 3298 participants (effective sample size); Analysis 2.1). In absolute terms, assuming a risk before the intervention of 337 per 1000 participants, after receiving the UCT an estimated 344 per 1000 participants (95% CI 307 to 384) were moderately stunted.
2.1. Analysis.

Comparison 2: Unconditional cash transfer versus no unconditional cash transfer: health outcomes, Outcome 1: Is moderately stunted
Three C‐RCTs (four studies) reported effect estimates (or data to calculate these) for less preferable measures of stunting, along with two observational studies. These studies were too heterogeneous to be combined in a meta‐analysis, and studies found a mix of positive and negative results (see individual study results in Table 7). Of these three C‐RCTs, we judged one each to be at low risk of bias (Grellety 2017), raise some concerns for risk of bias (Fernald 2011; Paxson 2007), and have a high risk of bias (Cunha 2014), respectively (Table 7). Here, we again summarise the individual results of studies at low risk of bias and some concerns, but not those at high risk of bias. Grellety 2017 reported a very large decrease (benefit) in the risk of having not achieved or not maintained recovery from severe acute malnutrition, when followed up for six months into the intervention (hazard ratio 0.24, 95% CI 0.15 to 0.39; 1 study, 1481 participants; moderate‐certainty evidence). As Fernald 2011 and Paxson 2007 reported results from the same C‐RCT, we again prioritised Paxson 2007 (as per the section Results of the search). Paxson 2007 reported an effect estimate for change in average height‐for‐age score (MD 0.03 of 1 SD; 95% CI ‐0.07 to 0.13; 1 study, 1390 participants; low‐certainty evidence), the size of which we were not able to judge with confidence (details reported in Table 7). Two observational studies also reported evidence on an indicator of stunting, but we judged these studies to be at high risk of bias (Agüero 2007; American Institutes for Research 2013; Table 7).
4. Effect estimates from included studies on stunting (excluded from preferred analysis).
| No | Study | Study type | Outcome measure |
Absolute or relative effect (95% CI) |
Participants | Comments |
| Low risk of bias | ||||||
| 1 | Grellety 2017 | C‐RCT | Risk of having not achieved or not maintained recovery from severe acute malnutrition Follow‐up: 6 months |
HR 0.24 (0.15 to 0.39) |
1481 participants (children) | Better indicated by a lower value. In absolute terms, assuming 35 children did not achieve and maintain this recovery per 1000 children‐weeks (i.e. the incidence in the control group), after receiving the UCT, 8 children per 1000 children‐weeks did not achieve and maintain recovery (95% CI 5 to 14 children). We judged this to be a very large, clinically meaningful decrease in the risk of incident stunting (as measured through proxy of non‐recovery or non‐maintenance of recovery from severe acute malnutrition). |
| Some concerns | ||||||
| 2 | Fernald 2011 | C‐RCT | ‐ | ‐ | ‐ | Because Fernald 2011 and Paxson 2007 reported results from the same cluster‐RCT, we used the (more complete) data only from Paxson 2007 . |
| 3 | Paxson 2007 | C‐RCT | Average height‐for‐age score Follow‐up: 15 to 27 months into the intervention |
MD 0.03 of 1 SD (−0.07 to 0.13) |
1390 participants (children) | Better indicated by a higher value. The baseline height‐for‐age score was unclear, and we could not retrieve the value of 1 SD of the score; we could therefore neither convert this relative treatment effect estimate into an absolute value, nor calculate an absolute treatment effect estimate (e.g. centimetre change). However, calculating an absolute value and an absolute treatment effect estimate for a standardised, z‐transformed height‐for‐age score may not be desirable anyway, as the purpose of z‐transformation of these measures is to give the reader a sense of deviation from 'normality'. We are not aware of an internationally agreed standard on which level of change in the height‐for‐age score is sizeable or clinically meaningful and were consequently unable to confidently judge the effect size and the clinical meaningfulness of this level of change in this outcome. |
| High risk of bias | ||||||
| 4 | Cunha 2014 | C‐RCT | Average height Follow‐up: 24 months into the intervention |
MD ‐0.15 cm (‐0.99 to 0.61) |
5190 participants (children) | Better indicated by a higher value. In absolute terms, assuming a mean height before the intervention of 84.95 cm (i.e. the mean height in the control group before the intervention), after receiving a UCT, the estimated mean height was 84.80 cm (95% CI 83.96 to 85.41). |
| 5 | Agüero 2007 | C | Height‐for‐age score Follow‐up: unclear |
Mean intervention group effect estimate 0.25 of 1 SD (95% CI unclear, P < 0.05) |
1606 participants (children) | Better indicated by a higher value. We could not include the study in the meta‐analysis because it was a different study type (i.e. not a cluster‐RCT). The mean height‐for‐age score in the group that had received the UCT for two‐thirds of the duration of the three‐year nutritional window was 0.25 of 1 SD higher than the group that received a UCT for 1% of the duration of the three‐year nutritional window (95% CI unclear, P < 0.05). The mean height‐for‐age score in the control group was ‐1.08 of 1 SD. As above, it is neither possible nor useful to convert this relative treatment effect estimate into an absolute treatment effect estimate, and in the absence of internationally agreed standards on which level of change is clinically meaningful, we could not judge the clinical meaningfulness of this level of change in this outcome. |
|
Mean control group effect estimate ‐1.08 of 1 SD (95 % CI unclear) | ||||||
| 6 | American Institutes for Research 2013 | CBA | UNICEF's standard measure for moderate stunting Follow‐up: 12 months |
RR 1.33 (0.86 to 2.07) |
1331 participants (children) | Better indicated by a lower value. The study reported DDs of proportions which Cochrane does not accept. We conducted an approximately correct analysis with the counts reported in the study (Analysis 5.1). The point estimate was a moderate increase in the risk of being stunted, but the 95% CI suggested that the effect may be anywhere from a moderate reduction to a large increase in this risk. |
C: cohort study; CBA: controlled before‐and‐after study; CI: confidence interval; C‐RCT: cluster‐randomised controlled trial; DD: difference‐in‐difference estimator; HR: hazard ratio; MD: mean difference; RR: risk ratio; SD: standard deviation; UCT: unconditional cash transfer
We assessed the certainty of the evidence based on the three C‐RCTs combined in the main meta‐analysis of moderate stunting (preferable outcome measure; Analysis 2.1). We started at a rating of 'high' certainty of evidence for experimental evidence, downgraded this body of evidence for serious concerns for risk of bias (‐1) and for very serious concerns for imprecision (‐2), did not consider upgrading domains, and arrived at a final rating of 'very low' certainty of this evidence. In conclusion, we are very uncertain about the effects of UCTs on the likelihood of being moderately stunted. Further research is very likely to have an important impact on our confidence in the estimates of effect and is likely to change the estimates.
Underweight
Ten studies (eight C‐RCTs and two CBAs) assessed the effect of a UCT on the risk of being underweight or a less preferable measure (i.e. weight for age, mean weight or the risk of having a low birth weight). Four cluster‐RCTs reported the likelihood of participants being underweight at the time of the interview or at one year of age, when followed up 24 months into the intervention (Abdoulayi 2014; Oxford Policy Management 2012; Pellerano 2014; Ward 2010). These studies reported treatment effect estimates as DD estimates of proportions, and we consequently sought to calculate an RR for each study, by conducting approximately correct analyses using the crude numbers reported in the study records (Chapter 23, Higgins 2021). For Abdoulayi 2014, we could not retrieve or calculate an acceptable effect estimate measure. Of the three cluster‐RCTs with available data, the reporting period for two studies was at the time of the interview, whereas the third study measured the outcome when the child was one year old. Two studies measured the proportion of participants who were moderately underweight as per UNICEF standard definition (weight‐for‐age score less than 2 SDs under the median score in the reference population) (UNICEF 2015), whereas the third study did not specify the severity of underweight. Despite this slight heterogeneity in reporting period and outcome measurement, we considered the three studies to be sufficiently homogeneous to be combined in a meta‐analysis. In relative terms, the point estimate was no effect on the risk, with the 95% CI suggesting that the effect may have been anywhere from a large risk reduction and a large risk increase (RR 1.00, 95% CI 0.75 to 1.32; I² = 0%; 3 C‐RCTs, 701 participants; Analysis 2.2). In absolute terms, assuming a risk before the intervention in the control group of 337 per 1000, after receiving the UCT, an estimated 337 per 1000 participants (95% CI 253 to 445) were moderately underweight.
2.2. Analysis.
Comparison 2: Unconditional cash transfer versus no unconditional cash transfer: health outcomes, Outcome 2: Is moderately underweight
Four additional cluster‐RCTs reported less preferable weight measures in child participants (Cunha 2014; Grellety 2017; Leroy 2010; Seidenfeld 2013). Due to their diversity in the outcome measures, we did not combine these in a meta‐analysis (Table 8). Using vote counting based on direction of effect (Chapter 12.2, McKenzie 2020), three C‐RCTs reported a reduction in underweight (i.e. beneficial effect), and one C‐RCT reported an increase in underweight (i.e. harmful effect). Of the two observational studies (Amarante 2011; American Institutes for Research 2013), one each reported a beneficial and harmful effect on stunting (Table 8).
5. Effect estimates from included studies on underweight (excluded from preferred analysis).
| No | Study | Study type | Outcome measure |
Absolute or relative effect (95% CI) |
Participants | Comments |
| 1 | Cunha 2014 | C‐RCT | Mean weight Follow‐up: 24 months into the intervention |
MD ‐0.06 kg (0.39 to 0.27) |
5277 participants (children) | Better indicated by a higher value. The point estimate was no change in weight, but the 95% CI suggested that the effect may be anywhere between a small reduction and a small increase in mean weight. In absolute terms, considering that the mean weight in the control group before the intervention was 12.19 kg, after receiving the UCT, recipient children weighed 12.13 kg (95% CI 11.80 to 12.46). |
| 2 | Grellety 2017 | C‐RCT | Risk of having not achieved or not maintained recovery from severe acute malnutrition Follow‐up: 6 months into the intervention |
HR0.24 (0.15 to 0.39) |
1481 participants (children) | Better indicated by a lower value. We judged malnutrition to be an indicator of underweight. In relative terms, the point estimate was that the UCT, compared to no UCT, led to a decrease in the risk of children having not achieved or maintained this recovery over the 6‐month period. In absolute terms, assuming 35 children did not achieve and maintain this recovery per 1000 children‐weeks (i.e. the incidence in the control group), after receiving the UCT, 8 children per 1000 children‐weeks did not achieve and maintain recovery (95% CI 5 to 14 children). We judged this to be a very large, clinically meaningful decrease in the risk of incident underweight (as indicated through this proxy measure). |
| 3 | Leroy 2010 | C‐RCT | Mean maternal weight Follow‐up: 24 months |
MD 0.40 kg (0.01 to 0.79) |
3010 participants (adult mothers) | Better indicated by a higher value. In absolute terms, since the mean maternal weight in the control group before the UCT was 62.60 kg, the UCT would have increased it to 63.00 kg (95% CI 62.61 to 63.39). We judged this level of change to probably not be clinically meaningful. |
| 4 | Seidenfeld 2013 | C‐RCT | Weight‐for‐age score Follow‐up: 24 months |
MD 0.13 of 1 SD of the score 0.00 to 0.26 |
6285 participants (children) | Better indicated by a higher value. In absolute terms, considering that the mean weight‐for‐age score in the control group was ‐0.90 of 1 SD, after receiving the UCT, a participant would have an estimated weight‐for‐age score of ‐0.77 of 1 SD (95% CI ‐0.90 to ‐0.64). Because the value of 1 SD in the weight‐for‐age score was unclear, it was neither possible nor useful to convert this relative treatment effect estimate into an absolute treatment effect estimate. |
| 5 | Amarante 2011 | CBA CBA |
Proportion of children with low birth weight Follow‐up: 1 to 32 months into the intervention |
‐ | 68,858 participants (children) | The study reported the treatment effect estimate as a DD estimate of a proportion, and we were not able to retrieve or calculate an accepted treatment effect estimate for this study for this outcome. |
| Mean maternal weight Follow‐up: 1 to 32 months into the intervention |
DD 0.97 kg (0.17 to 1.76) |
21,374 participants (adult mothers) | Better indicated by a higher value. The study did report an acceptable estimate of maternal weight at week 35 of pregnancy, at 1 to 32 months into the intervention. The treatment effect estimate was a DD estimator of a continuous outcome, which subtracted the difference in the mean maternal weight among UCT recipients (intervention group) and UCT non‐beneficiaries (control group) prior to the UCT intervention, from the same difference in the mean maternal weight among the two groups after the UCT intervention had been initiated, to adjust for changes in the outcome over time in the control group. Because DD estimators of continuous outcomes are perhaps comparable to confounder‐adjusted MDs, Cochrane does accept them. Considering that the mean weight in the control group before the intervention was 63.26 kg, so the UCT would have increased mean maternal weight to 64.23 kg (95% CI 63.43 to 65.02). We judged this level of change to probably be clinically meaningful. | |||
| 6 | American Institutes for Research 2013 | CBA | UNICEF's standard measure for moderate underweight (i.e. a weight‐for‐age z‐score of less than 2 standard deviations under the median weight for age in the reference population) (UNICEF 2015) Follow‐up: 12 months into the intervention |
RR 1.36 (0.85 to 2.18) |
1331 participants (children) | Better indicated by a lower value. Because the study reported DDs of proportions which Cochrane does not accept, we conducted an approximately correct analysis with the counts reported in the study (Analysis 5.2). The point estimate was a moderate increase in the risk of underweight, but the 95% CI suggested that the effect may have been between a moderate risk decrease and a very large risk increase in weight‐for‐age. |
CBA: controlled before‐and‐after study; CI: confidence interval; C‐RCT: cluster‐randomised controlled trial; DD: difference‐in‐difference estimator; HR: hazard ratio; MD: mean difference; RR: risk ratio; SD: standard deviation; UCT: unconditional cash transfer
We assessed certainty of evidence based on the three cluster‐RCTs combined in the meta‐analysis of underweight (preferable outcome measure) (Analysis 2.1). We started at a rating of 'high' for experimental evidence, downgraded the body of evidence for serious concerns for risk of bias (‐1) and for very serious concerns for imprecision (‐2), did not consider upgrading domains, and arrived at a final rating of 'very low' certainty of evidence. We are very uncertain about the effect of UCTs on the likelihood of being underweight. Further research is very likely to have an important impact on our confidence in the estimates of effect and is likely to change the estimates.
Death
We found no study with evidence on the effect of a UCT on the likelihood of having died.
Disease or illness
Thirteen studies (11 C‐RCTs, one CBA and one cohort study) assessed the effect of a UCT on the likelihood of having had any illness or the likelihood of having had a specific illness in the two weeks to three months prior to the interview. Seven C‐RCTs in children and young adults reported this outcome at 12 or 24 months into the intervention (Abdoulayi 2014; Baird 2010; Cunha 2014; Huang 2016; Luseno 2012; Oxford Policy Management 2012; Pellerano 2014). All seven studies reported treatment effect estimates as DD estimates of proportions. For Baird 2010, we had access to micro‐data, which we re‐analysed to calculate an OR, adjusted for all the confounders that the original study considered (for details see Measures of treatment effect). For Cunha 2014, we received an OR estimate from the study author that was fully adjusted for all the confounders used in the effect estimate reported in the study record. For the Huang 2016 study, we received the missing standard error for the OR and could therefore include the study in the meta‐analysis. For Abdoulayi 2014, we could not source the data needed to conduct an approximate analysis with crude numbers, so we could not report an effect estimate for this study.
For the six of these C‐RCTs with available effect estimates (Baird 2010; Cunha 2014; Huang 2016; Luseno 2012; Oxford Policy Management 2012; Pellerano 2014), we conducted an approximate analysis with the crude numbers reported in the study records and estimated a crude OR (Chapter 23.1, Higgins 2021). The reporting period for the outcome differed between the studies (two weeks, one month, and three months prior to the interview). Whereas four studies included children only, the three other studies included both children and young adults. However, we considered the studies to be sufficiently homogeneous to be combined in one meta‐analysis. Figure 6 presents a forest plot of the meta‐analysis. In relative terms, the point estimate represented a very large reduction in the odds of having had any illness, with the lower and upper limits of the 95% CI also suggesting that the effect was large (OR 0.70, 95% CI 0.56 to 0.88; or RR 0.79, 95% CI 0.67 to 0.92; I² = 53%; 6 C‐RCTs, 9367 participants). In absolute terms, assuming baseline risk in the control group of 370 per 1000 participants (i.e. the median risk in the control group before the intervention in the six studies), after receiving the UCT, an estimated 292 per 1000 participants (95% CI 248 to 340) had had any illness, which we judged clinically meaningful.
6.

Forest plot of comparison: 2 Unconditional cash transfer versus no unconditional cash transfer for improving health outcomes, outcome: 2.4 Has had any illness in previous 2 weeks to 3 months.
Four other C‐RCTs reported estimates of the effect on a less preferable measure that could not be included in the meta‐analysis due to diversity in the outcome measurement (Beck 2015; Haushofer 2013; Schady 2012; Seidenfeld 2013; Table 9). For two of these C‐RCTs, we could not retrieve acceptable effect estimates or the data to calculate these. For the remaining two C‐RCTs, using vote counting, based on direction of effect, both indicated a reduction in the risk of disease or illness. Two non‐experimental studies also reported evidence on this outcome (American Institutes for Research 2013; Hessel 2018; Table 9). Based on direction of effect, one study reported a reduction in the risk of disease among children and an increase in this risk among adults, and the second study reported no evidence for an effect among adults.
6. Effect estimates from included studies on disease or illness (excluded from preferred analysis).
| No | Study | Study type | Outcome measure |
Relative effect (95% CI) |
Participants | Comments |
| 1 | Beck 2015 | C‐RCT | Likelihood of having cases of illness or injury in households that lasted more than 24 hours and needed treatment but not hospitalisation in the 3 months prior to the interview Follow‐up: 8 months into the intervention |
OR 0.54 (0.44 to 0.65) |
2034 households | Better indicated by a lower value. The effective sample size could not be calculated due to missing frequency counts. In relative terms, the point estimate represents a very large reduction in the odds, with the 95% CI suggesting that the effect may lie between a very large and a large reduction in the odds. In absolute terms, assuming the risk of 280 per 1000 participants before the intervention, after the intervention, the risk was 174 per 1000 participants (95% CI 149 to 202). We judged this considerable level of change to be clinically meaningful. |
| 2 | Haushofer 2013 | C‐RCT | Proportion of household members who had been sick or injured in the month prior to the interview Follow‐up: 10 months after the intervention |
‐ | 1327 households | Better indicated by a lower value. This study reported the treatment effect estimate as a DD of a proportion. Because we were not able to retrieve crude numbers for this study, we could not conduct approximately correct analyses and cannot report estimates. |
| 3 | Schady 2012 | C‐RCT | Likelihood of being anaemic at the time of the interview Follow‐up: 50 to 57 months into the intervention |
‐ | 1196 participants (children) | Better indicated by a lower value. This study reported the treatment effect estimate as a DD of a proportion. Because we were not able to retrieve crude numbers for this study, we could not conduct approximately correct analyses and cannot report estimates. |
| 4 | Seidenfeld 2013 | C‐RCT | Likelihood of having had an acute respiratory illness in the 2 weeks prior to the interview Follow‐up: 24 months into the intervention |
RR 0.61 (0.39 to 0.96) |
1104 participants (children) | Better indicated by a lower value. This study reported the likelihood of having had diarrhoea, fever or an acute respiratory illness in the 2 weeks prior to the interview, at 24 months into the intervention. Using the WHO Global Health Estimates to judge relative importance of the outcomes in terms of burden of disability‐adjusted life years attributable to the condition, we prioritised the estimate for the likelihood of having an acute respiratory illness, because upper and lower respiratory infections carry a larger burden of disease than diarrhoea, and fever does not adhere to any burden of disease category (WHO 2021). We could not include this study in the meta‐analysis because we judged its outcome to be too different. Because the study reported treatment effect estimates as DD estimates of proportions, we calculated an RR with approximately correct analyses using the crude numbers reported in the study records. In absolute terms, assuming a risk before the intervention of 200 per 1000 participants (i.e. the risk before the intervention in the control group), after the intervention 120 per 1000 participants (95% CI 80 to 190) had had an acute respiratory illness. We considered this considerable level of change to be clinically meaningful. |
| 5 | American Institutes for Research 2013 | CBA | Prevalence of diarrhoea, fever and/or cough over the last 2 weeks Follow‐up: 47 months |
RR 0.83, (0.77 to 0.90) | 13,022 participants (children) | Better indicated by a lower value. In absolute terms, assuming 53 of 100 children had any disease (i.e. baseline risk in the control group), after receiving a UCT, 44 of 100 children had this outcome (95% CI 41 to 48). We judged this level of change to be a clinically meaningful benefit. |
| Prevalence of any disease or injury Follow‐up: 47 months |
RR 1.09 (1.05 to 1.14) | 1158 participants (adults) | Better indicated by a lower value. In absolute terms, assuming 25 of 100 adults had any disease or injury (i.e. baseline risk in the control group), after receiving a UCT, 27 of 100 adults had this outcome (95% CI 26 to 29). Considering the relatively little change in absolute terms, we judged this level of change to perhaps be not clinically meaningful. | |||
| 6 | Hessel 2018 | C | Self‐reported health problems (defined as any illness, accident, dental problem or any other health problem) in the past month Follow‐up: 36 months into the intervention |
For women, RC ‐0.01 (‐0.05 to 0.03) |
22,297 participants | This cohort study of a natural experiment with 22,297 participants (older adults) reported regression coefficients from an instrumental variable analysis for the effect of receipt of a UCT, compared with no receipt of a UCT, on having had any self‐reported health problems (defined as any illness, accident, dental problem or any other health problem) in the last month, separately for female and male participants. The study reported no evidence for an effect of receipt of the UCT on this measure of having had any illness among women, nor among men. |
| For men, RC 0.01 (‐0.03 to 0.05) |
C: cohort study; CBA: controlled before‐and‐after study; CI: confidence interval; C‐RCT: cluster‐randomised controlled trial; DD: difference‐in‐difference estimator; OR: odds ratio; RC: regression coefficient; RR: risk ratio; UCT: unconditional cash transfer
Our certainty of evidence assessment was based on the six C‐RCTs combined in the meta‐analysis (Figure 6). We started at a rating of 'high' certainty of evidence for experimental evidence, downgraded the body of evidence for serious concerns for risk of bias (‐1), did not consider upgrading domains, and arrived at a final rating of 'moderate' certainty of evidence. In conclusion, a UCT probably leads to a large, clinically meaningful reduction in the likelihood of having had any illness. Further research is likely to have an important impact on our confidence in the estimate of effect and may change the estimate.
Food security
Eleven studies (nine C‐RCTs (ten studies) and one CBA) assessed the likelihood of being food secure or the level of food security at the time of the interview over the one month prior to the interview. Five C‐RCTs (six studies) with an effective sample size of 7588 households reported a single measure of the likelihood of being food secure, at 13 to 36 months into the intervention (Abdoulayi 2014; Miller 2008; Oxford Policy Management 2012; Pellerano 2014; Seidenfeld 2012). The measures used to capture food security were whether the household had: eaten two or more meals per day (Abdoulayi 2014; Seidenfeld 2012); at least one member who had gone without adequate food for more than eight days per month (Miller 2008); been food insecure in the worst recent food shortage period (reverse coded in this review) (Oxford Policy Management 2012); and not had enough food to meet its needs at least for 1 out of 12 months (reverse coded in this review) (Pellerano 2014). We nevertheless considered these studies to be sufficiently homogeneous and combined them in a meta‐analysis (Figure 7). In relative terms, the point estimate for the treatment effect was a large increase in the likelihood of being food secure, with the 95% CI suggesting that the effect estimate may lie between a moderate increase and a large increase in the likelihood (RR 1.25, 95% CI 1.09 to 1.45; I² = 85%; 5 C‐RCTs, 2687 households (effective sample size)). In absolute terms, assuming a risk before the intervention of 710 per 1000 participants (i.e. the median risk in the control group before the intervention reported in the five C‐RCTs), after receiving the UCT, an estimated 875 per 1000 participants (95% CI 774 to 1030) were food secure.
7.

Has been food secure in previous month
The other three C‐RCTs examined the effect of a UCT on different outcomes (often a composite index of food security) or did not report an effect estimate accepted by Cochrane (or the data to calculate it) (Haushofer 2013; Olajide 2013; Seidenfeld 2013; Table 10). The two C‐RCTs with reportable estimates but diverse outcome measurements identified a reduction in food security. The CBA reported what we judged to be probably a clinically meaningful increase in food security, indicating a potential benefit from this UCT (American Institutes for Research 2013; Table 10).
7. Effect estimates of included studies on food security (excluded from preferred analysis).
| No | Study | Study type | Outcome measure |
Absolute effect (95% CI) |
Participants | Comments |
| 1 | Haushofer 2013 | C‐RCT | Non‐standard, non‐validated household food security index measure Follow‐up: 7 to 9 months into the intervention and up to 10 months after 9 months of intervention |
Unclear | 2140 households | Better indicated by a higher value. The food security index was constructed as the weighted average of the proportions of household members going to sleep hungry and not eating protein in the week prior to the interview, with the score ranging from 0.00 to 1.00). Because we were not able to retrieve crude numbers for this study and its replication study, we could not conduct approximately correct analyses and cannot report an estimate from this study. |
| 2 | Olajide 2013 | C‐RCT | Mean score of a non‐standard, non‐validated food security index at the time of the interview Follow‐up: 12 months into the UCT intervention |
MD ‐0.43 points (‐0.68 to 0.18) |
6236 participants (older adults) | Better indicated by a higher value. The food security index was constructed using a number of questions (not reported) regarding food intake over the previous six months. |
| 3 | Seidenfeld 2013 | C‐RCT | HFIAS Follow‐up: 24 months into the intervention |
DD 0.50 points (0.26 to 0.74) |
2289 households | Better indicated by a lower value. In absolute terms, assuming a score before the intervention of 15.10 (i.e. the average score in the study sample before the intervention), after receiving a UCT, a household reported a score of 15.60 (95% CI 15.36 to 15.84). We are not aware of international standards for judging change in this score but nevertheless consider this level to probably be a clinically meaningful decrease in food security, indicating a potential harm from the UCT. |
| 4 | American Institutes for Research 2013 | CBA | HFIAS Follow‐up: 47 months into the intervention |
DD ‐2.55 points (95% unclear, P < 0.01) |
2553 households | Better indicated by a lower value. We judged this point estimate to indicate a large increase in food security. In absolute terms, assuming a HFIAS score before the intervention of 14.05, after receiving a UCT, a household reported a score of 12.50 (95% CI not calculable). We are not aware of international standards for judging change in the HFIAS score but nevertheless consider this level to probably be a clinically meaningful increase in food security, indicating a potential benefit from this UCT. |
CBA: controlled before‐and‐after study; CI: confidence interval; C‐RCT: cluster‐randomised controlled trial; DD: difference‐in‐difference estimator; HFIAS: Household Food Insecurity Access Scale (Coates 2007); MD: mean difference; UCT: unconditional cash transfer
We assessed the certainty of the evidence based on the five C‐RCTs combined in the meta‐analysis on the likelihood of being food secure (Figure 7). We started at a rating of 'high' for experimental evidence, downgraded the body of evidence for serious concerns for risk of bias (‐1) and inconsistency (‐1), did not consider upgrading domains, and arrived at a final rating of 'low' certainty of evidence. In conclusion, a UCT may increase the likelihood of being food secure, and further research is very likely to have an important impact on our confidence in the estimate of effect and is likely to change the estimate.
Dietary diversity
Thirteen studies (nine C‐RCTs (12 studies), plus one CBA) reported an estimate of the effect of a UCT on the level of dietary diversity or a related measure. Four cluster‐RCTs in 9347 households estimated the effect of a UCT on the standard, validated Household Dietary Diversity Score (HDDS; Kennedy 2011), at 24 months into the intervention (Oxford Policy Management 2012; Pellerano 2014; Seidenfeld 2013; Ward 2010). An increase in the HDDS indicates an increase in dietary diversity. All four studies reported a DD estimate as the treatment effect estimate, but studies used somewhat different HDDS, and we standardised the score to ensure comparability across the four studies. We considered these studies to be sufficiently homogeneous to be combined in a meta‐analysis. Figure 8 presents the forest plot of the meta‐analysis (preferred analysis). The point estimate was a moderate increase in the HDDS score, with the 95% CI suggesting that the effect estimate may be between a small increase and a moderate increase in the score (DD 0.41 of 1 SD, 95% CI 0.12 to 0.69; I² = 79%; 4 cluster‐RCTs, 9347 households). In absolute terms, assuming an SD of 1.46 (i.e. the SD reported for the Pellerano 2014 study), then a UCT increased the score by an estimated 0.59 food categories (95% CI 0.18 to 1.01). The international guidelines for analysing the HDDS note that there is no international standard for judging change in the HDDS (Kennedy 2011), but considering that the pooled absolute treatment effect estimate suggests an average increase in food diversity by 0.59 food categories, we considered this moderate level of change probably to be clinically meaningful.
8.

Forest plot of comparison: 2 Unconditional cash transfer versus no unconditional cash transfer for improving health outcomes, outcome: 2.6 Dietary diversity (Household Dietary Diversity Score) in previous week.
The other five C‐RCTs could not be included in the main meta‐analysis because they studied different populations (study participants versus households) or used diverse measurements for the outcome, or both (Baird 2010; Fernald 2011; Haushofer 2013; Miller 2008; Seidenfeld 2013; Table 11). Using vote counting based on direction of effect separately for the two populations, both of the two studies of individual study participants reported an increase in dietary diversity, and of the three studies of households, two reported an increase and one reported a decrease in a measure of dietary diversity. For the CBA, we judged the follow‐up period to likely be too long after the (short) intervention for the effect estimates to be informative (Table 11).
8. Effect estimates from included studies on dietary diversity (excluded from preferred analysis).
| No | Study | Study type | Outcome measure |
Relative effect (95% CI) |
Participants | Comments |
| 1 | Baird 2010 | C‐RCT | Average number of days participant had eaten protein‐rich food over the last week Follow‐up: 24 months into the intervention |
MD 0.59 days (0.15 to 1.02) |
2080 participants (children and adults) |
Better indicated by a higher value. In absolute terms, assuming the mean number before the intervention was 3.95 days per week (i.e. the mean number in the control group before the intervention), after the intervention, a participant had on average eaten protein‐rich food 4.54 days per week (95% CI 4.10 to 4.97). We considered this level of change to be a clinically significant benefit. |
| 2 | Fernald 2011 | C‐RCT | Composite index of number of food types consumed Follow‐up: 18 to 27 months into the intervention |
MD 0.06 of 1 SD (‐0.08 to 0.20) | 1196 participants (children) | Better indicated by a higher value. The authors constructed this composite index using principal components analysis on whether children had eaten any of a list of 11 food items. The relevant food items included both nutritious foods (e.g. liver, chicken, pasta and/or bread, spinach and/or chard, carrots, citrus fruits and non‐citrus fruits) and those with less nutritive value (e.g. ice cream and/or soda, potato chips, cookies and/or crackers, and candy). While this measure has some commonalities with the standard HDDS, we considered it to be too different to be combined with the HDDS, and the study participants were children rather than households. In absolute terms, assuming the mean score before the intervention was ‐0.10 of 1 SD (i.e. the median score in the control group before the intervention), after receiving the UCT, the score was ‐0.04 of 1 SD (95% CI ‐0.28 to 0.10). Since the value of 1 SD was unclear, we were not able to convert this estimate into an absolute value, such as change in the HDDS score. |
| 3 | Haushofer 2013 | C‐RCT | Average number of times the household had eaten meat or fish over the last week Follow‐up: between 7 months into the 9‐month intervention and 10 months after its completion |
DD 0.73 (0.30 to 1.16) |
1372 households | Better indicated by a higher value. In absolute terms, assuming the mean number before the intervention was 2.41 times per week (i.e. the mean number in the control group before the intervention), a household had eaten meat or fish 3.14 times per week (95% CI 2.71 to 3.57) after the intervention. We considered this level of change to also be a clinically significant benefit. |
| 4 | Miller 2008 | C‐RCT | HDDS Follow‐up: at 13 months into the intervention |
DD ‐0.10 (‐0.34 to 0.13) | 819 households | Better indicated by a higher value. Because we could not retrieve an SD to standardise this estimate, we could not include this study in the meta‐analysis. The study records reported DD estimates that were unadjusted for clustering, but we received an estimate from the principal study author that was. |
| 5 | Seidenfeld 2012 | C‐RCT | Has eaten meat or fish 5 or more times over last month Follow‐up: 36 months into the intervention |
RR 2.66 (2.10 to 3.35) |
2970 households | Better indicated by a higher value. This study reported a DD estimate of the proportion of households who had eaten meat or fish 5 or more times in the last month. Because Cochrane does not accept this effect estimate, we calculated the RR in an approximately correct analysis. In this analysis, compared with not receiving a UCT, having received a UCT led to a large increase in the likelihood of having eating meat or fish 5 or more times over the last month, when followed up 36 months into the intervention. |
| 6 | Tiwari 2019 | CBA | HDDS Follow‐up: 25 to 29 months after 10 months of the intervention |
DD 0.00 (‐0.03 to 0.03) |
8586 households | Better indicated by a higher value. The point estimate represents no change in the score among extremely poor households (Analysis 5.5). As also acknowledged by the study author, we judged the follow‐up period to likely be too long after the (short) intervention for the effect estimates to be informative. |
CBA: controlled before‐and‐after study; CI: confidence interval; C‐RCT: cluster‐randomised controlled trial; DD: difference‐in‐difference estimator; HDDS: Household Dietary Diversity Score (Kennedy 2011); MD: mean difference; RR: risk ratio; SD: standard deviation; UCT: unconditional cash transfer
Our certainty of evidence assessment focused on the four C‐RCTs in the preferred meta‐analysis of the HDDS (Analysis 2.1). We started at a rating of 'high' for experimental evidence, downgraded the body of evidence for serious concerns for risk of bias (‐1) and inconsistency (‐1), did not consider upgrading domains, and arrived at a final rating of 'low' certainty of evidence. A UCT may increase the level of dietary diversity, and further research is very likely to have an important impact on our confidence in the estimate of effect and is likely to change the estimate.
Depression
Eleven studies (five C‐RCTs (seven studies), three CBAs and one cohort study) assessed the mean score achieved on a psychometric test of level of depression at the time of the interview (Abdoulayi 2014; American Institutes for Research 2013; Fernald 2011; Haushofer 2013; Galiani 2014; Ohrnberger 2019; Olajide 2013; Paxson 2007; Salinas‐Rodríguez 2014; Seidenfeld 2012). We considered these studies to be too heterogeneous across populations (study participants versus households) and too diverse in outcome measures to be combined in a meta‐analysis, or we did not have the required data to pool them, or both. We tabulated each study's effect estimate by study type (Table 12). In summary, using vote counting based on direction of effect (Chapter 12.2, McKenzie 2020), but separately for the two populations, all three C‐RCTs of individual study participants reported a decrease in level of depression, and the one C‐RCT of households reported an increase in level of depression. The population of the fifth C‐RCT was unclear, and it reported a decrease in level of depression (Abdoulayi 2014). Additionally, two CBAs reported a decrease and one an increase in level of depression. The cohort study reported a decrease in depression level. We assessed the certainty of evidence based on the body of experimental evidence from the five C‐RCTs (Table 12). We started at 'high' certainty, downgraded the body of evidence for serious concerns for risk of bias (‐1) and inconsistency (‐1), and for very serious concerns for imprecision (‐2). We arrived at a rating of 'very low' certainty of evidence. In conclusion, we are very uncertain about the effect of a UCT on the level of depression.
9. Effect estimates from included studies on depression (excluded from preferred analysis).
| No | Study | Study type | Outcome measure |
Absolute effect (95% CI) |
Participants | Comments |
| 1 | Abdoulayi 2014 | C‐RCT | CES‐D score Follow‐up: 24 months into the intervention |
MD ‐1.02 points (95% CI unclear, P > 0.05) |
Unclear | Better indicated by a lower value. |
| 2 | Fernald 2011 | C‐RCT | ‐ | ‐ | ‐ | Because Fernald 2011 and Paxson 2007 reported results from the same cluster‐RCT, we used the (more complete) data only from Paxson 2007. |
| 3 | Haushofer 2013 | C‐RCT | CES‐D score Follow‐up: 7 to 9 months into the 9‐month intervention and up to 10 months after its completion |
DD 1.26 points (‐0.27 to 2.79) |
667 households | Better indicated by a lower value. In absolute terms, assuming the mean CES‐D before the intervention was 26.48 points out of 60.00 points (i.e. the mean score in the control group before the intervention), after the intervention, the score was 27.74 points (95% CI 26.21 to 29.27). |
| 4 | Olajide 2013 | C‐RCT | GDS score Follow‐up: 12 months into the intervention |
MD ‐0.04 points (‐0.37 to 0.29) |
6236 participants (older adults) | Better indicated by a lower value. |
| 5 | Paxson 2007 | C‐RCT | CES‐D score (z‐transformed) Follow‐up: 15 to 47 months into the intervention |
MD ‐0.06 of 1 SD (‐0.25 to 0.13) |
1044 participants | Better indicated by a lower value. We combined the estimates for adults from poor families and those from non‐poor families in a meta‐analysis. The study reported neither the baseline average in this outcome, nor the value of 1 SD, so we were unable to calculate and present an absolute treatment effect estimate. |
| 6 | Seidenfeld 2012 | C‐RCT | CES‐D score Follow‐up: 36 months into the intervention |
DD ‐0.54 points (95% CI unclear, P > 0.05) |
2217 participants (young people) | Better indicated by a lower value. |
| 7 | American Institutes for Research 2013 | CBA | CES‐D score Follow‐up: 47 months into the intervention |
DD 0.56 points (95% CI unclear, P > 0.05) |
2282 participants (young people) | Better indicated by a lower value. |
| 8 | Galiani 2014 | CBA | GDS score Follow‐up: 7 to 9 months into the UCT intervention |
DD ‐0.42 points (‐0.76 to ‐0.09) |
1950 participants (older adults) | Better indicated by a lower value. In absolute terms, assuming the mean GDS score before the intervention was 3.82 points out of 30 points (i.e. the mean score in the control group before the intervention), after the UCT, the score was 3.40 (95% CI 3.06 to 3.73). Although we are not aware of international standards to judge this level of change, we considered that the change, which exceeded 10% of the pre‐intervention score, was likely be clinically meaningful. |
| 9 | Salinas‐Rodríguez 2014 | CBA | GDS score Follow‐up: up to 24 months into the intervention |
DD ‐0.06 points (‐0.12 to ‐0.01) |
5465 participants (older adults) | Better indicated by a lower value. |
| 10 | Ohrnberger 2019 | C | CES‐D score Follow‐up: up to 72 months into the intervention |
MD ‐0.82 points (‐0.28 to ‐1.36) |
10,925 participants | Better indicated by a lower value. For comparability with the other studies, because the study authors reported effect estimates for a reverse‐coded CES‐D score, we reversed the direction of the reported effect estimates back to the original direction. |
C: cohort study; CBA: controlled before‐and‐after study; CES‐D: Center for Epidemiologic Studies Depression Score (Eaton 2004); CI: confidence interval; C‐RCT: cluster‐randomised controlled trial; DD: difference‐in‐difference estimator; GDS: Geriatric Depression Scale (Yesavage 1982); MD: mean difference; SD: standard deviation
Social determinants of health
Livestock ownership
Five studies (four C‐RCTs and one CBA) assessed livestock ownership at the time of the interview or in the year prior to the interview, at 24 to 36 months into the intervention (Abdoulayi 2014; American Institutes for Research 2013; Oxford Policy Management 2012; Pellerano 2014; Seidenfeld 2012). All five studies reported treatment effect estimates as DD estimates of proportions of participants who owned livestock, so we calculated an RR for each of these studies, conducting approximately correct analyses using the crude numbers reported in the study records (Chapter 23.1, Higgins 2021). Three of these studies defined the outcome as ownership of any livestock. The other two studies defined the outcome as ownership of individual types of livestock, of which we prioritised the measure of ownership of the largest livestock; namely, goats or sheep over pigs, chickens and ducks or geese in Abdoulayi 2014, and cattle over pigs, goats, chickens and ducks in Seidenfeld 2012. Despite this difference in outcome definition, we considered all four studies to be sufficiently homogeneous to be combined in a meta‐analysis. However, the meta‐analysis (Analysis 3.1) suggested that the studies were highly statistically heterogeneous (I² = 91%), and as recommended in the Cochrane Handbook (Chapter 10.10, Deeks 2020; Chapter 12.1, McKenzie 2020), we report the results of the individual studies. Of the four included C‐RCTs, we assessed Abdoulayi 2014 as having a low risk of bias, Seidenfeld 2013 as raising some concerns for risk of bias, and two as a high risk of bias (Oxford Policy Management 2012; Pellerano 2014). Here, we present results from all four studies in Figure 9 and summarise results from the two studies with moderate‐ and low‐certainty evidence (based on GRADE). Abdoulayi 2014 reported that a UCT led to a very large increase in the likelihood of owning a goat or sheep, compared with no UCT, when followed up at 36 months into the intervention (RR 2.15, 95% CI 1.45 to 3.21; 1 study, 371 participants (effective sample size); moderate‐certainty evidence). Seidenfeld 2012 reported no evidence for an effect of a UCT, compared with no UCT, on the likelihood of owning any livestock at 24 months into the intervention (RR 1.00, 95% CI 0.29 to 3.44; 1 study, 909 participants (effective sample size); low‐certainty evidence).
3.1. Analysis.
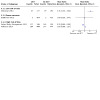
Comparison 3: Unconditional cash transfers versus no unconditional cash transfers: social determinants of health, Outcome 1: Owns livestock in previous year
9.

Owns livestock in previous year
The American Institutes for Research 2013 CBA of 3300 households also reported no evidence of any effect of a UCT, compared with no UCT, on the likelihood of owning any livestock, at 47 months into the intervention (RR 1.02, 95% CI 0.97 to 1.08).
School attendance
Nine studies (eight cluster‐RCTs with an effective sample size of 16,821 children, plus one CBA) reported an estimate for the effect of a UCT on the likelihood of children attending school at the time of the interview. The cluster‐RCTs reported this outcome at 12 to 36 months into the intervention (Abdoulayi 2014; Baird 2010; Oxford Policy Management 2012; Pellerano 2014; Robertson 2012; Seidenfeld 2012; Seidenfeld 2013; Ward 2010), using treatment effect estimates not accepted by Cochrane (i.e. DD estimator or MDs of a proportion), so we calculated RRs for these studies, conducting approximately correct analyses using the crude numbers reported in the study records (Chapter 23.1, Higgins 2021). The outcome differed slightly across these eight studies (e.g. attendance measurement: currently attends, has ever attended or did not miss school last month; institution type: any school, preschool, primary school or secondary school). However, we nevertheless considered the studies to be sufficiently homogeneous to be combined in one meta‐analysis. Moreover, Abdoulayi 2014 reported counts separately for children aged 3 to 5 years and 6 to 17 years; Robertson 2012 reported counts separately for children aged 6 to 12 years and 13 to 17 years; Seidenfeld 2012 reported counts separately for children aged 5 to 6, 7 to 10, 11 to 14, and 15 to 17 years; and Ward 2010 reported counts separately for children aged 4 to 5 years and 6 to 17 years. For better transparency, we report them separately in the forest plot (Figure 10). In relative terms, the point estimate showed a moderate increase in the likelihood of attending school, with the 95% CI suggesting that the effect was between a small and a large increase in the likelihood (RR 1.06, 95% CI 1.04 to 1.09; I² = 0%; 8 cluster‐RCTs, 7136 participants (effective sample size); moderate‐certainty evidence). In absolute terms, assuming a mean in the control group of 676 attenders per 1000 children (i.e. the median across the six studies with such data), after receiving the UCT, an estimated 717 per 1000 children (95% CI 703 to 737) attended school. We judged this considerable level of change to be clinically meaningful.
10.

Forest plot of comparison: 3 Unconditional cash transfers versus no unconditional cash transfers for improving social determinants of health, outcome: 3.2 Attends school.
One CBA in 14,333 children reported an effect estimate of a UCT on the proportion of children who had dropped out of school (i.e. the inverse of those attending school) (Bazzi 2012). Because the study reported treatment effects that Cochrane does not accept (i.e. DD estimates of proportions) and we could not calculate an acceptable treatment effect estimate for this study, we do not report results from this study for this outcome.
Our certainty of evidence assessment focused on the eight C‐RCTs in the meta‐analysis (Figure 10). We started at a rating of 'high' for experimental evidence, downgraded the body of evidence for serious concerns for risk of bias (‐1) only, and did not consider upgrading domains. We arrived at a final rating of 'moderate' certainty of evidence. In conclusion, a UCT probably leads to a clinically meaningful, moderate increase in the likelihood of children attending school. Further research is likely to have an important impact on our confidence in the estimate of effect and may change the estimate.
Participation in the labour force
Eleven studies (seven C‐RCTs and four CBAs) assessed the effect of a UCT on the likelihood of working at the time of the interview. We considered that three C‐RCTs with an effective sample size of 4148 participants (2449 children and 1700 adults), reporting outcomes at 24 or 36 months into the intervention, were sufficiently homogeneous to be combined in a meta‐analysis (Analysis 3.3: Oxford Policy Management 2012; Pellerano 2014; Ward 2010). We conducted separate analyses by age for children and adults. Ward 2010 reported counts separately for children aged 4 to 5 years and 6 to 17 years. Because none of these studies counted the same people twice in their analyses, we combined them in the same meta‐analysis, but for better transparency, we report them separately in the forest plot.
3.3. Analysis.

Comparison 3: Unconditional cash transfers versus no unconditional cash transfers: social determinants of health, Outcome 3: Works
Among children, the point estimate showed that the UCT led to a large reduction in the likelihood of children engaging in child labour, but the 95% CI suggested that the true effect may lie between a very large reduction and a very small increase in the likelihood (RR 0.91, 95% CI 0.80 to 1.03; I² = 0%; 3 C‐RCTs, 2448 participants). A fourth C‐RCT, the Seidenfeld 2012 study, reported no evidence for differences in child labour between recipient and non‐recipients of a UCT, at 36 months into the intervention (effect estimate and 95% CI not reported, P > 0.05, number of participants not reported). We assessed the certainty of evidence in the meta‐analysis for this subgroup based on the three C‐RCTs in the meta‐analysis (Analysis 3.3) as follows: we started at a rating of 'high' certainty of evidence, downgraded for serious concerns for risk of bias (‐1) and very serious concerns for imprecision (‐1), did not consider upgrading, and arrived at a rating of 'very low' certainty for this body of evidence for children.
Among adults, the point estimate showed that the UCT led to no change in the likelihood of working, with the 95% CI suggesting that the true effect may lie between a small increase and a small reduction in the likelihood of working (RR 1.00, 95% CI 0.95 to 1.06; I² = 13%; 2 C‐RCTs, 1700 participants). Moreover, the three other C‐RCTs (Haushofer 2013; Olajide 2013; Seidenfeld 2013), along with the four CBAs (Amarante 2011; American Institutes for Research 2013; Bazzi 2012; Galiani 2014), reported a treatment effect estimate that Cochrane does not accept (i.e. a DD of a proportion). We were unable to retrieve acceptable treatment effect estimates or the data to calculate these and cannot report estimates from these studies. For this adult subgroup, we assessed the certainty of evidence based on the two C‐RCTs in the meta‐analysis (Analysis 3.3). We started at a rating of 'high' certainty of evidence, downgraded for serious concerns for risk of bias (‐1) and very serious concerns for imprecision (‐2), did not consider upgrading, and arrived at the rating of 'very low' certainty for this body of evidence for adults. As such, we are very uncertain about the effect of a UCT on the likelihood of adults working.
Parenting quality
Two C‐RCTs (three studies) assessed the effect of a UCT on the level of parenting quality. The first C‐RCT (reported in two studies) had a sample size of 2314 participants (all adult mothers) and reported the standard, validated Home Observation Measurement of the Environment Inventory (HOME) score (see Bradley 1977), at 15 to 27 months into the intervention (Fernald 2011; Paxson 2007). We only used data from Paxson 2007, which reported results for the entire study sample rather than only a selection. Paxson 2007 standardised treatment effect estimates by dividing through 1 SD. Again, we included the estimates for adults from poor families and those from non‐poor families separately in the meta‐analysis (Analysis 3.4). In relative terms, the point estimate showed a very small increase in the HOME score, but the 95% CI suggested that the effect may be between a small reduction and a small increase in the score (MD 0.09 of 1 SD of the score, 95% CI ‐0.25 to 0.42; I² = 40%; 1 C‐RCT, 1118 participants). Assuming an SD of 2.30 of the HOME score (i.e. the mean score in the control group before the intervention in the Fernald 2011 study, in the absence of the score from the Paxson 2007 study), the relative effect estimate was an increase in the score by 0.22 (95% CI ‐0.60 to 1.01). In absolute terms, assuming a HOME score before the intervention of 2.40 (i.e. as per the Fernald 2011 study, given the lack of baseline data from Paxson 2007), after the intervention, the score was 2.62 (95% CI 1.80 to 3.41). The second C‐RCT studied 5670 households and reported the effect of a UCT on the likelihood of supporting their child's learning at 24 months (Seidenfeld 2013). However, the study reported a treatment effect estimate as a DD of a proportion, so we cannot report an estimate from this study. We therefore focused our assessment of the certainty of evidence on the evidence from the Paxson 2007 study. Starting at 'high' certainty for this experimental evidence, we downgraded this body of evidence for serious concerns for risk of bias (‐1) and very serious concerns for imprecision (‐2), and did not consider upgrading domains. Our final rating of the certainty of this evidence was 'very low'. In conclusion, we are very uncertain about the effect of a UCT on the level of parenting quality.
3.4. Analysis.

Comparison 3: Unconditional cash transfers versus no unconditional cash transfers: social determinants of health, Outcome 4: Level of parenting quality (Home Observation Measurement of the Environment Score) (standard deviations)
Extreme poverty
Five studies (all C‐RCTs), with an effective sample size of 9184 households, assessed the effect of a UCT on the likelihood of being extremely poor at 24 or 36 months into the intervention. Because all these C‐RCTs reported treatment effect estimates as DD estimates of proportions, we calculated RRs for each study, conducting approximately correct analyses of cluster‐RCTs (Chapter 23.1, Higgins 2021). The included studies used different approaches and definitions of extreme poverty, ranging from 'living on USD 1 or less per day' and 'living below the absolute poverty line'. We nevertheless considered the studies to be sufficiently homogeneous to be combined in one meta‐analysis (Figure 11). In relative terms, the point estimate showed that the UCT led to a large reduction in risk, with the 95% CI suggesting that the effect may be between a very large and a small reduction in the risk (RR 0.92, 95% CI 0.87 to 0.97; I² = 63%; 6 cluster‐RCTs, 3805 participants). In absolute terms, assuming a mean of 812 households living in extreme poverty per 1000 households (the median baseline risk in the control group across included studies with such data), after receiving the UCT, an estimated 747 per 1000 households (95% CI 706 to 788) were extremely poor. We judged this considerable level of change to be clinically meaningful. Starting at 'high' certainty of evidence, we downgraded this body of evidence to 'low' certainty, because we had serious concerns for risk of bias (‐1) and inconsistency (‐1), and did not consider upgrading. In conclusion, a UCT may reduce the risk of recipients being extremely poor. Further research is likely to have an important impact on the estimate of effect and may change the estimate.
11.

Forest plot of comparison: 3 Unconditional cash transfers versus no unconditional cash transfers: social determinants of health, outcome: 3.5 Is extremely poor.
Expenditure on health care
Nine studies (eight C‐RCTs and one CBA) assessed the effect of a UCT on the amount of money spent on health care over the month prior to the interview, at 7 to 36 months into the intervention. We considered these studies to be too diverse in their outcome measures to be combined in a meta‐analysis. The studies used different currencies to assess this expenditure. We tabulated each study's effect estimate by study type (Table 13). In summary, using vote counting based on direction of effect (Chapter 12.2; McKenzie 2020), six C‐RCTs reported an increase in healthcare expenditure, and two C‐RCTs reported a decrease in this outcome. The CBA reported an increase in health care expenditure.
10. Effect estimates from included studies on health care expenditure.
| No | Study | Study type | Outcome measure |
Absolute effect (95% CI) |
Participants | Comments |
| 1 | Abdoulayi 2014 | C‐RCT | Total amount of money spent on health over an unclear period Follow‐up: 24 months |
DD MWK ‐11.78 (95% CI unclear, P > 0.05) |
3244 households | Better indicated by a higher value. |
| 2 | Cunha 2014 | C‐RCT | Total amount of money spent on medicine and hygiene over a month Follow‐up: 24 months |
DD MXN 14.60 (‐5.12 to 34.32) |
4923 households | Better indicated by a higher value. |
| 3 | Haushofer 2013 | C‐RCT | Medical expenditure over a month Follow‐up: 7 to 9 months into the intervention and up to 10 months after 9 months of intervention |
DD USD 0.21 (‐0.08 to 0.50) |
1440 households | Better indicated by a higher value. |
| 4 | Oxford Policy Management 2012 | C‐RCT | Average per‐person health expenditure per household over a month Follow‐up: 24 months |
DD KSH 12 (95% CI unclear, P > 0.05) |
3107 households | Better indicated by a higher value. |
| 5 | Pellerano 2014 | C‐RCT | Average amount of money spent on health over a month Follow‐up: 24 months |
DD LSL ‐1.03 (95% CI unclear, P > 0.05) |
3102 households | Better indicated by a higher value. In absolute terms, assuming a mean expenditure of ZMW 2.24 before the intervention (i.e. the amount that all study participants spent before the intervention), after the UCT, the healthcare expenditure was ZMW 3.62. We judged this likely to be a clinically meaningful effect. |
| 6 | Seidenfeld 2012 | C‐RCT | Healthcare expenditure over an unclear period Follow‐up: 36 months |
DD ZMW 1.38 (95% CI unclear, P < 0.05) | 2969 households | Better indicated by a higher value. |
| 7 | Seidenfeld 2013 | C‐RCT | Healthcare expenditure over an unclear period Follow‐up: 48 months |
DD ZMW 1.08 (95% CI unclear, P < 0.05) | 2515 households | Better indicated by a higher value. In absolute terms, assuming a mean expenditure of ZMW 2.60 per month before the intervention (i.e. the amount that all study participants spent before the intervention), after the UCT, the healthcare expenditure was ZMW 3.68 per month. We judged this likely to be a clinically meaningful effect. |
| 8 | Ward 2010 | C‐RCT | Average health expenditure per person over a month Follow‐up: 24 months |
KSH 17.16 (95% CI unclear, P < 0.05) |
9231 children | Better indicated by a higher value. In absolute terms, assuming a mean monthly expenditure of KSH 48.89 before the intervention (i.e. the amount that the control group spent before the intervention), after the UCT, the monthly healthcare expenditure was KSH 66.05. We judged this likely to be a clinically meaningful benefit. |
| 9 | American Institutes for Research 2013 | CBA | Total amount of money spent on health and hygiene per person over a month Follow‐up: 47 months |
DD ZWD 0.11 (95% CI unclear, P > 0.05) | 2540 households | Better indicated by a higher value. |
CBA: controlled before‐and‐after study; CI: confidence interval; C‐RCT: cluster‐randomised controlled trial; DD: difference‐in‐difference estimator; KSH: Kenyan shilling; LSL: Lesotho loti; MWK: Malawian kwacha; MXN: Mexican peso; USD: United States dollar; ZMW: Zambian kwacha; ZWD: Zimbabwean dollar
We focused our certainty of evidence assessment on the experimental evidence from the eight C‐RCTs. Starting at 'high' certainty for experimental evidence, we downgraded for serious concerns for risk of bias (‐1) and inconsistency (‐1) and did not upgrade. We rated the evidence as of 'low' certainty. In conclusion, a UCT may lead to an increase in the amount of money spent on health care. Further research is very likely to have an important impact on our effect estimate and is likely to change the estimate.
Effects on equity in use of health services and health outcomes
None of the included studies estimated the effect of a UCT on measures of absolute or relative inequality in the use of health services or health outcomes, such as the MD or RR of the treatment effect in participants who are disadvantaged versus those who are not. However, several studies reported treatment effect estimates for two or more subgroups defined by population characteristics along the PROGRESS‐Plus categories of: age, education, gender, rural‐urban residency, and income (or poverty status) (Cochrane Methods Equity Group 2022). We examined these analyses to indirectly draw conclusions on the effects of UCTs on equity in terms of health services use and health outcomes. If possible, we conducted formal tests of subgroup differences using RevMan Web 2020. We found that the effects of UCTs on health equity were very uncertain.
Stunting
Three C‐RCTs reported treatment effect estimates on stunting or the related measure of height for age, disaggregated by dimensions of inequality along PROGRESS‐Plus (Cochrane Methods Equity Group 2022). Fernald 2011 reported that a UCT had no effect on the height‐for‐age score in participants who resided in rural areas (MD ‐0.09 of 1 SD, 95% CI ‐0.36 to 0.18) or in urban areas (MD 0.13 of 1 SD, 95% CI ‐0.11 to 0.37), and a test for subgroup differences likewise found no evidence for a statistically significant subgroup differences by rural‐urban residency (P = 0.23) (Analysis 4.1). Similarly, Paxson 2007 also found no evidence for any differences (test for subgroup differences: P = 1.00) in treatment effect estimates on the outcome in participants living in poverty (MD 0.04 of 1 SD, 95% CI ‐0.12 to 0.20) versus those not living in poverty (MD 0.04 of 1 SD, 95% CI ‐0.06 to 0.14; Analysis 4.2). Abdoulayi 2014 reported treatment effect estimates for the likelihood of being stunted disaggregated by sex, but these were DD estimates of proportions which Cochrane does not accept. We did not have the data needed to conduct approximately correct analyses with crude numbers for these disaggregated analyses, and we therefore cannot report effect estimates for this outcome by sex and cannot draw conclusions of the UCT's impact on inequalities in stunting by sex. In summary, this evidence suggests that UCTs perhaps did not have a meaningful effect on health inequalities in height for age by rural/urban residency or income poverty status, but the evidence remains sparse and very uncertain.
4.1. Analysis.
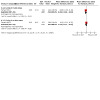
Comparison 4: Unconditional cash transfer versus no unconditional cash transfer: health equity, Outcome 1: Height for age (standard deviations) by rural‐urban residency, currently
4.2. Analysis.

Comparison 4: Unconditional cash transfer versus no unconditional cash transfer: health equity, Outcome 2: Height for age (standard deviations) by income poverty status, currently
Disease or illness
Five studies (three C‐RCTs, one CBA and one cohort stud) reported treatment effect estimates on the risk of being ill, disaggregated along PROGRESS‐Plus variables. One C‐RCT reported that a UCT reduced the risk of illness equally in both girls (RR 0.70, 95% CI 0.55 to 0.90) and boys (RR 0.69, 95% CI 0.54 to 0.88) in the two weeks to three months prior to the interview, with a test for subgroup differences finding no evidence for statistically significant subgroup differences in this outcome by gender (Pellerano 2014; P = 0.89; Analysis 4.4). The second C‐RCT reported treatment effect estimates for the outcome, disaggregated by sex and poverty status, as DD estimates of proportions (Abdoulayi 2014). Since Cochrane does not accept these effect estimates and we did not have the data needed to conduct approximately correct analyses, we cannot report disaggregated effect estimates for this outcome. The Huang 2016 C‐RCT reported that a UCT reduced the risk of illness among boys (regression coefficient 0.41, 95% CI not reported, P < 0.01), but not among girls (regression coefficient 0.89, 95% CI not reported, P > 0.05). The study did not report a formal test for subgroup differences, and we also could not conduct such a subgroup analysis to determine if there is evidence for a statistically significant difference. Approximately correct analyses from counts reported in the American Institutes for Research 2013 CBA found that a UCT, compared with no UCT, had led to a moderate reduction in the risk of having any disease among children (RR 0.83, 95% CI 0.77 to 0.90; 13,022 participants) and a moderate increase in the risk of any disease or injury among adults (RR 1.09, 95% CI 1.05 to 1.14; 1158 participants; Analysis 5.3). Our subgroup analysis by age (children versus adults) found that these effect estimates' difference was statistically significantly (test for subgroup differences P < 0.01). Since children had a much higher baseline risk of any illness than adults (0.53 versus 0.25), the differential effect of UCTs may have contributed to a reduction in inequalities by age, indicating a potential benefit of a UCT for equality in this health outcome. The cohort study, Hessel 2018, reported no evidence for an effect of receipt of the UCT on having had any illness among women (regression coefficient ‐0.01, 95% CI ‐0.05 to 0.03) and among men (regression coefficient 0.01, 95% CI ‐0.03 to 0.05). The study did not report a formal test for subgroup differences, and we also could not conduct such a subgroup analysis to determine if there is evidence for a statistically significant difference. In summary, this evidence suggests that UCTs may perhaps have improved equality in this outcome by age and not have impacted health inequalities in the outcome by sex, but this body of evidence remains very uncertain.
4.4. Analysis.

Comparison 4: Unconditional cash transfer versus no unconditional cash transfer: health equity, Outcome 4: Has had any illness in previous 2 weeks to 3 months by gender
5.3. Analysis.

Comparison 5: Additional analyses, Outcome 3: Has had any illness in previous 2 weeks to 3 months
Food security
Three C‐RCTs reported treatment effect estimates disaggregated by dimensions of inequality along PROGRESS‐Plus. Haushofer 2013 reported very uncertain evidence for whether a UCT had an effect on the food security index among women (DD 0.27 of 1 SD, 95% CI ‐1.49 to 2.03) and men (DD 0.23 of 1 SD, 95% CI ‐1.53 to 1.99), and a test for subgroup differences found no evidence for a statistically significant subgroup difference by rural‐urban residency (P = 0.97; Analysis 4.5). Oxford Policy Management 2012 and Pellerano 2014 reported separate treatment effect estimates for participants residing versus not residing in income poverty, but they used DD estimates of proportions, which are not acceptable to Cochrane. Moreover, we were not able to source the data required to calculate accepted treatment effect estimates ourselves. All of this evidence is very uncertain.
4.5. Analysis.
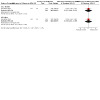
Comparison 4: Unconditional cash transfer versus no unconditional cash transfer: health equity, Outcome 5: Food security index by gender
Dietary diversity
Five studies (four C‐RCTs and one CBA) reported treatment effect estimates disaggregated by dimensions of inequality along PROGRESS‐Plus. Of the four C‐RCTs, the first, Fernald 2011, reported very uncertain evidence for whether a UCT had a differential effect on household dietary diversity in participants residing in rural areas (MD 0.20 of 1 SD, 95% CI ‐0.07 to 0.47) versus urban areas (MD ‐0.03 of 1 SD, 95% CI ‐0.30 to 0.24), and a test for subgroup differences found no evidence for a statistically significant subgroup difference by rural‐urban residency (P = 0.25; Analysis 4.6). The second C‐RCT, Haushofer 2013, reported that the impact of the UCT on the HDDS among women was a DD estimate of 0.60 food categories (95% CI 0.07 to 1.13), whereas for men it was a DD estimate of 0.14 food categories (95% CI ‐0.37 to 0.65; Analysis 4.7). Similarly, the test for subgroup differences found no statistically significant difference between groups (P = 0.22). The third C‐RCT, Oxford Policy Management 2012, reported that the impact of the UCT on the HDDS in households living in poverty was a DD estimate of 0.71 food categories (95% CI unclear, P > 0.05), whereas for households not living in poverty it was a DD estimate of 0.22 food categories (95% CI unclear, P > 0.05). Given that the 95% CIs of the DD treatment effect estimates were unclear, we were not able to formally test for differences in effect by poverty status in this study. The fourth C‐RCT, Ward 2010, reported that the impact of the UCT on the HDDS among households living in poverty was a DD estimate of 1.04 food categories (95% CI 1.04 to 1.04), whereas for households not living in poverty it was a DD estimate of 0.56 food categories (95% CI 0.54 to 0.58; Analysis 4.8). The increase in the HDDS among households living in poverty was larger than for those not living in poverty (test for subgroup differences: P < 0.001). The baseline scores of the HDDS by poverty status were unclear, but if we assume that the HDDS was lower among the group living in poverty at baseline, which seems like a reasonable assumption, then the UCT reduced inequities in dietary diversity measured using the HDDS. In summary, this body of evidence suggested that UCTs may have reduced inequalities in dietary diversity by income poverty status by improving the outcome more among those living in income poverty than among those not living in poverty.
4.6. Analysis.

Comparison 4: Unconditional cash transfer versus no unconditional cash transfer: health equity, Outcome 6: Dietary diversity (Household Dietary Diversity Score) in previous week by rural‐urban residency
4.7. Analysis.

Comparison 4: Unconditional cash transfer versus no unconditional cash transfer: health equity, Outcome 7: Level of dietary diversity (Household Dietary Diversity Score) in previous week by gender
4.8. Analysis.

Comparison 4: Unconditional cash transfer versus no unconditional cash transfer: health equity, Outcome 8: Level of dietary diversity (Household Dietary Diversity Score) in previous week by income poverty status
The CBA, Tiwari 2019, reported that a UCT did not have an impact on the HDDS for households living in extreme poverty (MD ‐0.01 scores, 95% CI not reported, P > 0.05), or for households not living in extreme poverty (MD 0.01 scores, 95% CI not reported, P > 0.05). The study did not report the results of a test for subgroup differences, and we did not have the data required to conduct a subgroup analysis ourselves. Thus, we cannot judge if there are any subgroup differences by poverty status in this outcome in this study.
Overall, the evidence suggested that UCTs may perhaps not have impacted inequalities in dietary diversity by rural‐urban residency or by gender. However, all of this evidence is very uncertain.
Depression
Three C‐RCTs assessed the level of depression, as measured with the 60‐point Center for Epidemiologic Studies Depression (CES‐D) score and disaggregated by dimensions of inequality along PROGRESS‐Plus. Fernald 2011 reported very uncertain evidence for whether a UCT had a differential effect on depression in participants residing in rural (MD 0.26 points, 95% CI ‐2.01 to 2.53) versus urban areas (MD 1.16 points, 95% CI ‐1.00 to 3.32), and a test for subgroup differences found no evidence for a statistically significant subgroup difference by rural‐urban residency (P = 0.57; Analysis 4.9). Haushofer 2013 reported that the impact of the UCT among women was a DD estimate of ‐2.44 points on the CES‐D (95% CI ‐4.20 to 0.68), whereas among men it was a DD estimate of ‐1.15 points (95% CI ‐2.72 to 0.42; Analysis 4.10). However, the test for subgroup differences found no statistically significant difference by gender (P = 0.28). Paxson 2007 reported evidence for whether a UCT had an effect on the CES‐D score among participants living in poverty (MD ‐0.21 points, 95% CI ‐0.52 to 0.10) versus not living in poverty (MD 0.00 points, 95% CI ‐0.18 to 0.18), but a test for subgroup differences found no evidence for a statistically significant difference between groups (P = 0.25; Analysis 4.11). The evidence suggested that UCTs may not have impacted inequalities in depression by rural‐urban residency, gender or income poverty status. This body of evidence remains very uncertain.
4.9. Analysis.
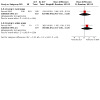
Comparison 4: Unconditional cash transfer versus no unconditional cash transfer: health equity, Outcome 9: Level of depression (Center for Epidemiologic Studies Depression Score) by rural‐urban residency
4.10. Analysis.
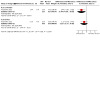
Comparison 4: Unconditional cash transfer versus no unconditional cash transfer: health equity, Outcome 10: Level of depression (Center for Epidemiologic Studies Depression Score) by gender
4.11. Analysis.

Comparison 4: Unconditional cash transfer versus no unconditional cash transfer: health equity, Outcome 11: Level of depression (Center for Epidemiologic Studies Depression Score) by income poverty status
Unconditional cash transfers versus conditional cash transfers
None of the three included studies that measured the effect of UCTs versus CCTs measured the impact of UCTs compared to CCTs on stunting, death, food security or depression.
Use of health services
Registered birth
One C‐RCT with an effective sample size of 239 participants assessed the effectiveness of a UCT versus a CCT on the likelihood of having ever had one's birth registered, at two to four months after a 12‐month intervention (Robertson 2012). Because the study reported a treatment effect estimate that is not accepted by Cochrane (i.e. MD estimate of a proportion), we calculated an RR for this analysis using approximately correct analyses of cluster‐RCTs, using frequency data extracted from the study record (Chapter 16.3, Higgins 2011). The point estimate showed a large reduction in the likelihood of having had one's birth registered, with the 95% CI suggesting that the effect may lie between a large reduction and a very small increase in the risk (RR 0.81, 95% CI 0.64 to 1.03). We downgraded the certainty of this evidence to 'very low' for our serious concerns for risk of bias (‐1) and very serious concerns for imprecision (‐2). In conclusion, we are very uncertain about the effect of a UCT versus a CCT on the likelihood of having ever had one's birth registered.
Up to date on vaccination calendar
One C‐RCT with an effective sample size of 235 participants reported the effectiveness of a UCT versus a CCT on vaccination rates, at two to four months after a 12‐month intervention (Robertson 2012). Because the study reported a treatment effect estimate as an MD estimate of a proportion, we calculated RRs for the study, conducting approximately correct analyses of cluster‐RCTs using the crude numbers reported in the study records (Chapter 16.3, Higgins 2011). The point estimate was no meaningful change in the likelihood of being fully vaccinated, with the 95% CI suggesting that the effect may lie between a moderate reduction and a moderate increase in the risk (RR 0.99, 95% CI 0.86 to 1.14). We downgraded this evidence to 'very low' certainty of evidence for serious concerns for risk of bias (‐1) and very serious concerns for imprecision (‐2). In conclusion, we are very uncertain about the effect of a UCT compared with a CCT on the likelihood of being fully vaccinated.
Use of any health service
One C‐RCT in 2559 children assessed the effect of a UCT versus a CCT on the number of routine preventive health service visits made over the previous two weeks to one month, at eight months after a 24‐month intervention (Akresh 2012). The CCT was provided conditional on children aged 0 to 6 years receiving one growth check at a local health clinic every three months and on children aged 7 to 15 years being enrolled at school and attending school for 90% of the time every quarter year. In relative terms, the point estimate showed a moderate reduction in the number, with the 95% CI suggesting that the effect may lie between a large and a small reduction (MD ‐0.51 visits, 95% CI ‐0.83 to ‐0.19). In absolute terms, assuming a number of 1.02 visits per two‐week to one‐month period before the intervention (i.e. the number in the group receiving the CCT before the intervention), the number after the intervention was 0.51 visits (95% CI 0.09 to 0.83). We judged this level of change to probably be clinically meaningful. We downgraded the certainty of the body of evidence to 'low' for serious concerns for risk of bias (‐1) and serious indirectness (‐1). In conclusion, UCTs may decrease the likelihood of having used any health services, compared with CCTs. Further research is very likely to have an important impact on our confidence in the estimate of effect and is likely to change the estimate.
Health outcomes
Disease and illness
One C‐RCT in 3896 children and young adults assessed the effect of a UCT versus a CCT on the likelihood of having been ill in the previous two weeks, at 12 months into the intervention (Baird 2010). The study reported a treatment effect estimate as an MD estimate of proportions, but we had access to the micro‐data from this study. Therefore, we re‐analysed these data, calculating an OR adjusted for all the confounders that were adjusted for in the original study (for details, see the Methods). The point estimate showed a moderate increase in the odds of having been ill, with the 95% CI suggesting that the effect may lie between a moderate reduction and a large increase in the odds (OR 1.21, 95% CI 0.92 to 1.56; RR 1.11, 95% CI 0.95 to 1.25). We downgraded this body of evidence to 'very low' certainty for serious concerns for risk of bias (‐1) and very serious concerns for imprecision (‐2). We are very uncertain of the effect of a UCT compared with a CCT on the likelihood of having had any illness.
Dietary diversity
One C‐RCT in 3896 children and young adults assessed the effect of a UCT versus a CCT on the current level of dietary diversity as measured by the number of times participants ate protein‐rich food in the week prior to the interview, at 12 months into the intervention (Baird 2010). The point estimate showed a very small reduction in the number, with the 95% CI suggesting that the effect may be between a large reduction and a large increase in the number (MD ‐0.06 times per week, 95% CI ‐0.55 to 0.44 times). We downgraded the certainty of this body of evidence to 'very low' for serious concerns for risk of bias (‐1), serious concerns for indirectness (‐1 ), and very serious concerns for imprecision (‐2). We are very uncertain of the effect of a UCT compared with a CCT on the level of dietary diversity.
Discussion
Summary of main results
We included 34 studies (25 studies of 20 cluster‐RCTs, six CBAs, and three cohort studies) involving 1,140,385 participants (45,538 children, 1,094,847 adults) and 50,095 households in Africa, the Americas and South‐East Asia, and meta‐analysed or narratively summarised the results, although no single outcome was measured by all studies. The studied UCTs were pilot or established government programmes or research experiments. They provided cash of a value equivalent to 1.3% to 53.9% of the annualised gross domestic product per capita. The comparator in all studies was no UCT, and three studies additionally assessed a CCT. Most studies were funded by national governments or international organisations, or both.
UCTs compared to no UCT may not have impacted the likelihood of having used any health service in the previous 1 to 12 months, at 12 to 24 months into the intervention. They probably led to a clinically meaningful, very large reduction in the likelihood of having had any illness in the previous two weeks to three months, at 12 to 24 months into the intervention. UCTs may have led to a moderate to large increase in the likelihood of having been food secure over the previous month, at 13 to 36 months into the intervention. UCTs may have increased the level of dietary diversity over the previous week, as assessed by the Household Dietary Diversity Score (HDDS) at 24 months into the intervention. Despite several studies providing relevant evidence, the effects of UCTs on the likelihood of being moderately stunted and on the level of depression remain uncertain. No evidence was available on the effect of a UCT on the likelihood of having died. UCTs probably led to a clinically meaningful, moderate increase in the likelihood of currently attending school, at 12 to 24 months into the intervention. UCTs may have also reduced the likelihood of households being extremely poor, at 12 to 36 months into the intervention. The evidence was uncertain for whether UCTs impacted livestock ownership, participation in child labour, adult employment and parenting quality. UCTs may have increased the amount of money spent on health care at 7 to 36 months into the intervention. The effects of UCTs on health equity were very uncertain. We did not identify any harms from UCTs.
Three cluster‐RCTs also reported evidence on the impact of a UCT compared with a CCT on the likelihood of having used any health services, the likelihood of having had any illness, and/or the level of dietary diversity, but this evidence was very uncertain. None of these studies measured the likelihood of stunted growth, death, food security or depression.
Overall completeness and applicability of evidence
The current body of evidence is sufficient to address the principal review objective in only a few outcome domains. Existing evidence covers a large number of children and adults in 15 LMICs in three World Health Organization (WHO) regions. Although UCTs have been introduced in the WHO Africa region relatively recently (Garcia 2012), we positively note the several included studies that evaluate their health effects in this region and especially in Kenya and Malawi. However, more evidence is required for the effects of UCTs in the Eastern Mediterranean, South‐East Asia and the Western Pacific. The included studies cover UCTs with a broad range of diverse designs. Evidence on the effects of UCTs on the use of health services should be expanded and improved in quality. This review found evidence that a UCT may not have impacted the likelihood of a recipient having used any health services, but that, at the same time, a UCT lead to a large decrease in the likelihood of a participant having had any illness. Studies that estimated the effect of a UCT on health services use generally did not adjust for the prevalence of illnesses, and consequently the evidence may perhaps suggest an increase in health services use per illness. Evidence on health outcomes achieves better coverage of a more diverse set of relevant outcomes from several relevant outcome domains. However, no evidence was available on the outcome of mortality, and more evidence is required for important outcome domains with inconsistent or insufficient evidence, such as stunting, food security, dietary diversity and depression. Some studies have performed a few subgroup analyses along selected PROGRESS‐Plus categories; predominantly education, gender, geographic residency and level of income or poverty (Cochrane Methods Equity Group 2022). More such subgroup analyses are required to more thoroughly and comprehensively determine equity impacts of UCTs, especially along less studied PROGRESS‐Plus categories such as income. However, studies that estimate the effects of UCTs on measures of absolute and relative inequalities as primary outcomes are ultimately needed to strengthen the evidence on whether and how UCTs influence health equity in LMICs.
The current body of evidence is less sufficient for addressing the secondary review objectives. Evidence on the social determinants of health covers several relevant domains, and it is considerable in size and certainty with regard to education. However, more evidence is required on the determinants with very uncertain evidence (e.g. livestock ownership, child labour, adult employment and parenting quality). It is worth noting that the current body of evidence for the effect of UCTs on poverty is also still of low certainty, despite almost all UCTs included in this review aiming to reduce poverty. Similarly, evidence on the effect of UCTs on health care expenditure requires further strengthening. Evidence for determining the relative effectiveness of UCTs compared with CCTs is limited to three studies in total and one study only per outcome, and several additional studies are likely required to move this body of evidence to a conclusive status.
Quality of the evidence
For the seven most important prioritised primary outcomes (i.e. outcomes related to the use of health services and health outcomes) and prioritised comparisons of UCTs versus no UCTs, the body of evidence was of moderate certainty for one outcome, of low certainty for three outcomes, of very low certainty for two outcomes, and completely absent for one outcome. For the seven prioritised secondary outcomes of comparisons of UCTs versus no UCTs (i.e. social determinants of health and health expenditure), the evidence was of moderate certainty for one outcome, of low certainty for one outcome and of very low certainty for five outcomes. All three outcomes with data for comparisons of UCTs versus CCTs had very low‐certainty evidence. Therefore, the current body of evidence supports some conclusions regarding the principal review objective (i.e. for outcomes of moderate or low certainty), but it is not possible to draw a conclusion for many other outcomes. Even where evidence is present, there is often still considerable uncertainty around it, and future studies may potentially change our conclusions.
This review included a large number of studies that covered over 1 million participants. The experimental design of most included studies (25 out of 34) was a methodological strength of this body of evidence. However, the review had an overall high risk of bias (especially selection and performance bias, but also attrition bias). In particular, because UCT interventions disburse a visible good (i.e. cash), studies cannot blind participants to these interventions. This is, however, a limitation for reviewing almost all social interventions, and especially those that are disbursed by governments or other public agencies. Studies should publish a priori study protocols so that future reviews can thoroughly assess bias from selective reporting.
The existing evidence was relatively consistent for some outcomes, such as the likelihood of having had any illness and of having attended school, but it was highly inconsistent for many others, including the level of household dietary diversity. Primary studies and future updates of this review could formally explore or even quantify effect modification, as a means of better understanding inconsistency in highly inconsistent bodies of evidence. Estimated treatment effects showed acceptable or even good precision for the small number of outcomes that had evidence from several C‐RCTs, relatively common events and relatively large (effective) sample sizes. However, for most outcomes, treatment effects were still relatively imprecise.
Potential biases in the review process
We applied the ROBIS (Risk Of Bias In Systematic reviews) tool to assess potential biases in our review process (Whiting 2016). One concern regarding study eligibility criteria was that we had to further specify some of our pre‐defined eligibility criteria, and – in some rare instances – make changes to our pre‐defined criteria (see Differences between protocol and review). The reason was that when we conducted the original review (Pega 2017), we realised that we had insufficiently or incorrectly specified a small number of criteria in our protocol (Pega 2014). In this updated review, we strictly followed the criteria as refined in this original systematic review. We are confident that the eligibility criteria that we applied were appropriate for the review question and unambiguous, and that restrictions in eligibility criteria based on study characteristics and information sources were also appropriate. While we acknowledge that the few and relatively minor differences in inclusion and exclusion criteria between protocol and original and updated review may have potentially introduced some bias in the review process, overall we judged this to be a minor concern, with low risk of having introduced noteworthy bias.
We have some confidence in our selection and identification of studies. Our search included an appropriate and broad range of databases for published and unpublished study records, and we employed additional methods to identify relevant records. The terms and structure of the search strategy should have retrieved as many eligible studies as feasible, and our search had no restriction based on date, publication format or language. An independent reference librarian, who is not an author of this review, conducted all academic and several of the grey literature database searches. However, we note that almost half of the studies included in this review were published in inaccessible grey literature – generally, discussion or working papers written by economists or reports to governmental, international or nongovernmental organisations prepared by private consultancy firms. Considering the inaccessibility of this literature, it is possible and perhaps even likely that the review missed eligible studies. Another potential source of bias in the review is that we were unable to source some missing data for several studies, and if these missing data were not missing at random, then they may have introduced bias in this review. Also, we excluded studies that did not report a primary outcome in their study record but did not check whether the authors collected (but did not report) eligible outcomes. If authors systematically did not report treatment effect estimates for eligible outcomes for which they did not find desirable effects, then our review would have missed these results, and this could perhaps have introduced bias in this review. Despite acknowledging these caveats, we nevertheless judged these concerns overall to be more likely indicative of low risk in our review process.
We believe that we made all possible efforts to minimise errors in our data collection and that sufficient study characteristics are probably available to us and to the readers to enable interpretation of the results of the review. Our risk of bias assessment applied standard Cochrane tools and relied on independent assessments from two or more review authors, and it should thus have been appropriate and reduced errors whenever possible. Given the very large number of potentially relevant study results reported in some study records, we cannot be absolutely certain that we were able to collect all relevant results for use in the synthesis, but this is probably of low concern.
Our synthesis included all appropriate studies, and we reported all pre‐defined analyses or explained departures from them. Generally speaking, we believe the synthesis was appropriate given the nature and similarity in the research questions, study designs, and outcomes across included studies. One exception is that we combined UCTs in meta‐analyses that varied considerably in their generosity (i.e. between 1.3% and 53.9% of GDP per capita), which may well have introduced heterogeneity in such meta‐analyses. However, research suggests that higher amounts of cash transfer do not always lead to stronger effects on social outcomes (Baird 2011; Filmer 2011). Between‐study variation (heterogeneity) was sometimes large or even very large, but we carefully addressed high levels of heterogeneity in the synthesis where they were observed; for example, by not reporting totals from meta‐analyses and instead synthesising the evidence narratively. The relatively small number of studies per meta‐analysis prohibited us from being able to assess the robustness of our findings through funnel plotting, sensitivity analyses or other similar analyses. Because several of the included studies used erroneous analytic methods and treatment effects (e.g. DD estimates of dichotomous outcomes that are not defined in health research), we were forced to conduct approximately correct analyses from crude frequency measures and produce crude treatment effects for almost all cluster‐RCTs. That we combined these crude treatment effects with each other or with adjusted treatment effects may have introduced risk of confounding in the pooled treatment effects. Several included studies had a high risk of bias; however, we attempted to address this in the synthesis wherever feasible. Overall, we nevertheless judged these potential and actual issues to probably cause low concerns, but we cannot fully preclude high concerns.
In judging the potential risk of bias in the review process based on the above described and quantified concerns, we believe that our interpretation of the findings probably addressed most, if not all, of the identified concerns. We believe that we considered the relevance of the included studies to the review's research question appropriately, and we avoided emphasising results on the basis of their statistical significance. In conclusion, we therefore judge the potential risk of bias in the review process probably to be low overall, with a few caveats that we have here acknowledged openly.
Agreements and disagreements with other studies or reviews
We are not aware of any previous reviews that have synthesised evidence specifically on the effects of UCTs intended to reduce poverty and vulnerabilities on the use of health services and health outcomes. Compared with our original systematic review (Pega 2017), the body of evidence has expanded substantially, from 21 to 34 included studies. However, the only noteworthy difference in results is that the original systematic review found very uncertain evidence on the outcome of extreme poverty, whereas the updated review found low certainty evidence that a UCT, when compared with no UCT, may reduce the likelihood of being extremely poor.
Our review findings confirm those of a previous systematic review that UCTs improve schooling outcomes in LMICs (Baird 2013). Previous reviews examining cash transfers and their effect on the use of health services or health outcomes, or both, in LMICs, generally included either CCTs only (Gaarder 2010; Lagarde 2009), or a broader set of cash transfers that combined UCTs with CCTs and sometimes even also with other financial interventions, such as microfinancing or public works interventions (Adato 2009; Arnold 2011; Awojobi 2020; Bassani 2013; Boccia 2012; Cooper 2020; Durão 2020; De Walque 2017; Ekezie 2017; Heise 2013; Leite 2019; Manley 2013; Manley 2020; McGuire 2022; Owusu‐Addo 2019; Pettifor 2012; Richterman 2018; Siddiqi 2018; Sridhar 2006; Zimmerman 2021). The Durão 2020 Cochrane Review reported evidence syntheses of the effect of any type of UCT on stunting, wasting, food security and dietary diversity; these findings are not comparable with those reported in the current review, because Durão 2020 combined evidence on the effectiveness of UCTs for reducing poverty or vulnerabilities (reviewed in our original Cochrane Review of Pega 2017 and this update of it) with that on the effectiveness of UCTs for assistance in humanitarian disasters (reviewed in our other Cochrane Review: Pega 2015a). These previous reviews also generally included a broader set of study types, including designs that Cochrane Reviews generally exclude due to their high risk of bias, such as cross‐sectional studies. For these reasons, we judge the findings of these previous reviews to not be comparable with those of this review.
Authors' conclusions
Implications for practice.
The existing body of evidence, which is based on several cluster‐randomised controlled trials (C‐RCTs), suggests that unconditional cash transfers (UCTs) have probably had a large, clinically meaningful, beneficial effect on the likelihood of having had any illness, and a moderate, probably clinically meaningful, beneficial effect on the likelihood of having attended school. UCTs may have also had a beneficial effect on food security, dietary diversity, extreme poverty and the amount of money spent on health care, but they may not have impacted the likelihood of having used any health service. The evidence remains uncertain for the effect of UCTs on stunting, depression, livestock ownership, participation in child labour, adult employment and parenting quality. We did not identify any harms of UCTs. The effect of UCTs on health equity are very uncertain. The relative effectiveness of UCTs compared with conditional cash transfers (CCTs) also remains uncertain with regard to the level of dietary diversity, as well as the likelihood of having used any health service and of having had any illness. No studies measured other relevant outcomes for this comparison.
Implications for research.
The body of evidence on the effect of UCTs for reducing poverty or vulnerabilities is rapidly growing. Nevertheless, more evidence from experimental studies is required to improve this currently still limited and overall still relatively uncertain body of evidence. Randomised controlled trials (RCTs) of individual participants would be preferable over RCTs of clusters of individuals. However, we acknowledge that randomising individual participants may not always overcome the challenge of contamination, and cluster‐RCTs are therefore likely to continue to be the dominant study design of choice. All future experimental studies of the impact of UCTs on health or health‐related outcomes should always publish comprehensive a priori study protocols, both to reduce risk of bias from selective reporting in the study itself and to enable systematic reviewers to judge the risk of reporting bias. Future experimental studies should also comprehensively assess contamination (e.g. by using spill‐over control groups) to reduce risk of bias from contamination. Similarly, study records should improve reporting of blinding of participants, study personnel and outcome assessors to enable robust assessment of likelihood of performance and detection bias. In addition, natural experiments of UCTs are also increasingly being used to estimate UCTs' effectiveness. For UCTs for which experimental study designs are not financially, operationally or otherwise feasible, such quasi‐experimental studies present promising options for epidemiological and econometric health impact evaluations (Craig 2017; Cantoni 2020).
The use of robust analytical methods is central to further advancing the existing body of evidence. If economists who conduct studies of the effect of UCTs on health services use, health outcomes, social determinants of health, healthcare expenditure or health equity want to contribute to health research and policy development, they should consider applying standard methods that are widely accepted amongst health researchers and epidemiologists, as defined by the Cochrane Handbook for Systematic Reviews of Interventions (Higgins 2020). They should avoid using difference‐in‐differences (DD) estimates of proportions, which are not defined in health research and therefore not accepted by Cochrane, but are currently very commonly used by economists conducting research on health effects of UCTs. Studies should focus on investigating impacts of UCTs on the most important outcomes, rather than on less important outcomes. Since the current body of evidence is primarily for the Americas and Africa, more research is also needed particularly for the Eastern Mediterranean, South‐East Asian and Western Pacific regions. More high‐quality experimental studies that determine the impacts of UCTs on equity in use of health services and health outcomes along PROGRESS‐Plus categories (Cochrane Methods Equity Group 2022) are also needed. Strengthening the currently small body of evidence on the relative effectiveness of UCTs and CCTs requires more high‐quality experimental studies that compare UCTs with CCTs in terms of their effects on health service use, health outcomes, social determinants of health, health care expenditure and health equity.
The effectiveness of UCTs for improving health service use and health outcomes may be related to the relative amount of the transfer, either in terms of mean population income, the income of the poor or a related measure. Effectiveness may also be considered in terms of the costs related to the outcome of interest, such as the costs of depression. Future systematic reviews should also seek to record this information on transfer magnitudes (as done in this review), which they could use as a mediator in the meta‐analyses. Moreover, the relative effectiveness of UCT and CCT programmes may be, for select outcomes such as healthcare utilisation, related to the actual imposed conditions of the CCT programme. Future systematic reviews should therefore also always record the conditions of the included CCTs (as done in this review), and they could include this information in their evaluation of the relative effectiveness of UCTs versus CCTs.
What's new
| Date | Event | Description |
|---|---|---|
| 11 December 2021 | New search has been performed | Added 13 new studies. |
| 11 December 2021 | New citation required and conclusions have changed | Changed conclusion for one secondary outcome, namely very uncertain evidence on extreme poverty changed to low certainty evidence that UCTs may have reduced the likelihood of households being extremely poor. |
History
Protocol first published: Issue 6, 2014 Review first published: Issue 11, 2017
| Date | Event | Description |
|---|---|---|
| 17 April 2020 | Amended | Published note added regarding Cochrane Funding Arbiter decision post publication. |
Acknowledgements
Regarding the original systematic review (Pega 2017), we thank: Jodie Doyle, Miranda Cumpston, Dr Rob Anderson, Patrick Condron, Dr Anke Rohwer, Dr Reza Yousefi‐Nooraie and the late Dr Elizabeth Waters (all Cochrane Public Health Group) for editorial guidance and advice on the original review; Dr Ruhi Saith and Dr Stefan Walter for their contributions as co‐authors; Dr Paul Bain (Harvard Medical School) for searching most electronic academic and some grey literature databases; Ruth Turley (Cochrane Public Health Group) for searching the Cochrane Public Health Specialised Register; Susan Hope (University of Otago) for contributing to handsearching of academic journals; Carolin Henning and Tatjana Paeck (both University of Bremen) for contributing to data extraction; Meggan Harris for copy‐editing this review; Dr Rosangela Bando Grana (Inter‐American Development Bank), Dr Samuel Bazzi (Boston University), Girija Bahety (Oxford Policy Management), Dr Jesse Cunha (Naval Postgraduate School), Dr Jeffrey Eaton (Imperial College London), Dr Lia C. Haskin Fernald (University of California, Berkeley), Dr Sebastian Galiani (University of Maryland), Martina Garcia (Oxford Policy Management), Dr Paul Gertler (University of California, Berkeley), Dr Simon Gregson (Imperial College London), Dr Sudhanshu Handa (University of North Carolina, Chapel Hill), Dr Melissa Hidrobo (International Food Policy Research Institute), Maja Jakobsen (Oxford Policy Management), Dr Winnie Luseno (Pacific Institute for Research and Evaluation), Dr Fred Merttens (Oxford Policy Management), Dr Candace Miller (Mathematica Policy Research), Dr Tia Palermo (United Nations Children's Fund), Dr Luca Pellerano (Oxford Policy Management), Dr Norbert Schady (Inter‐American Development Bank), Dr David Seidenfeld (American Institutes for Research) and Dr Patrick Ward (Oxford Policy Management) for providing missing data for included studies; Gordon Purdie and Dr James Stanley (both University of Otago) for statistical advice; Dr Sarah Baird (University of Washington), Aneil Jaswal (University of Oxford), Dr Vanessa Jordan (Cochrane New Zealand), Dr Santosh Mehrotra (Planning Commission, Government of India), and Dr Luca Pellerano (Oxford Policy Management) for their advice; and Dr Jed Friedman (World Bank), Kirti S Sahu (Public Health Foundation of India), and Dr Mesfin G Zbel (World Health Organization) for their external peer review.
Regarding the review update, we thank Jodie Doyle, Dr Hilary Thomson, Miranda Cumpston, Ruth Dundas, Irma Klerings, Dr Sam McCrab and Dr Luke Wolfenden (Cochrane Public Health Group) for editorial guidance and advice; Valerie Wells for undertaking the search strategy, with funding support from MRC/CSO Social and Public Health Sciences Unit, University of Glasgow (grants MC_UU_12017/15 and SPHSU15); Michael Fauchelle, Jung Cho and the Wellington Medical and Health Sciences Library (all University of Otago) for providing information and library services; Faith Armitage for copy‐editing this review; Dr Philipp Hessel (University of the Andes), Dr Carolyn Huang (University of North Carolina, Chapel Hill) and Dr Smriti Tiwari (Skidmore College) for providing missing data for included studies; and an anonymous referee for the external peer review.
Appendices
Appendix 1. Appendix 1: Search strategy for Ovid MEDLINE 1946 to Present with Daily Update
Intervention terms
1. maternal welfare/
2. public policy/
3. social welfare/
4. exp social security/
5. (social adj (assistance or polic$ or welfare or insurance$ or protection)).ti,ab.
6. public assistance.ti,ab.
7. family policy.mp.
8. ((financial or cash or pay$ or monetary or money) adj3 (transfer$ or measure$ or incentive$ or allowance$ or exclu$ or reform$ or gain$ or credit$1 or benefit$1)).ti,ab.
9. or/1‐8
Study terms
10. randomized controlled trial/
11. random$.ti,ab.
12. random allocation/
13. placebos/
14. placebo$.ti,ab.
15. single‐blind method/
16. double‐blind method/
17. ((single or double or triple or treble) adj blind$).ti,ab.
18. control groups/
19. exp clinical trial/
20. comparative Study/
21. intervention studies/
22. exp cohort studies/
23. evaluation studies/
24. program evaluation/
25. (time adj series).ti,ab.
26. quasi‐experiment$.ti,ab.
27. (pre test or pretest or pre‐intervention or post test or posttest or post‐intervention).ti,ab.
28. controlled before.ti,ab.
29. independent panel.ti,ab.
30. panel stud$.ti,ab.
31. intervention$ stud$.ti,ab.
32. “before and after”.ti,ab.
33. repeat$ measure$.ti,ab.
34. evaluat$ stud$.ti,ab.
35. compari$ stud$.ti,ab.
36. (trial or follow up assessment$ or follow up assessment$ or groups).ti,ab.
37. ((intervention or interventional or process or program) adj8 (evaluat$ or effect$ or outcome$)).ti,ab.
38. (program or programme or secondary analys$).ti,ab.
39. ((evaluat$ or intervention$ or treatment$) and (control$ or study or program$ or comparison or comparative)).ti,ab.
40. or/10‐39
Country terms
41. Developing Countries/
42. Medically Underserved Area/
43. exp Africa/ or exp “Africa South of the Sahara”/ or exp Asia/ or exp South America/ or exp Latin America/ or exp Central America/
44. (Africa or Asia or South America or Latin America or Central America).tw.
45. (American Samoa$ or Argentin$ or Beliz$ or Botswana$ or Brazil$ or Bulgaria$ or Chile$ or Comoro$ or Costa Rica$ or Croatia$ or Dominica$ or Equatorial Guinea$ or Gabon$ or Grenada$ or Hungar$ or Kazakh$ or Latvia$ or Leban$ or Libya$ or Lithuania$ or Malaysia$ or Mauriti$ or Mexic$ or Micronesia$ or Montenegr$ or Oman$ or Palau$ or Panama$ or Poland or Polish or Romania$ or Russia$ or Seychelles$ or Slovakia$ or South Africa$ or “Saint Kitts and Nevis” or Saint Lucia$ or “Saint Vincent and the Grenadines” or Turk$ or Urugua$ or Venezuel$ or Yugoslavia$).sh,tw. or Guinea$.tw. or Libia$.tw. or Mayotte.tw. or Northern Mariana Island$.tw. or Russian Federation.tw. or Samoa$.tw. or Serbia$.tw. or Slovak Republic$.tw. or “St Kitts and Nevis”.tw. or St Lucia$.tw. or “St Vincent and the Grenadines”.tw.
46. (Albania$ or Algeria$ or Angol$ or Armenia$ or Azerbaijan$ or Belarus$ or Bhutan$ or Bolivia$ or “Bosnia and Herzegovina” or Bosnian$ or Cameroon$ or China or Chinese or Colombia$ or Congo$ or Cuba$ or Djibouti$ or Dominican Republic$ or Ecuador$ or Egypt$ or El Salvador$ or Fiji$ or “Georgia (Republic)” or Goergian$ or Guam$ or Guatemal$ or Guyana$ or Hondur$ or Indian Ocean Island$ or Indonesia$ or Iran$ or Iraq$ or Jamaica$ or Jordan$ or Lesotho or “Macedonia (Republic)” or Marshall Island$ or Micronesia$ or Middle East$ or Moldova$ or Morocc$ or Namibia$ or Nicaragua$ or Paraguay$ or Peru$ or Philippin$ or Samoa$ or Sri Lanka$ or Suriname$ or Swaziland$ or Syria$ or Thai$ or Tonga$ or Tunisia$ or Turkmen$ or Ukrain$ or Vanuatu).sh,tw. or Bosnia$.tw. or Cape Verd$.tw. or Gaza.tw. or Georgia$.tw. or Kiribati$.tw. or Macedonia$.tw. or Maldives.tw. or Marshall Island$.tw. or Palestin$.tw. or Syrian Arab Republic$.tw. or West Bank.tw.
47. (Afghan$ or Bangladesh$ or Benin$ or Burkina Faso$ or Burundi$ or Cambodia$ or Central African Republic$ or Chad$ or Comoros or “Democratic Republic of the Congo” or Cote d’Ivoire or Eritrea$ or Ethiopia$ or Gambia$ or Ghana$ or Guinea$ or Guinea‐Bissau or Haiti$ or India$ or Kenya$ or Korea$ or Kyrgyz$ or Laos or Laot$ or Liberia$ or Madagascar or Malagasy or Malawi$ or Mali$ or Mauritania$ or Melanesia$ or Mongolia$ or Mozambi$ or Myanmar or Nepal$ or Niger$ or Nigeria$ or Pakistan$ or Papua New Guinea$ or Rwanda$ or Senegal$ or Sierra Leone$ or Somalia$ or Sudan$ or Tajikistan$ or Tanzania$ or East Timor$ or Togo$ or Uganda$ or Uzbek$ or Vietnam$ or Yemen$ or Zambia$ or Zimbabw$).sh,tw. or Burm$.tw. or Congo$.tw. or Lao.tw. or North Korea$.tw. or Solomon Island$.tw. or Sao Tome.tw. or Timor$.tw. or Viet Nam.tw.
48. ((developing or less$ developed or third world or under developed or middle income or low income or underserved or under served or deprived or poor$) adj (count$ or nation? or state? or population?)).tw.
49. (lmic or lmics).tw.
50. or/41‐49
51. 10 and 40 and 50
Appendix 2. Appendix 2. Search strategies for electronic academic databases
Cochrane Central Register of Controlled Trial (CENTRAL)
08 September 2021
266 records
Intervention terms
TX ((social N1 (assistance OR polic* OR welfare OR insurance* OR protection)) OR "public assistance" OR "family policy" OR ((financial OR cash OR pay* OR monetary OR money) N3 (transfer* OR measure* OR incentive* OR allowance* OR exclu* OR reform* OR gain* OR credit OR credits OR benefit OR benefits)))
Country terms
TX (Africa OR Asia OR "South America" OR "Latin America" OR "Central America" OR ((developing OR "less* developed" OR "third world" OR "under developed" OR "middle income" OR "low income" OR underserved OR "under served" OR deprived OR poor*) N1 (count* OR nation OR nations OR state OR states OR population OR populations)) OR lmic OR lmics)
OR
TI (Samoa* OR Argentin* OR Beliz* OR Botswana* OR Brazil* OR Bulgaria* OR Chile* OR Comoro* OR "Costa Rica*" OR Croatia* OR Dominica* OR Guinea* OR Gabon* OR Grenada* OR Hungar* OR Kazakh* OR Latvia* OR Leban* OR Libya* OR Lithuania* OR Malaysia* OR Mauriti* OR Mexic* OR Micronesia* OR Montenegr* OR Oman* OR Palau* OR Panama* OR Poland OR Polish OR Romania* OR Russia* OR Seychelles* OR Slovak* OR "Saint Kitts" OR Nevis OR "Saint Lucia*" OR "Saint Vincent" OR Grenadines OR Turk* OR Urugua* OR Venezuel* OR Yugoslavia* OR Libia* OR Mayotte OR "Mariana Island*" OR Serbia* OR "St Kitts" OR "St Lucia*" OR "St Vincent" OR Albania* OR Algeria* OR Angol* OR Armenia* OR Azerbaijan* OR Belarus* OR Bhutan* OR Bolivia* OR Bosnia* OR Herzegovin* OR Cameroon* OR China OR Chinese OR Colombia* OR Congo* OR Cuba* OR Djibouti* OR Ecuador* OR Egypt* OR "El Salvador*" OR Fiji* OR Georgia* OR Guam* OR Guatemal* OR Guyana* OR Hondur* OR "Indian Ocean Island*" OR Indonesia* OR Iran* OR Iraq* OR Jamaica* OR Jordan* OR Lesotho OR Macedonia* OR "Marshall Island*" OR Micronesia* OR "Middle East*" OR Moldova* OR Morocc* OR Namibia* OR Nicaragua* OR Paraguay* OR Peru* OR Philippin* OR "Sri Lanka*" OR Suriname* OR Swaziland* OR Syria* OR Thai* OR Tonga* OR Tunisia* OR Turkmen* OR Ukrain* OR Vanuatu* OR "Cape Verd*" OR Gaza OR Kiribati* OR Maldives OR Palestin* OR "West Bank" OR Afghan* OR Bangladesh* OR Benin* OR "Burkina Faso*" OR Burundi* OR Cambodia* OR "Central African Republic*" OR Chad* OR Comoros OR Congo* OR "Cote d Ivoire" OR Eritrea* OR Ethiopia* OR Gambia* OR Ghana* OR Guinea* OR "Guinea‐Bissau" OR Haiti* OR India* OR Kenya* OR Korea* OR Kyrgyz* OR Laos OR Laot* OR Liberia* OR Madagascar OR Malagasy OR Malawi* OR Mali* OR Mauritania* OR Melanesia* OR Mongolia* OR Mozambi* OR Myanmar OR Nepal* OR Niger* OR Nigeria* OR Pakistan* OR "Papua New Guinea*" OR Rwanda* OR Senegal* OR "Sierra Leone*" OR Somalia* OR Sudan* OR Tajikistan* OR Tanzania* OR "East Timor*" OR Togo* OR Uganda* OR Uzbek* OR Vietnam* OR Yemen* OR Zambia* OR Zimbabw* OR Burm* OR Lao OR "North Korea*" OR "Solomon Island*" OR "Sao Tome" OR Timor* OR "Viet Nam*" OR "ivory coast")
OR
AB (Samoa* OR Argentin* OR Beliz* OR Botswana* OR Brazil* OR Bulgaria* OR Chile* OR Comoro* OR "Costa Rica*" OR Croatia* OR Dominica* OR Guinea* OR Gabon* OR Grenada* OR Hungar* OR Kazakh* OR Latvia* OR Leban* OR Libya* OR Lithuania* OR Malaysia* OR Mauriti* OR Mexic* OR Micronesia* OR Montenegr* OR Oman* OR Palau* OR Panama* OR Poland OR Polish OR Romania* OR Russia* OR Seychelles* OR Slovak* OR "Saint Kitts" OR Nevis OR "Saint Lucia*" OR "Saint Vincent" OR Grenadines OR Turk* OR Urugua* OR Venezuel* OR Yugoslavia* OR Libia* OR Mayotte OR "Mariana Island*" OR Serbia* OR "St Kitts" OR "St Lucia*" OR "St Vincent" OR Albania* OR Algeria* OR Angol* OR Armenia* OR Azerbaijan* OR Belarus* OR Bhutan* OR Bolivia* OR Bosnia* OR Herzegovin* OR Cameroon* OR China OR Chinese OR Colombia* OR Congo* OR Cuba* OR Djibouti* OR Ecuador* OR Egypt* OR "El Salvador*" OR Fiji* OR Georgia* OR Guam* OR Guatemal* OR Guyana* OR Hondur* OR "Indian Ocean Island*" OR Indonesia* OR Iran* OR Iraq* OR Jamaica* OR Jordan* OR Lesotho OR Macedonia* OR "Marshall Island*" OR Micronesia* OR "Middle East*" OR Moldova* OR Morocc* OR Namibia* OR Nicaragua* OR Paraguay* OR Peru* OR Philippin* OR "Sri Lanka*" OR Suriname* OR Swaziland* OR Syria* OR Thai* OR Tonga* OR Tunisia* OR Turkmen* OR Ukrain* OR Vanuatu* OR "Cape Verd*" OR Gaza OR Kiribati* OR Maldives OR Palestin* OR "West Bank" OR Afghan* OR Bangladesh* OR Benin* OR "Burkina Faso*" OR Burundi* OR Cambodia* OR "Central African Republic*" OR Chad* OR Comoros OR Congo* OR "Cote d Ivoire" OR Eritrea* OR Ethiopia* OR Gambia* OR Ghana* OR Guinea* OR "Guinea‐Bissau" OR Haiti* OR India* OR Kenya* OR Korea* OR Kyrgyz* OR Laos OR Laot* OR Liberia* OR Madagascar OR Malagasy OR Malawi* OR Mali* OR Mauritania* OR Melanesia* OR Mongolia* OR Mozambi* OR Myanmar OR Nepal* OR Niger* OR Nigeria* OR Pakistan* OR "Papua New Guinea*" OR Rwanda* OR Senegal* OR "Sierra Leone*" OR Somalia* OR Sudan* OR Tajikistan* OR Tanzania* OR "East Timor*" OR Togo* OR Uganda* OR Uzbek* OR Vietnam* OR Yemen* OR Zambia* OR Zimbabw* OR Burm* OR Lao.tw. OR "North Korea*" OR "Solomon Island*" OR "Sao Tome" OR Timor* OR "Viet Nam*" OR "ivory coast")
OR
SU (Samoa* OR Argentin* OR Beliz* OR Botswana* OR Brazil* OR Bulgaria* OR Chile* OR Comoro* OR "Costa Rica*" OR Croatia* OR Dominica* OR Guinea* OR Gabon* OR Grenada* OR Hungar* OR Kazakh* OR Latvia* OR Leban* OR Libya* OR Lithuania* OR Malaysia* OR Mauriti* OR Mexic* OR Micronesia* OR Montenegr* OR Oman* OR Palau* OR Panama* OR Poland OR Polish OR Romania* OR Russia* OR Seychelles* OR Slovak* OR "Saint Kitts" OR Nevis OR "Saint Lucia*" OR "Saint Vincent" OR Grenadines OR Turk* OR Urugua* OR Venezuel* OR Yugoslavia* OR Libia* OR Mayotte OR "Mariana Island*" OR Serbia* OR "St Kitts" OR "St Lucia*" OR "St Vincent" OR Albania* OR Algeria* OR Angol* OR Armenia* OR Azerbaijan* OR Belarus* OR Bhutan* OR Bolivia* OR Bosnia* OR Herzegovin* OR Cameroon* OR China OR Chinese OR Colombia* OR Congo* OR Cuba* OR Djibouti* OR Ecuador* OR Egypt* OR "El Salvador*" OR Fiji* OR Georgia* OR Guam* OR Guatemal* OR Guyana* OR Hondur* OR "Indian Ocean Island*" OR Indonesia* OR Iran* OR Iraq* OR Jamaica* OR Jordan* OR Lesotho OR Macedonia* OR "Marshall Island*" OR Micronesia* OR "Middle East*" OR Moldova* OR Morocc* OR Namibia* OR Nicaragua* OR Paraguay* OR Peru* OR Philippin* OR "Sri Lanka*" OR Suriname* OR Swaziland* OR Syria* OR Thai* OR Tonga* OR Tunisia* OR Turkmen* OR Ukrain* OR Vanuatu* OR "Cape Verd*" OR Gaza OR Kiribati* OR Maldives OR Palestin* OR "West Bank" OR Afghan* OR Bangladesh* OR Benin* OR "Burkina Faso*" OR Burundi* OR Cambodia* OR "Central African Republic*" OR Chad* OR Comoros OR Congo* OR "Cote d Ivoire" OR Eritrea* OR Ethiopia* OR Gambia* OR Ghana* OR Guinea* OR "Guinea‐Bissau" OR Haiti* OR India* OR Kenya* OR Korea* OR Kyrgyz* OR Laos OR Laot* OR Liberia* OR Madagascar OR Malagasy OR Malawi* OR Mali* OR Mauritania* OR Melanesia* OR Mongolia* OR Mozambi* OR Myanmar OR Nepal* OR Niger* OR Nigeria* OR Pakistan* OR "Papua New Guinea*" OR Rwanda* OR Senegal* OR "Sierra Leone*" OR Somalia* OR Sudan* OR Tajikistan* OR Tanzania* OR "East Timor*" OR Togo* OR Uganda* OR Uzbek* OR Vietnam* OR Yemen* OR Zambia* OR Zimbabw* OR Burm* OR Lao.tw. OR "North Korea*" OR "Solomon Island*" OR "Sao Tome" OR Timor* OR "Viet Nam*" OR "ivory coast")
Ovid MEDLINE 1946 to Present with Daily Update, plus Daily Update to 8 September 2021
08 September 2021
7367 records
See Appendix 1 for search strategy.
Embase
08 September 2021
13,348 records
Intervention terms
'maternal welfare'/de OR 'policy'/de OR 'social welfare'/de OR 'social security'/exp OR (social NEAR/1 (assistance OR polic* OR welfare OR insurance* OR protection)):ti,ab OR 'public assistance':ti,ab OR 'family policy':ti,ab OR ((financial OR cash OR pay* OR monetary OR money) NEAR/3 (transfer* OR measure* OR incentive* OR allowance* OR exclu* OR reform* OR gain* OR credit OR credits OR benefit OR benefits)):ti,ab
Study terms
'clinical trial'/exp OR 'placebo'/de OR 'single blind procedure'/de OR 'double blind procedure'/de OR 'control group'/de OR 'comparative study'/de OR 'intervention study'/de OR 'cohort analysis'/exp OR 'evaluation study'/exp OR random*:ti,ab OR 'random allocation':ti,ab OR placebo*:ti,ab OR ((single OR double OR triple OR treble) NEAR/1 blind*):ti,ab OR (time NEAR/1 series):ti,ab OR (quasi NEXT/1 experiment*):ti,ab OR ('pre test' OR pretest OR 'pre‐intervention' OR 'post test' OR posttest OR 'post‐intervention'):ti,ab OR 'controlled before':ti,ab OR 'independent panel':ti,ab OR ((panel OR intervention* OR evaluat* OR compari*) NEXT/1 stud*):ti,ab OR 'before and after':ti,ab OR (repeat* NEXT/1 measure*):ti,ab OR trial OR ('follow up' NEXT/1 assessment*):ti,ab OR groups:ti,ab OR ((intervention OR interventional OR process OR program) NEAR/8 (evaluat* OR effect* OR outcome*)):ti,ab OR program:ti,ab OR programme:ti,ab OR (secondary NEXT/1 analys*):ti,ab OR ((evaluat* OR intervention* OR treatment*) AND (control* OR study OR program* OR comparison OR comparative)):ti,ab
Country terms
'developing country'/exp OR 'Africa'/exp OR 'Asia'/exp OR 'South and Central America'/exp OR (Africa OR Asia OR 'South America' OR 'Latin America' OR 'Central America'):ti,ab OR ((developing OR 'less developed' OR 'third world' OR 'under developed' OR 'middle income' OR 'low income' OR underserved OR 'under served' OR deprived OR poor*) NEXT/1 (count* OR nation? OR state? OR population?)):ti,ab OR (lmic OR lmics):ti,ab
OR
(Samoa* OR Argentin* OR Beliz* OR Botswana* OR Brazil* OR Bulgaria* OR Chile* OR Comoro* OR (Costa NEXT/1 Rica*) OR Croatia* OR Dominica* OR Guinea* OR Gabon* OR Grenada* OR Hungar* OR Kazakh* OR Latvia* OR Leban* OR Libya* OR Lithuania* OR Malaysia* OR Mauriti* OR Mexic* OR Micronesia* OR Montenegr* OR Oman* OR Palau* OR Panama* OR Poland OR Polish OR Romania* OR Russia* OR Seychelles* OR Slovak* OR South Africa* OR 'Saint Kitts' OR Nevis OR (Saint NEXT/1 Lucia*) OR (Saint NEXT/1 Vincent*) OR Grenada* OR Turk* OR Urugua* OR Venezuel* OR Yugoslavia* OR Libia* OR Mayotte OR 'Northern Mariana' OR mariana* OR Russia* OR Serbia* OR 'St Kitts' OR 'St Lucia' OR 'st lucian' OR 'St Vincent'):ab,de,ti
OR
(Albania* OR Algeria* OR Angol* OR Armenia* OR Azerbaijan* OR Belarus* OR Bhutan* OR Bolivia* OR Bosnia* OR Herzegovina* OR Cameroon* OR China OR Chinese OR Colombia* OR Congo* OR Cuba* OR Djibouti* OR Dominica* OR Ecuador* OR Egypt* OR Salvador* OR Fiji* OR Georgia OR georgian* OR Guam* OR Guatemal* OR Guyana* OR Hondur* OR Indonesia* OR Iran* OR Iraq* OR Jamaica* OR Jordan* OR Lesoth* OR Macedonia* OR (Marshall NEXT/1 Island*) OR Micronesia* OR (Middle NEXT/1 East*) OR Moldova* OR Morocc* OR Namibia* OR Nicaragua* OR Paraguay* OR Peru* OR Philippin* OR (Sri NEXT/1 Lanka*) OR Suriname* OR Swaziland* OR Syria* OR Thai* OR Tonga* OR Tunisia* OR Turkmen* OR Ukrain* OR Vanuatu OR (Cape NEXT/1 Verd*) OR Gaza OR Kiribati* OR Maldives OR (Marshall NEXT/1 Island*) OR Palestin* OR 'West Bank'):ab,de,ti
OR
(Afghan* OR Bangladesh* OR Benin* OR (Burkina NEXT/1 Faso*) OR Burundi* OR Cambodia* OR 'Central African Republic' OR Chad* OR Comoros OR Congo OR 'Cote d Ivoire' OR 'Ivory Coast' OR Eritrea* OR Ethiopia* OR Gambia* OR Ghana* OR Haiti* OR India* OR Kenya* OR Korea* OR Kyrgyz* OR Laos OR Laot* OR Liberia* OR Madagascar OR Malagasy OR Malawi* OR Mali OR Malian OR Mauritania* OR Melanesia* OR Mongolia* OR Mozambi* OR Myanmar OR Nepal* OR Niger* OR Nigeria* OR Pakistan* OR Rwanda* OR Senegal* OR (Sierra NEXT/1 Leone*) OR Somalia* OR Sudan* OR Tajikistan* OR Tanzania* OR Togo* OR Uganda* OR Uzbek* OR Vietnam* OR Yemen* OR Zambia* OR Zimbabw* OR Burm* OR (Salomon NEXT/1 Island*) OR 'Sao Tome' OR (Viet NEXT/1 Nam) OR vietnam*):ab,de,ti
Academic Search Premier
05 May 2017 (Not searched in this updated systematic review, as unavailable to the information specialist.)
3687 records
Intervention terms
SU ("PUBLIC welfare" OR "CONDITIONAL cash transfer programs" OR "SOCIAL security" OR "SUPPLEMENTAL security income program" OR "MATERNAL & infant welfare") OR TI ((social N1 (assistance OR polic* OR welfare OR insurance* OR protection)) OR "public assistance" OR "family policy" OR ((financial OR cash OR pay* OR monetary OR money) N3 (transfer* OR measure* OR incentive* OR allowance* OR exclu* OR reform* OR gain* OR credit OR credits OR benefit OR benefits))) OR AB ((social N1 (assistance OR polic* OR welfare OR insurance* OR protection)) OR "public assistance" OR "family policy" OR ((financial OR cash OR pay* OR monetary OR money) N3 (transfer* OR measure* OR incentive* OR allowance* OR exclu* OR reform* OR gain* OR credit OR credits OR benefit OR benefits)))
Study terms
SU ("RANDOMIZED controlled trials" OR "PLACEBOS (Medicine)" OR "BLIND experiment" OR "CONTROL groups (Research)" OR "CLINICAL trials" OR "COHORT analysis" OR "LONGITUDINAL method" OR "RETROSPECTIVE studies" OR "EVALUATION") OR TI (random* OR placebo* OR ((single OR double OR triple OR treble) N1 blind*) OR (time N1 series) OR "quasi‐experiment*" OR "pre test" OR pretest OR "pre‐intervention" OR "post test" OR posttest OR "post‐intervention" OR "controlled before" OR "independent panel" OR "panel stud* OR "intervention* stud*" OR "before and after" OR "repeat* measure* OR "evaluat* stud*" OR "compari* stud*" OR trial OR "follow up assessment*" OR groups OR ((intervention OR interventional OR process OR program) N8 (evaluat* OR effect* OR outcome*)) OR program OR programme OR "secondary analys*" OR ((evaluat* OR intervention* OR treatment*) and (control* OR study OR program* OR comparison OR comparative))) OR AB (random* OR placebo* OR ((single OR double OR triple OR treble) N1 blind*) OR (time N1 series) OR "quasi‐experiment*" OR "pre test" OR pretest OR "pre‐intervention" OR "post test" OR posttest OR "post‐intervention" OR "controlled before" OR "independent panel" OR "panel stud* OR "intervention* stud*" OR "before and after" OR "repeat* measure* OR "evaluat* stud*" OR "compari* stud*" OR trial OR "follow up assessment*" OR groups OR ((intervention OR interventional OR process OR program) N8 (evaluat* OR effect* OR outcome*)) OR program OR programme OR "secondary analys*" OR ((evaluat* OR intervention* OR treatment*) AND (control* OR study OR program* OR comparison OR comparative)))
Country terms
SU ("Developing Countries" OR "Medically Underserved Area" OR "Africa" OR "Asia" OR "South America" OR "Central America" OR "Latin America") OR TI (Africa OR Asia OR "South America" OR "Latin America" OR "Central America" OR ((developing OR "less* developed" OR "third world" OR "under developed" OR "middle income" OR "low income" OR underserved OR "under served" OR deprived OR poor*) N1 (count* OR nation OR nations OR state OR states OR population OR populations)) OR lmic OR lmics) OR AB (Africa OR Asia OR "South America" OR "Latin America" OR "Central America" OR ((developing OR "less* developed" OR "third world" OR "under developed" OR "middle income" OR "low income" OR underserved OR "under served" OR deprived OR poor*) N1 (count* OR nation OR nations OR state OR states OR population OR populations)) OR lmic OR lmics)
OR
TI(Samoa* OR Argentin* OR Beliz* OR Botswana* OR Brazil* OR Bulgaria* OR Chile* OR Comoro* OR "Costa Rica*" OR Croatia* OR Dominica* OR Guinea* OR Gabon* OR Grenada* OR Hungar* OR Kazakh* OR Latvia* OR Leban* OR Libya* OR Lithuania* OR Malaysia* OR Mauriti* OR Mexic* OR Micronesia* OR Montenegr* OR Oman* OR Palau* OR Panama* OR Poland OR Polish OR Romania* OR Russia* OR Seychelles* OR Slovak* OR "Saint Kitts" OR Nevis OR "Saint Lucia*" OR "Saint Vincent" OR Grenadines OR Turk* OR Urugua* OR Venezuel* OR Yugoslavia* OR Libia* OR Mayotte OR "Mariana Island*" OR Serbia* OR "St Kitts" OR "St Lucia*" OR "St Vincent" OR Albania* OR Algeria* OR Angol* OR Armenia* OR Azerbaijan* OR Belarus* OR Bhutan* OR Bolivia* OR Bosnia* OR Herzegovin* OR Cameroon* OR China OR Chinese OR Colombia* OR Congo* OR Cuba* OR Djibouti* OR Ecuador* OR Egypt* OR "El Salvador*" OR Fiji* OR Georgia* OR Guam* OR Guatemal* OR Guyana* OR Hondur* OR "Indian Ocean Island*" OR Indonesia* OR Iran* OR Iraq* OR Jamaica* OR Jordan* OR Lesotho OR Macedonia* OR "Marshall Island*" OR Micronesia* OR "Middle East*" OR Moldova* OR Morocc* OR Namibia* OR Nicaragua* OR Paraguay* OR Peru* OR Philippin* OR "Sri Lanka*" OR Suriname* OR Swaziland* OR Syria* OR Thai* OR Tonga* OR Tunisia* OR Turkmen* OR Ukrain* OR Vanuatu* OR "Cape Verd*" OR Gaza OR Kiribati* OR Maldives OR Palestin* OR "West Bank" OR Afghan* OR Bangladesh* OR Benin* OR "Burkina Faso*" OR Burundi* OR Cambodia* OR "Central African Republic*" OR Chad* OR Comoros OR Congo* OR "Cote d Ivoire" OR Eritrea* OR Ethiopia* OR Gambia* OR Ghana* OR Guinea* OR "Guinea‐Bissau" OR Haiti* OR India* OR Kenya* OR Korea* OR Kyrgyz* OR Laos OR Laot* OR Liberia* OR Madagascar OR Malagasy OR Malawi* OR Mali* OR Mauritania* OR Melanesia* OR Mongolia* OR Mozambi* OR Myanmar OR Nepal* OR Niger* OR Nigeria* OR Pakistan* OR "Papua New Guinea*" OR Rwanda* OR Senegal* OR "Sierra Leone*" OR Somalia* OR Sudan* OR Tajikistan* OR Tanzania* OR "East Timor*" OR Togo* OR Uganda* OR Uzbek* OR Vietnam* OR Yemen* OR Zambia* OR Zimbabw* OR Burm* OR Lao* OR "North Korea*" OR "Solomon Island*" OR "Sao Tome" OR Timor* OR "Viet Nam*" OR "ivory coast")
OR
AB(Samoa* OR Argentin* OR Beliz* OR Botswana* OR Brazil* OR Bulgaria* OR Chile* OR Comoro* OR "Costa Rica*" OR Croatia* OR Dominica* OR Guinea* OR Gabon* OR Grenada* OR Hungar* OR Kazakh* OR Latvia* OR Leban* OR Libya* OR Lithuania* OR Malaysia* OR Mauriti* OR Mexic* OR Micronesia* OR Montenegr* OR Oman* OR Palau* OR Panama* OR Poland OR Polish OR Romania* OR Russia* OR Seychelles* OR Slovak* OR "Saint Kitts" OR Nevis OR "Saint Lucia*" OR "Saint Vincent" OR Grenadines OR Turk* OR Urugua* OR Venezuel* OR Yugoslavia* OR Libia* OR Mayotte OR "Mariana Island*" OR Serbia* OR "St Kitts" OR "St Lucia*" OR "St Vincent" OR Albania* OR Algeria* OR Angol* OR Armenia* OR Azerbaijan* OR Belarus* OR Bhutan* OR Bolivia* OR Bosnia* OR Herzegovin* OR Cameroon* OR China OR Chinese OR Colombia* OR Congo* OR Cuba* OR Djibouti* OR Ecuador* OR Egypt* OR "El Salvador*" OR Fiji* OR Georgia* OR Guam* OR Guatemal* OR Guyana* OR Hondur* OR "Indian Ocean Island*" OR Indonesia* OR Iran* OR Iraq* OR Jamaica* OR Jordan* OR Lesotho OR Macedonia* OR "Marshall Island*" OR Micronesia* OR "Middle East*" OR Moldova* OR Morocc* OR Namibia* OR Nicaragua* OR Paraguay* OR Peru* OR Philippin* OR "Sri Lanka*" OR Suriname* OR Swaziland* OR Syria* OR Thai* OR Tonga* OR Tunisia* OR Turkmen* OR Ukrain* OR Vanuatu* OR "Cape Verd*" OR Gaza OR Kiribati* OR Maldives OR Palestin* OR "West Bank" OR Afghan* OR Bangladesh* OR Benin* OR "Burkina Faso*" OR Burundi* OR Cambodia* OR "Central African Republic*" OR Chad* OR Comoros OR Congo* OR "Cote d Ivoire" OR Eritrea* OR Ethiopia* OR Gambia* OR Ghana* OR Guinea* OR "Guinea‐Bissau" OR Haiti* OR India* OR Kenya* OR Korea* OR Kyrgyz* OR Laos OR Laot* OR Liberia* OR Madagascar OR Malagasy OR Malawi* OR Mali* OR Mauritania* OR Melanesia* OR Mongolia* OR Mozambi* OR Myanmar OR Nepal* OR Niger* OR Nigeria* OR Pakistan* OR "Papua New Guinea*" OR Rwanda* OR Senegal* OR "Sierra Leone*" OR Somalia* OR Sudan* OR Tajikistan* OR Tanzania* OR "East Timor*" OR Togo* OR Uganda* OR Uzbek* OR Vietnam* OR Yemen* OR Zambia* OR Zimbabw* OR Burm* OR Lao* OR "North Korea*" OR "Solomon Island*" OR "Sao Tome" OR Timor* OR "Viet Nam*" OR "ivory coast")
OR
SU (Samoa* OR Argentin* OR Beliz* OR Botswana* OR Brazil* OR Bulgaria* OR Chile* OR Comoro* OR "Costa Rica*" OR Croatia* OR Dominica* OR Guinea* OR Gabon* OR Grenada* OR Hungar* OR Kazakh* OR Latvia* OR Leban* OR Libya* OR Lithuania* OR Malaysia* OR Mauriti* OR Mexic* OR Micronesia* OR Montenegr* OR Oman* OR Palau* OR Panama* OR Poland OR Polish OR Romania* OR Russia* OR Seychelles* OR Slovak* OR "Saint Kitts" OR Nevis OR "Saint Lucia*" OR "Saint Vincent" OR Grenadines OR Turk* OR Urugua* OR Venezuel* OR Yugoslavia* OR Libia* OR Mayotte OR "Mariana Island*" OR Serbia* OR "St Kitts" OR "St Lucia*" OR "St Vincent" OR Albania* OR Algeria* OR Angol* OR Armenia* OR Azerbaijan* OR Belarus* OR Bhutan* OR Bolivia* OR Bosnia* OR Herzegovin* OR Cameroon* OR China OR Chinese OR Colombia* OR Congo* OR Cuba* OR Djibouti* OR Ecuador* OR Egypt* OR "El Salvador*" OR Fiji* OR Georgia* OR Guam* OR Guatemal* OR Guyana* OR Hondur* OR "Indian Ocean Island*" OR Indonesia* OR Iran* OR Iraq* OR Jamaica* OR Jordan* OR Lesotho OR Macedonia* OR "Marshall Island*" OR Micronesia* OR "Middle East*" OR Moldova* OR Morocc* OR Namibia* OR Nicaragua* OR Paraguay* OR Peru* OR Philippin* OR "Sri Lanka*" OR Suriname* OR Swaziland* OR Syria* OR Thai* OR Tonga* OR Tunisia* OR Turkmen* OR Ukrain* OR Vanuatu* OR "Cape Verd*" OR Gaza OR Kiribati* OR Maldives OR Palestin* OR "West Bank" OR Afghan* OR Bangladesh* OR Benin* OR "Burkina Faso*" OR Burundi* OR Cambodia* OR "Central African Republic*" OR Chad* OR Comoros OR Congo* OR "Cote d Ivoire" OR Eritrea* OR Ethiopia* OR Gambia* OR Ghana* OR Guinea* OR "Guinea‐Bissau" OR Haiti* OR India* OR Kenya* OR Korea* OR Kyrgyz* OR Laos OR Laot* OR Liberia* OR Madagascar OR Malagasy OR Malawi* OR Mali* OR Mauritania* OR Melanesia* OR Mongolia* OR Mozambi* OR Myanmar OR Nepal* OR Niger* OR Nigeria* OR Pakistan* OR "Papua New Guinea*" OR Rwanda* OR Senegal* OR "Sierra Leone*" OR Somalia* OR Sudan* OR Tajikistan* OR Tanzania* OR "East Timor*" OR Togo* OR Uganda* OR Uzbek* OR Vietnam* OR Yemen* OR Zambia* OR Zimbabw* OR Burm* OR Lao* OR "North Korea*" OR "Solomon Island*" OR "Sao Tome" OR Timor* OR "Viet Nam*" OR "ivory coast")
Business Source Complete
08 September 2021
3742 records
Intervention terms
DE ("PUBLIC welfare" OR "INCOME maintenance programs" OR "SUPPLEMENTAL security income program" OR "SOCIAL security") OR TI ((social N1 (assistance OR polic* OR welfare OR insurance* OR protection)) OR "public assistance" OR "family policy" OR ((financial OR cash OR pay* OR monetary OR money) N3 (transfer* OR measure* OR incentive* OR allowance* OR exclu* OR reform* OR gain* OR credit OR credits OR benefit OR benefits))) OR AB ((social N1 (assistance OR polic* OR welfare OR insurance* OR protection)) OR "public assistance" OR "family policy" OR ((financial OR cash OR pay* OR monetary OR money) N3 (transfer* OR measure* OR incentive* OR allowance* OR exclu* OR reform* OR gain* OR credit OR credits OR benefit OR benefits)))
Study terms
TI (random* OR placebo* OR ((single OR double OR triple OR treble) N1 blind*) OR (time N1 series) OR "quasi‐experiment*" OR "pre test" OR pretest OR "pre‐intervention" OR "post test" OR posttest OR "post‐intervention" OR "controlled before" OR "independent panel" OR "panel stud* OR "intervention* stud*" OR "before and after" OR "repeat* measure* OR "evaluat* stud*" OR "compari* stud*" OR trial OR "follow up assessment*" OR groups OR ((intervention OR interventional OR process OR program) N8 (evaluat* OR effect* OR outcome*)) OR program OR programme OR "secondary analys*" OR ((evaluat* OR intervention* OR treatment*) and (control* OR study OR program* OR comparison OR comparative))) OR AB (random* OR placebo* OR ((single OR double OR triple OR treble) N1 blind*) OR (time N1 series) OR "quasi‐experiment*" OR "pre test" OR pretest OR "pre‐intervention" OR "post test" OR posttest OR "post‐intervention" OR "controlled before" OR "independent panel" OR "panel stud* OR "intervention* stud*" OR "before and after" OR "repeat* measure* OR "evaluat* stud*" OR "compari* stud*" OR trial OR "follow up assessment*" OR groups OR ((intervention OR interventional OR process OR program) N8 (evaluat* OR effect* OR outcome*)) OR program OR programme OR "secondary analys*" OR ((evaluat* OR intervention* OR treatment*) AND (control* OR study OR program* OR comparison OR comparative)))
Countries terms
DE ("Africa" OR "Asia" OR "South America" OR "Central America" OR "Latin America") OR TI (Africa OR Asia OR "South America" OR "Latin America" OR "Central America" OR ((developing OR "less* developed" OR "third world" OR "under developed" OR "middle income" OR "low income" OR underserved OR "under served" OR deprived OR poor*) N1 (count* OR nation OR nations OR state OR states OR population OR populations)) OR lmic OR lmics) OR AB (Africa OR Asia OR "South America" OR "Latin America" OR "Central America" OR ((developing OR "less* developed" OR "third world" OR "under developed" OR "middle income" OR "low income" OR underserved OR "under served" OR deprived OR poor*) N1 (count* OR nation OR nations OR state OR states OR population OR populations)) OR lmic OR lmics)
OR
TI(Samoa* OR Argentin* OR Beliz* OR Botswana* OR Brazil* OR Bulgaria* OR Chile* OR Comoro* OR "Costa Rica*" OR Croatia* OR Dominica* OR Guinea* OR Gabon* OR Grenada* OR Hungar* OR Kazakh* OR Latvia* OR Leban* OR Libya* OR Lithuania* OR Malaysia* OR Mauriti* OR Mexic* OR Micronesia* OR Montenegr* OR Oman* OR Palau* OR Panama* OR Poland OR Polish OR Romania* OR Russia* OR Seychelles* OR Slovak* OR "Saint Kitts" OR Nevis OR "Saint Lucia*" OR "Saint Vincent" OR Grenadines OR Turk* OR Urugua* OR Venezuel* OR Yugoslavia* OR Libia* OR Mayotte OR "Mariana Island*" OR Serbia* OR "St Kitts" OR "St Lucia*" OR "St Vincent" OR Albania* OR Algeria* OR Angol* OR Armenia* OR Azerbaijan* OR Belarus* OR Bhutan* OR Bolivia* OR Bosnia* OR Herzegovin* OR Cameroon* OR China OR Chinese OR Colombia* OR Congo* OR Cuba* OR Djibouti* OR Ecuador* OR Egypt* OR "El Salvador*" OR Fiji* OR Georgia* OR Guam* OR Guatemal* OR Guyana* OR Hondur* OR "Indian Ocean Island*" OR Indonesia* OR Iran* OR Iraq* OR Jamaica* OR Jordan* OR Lesotho OR Macedonia* OR "Marshall Island*" OR Micronesia* OR "Middle East*" OR Moldova* OR Morocc* OR Namibia* OR Nicaragua* OR Paraguay* OR Peru* OR Philippin* OR "Sri Lanka*" OR Suriname* OR Swaziland* OR Syria* OR Thai* OR Tonga* OR Tunisia* OR Turkmen* OR Ukrain* OR Vanuatu* OR "Cape Verd*" OR Gaza OR Kiribati* OR Maldives OR Palestin* OR "West Bank" OR Afghan* OR Bangladesh* OR Benin* OR "Burkina Faso*" OR Burundi* OR Cambodia* OR "Central African Republic*" OR Chad* OR Comoros OR Congo* OR "Cote d Ivoire" OR Eritrea* OR Ethiopia* OR Gambia* OR Ghana* OR Guinea* OR "Guinea‐Bissau" OR Haiti* OR India* OR Kenya* OR Korea* OR Kyrgyz* OR Laos OR Laot* OR Liberia* OR Madagascar OR Malagasy OR Malawi* OR Mali* OR Mauritania* OR Melanesia* OR Mongolia* OR Mozambi* OR Myanmar OR Nepal* OR Niger* OR Nigeria* OR Pakistan* OR "Papua New Guinea*" OR Rwanda* OR Senegal* OR "Sierra Leone*" OR Somalia* OR Sudan* OR Tajikistan* OR Tanzania* OR "East Timor*" OR Togo* OR Uganda* OR Uzbek* OR Vietnam* OR Yemen* OR Zambia* OR Zimbabw* OR Burm* OR Lao* OR "North Korea*" OR "Solomon Island*" OR "Sao Tome" OR Timor* OR "Viet Nam*" OR "ivory coast")
OR
AB(Samoa* OR Argentin* OR Beliz* OR Botswana* OR Brazil* OR Bulgaria* OR Chile* OR Comoro* OR "Costa Rica*" OR Croatia* OR Dominica* OR Guinea* OR Gabon* OR Grenada* OR Hungar* OR Kazakh* OR Latvia* OR Leban* OR Libya* OR Lithuania* OR Malaysia* OR Mauriti* OR Mexic* OR Micronesia* OR Montenegr* OR Oman* OR Palau* OR Panama* OR Poland OR Polish OR Romania* OR Russia* OR Seychelles* OR Slovak* OR "Saint Kitts" OR Nevis OR "Saint Lucia*" OR "Saint Vincent" OR Grenadines OR Turk* OR Urugua* OR Venezuel* OR Yugoslavia* OR Libia* OR Mayotte OR "Mariana Island*" OR Serbia* OR "St Kitts" OR "St Lucia*" OR "St Vincent" OR Albania* OR Algeria* OR Angol* OR Armenia* OR Azerbaijan* OR Belarus* OR Bhutan* OR Bolivia* OR Bosnia* OR Herzegovin* OR Cameroon* OR China OR Chinese OR Colombia* OR Congo* OR Cuba* OR Djibouti* OR Ecuador* OR Egypt* OR "El Salvador*" OR Fiji* OR Georgia* OR Guam* OR Guatemal* OR Guyana* OR Hondur* OR "Indian Ocean Island*" OR Indonesia* OR Iran* OR Iraq* OR Jamaica* OR Jordan* OR Lesotho OR Macedonia* OR "Marshall Island*" OR Micronesia* OR "Middle East*" OR Moldova* OR Morocc* OR Namibia* OR Nicaragua* OR Paraguay* OR Peru* OR Philippin* OR "Sri Lanka*" OR Suriname* OR Swaziland* OR Syria* OR Thai* OR Tonga* OR Tunisia* OR Turkmen* OR Ukrain* OR Vanuatu* OR "Cape Verd*" OR Gaza OR Kiribati* OR Maldives OR Palestin* OR "West Bank" OR Afghan* OR Bangladesh* OR Benin* OR "Burkina Faso*" OR Burundi* OR Cambodia* OR "Central African Republic*" OR Chad* OR Comoros OR Congo* OR "Cote d Ivoire" OR Eritrea* OR Ethiopia* OR Gambia* OR Ghana* OR Guinea* OR "Guinea‐Bissau" OR Haiti* OR India* OR Kenya* OR Korea* OR Kyrgyz* OR Laos OR Laot* OR Liberia* OR Madagascar OR Malagasy OR Malawi* OR Mali* OR Mauritania* OR Melanesia* OR Mongolia* OR Mozambi* OR Myanmar OR Nepal* OR Niger* OR Nigeria* OR Pakistan* OR "Papua New Guinea*" OR Rwanda* OR Senegal* OR "Sierra Leone*" OR Somalia* OR Sudan* OR Tajikistan* OR Tanzania* OR "East Timor*" OR Togo* OR Uganda* OR Uzbek* OR Vietnam* OR Yemen* OR Zambia* OR Zimbabw* OR Burm* OR Lao* OR "North Korea*" OR "Solomon Island*" OR "Sao Tome" OR Timor* OR "Viet Nam*" OR "ivory coast")
OR
SU(Samoa* OR Argentin* OR Beliz* OR Botswana* OR Brazil* OR Bulgaria* OR Chile* OR Comoro* OR "Costa Rica*" OR Croatia* OR Dominica* OR Guinea* OR Gabon* OR Grenada* OR Hungar* OR Kazakh* OR Latvia* OR Leban* OR Libya* OR Lithuania* OR Malaysia* OR Mauriti* OR Mexic* OR Micronesia* OR Montenegr* OR Oman* OR Palau* OR Panama* OR Poland OR Polish OR Romania* OR Russia* OR Seychelles* OR Slovak* OR "Saint Kitts" OR Nevis OR "Saint Lucia*" OR "Saint Vincent" OR Grenadines OR Turk* OR Urugua* OR Venezuel* OR Yugoslavia* OR Libia* OR Mayotte OR "Mariana Island*" OR Serbia* OR "St Kitts" OR "St Lucia*" OR "St Vincent" OR Albania* OR Algeria* OR Angol* OR Armenia* OR Azerbaijan* OR Belarus* OR Bhutan* OR Bolivia* OR Bosnia* OR Herzegovin* OR Cameroon* OR China OR Chinese OR Colombia* OR Congo* OR Cuba* OR Djibouti* OR Ecuador* OR Egypt* OR "El Salvador*" OR Fiji* OR Georgia* OR Guam* OR Guatemal* OR Guyana* OR Hondur* OR "Indian Ocean Island*" OR Indonesia* OR Iran* OR Iraq* OR Jamaica* OR Jordan* OR Lesotho OR Macedonia* OR "Marshall Island*" OR Micronesia* OR "Middle East*" OR Moldova* OR Morocc* OR Namibia* OR Nicaragua* OR Paraguay* OR Peru* OR Philippin* OR "Sri Lanka*" OR Suriname* OR Swaziland* OR Syria* OR Thai* OR Tonga* OR Tunisia* OR Turkmen* OR Ukrain* OR Vanuatu* OR "Cape Verd*" OR Gaza OR Kiribati* OR Maldives OR Palestin* OR "West Bank" OR Afghan* OR Bangladesh* OR Benin* OR "Burkina Faso*" OR Burundi* OR Cambodia* OR "Central African Republic*" OR Chad* OR Comoros OR Congo* OR "Cote d Ivoire" OR Eritrea* OR Ethiopia* OR Gambia* OR Ghana* OR Guinea* OR "Guinea‐Bissau" OR Haiti* OR India* OR Kenya* OR Korea* OR Kyrgyz* OR Laos OR Laot* OR Liberia* OR Madagascar OR Malagasy OR Malawi* OR Mali* OR Mauritania* OR Melanesia* OR Mongolia* OR Mozambi* OR Myanmar OR Nepal* OR Niger* OR Nigeria* OR Pakistan* OR "Papua New Guinea*" OR Rwanda* OR Senegal* OR "Sierra Leone*" OR Somalia* OR Sudan* OR Tajikistan* OR Tanzania* OR "East Timor*" OR Togo* OR Uganda* OR Uzbek* OR Vietnam* OR Yemen* OR Zambia* OR Zimbabw* OR Burm* OR Lao* OR "North Korea*" OR "Solomon Island*" OR "Sao Tome" OR Timor* OR "Viet Nam*" OR "ivory coast")
CINAHL
08 September 2021
1806 records
Intervention terms
MH ("Maternal Welfare" OR " Social Welfare +" OR "Economic and Social Security") OR TI ((social N1 (assistance OR polic* OR welfare OR insurance* OR protection)) OR "public assistance" OR "family policy" OR ((financial OR cash OR pay* OR monetary OR money) N3 (transfer* OR measure* OR incentive* OR allowance* OR exclu* OR reform* OR gain* OR credit OR credits OR benefit OR benefits))) OR AB ((social N1 (assistance OR polic* OR welfare OR insurance* OR protection)) OR "public assistance" OR "family policy" OR ((financial OR cash OR pay* OR monetary OR money) N3 (transfer* OR measure* OR incentive* OR allowance* OR exclu* OR reform* OR gain* OR credit OR credits OR benefit OR benefits)))
Study terms
MH ("clinical trials+" OR "Random Assignment" OR "Placebos" OR "Control Group" OR "Comparative Studies" OR "Prospective Studies+" OR "Evaluation Research+" OR "Program Evaluation") OR TI (random* OR placebo* OR ((single OR double OR triple OR treble) N1 blind*) OR (time N1 series) OR "quasi‐experiment*" OR "pre test" OR pretest OR "pre‐intervention" OR "post test" OR posttest OR "post‐intervention" OR "controlled before" OR "independent panel" OR "panel stud* OR "intervention* stud*" OR "before and after" OR "repeat* measure* OR "evaluat* stud*" OR "compari* stud*" OR trial OR "follow up assessment*" OR groups OR ((intervention OR interventional OR process OR program) N8 (evaluat* OR effect* OR outcome*)) OR program OR programme OR "secondary analys*" OR ((evaluat* OR intervention* OR treatment*) and (control* OR study OR program* OR comparison OR comparative))) OR AB (random* OR placebo* OR ((single OR double OR triple OR treble) N1 blind*) OR (time N1 series) OR "quasi‐experiment*" OR "pre test" OR pretest OR "pre‐intervention" OR "post test" OR posttest OR "post‐intervention" OR "controlled before" OR "independent panel" OR "panel stud* OR "intervention* stud*" OR "before and after" OR "repeat* measure* OR "evaluat* stud*" OR "compari* stud*" OR trial OR "follow up assessment*" OR groups OR ((intervention OR interventional OR process OR program) N8 (evaluat* OR effect* OR outcome*)) OR program OR programme OR "secondary analys*" OR ((evaluat* OR intervention* OR treatment*) and (control* OR study OR program* OR comparison OR comparative)))
Country terms
MH ("Developing Countries" OR "Medically Underserved Area" OR "Africa+" OR "Asia+" OR "South America+" OR "Central America+" OR "Latin America") OR TI (Africa OR Asia OR "South America" OR "Latin America" OR "Central America" OR ((developing OR "less* developed" OR "third world" OR "under developed" OR "middle income" OR "low income" OR underserved OR "under served" OR deprived OR poor*) N1 (count* OR nation OR nations OR state OR states OR population OR populations)) OR lmic OR lmics) OR AB (Africa OR Asia OR "South America" OR "Latin America" OR "Central America" OR ((developing OR "less* developed" OR "third world" OR "under developed" OR "middle income" OR "low income" OR underserved OR "under served" OR deprived OR poor*) N1 (count* OR nation OR nations OR state OR states OR population OR populations)) OR lmic OR lmics)
OR
TI(Samoa* OR Argentin* OR Beliz* OR Botswana* OR Brazil* OR Bulgaria* OR Chile* OR Comoro* OR "Costa Rica*" OR Croatia* OR Dominica* OR Guinea* OR Gabon* OR Grenada* OR Hungar* OR Kazakh* OR Latvia* OR Leban* OR Libya* OR Lithuania* OR Malaysia* OR Mauriti* OR Mexic* OR Micronesia* OR Montenegr* OR Oman* OR Palau* OR Panama* OR Poland OR Polish OR Romania* OR Russia* OR Seychelles* OR Slovak* OR "Saint Kitts" OR Nevis OR "Saint Lucia*" OR "Saint Vincent" OR Grenadines OR Turk* OR Urugua* OR Venezuel* OR Yugoslavia* OR Libia* OR Mayotte OR "Mariana Island*" OR Serbia* OR "St Kitts" OR "St Lucia*" OR "St Vincent" OR Albania* OR Algeria* OR Angol* OR Armenia* OR Azerbaijan* OR Belarus* OR Bhutan* OR Bolivia* OR Bosnia* OR Herzegovin* OR Cameroon* OR China OR Chinese OR Colombia* OR Congo* OR Cuba* OR Djibouti* OR Ecuador* OR Egypt* OR "El Salvador*" OR Fiji* OR Georgia* OR Guam* OR Guatemal* OR Guyana* OR Hondur* OR "Indian Ocean Island*" OR Indonesia* OR Iran* OR Iraq* OR Jamaica* OR Jordan* OR Lesotho OR Macedonia* OR "Marshall Island*" OR Micronesia* OR "Middle East*" OR Moldova* OR Morocc* OR Namibia* OR Nicaragua* OR Paraguay* OR Peru* OR Philippin* OR "Sri Lanka*" OR Suriname* OR Swaziland* OR Syria* OR Thai* OR Tonga* OR Tunisia* OR Turkmen* OR Ukrain* OR Vanuatu* OR "Cape Verd*" OR Gaza OR Kiribati* OR Maldives OR Palestin* OR "West Bank" OR Afghan* OR Bangladesh* OR Benin* OR "Burkina Faso*" OR Burundi* OR Cambodia* OR "Central African Republic*" OR Chad* OR Comoros OR Congo* OR "Cote d Ivoire" OR Eritrea* OR Ethiopia* OR Gambia* OR Ghana* OR Guinea* OR "Guinea‐Bissau" OR Haiti* OR India* OR Kenya* OR Korea* OR Kyrgyz* OR Laos OR Laot* OR Liberia* OR Madagascar OR Malagasy OR Malawi* OR Mali* OR Mauritania* OR Melanesia* OR Mongolia* OR Mozambi* OR Myanmar OR Nepal* OR Niger* OR Nigeria* OR Pakistan* OR "Papua New Guinea*" OR Rwanda* OR Senegal* OR "Sierra Leone*" OR Somalia* OR Sudan* OR Tajikistan* OR Tanzania* OR "East Timor*" OR Togo* OR Uganda* OR Uzbek* OR Vietnam* OR Yemen* OR Zambia* OR Zimbabw* OR Burm* OR Lao OR "North Korea*" OR "Solomon Island*" OR "Sao Tome" OR Timor* OR "Viet Nam*" OR "ivory coast")
OR
AB(Samoa* OR Argentin* OR Beliz* OR Botswana* OR Brazil* OR Bulgaria* OR Chile* OR Comoro* OR "Costa Rica*" OR Croatia* OR Dominica* OR Guinea* OR Gabon* OR Grenada* OR Hungar* OR Kazakh* OR Latvia* OR Leban* OR Libya* OR Lithuania* OR Malaysia* OR Mauriti* OR Mexic* OR Micronesia* OR Montenegr* OR Oman* OR Palau* OR Panama* OR Poland OR Polish OR Romania* OR Russia* OR Seychelles* OR Slovak* OR "Saint Kitts" OR Nevis OR "Saint Lucia*" OR "Saint Vincent" OR Grenadines OR Turk* OR Urugua* OR Venezuel* OR Yugoslavia* OR Libia* OR Mayotte OR "Mariana Island*" OR Serbia* OR "St Kitts" OR "St Lucia*" OR "St Vincent" OR Albania* OR Algeria* OR Angol* OR Armenia* OR Azerbaijan* OR Belarus* OR Bhutan* OR Bolivia* OR Bosnia* OR Herzegovin* OR Cameroon* OR China OR Chinese OR Colombia* OR Congo* OR Cuba* OR Djibouti* OR Ecuador* OR Egypt* OR "El Salvador*" OR Fiji* OR Georgia* OR Guam* OR Guatemal* OR Guyana* OR Hondur* OR "Indian Ocean Island*" OR Indonesia* OR Iran* OR Iraq* OR Jamaica* OR Jordan* OR Lesotho OR Macedonia* OR "Marshall Island*" OR Micronesia* OR "Middle East*" OR Moldova* OR Morocc* OR Namibia* OR Nicaragua* OR Paraguay* OR Peru* OR Philippin* OR "Sri Lanka*" OR Suriname* OR Swaziland* OR Syria* OR Thai* OR Tonga* OR Tunisia* OR Turkmen* OR Ukrain* OR Vanuatu* OR "Cape Verd*" OR Gaza OR Kiribati* OR Maldives OR Palestin* OR "West Bank" OR Afghan* OR Bangladesh* OR Benin* OR "Burkina Faso*" OR Burundi* OR Cambodia* OR "Central African Republic*" OR Chad* OR Comoros OR Congo* OR "Cote d Ivoire" OR Eritrea* OR Ethiopia* OR Gambia* OR Ghana* OR Guinea* OR "Guinea‐Bissau" OR Haiti* OR India* OR Kenya* OR Korea* OR Kyrgyz* OR Laos OR Laot* OR Liberia* OR Madagascar OR Malagasy OR Malawi* OR Mali* OR Mauritania* OR Melanesia* OR Mongolia* OR Mozambi* OR Myanmar OR Nepal* OR Niger* OR Nigeria* OR Pakistan* OR "Papua New Guinea*" OR Rwanda* OR Senegal* OR "Sierra Leone*" OR Somalia* OR Sudan* OR Tajikistan* OR Tanzania* OR "East Timor*" OR Togo* OR Uganda* OR Uzbek* OR Vietnam* OR Yemen* OR Zambia* OR Zimbabw* OR Burm* OR Lao.tw. OR "North Korea*" OR "Solomon Island*" OR "Sao Tome" OR Timor* OR "Viet Nam*" OR "ivory coast")
OR
MW(Samoa* OR Argentin* OR Beliz* OR Botswana* OR Brazil* OR Bulgaria* OR Chile* OR Comoro* OR "Costa Rica*" OR Croatia* OR Dominica* OR Guinea* OR Gabon* OR Grenada* OR Hungar* OR Kazakh* OR Latvia* OR Leban* OR Libya* OR Lithuania* OR Malaysia* OR Mauriti* OR Mexic* OR Micronesia* OR Montenegr* OR Oman* OR Palau* OR Panama* OR Poland OR Polish OR Romania* OR Russia* OR Seychelles* OR Slovak* OR "Saint Kitts" OR Nevis OR "Saint Lucia*" OR "Saint Vincent" OR Grenadines OR Turk* OR Urugua* OR Venezuel* OR Yugoslavia* OR Libia* OR Mayotte OR "Mariana Island*" OR Serbia* OR "St Kitts" OR "St Lucia*" OR "St Vincent" OR Albania* OR Algeria* OR Angol* OR Armenia* OR Azerbaijan* OR Belarus* OR Bhutan* OR Bolivia* OR Bosnia* OR Herzegovin* OR Cameroon* OR China OR Chinese OR Colombia* OR Congo* OR Cuba* OR Djibouti* OR Ecuador* OR Egypt* OR "El Salvador*" OR Fiji* OR Georgia* OR Guam* OR Guatemal* OR Guyana* OR Hondur* OR "Indian Ocean Island*" OR Indonesia* OR Iran* OR Iraq* OR Jamaica* OR Jordan* OR Lesotho OR Macedonia* OR "Marshall Island*" OR Micronesia* OR "Middle East*" OR Moldova* OR Morocc* OR Namibia* OR Nicaragua* OR Paraguay* OR Peru* OR Philippin* OR "Sri Lanka*" OR Suriname* OR Swaziland* OR Syria* OR Thai* OR Tonga* OR Tunisia* OR Turkmen* OR Ukrain* OR Vanuatu* OR "Cape Verd*" OR Gaza OR Kiribati* OR Maldives OR Palestin* OR "West Bank" OR Afghan* OR Bangladesh* OR Benin* OR "Burkina Faso*" OR Burundi* OR Cambodia* OR "Central African Republic*" OR Chad* OR Comoros OR Congo* OR "Cote d Ivoire" OR Eritrea* OR Ethiopia* OR Gambia* OR Ghana* OR Guinea* OR "Guinea‐Bissau" OR Haiti* OR India* OR Kenya* OR Korea* OR Kyrgyz* OR Laos OR Laot* OR Liberia* OR Madagascar OR Malagasy OR Malawi* OR Mali* OR Mauritania* OR Melanesia* OR Mongolia* OR Mozambi* OR Myanmar OR Nepal* OR Niger* OR Nigeria* OR Pakistan* OR "Papua New Guinea*" OR Rwanda* OR Senegal* OR "Sierra Leone*" OR Somalia* OR Sudan* OR Tajikistan* OR Tanzania* OR "East Timor*" OR Togo* OR Uganda* OR Uzbek* OR Vietnam* OR Yemen* OR Zambia* OR Zimbabw* OR Burm* OR Lao.tw. OR "North Korea*" OR "Solomon Island*" OR "Sao Tome" OR Timor* OR "Viet Nam*" OR "ivory coast")
EconLit
08 September 2021
2538 records
Intervention terms
ti((social NEAR/1 (assistance OR polic* OR welfare OR insurance* OR protection)) OR "public assistance" OR "family policy" OR ((financial OR cash OR pay* OR monetary OR money) NEAR/3 (transfer* OR measure* OR incentive* OR allowance* OR exclu* OR reform* OR gain* OR credit OR credits OR benefit OR benefits))) OR ab((social NEAR/1 (assistance OR polic* OR welfare OR insurance* OR protection)) OR "public assistance" OR "family policy" OR ((financial OR cash OR pay* OR monetary OR money) NEAR/3 (transfer* OR measure* OR incentive* OR allowance* OR exclu* OR reform* OR gain* OR credit OR credits OR benefit OR benefits)))
Study terms
ti(random* OR placebo* OR ((single OR double OR triple OR treble) NEAR/1 blind*) OR (time NEAR/1 series) OR "quasi‐experiment*" OR "pre test" OR pretest OR "pre‐intervention" OR "post test" OR posttest OR "post‐intervention" OR "controlled before" OR "independent panel" OR "panel stud* OR "intervention* stud*" OR "before and after" OR "repeat* measure* OR "evaluat* stud*" OR "compari* stud*" OR trial OR "follow up assessment*" OR groups OR ((intervention OR interventional OR process OR program) NEAR/8 (evaluat* OR effect* OR outcome*)) OR program OR programme OR "secondary analys*" OR ((evaluat* OR intervention* OR treatment*) AND (control* OR study OR program* OR comparison OR comparative))) OR ab(random* OR placebo* OR ((single OR double OR triple OR treble) NEAR/1 blind*) OR (time NEAR/1 series) OR "quasi‐experiment*" OR "pre test" OR pretest OR "pre‐intervention" OR "post test" OR posttest OR "post‐intervention" OR "controlled before" OR "independent panel" OR "panel stud* OR "intervention* stud*" OR "before and after" OR "repeat* measure* OR "evaluat* stud*" OR "compari* stud*" OR trial OR "follow up assessment*" OR groups OR ((intervention OR interventional OR process OR program) NEAR/8 (evaluat* OR effect* OR outcome*)) OR program OR programme OR "secondary analys*" OR ((evaluat* OR intervention* OR treatment*) AND (control* OR study OR program* OR comparison OR comparative)))
Country terms
SU.EXACT("Developing Countries") OR ti(Africa OR Asia OR "South America" OR "Latin America" OR "Central America" OR ((developing OR "less* developed" OR "third world" OR "under developed" OR "middle income" OR "low income" OR underserved OR "under served" OR deprived OR poor*) NEAR/1 (count* OR nation OR nations OR state OR states OR population OR populations)) OR lmic OR lmics) OR ab(Africa OR Asia OR "South America" OR "Latin America" OR "Central America" OR ((developing OR "less* developed" OR "third world" OR "under developed" OR "middle income" OR "low income" OR underserved OR "under served" OR deprived OR poor*) NEAR/1 (count* OR nation OR nations OR state OR states OR population OR populations)) OR lmic OR lmics) OR su(Africa OR Asia OR "South America" OR "Latin America" OR "Central America")
OR
(Samoa* OR Argentin* OR Beliz* OR Botswana* OR Brazil* OR Bulgaria* OR Chile* OR Comoro* OR "Costa Rica*" OR Croatia* OR Dominica* OR Guinea* OR Gabon* OR Grenada* OR Hungar* OR Kazakh* OR Latvia* OR Leban* OR Libya* OR Lithuania* OR Malaysia* OR Mauriti* OR Mexic* OR Micronesia* OR Montenegr* OR Oman* OR Palau* OR Panama* OR Poland OR Polish OR Romania* OR Russia* OR Seychelles* OR Slovak* OR "Saint Kitts" OR Nevis OR "Saint Lucia*" OR "Saint Vincent" OR Grenadines OR Turk* OR Urugua* OR Venezuel* OR Yugoslavia* OR Libia* OR Mayotte OR "Mariana Island*" OR Serbia* OR "St Kitts" OR "St Lucia*" OR "St Vincent" OR Albania* OR Algeria* OR Angol* OR Armenia* OR Azerbaijan* OR Belarus* OR Bhutan* OR Bolivia* OR Bosnia* OR Herzegovin* OR Cameroon* OR China OR Chinese OR Colombia* OR Congo* OR Cuba* OR Djibouti* OR Ecuador* OR Egypt* OR "El Salvador*" OR Fiji* OR Georgia* OR Guam* OR Guatemal* OR Guyana* OR Hondur* OR "Indian Ocean Island*" OR Indonesia* OR Iran* OR Iraq* OR Jamaica* OR Jordan* OR Lesotho OR Macedonia* OR "Marshall Island*" OR Micronesia* OR "Middle East*" OR Moldova* OR Morocc* OR Namibia* OR Nicaragua* OR Paraguay* OR Peru* OR Philippin* OR "Sri Lanka*" OR Suriname* OR Swaziland* OR Syria* OR Thai* OR Tonga* OR Tunisia* OR Turkmen* OR Ukrain* OR Vanuatu* OR "Cape Verd*" OR Gaza OR Kiribati* OR Maldives OR Palestin* OR "West Bank" OR Afghan* OR Bangladesh* OR Benin* OR "Burkina Faso*" OR Burundi* OR Cambodia* OR "Central African Republic*" OR Chad* OR Comoros OR Congo* OR "Cote d Ivoire" OR Eritrea* OR Ethiopia* OR Gambia* OR Ghana* OR Guinea* OR "Guinea‐Bissau" OR Haiti* OR India* OR Kenya* OR Korea* OR Kyrgyz* OR Laos OR Laot* OR Liberia* OR Madagascar OR Malagasy OR Malawi* OR Mali* OR Mauritania* OR Melanesia* OR Mongolia* OR Mozambi* OR Myanmar OR Nepal* OR Niger* OR Nigeria* OR Pakistan* OR "Papua New Guinea*" OR Rwanda* OR Senegal* OR "Sierra Leone*" OR Somalia* OR Sudan* OR Tajikistan* OR Tanzania* OR "East Timor*" OR Togo* OR Uganda* OR Uzbek* OR Vietnam* OR Yemen* OR Zambia* OR Zimbabw* OR Burm* OR Lao OR "North Korea*" OR "Solomon Island*" OR "Sao Tome" OR Timor* OR "Viet Nam*" OR "ivory coast")
3IE database
08 September 2021
54 records
cash transfer OR financial credit OR financial benefit OR financial incentive
PsycINFO
08 September 2021
2192 records
Intervention terms
DE ("Welfare Services (Government)" OR "Social Security" OR "Monetary Incentives" OR "Government Programs") OR TI ((social N1 (assistance OR polic* OR welfare OR insurance* OR protection)) OR "public assistance" OR "family policy" OR ((financial OR cash OR pay* OR monetary OR money) N3 (transfer* OR measure* OR incentive* OR allowance* OR exclu* OR reform* OR gain* OR credit OR credits OR benefit OR benefits))) OR AB ((social N1 (assistance OR polic* OR welfare OR insurance* OR protection)) OR "public assistance" OR "family policy" OR ((financial OR cash OR pay* OR monetary OR money) N3 (transfer* OR measure* OR incentive* OR allowance* OR exclu* OR reform* OR gain* OR credit OR credits OR benefit OR benefits)))
Study terms
DE ("Between Groups Design" OR "Clinical Trials" OR "Cohort Analysis" OR "Followup Studies" OR "Longitudinal Studies" OR "Repeated Measures" OR "Between Groups Design" OR "Cohort Analysis" OR "Prospective Studies" OR "Retrospective Studies" OR "Placebo" OR "Experiment Controls" OR "Program Evaluation") OR TI (random* OR placebo* OR ((single OR double OR triple OR treble) N1 blind*) OR (time N1 series) OR "quasi‐experiment*" OR "pre test" OR pretest OR "pre‐intervention" OR "post test" OR posttest OR "post‐intervention" OR "controlled before" OR "independent panel" OR "panel stud* OR "intervention* stud*" OR "before and after" OR "repeat* measure* OR "evaluat* stud*" OR "compari* stud*" OR trial OR "follow up assessment*" OR groups OR ((intervention OR interventional OR process OR program) N8 (evaluat* OR effect* OR outcome*)) OR program OR programme OR "secondary analys*" OR ((evaluat* OR intervention* OR treatment*) and (control* OR study OR program* OR comparison OR comparative))) OR AB (random* OR placebo* OR ((single OR double OR triple OR treble) N1 blind*) OR (time N1 series) OR "quasi‐experiment*" OR "pre test" OR pretest OR "pre‐intervention" OR "post test" OR posttest OR "post‐intervention" OR "controlled before" OR "independent panel" OR "panel stud* OR "intervention* stud*" OR "before and after" OR "repeat* measure* OR "evaluat* stud*" OR "compari* stud*" OR trial OR "follow up assessment*" OR groups OR ((intervention OR interventional OR process OR program) N8 (evaluat* OR effect* OR outcome*)) OR program OR programme OR "secondary analys*" OR ((evaluat* OR intervention* OR treatment*) and (control* OR study OR program* OR comparison OR comparative)))
Country terms
DE ("Developing Countries") OR TI (Africa OR Asia OR "South America" OR "Latin America" OR "Central America" OR ((developing OR "less* developed" OR "third world" OR "under developed" OR "middle income" OR "low income" OR underserved OR "under served" OR deprived OR poor*) N1 (count* OR nation OR nations OR state OR states OR population OR populations)) OR lmic OR lmics) OR AB (Africa OR Asia OR "South America" OR "Latin America" OR "Central America" OR ((developing OR "less* developed" OR "third world" OR "under developed" OR "middle income" OR "low income" OR underserved OR "under served" OR deprived OR poor*) N1 (count* OR nation OR nations OR state OR states OR population OR populations)) OR lmic OR lmics) OR KW (Africa OR Asia OR "South America" OR "Latin America" OR "Central America" OR ((developing OR "less* developed" OR "third world" OR "under developed" OR "middle income" OR "low income" OR underserved OR "under served" OR deprived OR poor*) N1 (count* OR nation OR nations OR state OR states OR population OR populations)) OR lmic OR lmics)
OR
TI( Samoa* OR Argentin* OR Beliz* OR Botswana* OR Brazil* OR Bulgaria* OR Chile* OR Comoro* OR "Costa Rica*" OR Croatia* OR Dominica* OR Guinea* OR Gabon* OR Grenada* OR Hungar* OR Kazakh* OR Latvia* OR Leban* OR Libya* OR Lithuania* OR Malaysia* OR Mauriti* OR Mexic* OR Micronesia* OR Montenegr* OR Oman* OR Palau* OR Panama* OR Poland OR Polish OR Romania* OR Russia* OR Seychelles* OR Slovak* OR "Saint Kitts" OR Nevis OR "Saint Lucia*" OR "Saint Vincent" OR Grenadines OR Turk* OR Urugua* OR Venezuel* OR Yugoslavia* OR Libia* OR Mayotte OR "Mariana Island*" OR Serbia* OR "St Kitts" OR "St Lucia*" OR "St Vincent" OR Albania* OR Algeria* OR Angol* OR Armenia* OR Azerbaijan* OR Belarus* OR Bhutan* OR Bolivia* OR Bosnia* OR Herzegovin* OR Cameroon* OR China OR Chinese OR Colombia* OR Congo* OR Cuba* OR Djibouti* OR Ecuador* OR Egypt* OR "El Salvador*" OR Fiji* OR Georgia* OR Guam* OR Guatemal* OR Guyana* OR Hondur* OR "Indian Ocean Island*" OR Indonesia* OR Iran* OR Iraq* OR Jamaica* OR Jordan* OR Lesotho OR Macedonia* OR "Marshall Island*" OR Micronesia* OR "Middle East*" OR Moldova* OR Morocc* OR Namibia* OR Nicaragua* OR Paraguay* OR Peru* OR Philippin* OR "Sri Lanka*" OR Suriname* OR Swaziland* OR Syria* OR Thai* OR Tonga* OR Tunisia* OR Turkmen* OR Ukrain* OR Vanuatu* OR "Cape Verd*" OR Gaza OR Kiribati* OR Maldives OR Palestin* OR "West Bank" OR Afghan* OR Bangladesh* OR Benin* OR "Burkina Faso*" OR Burundi* OR Cambodia* OR "Central African Republic*" OR Chad* OR Comoros OR Congo* OR "Cote d Ivoire" OR Eritrea* OR Ethiopia* OR Gambia* OR Ghana* OR Guinea* OR "Guinea‐Bissau" OR Haiti* OR India* OR Kenya* OR Korea* OR Kyrgyz* OR Laos OR Laot* OR Liberia* OR Madagascar OR Malagasy OR Malawi* OR Mali* OR Mauritania* OR Melanesia* OR Mongolia* OR Mozambi* OR Myanmar OR Nepal* OR Niger* OR Nigeria* OR Pakistan* OR "Papua New Guinea*" OR Rwanda* OR Senegal* OR "Sierra Leone*" OR Somalia* OR Sudan* OR Tajikistan* OR Tanzania* OR "East Timor*" OR Togo* OR Uganda* OR Uzbek* OR Vietnam* OR Yemen* OR Zambia* OR Zimbabw* OR Burm* OR Lao OR "North Korea*" OR "Solomon Island*" OR "Sao Tome" OR Timor* OR "Viet Nam*" OR "ivory coast")
OR
AB(Samoa* OR Argentin* OR Beliz* OR Botswana* OR Brazil* OR Bulgaria* OR Chile* OR Comoro* OR "Costa Rica*" OR Croatia* OR Dominica* OR Guinea* OR Gabon* OR Grenada* OR Hungar* OR Kazakh* OR Latvia* OR Leban* OR Libya* OR Lithuania* OR Malaysia* OR Mauriti* OR Mexic* OR Micronesia* OR Montenegr* OR Oman* OR Palau* OR Panama* OR Poland OR Polish OR Romania* OR Russia* OR Seychelles* OR Slovak* OR "Saint Kitts" OR Nevis OR "Saint Lucia*" OR "Saint Vincent" OR Grenadines OR Turk* OR Urugua* OR Venezuel* OR Yugoslavia* OR Libia* OR Mayotte OR "Mariana Island*" OR Serbia* OR "St Kitts" OR "St Lucia*" OR "St Vincent" OR Albania* OR Algeria* OR Angol* OR Armenia* OR Azerbaijan* OR Belarus* OR Bhutan* OR Bolivia* OR Bosnia* OR Herzegovin* OR Cameroon* OR China OR Chinese OR Colombia* OR Congo* OR Cuba* OR Djibouti* OR Ecuador* OR Egypt* OR "El Salvador*" OR Fiji* OR Georgia* OR Guam* OR Guatemal* OR Guyana* OR Hondur* OR "Indian Ocean Island*" OR Indonesia* OR Iran* OR Iraq* OR Jamaica* OR Jordan* OR Lesotho OR Macedonia* OR "Marshall Island*" OR Micronesia* OR "Middle East*" OR Moldova* OR Morocc* OR Namibia* OR Nicaragua* OR Paraguay* OR Peru* OR Philippin* OR "Sri Lanka*" OR Suriname* OR Swaziland* OR Syria* OR Thai* OR Tonga* OR Tunisia* OR Turkmen* OR Ukrain* OR Vanuatu* OR "Cape Verd*" OR Gaza OR Kiribati* OR Maldives OR Palestin* OR "West Bank" OR Afghan* OR Bangladesh* OR Benin* OR "Burkina Faso*" OR Burundi* OR Cambodia* OR "Central African Republic*" OR Chad* OR Comoros OR Congo* OR "Cote d Ivoire" OR Eritrea* OR Ethiopia* OR Gambia* OR Ghana* OR Guinea* OR "Guinea‐Bissau" OR Haiti* OR India* OR Kenya* OR Korea* OR Kyrgyz* OR Laos OR Laot* OR Liberia* OR Madagascar OR Malagasy OR Malawi* OR Mali* OR Mauritania* OR Melanesia* OR Mongolia* OR Mozambi* OR Myanmar OR Nepal* OR Niger* OR Nigeria* OR Pakistan* OR "Papua New Guinea*" OR Rwanda* OR Senegal* OR "Sierra Leone*" OR Somalia* OR Sudan* OR Tajikistan* OR Tanzania* OR "East Timor*" OR Togo* OR Uganda* OR Uzbek* OR Vietnam* OR Yemen* OR Zambia* OR Zimbabw* OR Burm* OR Lao.tw. OR "North Korea*" OR "Solomon Island*" OR "Sao Tome" OR Timor* OR "Viet Nam*" OR "ivory coast")
OR
KW (Argentin* OR Beliz* OR Botswana* OR Brazil* OR Bulgaria* OR Chile* OR Comoro* OR "Costa Rica*" OR Croatia* OR Dominica* OR Guinea* OR Gabon* OR Grenada* OR Hungar* OR Kazakh* OR Latvia* OR Leban* OR Libya* OR Lithuania* OR Malaysia* OR Mauriti* OR Mexic* OR Micronesia* OR Montenegr* OR Oman* OR Palau* OR Panama* OR Poland OR Polish OR Romania* OR Russia* OR Seychelles* OR Slovak* OR "Saint Kitts" OR Nevis OR "Saint Lucia*" OR "Saint Vincent" OR Grenadines OR Turk* OR Urugua* OR Venezuel* OR Yugoslavia* OR Libia* OR Mayotte OR "Mariana Island*" OR Serbia* OR "St Kitts" OR "St Lucia*" OR "St Vincent" OR Albania* OR Algeria* OR Angol* OR Armenia* OR Azerbaijan* OR Belarus* OR Bhutan* OR Bolivia* OR Bosnia* OR Herzegovin* OR Cameroon* OR China OR Chinese OR Colombia* OR Congo* OR Cuba* OR Djibouti* OR Ecuador* OR Egypt* OR "El Salvador*" OR Fiji* OR Georgia* OR Guam* OR Guatemal* OR Guyana* OR Hondur* OR "Indian Ocean Island*" OR Indonesia* OR Iran* OR Iraq* OR Jamaica* OR Jordan* OR Lesotho OR Macedonia* OR "Marshall Island*" OR Micronesia* OR "Middle East*" OR Moldova* OR Morocc* OR Namibia* OR Nicaragua* OR Paraguay* OR Peru* OR Philippin* OR "Sri Lanka*" OR Suriname* OR Swaziland* OR Syria* OR Thai* OR Tonga* OR Tunisia* OR Turkmen* OR Ukrain* OR Vanuatu* OR "Cape Verd*" OR Gaza OR Kiribati* OR Maldives OR Palestin* OR "West Bank" OR Afghan* OR Bangladesh* OR Benin* OR "Burkina Faso*" OR Burundi* OR Cambodia* OR "Central African Republic*" OR Chad* OR Comoros OR Congo* OR "Cote d Ivoire" OR Eritrea* OR Ethiopia* OR Gambia* OR Ghana* OR Guinea* OR "Guinea‐Bissau" OR Haiti* OR India* OR Kenya* OR Korea* OR Kyrgyz* OR Laos OR Laot* OR Liberia* OR Madagascar OR Malagasy OR Malawi* OR Mali* OR Mauritania* OR Melanesia* OR Mongolia* OR Mozambi* OR Myanmar OR Nepal* OR Niger* OR Nigeria* OR Pakistan* OR "Papua New Guinea*" OR Rwanda* OR Senegal* OR "Sierra Leone*" OR Somalia* OR Sudan* OR Tajikistan* OR Tanzania* OR "East Timor*" OR Togo* OR Uganda* OR Uzbek* OR Vietnam* OR Yemen* OR Zambia* OR Zimbabw* OR Burm* OR Lao.tw. OR "North Korea*" OR "Solomon Island*" OR "Sao Tome" OR Timor* OR "Viet Nam*" OR "ivory coast")
PubMed (excluding Medline‐indexed articles)
08 September 2021
3502 records
Intervention terms
social assistance[tiab] OR social polic*[tiab] OR social welfare[tiab] OR social insurance*[tiab] OR social protection*[tiab] OR public assistance[tiab] OR family policy[tiab] OR ((financial[tiab] OR cash[tiab] OR pay*[tiab] OR monetary[tiab] OR money[tiab]) AND (transfer*[tiab] OR measure*[tiab] OR incentive*[tiab] OR allowance*[tiab] OR exclu*[tiab] OR reform*[tiab] OR gain*[tiab] OR credit*[tiab] OR benefit*[tiab]))
Study terms
random*[tiab] OR placebo*[tiab] OR single blind*[tiab] OR double blind*[tiab] OR triple blind*[tiab] OR treble blind*[tiab] OR time series[tiab] OR quasi‐experiment*[tiab] OR pre test[tiab] OR pretest[tiab] OR pre‐intervention[tiab] OR post test[tiab] OR posttest[tiab] OR post‐intervention[tiab] OR controlled before[tiab] OR independent panel[tiab] OR panel stud*[tiab] OR intervention stud*[tiab] OR interventional stud*[tiab] OR "before and after"[tiab] OR repeat measure*[tiab] OR repeated measure*[tiab] OR evaluation stud*[tiab] OR evaluative stud*[tiab] OR comparison stud*[tiab] OR comparative stud*[tiab] OR trial[tiab] OR follow up assessment*[tiab] OR groups[tiab] OR ((intervention[tiab] OR interventional[tiab] OR process[tiab] OR program[tiab]) AND (evaluat*[tiab] OR effect*[tiab] OR outcome*[tiab])) OR program[tiab] OR programme[tiab] OR secondary analys*[tiab] OR ((evaluat*[tiab] OR intervention*[tiab] OR treatment*[tiab]) AND (control*[tiab] OR study[tiab] OR program*[tiab] OR comparison[tiab] OR comparative[tiab]))
Country terms
Africa[tw] OR Asia[tw] OR South America[tw] OR Latin America[tw] OR Central America[tw] OR developing countr*[tw] OR less developed countr*[tw] OR third world countr*[tw] OR under developed countr*[tw] OR middle income countr*[tw] OR low income countr*[tw] OR underserved countr*[tw] OR under served countr*[tw] OR deprived countr*[tw] OR poor countr*[tw] OR third world nation*[tw] OR under developed nation*[tw] OR middle income nation*[tw] OR low income nation*[tw] OR underserved nation*[tw] OR under served nation*[tw] OR deprived nation*[tw] OR poor nation*[tw] OR third world state*[tw] OR under developed state*[tw] OR middle income state*[tw] OR low income state*[tw] OR underserved state*[tw] OR under served state*[tw] OR deprived state*[tw] OR poor state*[tw] OR third world population*[tw] OR under developed population*[tw] OR middle income population*[tw] OR low income population*[tw] OR underserved population*[tw] OR under served population*[tw] OR deprived population*[tw] OR poor population*[tw] OR limic[tw] OR Samoa*[tw] OR Argentin*[tw] OR Beliz*[tw] OR Botswana*[tw] OR Brazil*[tw] OR Bulgaria*[tw] OR Chile*[tw] OR Comoro*[tw] OR Costa Rica*[tw] OR Croatia*[tw] OR Dominica*[tw] OR Equatorial Guinea*[tw] OR Gabon*[tw] OR Grenada*[tw] OR Hungar*[tw] OR Kazakh*[tw] OR Latvia*[tw] OR Leban*[tw] OR Libya*[tw] OR Lithuania*[tw] OR Malaysia*[tw] OR Mauriti*[tw] OR Mexic*[tw] OR Micronesia*[tw] OR Montenegr*[tw] OR Oman*[tw] OR Palau*[tw] OR Panama*[tw] OR Poland[tw] OR Polish[tw] OR Romania*[tw] OR Russia*[tw] OR Seychelles*[tw] OR Slovakia*[tw] OR South Africa*[tw] OR "Saint Kitts and Nevis"[tw] OR Saint Lucia*[tw] OR Saint Vincent*[tw] OR Grenadines[tw] OR Turk*[tw] OR Urugua*[tw] OR Venezuel*[tw] OR Yugoslavia*[tw] OR Guinea*[tw] OR Libia*[tw] OR Mayotte*[tw] OR Northern Mariana Island*[tw] OR Russian Federation[tw] OR Serbia*[tw] OR Slovak*[tw] OR Albania*[tw] OR Algeria*[tw] OR Angol*[tw] OR Armenia*[tw] OR Azerbaijan*[tw] OR Belarus*[tw] OR Bhutan*[tw] OR Bolivia*[tw] OR Bosnia*[tw] OR Herzegovina[tw] OR Cameroon*[tw] OR China[tw] OR Chinese[tw] OR Colombia*[tw] OR Congo*[tw] OR Cuba*[tw] OR Djibouti*[tw] OR Dominican Republic*[tw] OR Ecuador*[tw] OR Egypt*[tw] OR El Salvador*[tw] OR Fiji*[tw] OR "Georgia (Republic)"[tw] OR Georgian*[tw] OR Guam*[tw] OR Guatemal*[tw] OR Guyana*[tw] OR Hondur*[tw] OR Indian Ocean[tw] OR Indonesia*[tw] OR Iran*[tw] OR Iraq*[tw] OR Jamaica*[tw] OR Jordan*[tw] OR Lesotho[tw] OR Macedonia*[tw] OR Marshall Island*[tw] OR Micronesia*[tw] OR Middle East*[tw] OR Moldova*[tw] OR Morocc*[tw] OR Namibia*[tw] OR Nicaragua*[tw] OR Paraguay*[tw] OR Peru*[tw] OR Philippin*[tw] OR Sri Lanka*[tw] OR Suriname*[tw] OR Swaziland*[tw] OR Syria*[tw] OR Thai*[tw] OR Tonga*[tw] OR Tunisia*[tw] OR Turkmen*[tw] OR Ukrain*[tw] OR Vanuatu*[tw] OR Cape Verd*[tw] OR Gaza[tw] OR Kiribati*[tw] OR Maldives[tw] OR Marshall Island*[tw] OR Palestin*[tw] OR Syrian*[tw] OR West Bank[tw] OR Afghan*[tw] OR Bangladesh*[tw] OR Benin*[tw] OR Burkina*[tw] OR Faso*[tw] OR Burundi*[tw] OR Cambodia*[tw] OR Central African Republic*[tw]
Scopus
08 September 2021
1724 records
(TITLE(conditional* OR unconditional*) OR TITLE({subject to})) AND (TITLE‐ABS‐KEY(cash OR benefit* OR money* OR monetary OR credit*) OR TITLE‐ABS‐KEY(grant* OR transfer* OR assistance OR support OR welfare) OR TITLE‐ABS‐KEY("unconditional CT*") OR TITLE‐ABS‐KEY(uct*) OR TITLE‐ABS‐KEY("safety net") OR TITLE‐ABS‐KEY("public policy" OR "public policies") OR TITLE‐ABS‐KEY("social policy" OR "social policies") OR TITLE‐ABS‐KEY("family policy" OR "family policies") OR TITLE‐ABS‐KEY("social security") OR TITLE‐ABS‐KEY("social insurance") OR TITLE‐ABS‐KEY("social protection")) AND (TITLE‐ABS‐KEY("systematic review" OR metaanalys* OR "meta‐analys*") OR TITLE‐ABS‐KEY(randomi*) OR TITLE‐ABS‐KEY(random* W/0 allocat*) OR TITLE‐ABS‐KEY(placebo*) OR TITLE‐ABS‐KEY("single‐blind" OR "double‐blind") OR TITLE‐ABS‐KEY((single PRE/0 blind*) OR (double PRE/0 blind*) OR (triple PRE/0 blind*) OR (treble PRE/0 blind*)) OR TITLE‐ABS‐KEY("control group*") OR TITLE‐ABS‐KEY((clinical PRE/0 trial*) OR (clinical PRE/0 stud*)) OR TITLE‐ABS‐KEY((comparative PRE/0 stud*) OR (comparison PRE/0 stud*)) OR TITLE‐ABS‐KEY(intervention* W/2 stud*) OR TITLE‐ABS‐KEY(cohort PRE/0 stud*) OR TITLE‐ABS‐KEY(evaluat* W/2 stud*) OR TITLE‐ABS‐KEY(program* W/3 evaluat*) OR TITLE‐ABS‐KEY(time PRE/0 series) OR TITLE‐ABS‐KEY("quasi‐experiment*") OR TITLE‐ABS‐KEY("pre test" OR pretest OR "pre‐intervention" OR "post test" OR posttest OR "post‐intervention") OR TITLE‐ABS‐KEY("controlled before") OR TITLE‐ABS‐KEY("independent panel") OR TITLE‐ABS‐KEY(panel PRE/0 stud*) OR TITLE‐ABS‐KEY({before and after}) OR TITLE‐ABS‐KEY(repeat* W/3 measure*) OR TITLE‐ABS‐KEY((follow up PRE/0 assessment*) OR ("follow up" PRE/0 assessment*)) OR TITLE‐ABS‐KEY((follow up PRE/0 trial*) OR ("follow up" PRE/0 trial*)) OR TITLE‐ABS‐KEY((follow up PRE/0 group*) OR ("follow up" PRE/0 group*)) OR TITLE‐ABS‐KEY((intervention* W/8 evaluat*) OR (process* W/8 evaluat*) OR (program* W/8 evaluat*)) OR TITLE‐ABS‐KEY((intervention* W/8 effect*) OR (process* W/8 effect*) OR (program* W/8 effect*)) OR TITLE‐ABS‐KEY((intervention* W/8 outcome*) OR (process* W/8 outcome*) OR (program* W/8 outcome*)) OR TITLE‐ABS‐KEY(secondary PRE/2 analys*) OR TITLE‐ABS‐KEY((evaluat* OR assess* OR compar* OR outcome* OR analys*) AND (intervention* OR program* OR strateg* OR initiative* OR policy OR policies)) OR TITLE‐ABS‐KEY(economic* OR socioeconomic*) OR TITLE‐ABS‐KEY(cost* W/3 analys*) OR TITLE‐ABS‐KEY(cost* W/3 health*) OR TITLE‐ABS‐KEY(cost* W/3 high) OR TITLE‐ABS‐KEY(cost* W/3 low) OR TITLE‐ABS‐KEY(cost* W/3 effective*) OR TITLE‐ABS‐KEY(cost* W/3 benefit*) OR TITLE‐ABS‐KEY(cost* W/3 minim*) OR TITLE‐ABS‐KEY(fiscal* OR funding OR financ*) OR TITLE‐ABS‐KEY(expenditure*) OR TITLE‐ABS‐KEY(value) OR TITLE‐ABS‐KEY(budget*)) AND (EXCLUDE(SUBJAREA, "ENGI") OR EXCLUDE(SUBJAREA, "COMP") OR EXCLUDE(SUBJAREA, "MATH") OR EXCLUDE(SUBJAREA, "AGRI") OR EXCLUDE(SUBJAREA, "ENGI") OR EXCLUDE(SUBJAREA, "COMP") OR EXCLUDE(SUBJAREA, "MATH") OR EXCLUDE(SUBJAREA, "AGRI") OR EXCLUDE(SUBJAREA, "ENVI") OR EXCLUDE(SUBJAREA, "EART") OR EXCLUDE(SUBJAREA, "PHYS") OR EXCLUDE(SUBJAREA, "CENG") OR EXCLUDE(SUBJAREA, "ENER") OR EXCLUDE(SUBJAREA, "MATE") OR EXCLUDE(SUBJAREA, "CHEM") OR EXCLUDE(SUBJAREA, "ENGI") OR EXCLUDE(SUBJAREA, "COMP") OR EXCLUDE(SUBJAREA, "MATH") OR EXCLUDE(SUBJAREA, "AGRI") OR EXCLUDE(SUBJAREA, "ENVI") OR EXCLUDE(SUBJAREA, "EART") OR EXCLUDE(SUBJAREA, "PHYS") OR EXCLUDE(SUBJAREA, "CENG") OR EXCLUDE(SUBJAREA, "ENER") OR EXCLUDE(SUBJAREA, "MATE") OR EXCLUDE(SUBJAREA, "CHEM"))
Social Sciences Citation Index
08 September 2021
5013 records
Intervention terms
TS=((social NEAR/1 (assistance OR polic* OR welfare OR insurance* OR protection)) OR "public assistance" OR "family policy" OR ((financial OR cash OR pay* OR monetary OR money) NEAR/3 (transfer* OR measure* OR incentive* OR allowance* OR exclu* OR reform* OR gain* OR credit OR credits OR benefit OR benefits)))
Study terms
TS=(random* OR "random allocation" OR placebo* OR ((single OR double OR triple OR treble) NEAR/1 blind*) OR (time NEAR/1 series) OR "quasi experiment*" OR "pre test" OR pretest OR "pre‐intervention" OR "post test" OR posttest OR "post‐intervention" OR "controlled before" OR "independent panel" OR ((panel OR intervention* OR evaluat* OR compari*) NEAR/1 stud*) OR "before and after" OR "repeat* measure*" OR trial OR "follow up assessment*" OR groups OR ((intervention OR interventional OR process OR program) NEAR/8 (evaluat* OR effect* OR outcome*)) OR program OR programme OR "secondary analys*" OR ((evaluat* OR intervention* OR treatment*) AND (control* OR study OR program* OR comparison OR comparative)))
Country terms
TS=(Africa OR Asia OR "South America" OR "Latin America" OR "Central America" OR ((developing OR "less* developed" OR "third world" OR "under developed" OR "middle income" OR "low income" OR underserved OR "under served" OR deprived OR poor*) NEAR/1 (count* OR nation OR nations OR state OR states OR population OR populations)) OR lmic OR lmics)
TS=(Samoa* OR Argentin* OR Beliz* OR Botswana* OR Brazil* OR Bulgaria* OR Chile* OR Comoro* OR "Costa Rica*" OR Croatia* OR Dominica* OR Guinea* OR Gabon* OR Grenada* OR Hungar* OR Kazakh* OR Latvia* OR Leban* OR Libya* OR Lithuania* OR Malaysia* OR Mauriti* OR Mexic* OR Micronesia* OR Montenegr* OR Oman* OR Palau* OR Panama* OR Poland OR Polish OR Romania* OR Russia* OR Seychelles* OR Slovak* OR "Saint Kitts" OR Nevis OR "Saint Lucia*" OR "Saint Vincent" OR Grenadines OR Turk* OR Urugua* OR Venezuel* OR Yugoslavia* OR Libia* OR Mayotte OR "Mariana Island*" OR Serbia* OR "St Kitts" OR "St Lucia*" OR "St Vincent" OR Albania* OR Algeria* OR Angol* OR Armenia* OR Azerbaijan* OR Belarus* OR Bhutan* OR Bolivia* OR Bosnia* OR Herzegovin* OR Cameroon* OR China OR Chinese OR Colombia* OR Congo* OR Cuba* OR Djibouti* OR Ecuador* OR Egypt* OR "El Salvador*" OR Fiji* OR Georgia* OR Guam* OR Guatemal* OR Guyana* OR Hondur* OR "Indian Ocean Island*" OR Indonesia* OR Iran* OR Iraq* OR Jamaica* OR Jordan* OR Lesotho OR Macedonia* OR "Marshall Island*" OR Micronesia* OR "Middle East*" OR Moldova* OR Morocc* OR Namibia* OR Nicaragua* OR Paraguay* OR Peru* OR Philippin* OR "Sri Lanka*" OR Suriname* OR Swaziland* OR Syria* OR Thai* OR Tonga* OR Tunisia* OR Turkmen* OR Ukrain* OR Vanuatu* OR "Cape Verd*" OR Gaza OR Kiribati* OR Maldives OR Palestin* OR "West Bank" OR Afghan* OR Bangladesh* OR Benin* OR "Burkina Faso*" OR Burundi* OR Cambodia* OR "Central African Republic*" OR Chad* OR Comoros OR Congo* OR "Cote d Ivoire" OR Eritrea* OR Ethiopia* OR Gambia* OR Ghana* OR Guinea* OR "Guinea‐Bissau" OR Haiti* OR India* OR Kenya* OR Korea* OR Kyrgyz* OR Laos OR Laot* OR Liberia* OR Madagascar OR Malagasy OR Malawi* OR Mali* OR Mauritania* OR Melanesia* OR Mongolia* OR Mozambi* OR Myanmar OR Nepal* OR Niger* OR Nigeria* OR Pakistan* OR "Papua New Guinea*" OR Rwanda* OR Senegal* OR "Sierra Leone*" OR Somalia* OR Sudan* OR Tajikistan* OR Tanzania* OR "East Timor*" OR Togo* OR Uganda* OR Uzbek* OR Vietnam* OR Yemen* OR Zambia* OR Zimbabw* OR Burm* OR Lao OR "North Korea*" OR "Solomon Island*" OR "Sao Tome" OR Timor* OR "Viet Nam*" OR "ivory coast")
Sociological Abstracts
08 September 2021
3178 records
Intervention terms
ti((social NEAR/1 (assistance OR polic* OR welfare OR insurance* OR protection)) OR "public assistance" OR "family policy" OR ((financial OR cash OR pay* OR monetary OR money) NEAR/3 (transfer* OR measure* OR incentive* OR allowance* OR exclu* OR reform* OR gain* OR credit OR credits OR benefit OR benefits))) OR ab((social NEAR/1 (assistance OR polic* OR welfare OR insurance* OR protection)) OR "public assistance" OR "family policy" OR ((financial OR cash OR pay* OR monetary OR money) NEAR/3 (transfer* OR measure* OR incentive* OR allowance* OR exclu* OR reform* OR gain* OR credit OR credits OR benefit OR benefits)))
Study terms
SU.EXACT("Evaluation Research" OR "Program Evaluation" OR "Cohort Analysis") OR ti(random* OR placebo* OR ((single OR double OR triple OR treble) NEAR/1 blind*) OR (time NEAR/1 series) OR "quasi‐experiment*" OR "pre test" OR pretest OR "pre‐intervention" OR "post test" OR posttest OR "post‐intervention" OR "controlled before" OR "independent panel" OR "panel stud* OR "intervention* stud*" OR "before and after" OR "repeat* measure* OR "evaluat* stud*" OR "compari* stud*" OR trial OR "follow up assessment*" OR groups OR ((intervention OR interventional OR process OR program) NEAR/8 (evaluat* OR effect* OR outcome*)) OR program OR programme OR "secondary analys*" OR ((evaluat* OR intervention* OR treatment*) AND (control* OR study OR program* OR comparison OR comparative))) OR ab(random* OR placebo* OR ((single OR double OR triple OR treble) NEAR/1 blind*) OR (time NEAR/1 series) OR "quasi‐experiment*" OR "pre test" OR pretest OR "pre‐intervention" OR "post test" OR posttest OR "post‐intervention" OR "controlled before" OR "independent panel" OR "panel stud* OR "intervention* stud*" OR "before and after" OR "repeat* measure* OR "evaluat* stud*" OR "compari* stud*" OR trial OR "follow up assessment*" OR groups OR ((intervention OR interventional OR process OR program) NEAR/8 (evaluat* OR effect* OR outcome*)) OR program OR programme OR "secondary analys*" OR ((evaluat* OR intervention* OR treatment*) AND (control* OR study OR program* OR comparison OR comparative)))
Country terms
SU.EXACT("Developing Countries") OR ti(Africa OR Asia OR "South America" OR "Latin America" OR "Central America" OR ((developing OR "less* developed" OR "third world" OR "under developed" OR "middle income" OR "low income" OR underserved OR "under served" OR deprived OR poor*) NEAR/1 (count* OR nation OR nations OR state OR states OR population OR populations)) OR lmic OR lmics) OR ab(Africa OR Asia OR "South America" OR "Latin America" OR "Central America" OR ((developing OR "less* developed" OR "third world" OR "under developed" OR "middle income" OR "low income" OR underserved OR "under served" OR deprived OR poor*) NEAR/1 (count* OR nation OR nations OR state OR states OR population OR populations)) OR lmic OR lmics) OR su(Africa OR Asia OR "South America" OR "Latin America" OR "Central America")
OR
(Samoa* OR Argentin* OR Beliz* OR Botswana* OR Brazil* OR Bulgaria* OR Chile* OR Comoro* OR "Costa Rica*" OR Croatia* OR Dominica* OR Guinea* OR Gabon* OR Grenada* OR Hungar* OR Kazakh* OR Latvia* OR Leban* OR Libya* OR Lithuania* OR Malaysia* OR Mauriti* OR Mexic* OR Micronesia* OR Montenegr* OR Oman* OR Palau* OR Panama* OR Poland OR Polish OR Romania* OR Russia* OR Seychelles* OR Slovak* OR "Saint Kitts" OR Nevis OR "Saint Lucia*" OR "Saint Vincent" OR Grenadines OR Turk* OR Urugua* OR Venezuel* OR Yugoslavia* OR Libia* OR Mayotte OR "Mariana Island*" OR Serbia* OR "St Kitts" OR "St Lucia*" OR "St Vincent" OR Albania* OR Algeria* OR Angol* OR Armenia* OR Azerbaijan* OR Belarus* OR Bhutan* OR Bolivia* OR Bosnia* OR Herzegovin* OR Cameroon* OR China OR Chinese OR Colombia* OR Congo* OR Cuba* OR Djibouti* OR Ecuador* OR Egypt* OR "El Salvador*" OR Fiji* OR Georgia* OR Guam* OR Guatemal* OR Guyana* OR Hondur* OR "Indian Ocean Island*" OR Indonesia* OR Iran* OR Iraq* OR Jamaica* OR Jordan* OR Lesotho OR Macedonia* OR "Marshall Island*" OR Micronesia* OR "Middle East*" OR Moldova* OR Morocc* OR Namibia* OR Nicaragua* OR Paraguay* OR Peru* OR Philippin* OR "Sri Lanka*" OR Suriname* OR Swaziland* OR Syria* OR Thai* OR Tonga* OR Tunisia* OR Turkmen* OR Ukrain* OR Vanuatu* OR "Cape Verd*" OR Gaza OR Kiribati* OR Maldives OR Palestin* OR "West Bank" OR Afghan* OR Bangladesh* OR Benin* OR "Burkina Faso*" OR Burundi* OR Cambodia* OR "Central African Republic*" OR Chad* OR Comoros OR Congo* OR "Cote d Ivoire" OR Eritrea* OR Ethiopia* OR Gambia* OR Ghana* OR Guinea* OR "Guinea‐Bissau" OR Haiti* OR India* OR Kenya* OR Korea* OR Kyrgyz* OR Laos OR Laot* OR Liberia* OR Madagascar OR Malagasy OR Malawi* OR Mali* OR Mauritania* OR Melanesia* OR Mongolia* OR Mozambi* OR Myanmar OR Nepal* OR Niger* OR Nigeria* OR Pakistan* OR "Papua New Guinea*" OR Rwanda* OR Senegal* OR "Sierra Leone*" OR Somalia* OR Sudan* OR Tajikistan* OR Tanzania* OR "East Timor*" OR Togo* OR Uganda* OR Uzbek* OR Vietnam* OR Yemen* OR Zambia* OR Zimbabw* OR Burm* OR Lao OR "North Korea*" OR "Solomon Island*" OR "Sao Tome" OR Timor* OR "Viet Nam*" OR "ivory coast")
The Campbell Library: the Campbell Collaboration
08 September 2021
111 records
No search term (Social welfare) Records: 103
Cash transfer (all text) Records: 2
Financial credit (all text)
Records: 2
TRoPHI
08 September 2021
41 records
cash transfer OR financial credit OR financial benefit OR financial incentive
WHOLIS
08 September 2021
6 records
cash transfer OR financial credit OR financial benefit or financial incentive
EconPapers
08 September 2021
200 records
cash transfer OR financial credit OR financial benefit or financial incentive
National Bureau of Economic Research
08 September 2021
200 records
cash transfer health
ProQuest Dissertations & Theses Database
19 May 2017
189 records
"unconditional cash transfer"
"social cash transfer"
Social Science Research Network ‐ SSRN eLibrary
08 September 2021
195 records
cash transfer health
System for Information on Grey Literature in Europe ‐ Open‐Grey
29 June 2020
378 records (This database was discontinued from 01 December 2020.)
cash transfer OR financial credit OR financial benefit or financial incentive
The Directory of Open Access Repositories ‐ OpenDOAR
22 May 2017 (Not searched in this updated systematic review, as unavailable to the information specialist.)
100 records
cash transfer OR financial credit OR financial benefit or financial incentive
GoogleScholar
08 September 2021
60 records
unconditional cash transfer
Data and analyses
Comparison 1. Unconditional cash transfer versus no unconditional cash transfer: health services use.
| Outcome or subgroup title | No. of studies | No. of participants | Statistical method | Effect size |
|---|---|---|---|---|
| 1.1 Has ever had birth registered | 4 | Risk Ratio (M‐H, Random, 95% CI) | Totals not selected | |
| 1.1.1 Moderate concerns | 2 | Risk Ratio (M‐H, Random, 95% CI) | Totals not selected | |
| 1.1.2 High risk of bias | 2 | Risk Ratio (M‐H, Random, 95% CI) | Totals not selected | |
| 1.2 Has had a growth check in previous 6 months | 3 | 2261 | Odds Ratio (IV, Random, 95% CI) | 1.11 [0.98, 1.24] |
| 1.3 Is up to date on vaccination calendar | 3 | 563 | Risk Ratio (M‐H, Random, 95% CI) | 1.02 [0.90, 1.15] |
| 1.4 Has been given any treatment for parasites in previous year | 1 | 1478 | Odds Ratio (IV, Random, 95% CI) | 1.28 [1.06, 1.54] |
| 1.5 Has used any health service in previous 1 to 12 months | 5 | 4972 | Risk Ratio (M‐H, Random, 95% CI) | 1.04 [1.00, 1.09] |
1.4. Analysis.

Comparison 1: Unconditional cash transfer versus no unconditional cash transfer: health services use, Outcome 4: Has been given any treatment for parasites in previous year
Comparison 2. Unconditional cash transfer versus no unconditional cash transfer: health outcomes.
| Outcome or subgroup title | No. of studies | No. of participants | Statistical method | Effect size |
|---|---|---|---|---|
| 2.1 Is moderately stunted | 3 | 3298 | Risk Ratio (M‐H, Random, 95% CI) | 1.02 [0.91, 1.14] |
| 2.2 Is moderately underweight | 3 | 701 | Risk Ratio (M‐H, Random, 95% CI) | 1.00 [0.75, 1.32] |
| 2.3 Has had any illness in previous 2 weeks to 3 months | 6 | 9367 | Odds Ratio (IV, Random, 95% CI) | 0.70 [0.56, 0.88] |
| 2.4 Has been food secure in previous month | 5 | 2687 | Risk Ratio (M‐H, Random, 95% CI) | 1.25 [1.09, 1.45] |
| 2.5 Level of dietary diversity (Household Dietary Diversity Score) in previous week | 4 | 9347 | Difference‐in‐Differences (SDs) (IV, Random, 95% CI) | 0.41 [0.12, 0.69] |
| 2.6 Level of depression (Center for Epidemiologic Studies Depression Score) | 1 | 1046 | Mean Difference (IV, Random, 95% CI) | ‐0.06 [‐0.25, 0.13] |
2.3. Analysis.

Comparison 2: Unconditional cash transfer versus no unconditional cash transfer: health outcomes, Outcome 3: Has had any illness in previous 2 weeks to 3 months
2.4. Analysis.

Comparison 2: Unconditional cash transfer versus no unconditional cash transfer: health outcomes, Outcome 4: Has been food secure in previous month
2.5. Analysis.

Comparison 2: Unconditional cash transfer versus no unconditional cash transfer: health outcomes, Outcome 5: Level of dietary diversity (Household Dietary Diversity Score) in previous week
2.6. Analysis.

Comparison 2: Unconditional cash transfer versus no unconditional cash transfer: health outcomes, Outcome 6: Level of depression (Center for Epidemiologic Studies Depression Score)
Comparison 3. Unconditional cash transfers versus no unconditional cash transfers: social determinants of health.
| Outcome or subgroup title | No. of studies | No. of participants | Statistical method | Effect size |
|---|---|---|---|---|
| 3.1 Owns livestock in previous year | 4 | Risk Ratio (M‐H, Random, 95% CI) | Totals not selected | |
| 3.1.1 Low risk of bias | 1 | Risk Ratio (M‐H, Random, 95% CI) | Totals not selected | |
| 3.1.2 Some concerns | 1 | Risk Ratio (M‐H, Random, 95% CI) | Totals not selected | |
| 3.1.3 High risk of bias | 2 | Risk Ratio (M‐H, Random, 95% CI) | Totals not selected | |
| 3.2 Attends school | 8 | 7136 | Risk Ratio (M‐H, Random, 95% CI) | 1.06 [1.04, 1.09] |
| 3.3 Works | 3 | Risk Ratio (M‐H, Random, 95% CI) | Subtotals only | |
| 3.3.1 Children | 3 | 2448 | Risk Ratio (M‐H, Random, 95% CI) | 0.91 [0.80, 1.03] |
| 3.3.2 Adults | 2 | 1700 | Risk Ratio (M‐H, Random, 95% CI) | 1.00 [0.95, 1.06] |
| 3.4 Level of parenting quality (Home Observation Measurement of the Environment Score) (standard deviations) | 1 | 1118 | Mean Difference (SDs) (IV, Random, 95% CI) | 0.09 [‐0.25, 0.42] |
| 3.5 Is extremely poor | 6 | 3805 | Risk Ratio (M‐H, Random, 95% CI) | 0.92 [0.87, 0.97] |
3.2. Analysis.

Comparison 3: Unconditional cash transfers versus no unconditional cash transfers: social determinants of health, Outcome 2: Attends school
3.5. Analysis.

Comparison 3: Unconditional cash transfers versus no unconditional cash transfers: social determinants of health, Outcome 5: Is extremely poor
Comparison 4. Unconditional cash transfer versus no unconditional cash transfer: health equity.
| Outcome or subgroup title | No. of studies | No. of participants | Statistical method | Effect size |
|---|---|---|---|---|
| 4.1 Height for age (standard deviations) by rural‐urban residency, currently | 1 | Mean Difference (SDs) (IV, Random, 95% CI) | Subtotals only | |
| 4.1.1 Living in rural areas | 1 | 654 | Mean Difference (SDs) (IV, Random, 95% CI) | ‐0.09 [‐0.36, 0.18] |
| 4.1.2 Living in urban areas | 1 | 542 | Mean Difference (SDs) (IV, Random, 95% CI) | 0.13 [‐0.11, 0.37] |
| 4.2 Height for age (standard deviations) by income poverty status, currently | 1 | Mean Difference (SDs) (IV, Random, 95% CI) | Subtotals only | |
| 4.2.1 Living in income poverty | 1 | 458 | Mean Difference (SDs) (IV, Random, 95% CI) | 0.04 [‐0.12, 0.20] |
| 4.2.2 Not living in income poverty | 1 | 457 | Mean Difference (SDs) (IV, Random, 95% CI) | 0.04 [‐0.06, 0.14] |
| 4.3 Has had any illness in previous 2 weeks to 1 month by age | 1 | 14180 | Risk Ratio (M‐H, Random, 95% CI) | 0.95 [0.72, 1.26] |
| 4.3.1 Children | 1 | 1158 | Risk Ratio (M‐H, Random, 95% CI) | 0.83 [0.77, 0.90] |
| 4.3.2 Adults | 1 | 13022 | Risk Ratio (M‐H, Random, 95% CI) | 1.09 [1.04, 1.14] |
| 4.4 Has had any illness in previous 2 weeks to 3 months by gender | 1 | Risk Ratio (M‐H, Random, 95% CI) | Subtotals only | |
| 4.4.1 Girls | 1 | 428 | Risk Ratio (M‐H, Random, 95% CI) | 0.70 [0.55, 0.90] |
| 4.4.2 Boys | 1 | 440 | Risk Ratio (M‐H, Random, 95% CI) | 0.69 [0.54, 0.88] |
| 4.5 Food security index by gender | 1 | Difference‐in‐Differences (SDs) (IV, Random, 95% CI) | Subtotals only | |
| 4.5.1 Women | 1 | 686 | Difference‐in‐Differences (SDs) (IV, Random, 95% CI) | 0.27 [‐1.49, 2.03] |
| 4.5.2 Men | 1 | 686 | Difference‐in‐Differences (SDs) (IV, Random, 95% CI) | 0.23 [‐1.53, 1.99] |
| 4.6 Dietary diversity (Household Dietary Diversity Score) in previous week by rural‐urban residency | 1 | Mean Difference (SDs) (IV, Random, 95% CI) | Subtotals only | |
| 4.6.1 Living in rural area | 1 | 654 | Mean Difference (SDs) (IV, Random, 95% CI) | 0.20 [‐0.07, 0.47] |
| 4.6.2 Living in urban area | 1 | 542 | Mean Difference (SDs) (IV, Random, 95% CI) | ‐0.03 [‐0.30, 0.24] |
| 4.7 Level of dietary diversity (Household Dietary Diversity Score) in previous week by gender | 1 | Difference‐in‐Differences (IV, Random, 95% CI) | Subtotals only | |
| 4.7.1 Women | 1 | 686 | Difference‐in‐Differences (IV, Random, 95% CI) | 0.60 [0.07, 1.13] |
| 4.7.2 Men | 1 | 686 | Difference‐in‐Differences (IV, Random, 95% CI) | 0.14 [‐0.37, 0.65] |
| 4.8 Level of dietary diversity (Household Dietary Diversity Score) in previous week by income poverty status | 1 | Difference‐in‐Differences (IV, Random, 95% CI) | Subtotals only | |
| 4.8.1 Living in income poverty | 1 | 1774 | Difference‐in‐Differences (IV, Random, 95% CI) | 1.04 [1.04, 1.04] |
| 4.8.2 Not living in income poverty | 1 | 1774 | Difference‐in‐Differences (IV, Random, 95% CI) | 0.56 [0.54, 0.58] |
| 4.9 Level of depression (Center for Epidemiologic Studies Depression Score) by rural‐urban residency | 1 | Mean Difference (IV, Random, 95% CI) | Subtotals only | |
| 4.9.1 Living in rural areas | 1 | 654 | Mean Difference (IV, Random, 95% CI) | 0.26 [‐2.01, 2.53] |
| 4.9.2 Living in urban areas | 1 | 542 | Mean Difference (IV, Random, 95% CI) | 1.16 [‐1.00, 3.32] |
| 4.10 Level of depression (Center for Epidemiologic Studies Depression Score) by gender | 1 | Difference‐in‐Differences (IV, Random, 95% CI) | Subtotals only | |
| 4.10.1 Women | 1 | 1070 | Difference‐in‐Differences (IV, Random, 95% CI) | ‐2.44 [‐4.20, ‐0.68] |
| 4.10.2 Men | 1 | 1070 | Difference‐in‐Differences (IV, Random, 95% CI) | ‐1.15 [‐2.72, 0.42] |
| 4.11 Level of depression (Center for Epidemiologic Studies Depression Score) by income poverty status | 1 | Mean Difference (IV, Random, 95% CI) | Subtotals only | |
| 4.11.1 Living in income poverty | 1 | 458 | Mean Difference (IV, Random, 95% CI) | ‐0.21 [‐0.52, 0.10] |
| 4.11.2 Not living in income poverty | 1 | 457 | Mean Difference (IV, Random, 95% CI) | 0.00 [‐0.18, 0.18] |
4.3. Analysis.

Comparison 4: Unconditional cash transfer versus no unconditional cash transfer: health equity, Outcome 3: Has had any illness in previous 2 weeks to 1 month by age
Comparison 5. Additional analyses.
| Outcome or subgroup title | No. of studies | No. of participants | Statistical method | Effect size |
|---|---|---|---|---|
| 5.1 Is moderately stunted | 1 | 1331 | Risk Ratio (M‐H, Random, 95% CI) | 1.14 [0.92, 1.40] |
| 5.2 Is moderately underweight | 1 | 1331 | Risk Ratio (M‐H, Random, 95% CI) | 1.33 [0.86, 2.07] |
| 5.3 Has had any illness in previous 2 weeks to 3 months | 1 | Risk Ratio (M‐H, Random, 95% CI) | Totals not selected | |
| 5.4 Has been food secure in previous month (measure: ate meat/fish 5+ over last month) | 1 | 2970 | Risk Ratio (M‐H, Random, 95% CI) | 2.66 [2.10, 3.35] |
| 5.5 Level of dietary diversity (Household Dietary Diversity Score) in previous week | 1 | Mean Difference (IV, Random, 95% CI) | 0.00 [‐0.03, 0.03] | |
| 5.6 Owns livestock in previous year (measure: owns cattle) | 1 | 2738 | Risk Ratio (M‐H, Random, 95% CI) | 1.00 [0.48, 2.10] |
5.1. Analysis.

Comparison 5: Additional analyses, Outcome 1: Is moderately stunted
5.2. Analysis.
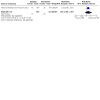
Comparison 5: Additional analyses, Outcome 2: Is moderately underweight
5.4. Analysis.

Comparison 5: Additional analyses, Outcome 4: Has been food secure in previous month (measure: ate meat/fish 5+ over last month)
5.5. Analysis.

Comparison 5: Additional analyses, Outcome 5: Level of dietary diversity (Household Dietary Diversity Score) in previous week
5.6. Analysis.
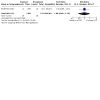
Comparison 5: Additional analyses, Outcome 6: Owns livestock in previous year (measure: owns cattle)
Characteristics of studies
Characteristics of included studies [ordered by study ID]
Abdoulayi 2014.
| Study characteristics | ||
| Methods | Cluster‐randomised controlled trial (4 stages: stage 1, 29 village clusters in two local authorities within two districts were randomly selected; stage 2, per village cluster, lists of households eligible for the intervention were generated based on targeting criteria; stage 3, per village cluster, eligible households in the list were ordered randomly; stage 4, per village cluster, the top half or bottom half of each list was randomly assigned to intervention or control); difference‐in‐differences methods; 29 months in 2013 to 2015 | |
| Participants | 3531 households (ultra‐poor and labour‐constrained) with an unclear number of participants interviewed 3 times (baseline: June to September 2013; follow‐up 1: November 2014 to January 2015; follow‐up 2: September to October 2015), 2 districts (Salima and Mangochi), Malawi | |
| Interventions | 1 intervention group and 1 control group:
Duration: 24 months. Follow‐up: 24 months into the intervention. Intervention design: aimed to alleviate hunger and poverty among households and to improve children’s well‐being and human capital through education, nutrition, health and household productivity; was targeted to ultra‐poor (poorest 10% of the population) and/or labour‐constrained households with one or more adults; eligibility determined by the government; and provided an unclear average total amount dependent on the disbursement year, household size and number and age of school‐aged children:
paid in‐hand every second month. |
|
| Outcomes | Primary outcomes
Secondary outcomes
Alternative primary outcome measures not reported in this review
|
|
| Notes | Intervention context: pilot programme of the Government of Malawi called the Malawi Social Cash Transfer Pilot Scheme; implemented by the Government of Malawi; programme uptake was 95% to 99% of eligible households per disbursement period in the study years, population coverage was 163,000 households by 2015, and total programme costs are unclear. Funder of study: United Nations Children's Fund, Food and Agriculture Organization of the United Nations, European Union, Malawi National AIDS Commission, Government of Germany (through the KfW Development Bank), Irish Aid, and International Initiative for Impact Evaluation (3ie). Conflict of interest: none identified. | |
| Risk of bias | ||
| Bias | Authors' judgement | Support for judgement |
| Random sequence generation (selection bias) | Low risk | Randomisation was ensured |
| Allocation concealment (selection bias) | Low risk | Allocation determined by public lottery and therefore concealment protected |
| Participants recruited after cluster allocation (recruitment bias in cluster‐RCTs) | Low risk | Participants recruited before cluster allocation |
| Baseline outcome measurements similar | Unclear risk | No baseline data reported that could be used to test for baseline differences in the outcome measurements between the intervention group and the control group |
| Baseline characteristics similar | Low risk | Differences (P < 0.05) reported between the intervention group and the control group for one characteristic. The proportion of participants in the intervention group who were poor was larger than that of participants in the control group (84% vs 87%; P = 0.02). |
| Blinding of participants and personnel (performance bias) All outcomes | High risk | At baseline survey collection, participants and study personnel were blinded. At follow‐up, blinding of participants was not possible, and blinding of personnel was unclear. |
| Blinding of outcome assessment (detection bias) All subjectively measured outcomes | Unclear risk | At baseline survey collection, outcome assessors were blinded. At follow‐up, blinding of outcome assessors was unclear. |
| Blinding of outcome assessment (detection bias) All objectively measured outcomes | Low risk | At baseline survey collection, outcome assessors were blinded. At follow‐up, blinding of outcome assessors was unclear. |
| Contamination | Unclear risk | Evidence to judge the risk of contamination is not reported. No measures were taken to minimise the possibility of contamination through study design or implementation. |
| Incomplete outcome data (attrition bias) All outcomes | High risk | The non‐response rate at baseline was not reported and therefore unclear. Loss to follow‐up from baseline was 7% and non‐differential between the intervention and the control group (6% vs. 7%; no test for differences reported). The authors reported that attrition was, however, differential by 55 of 197 unclear indicators (27.9 per cent). Propensity‐score matching methods were used to adjust for differential loss‐to‐follow up. Item non‐response was unclear. |
| Selective reporting (reporting bias) | Unclear risk | No study protocol identified |
| Other bias | Low risk | None identified |
Agüero 2007.
| Study characteristics | ||
| Methods | Cohort study, regression analysis with propensity‐score matching methods, 12 years: 1993 to 2004 | |
| Participants | 720 children (aged 0 to 36 months) interviewed over 3 waves of the KwaZulu‐Natal Income Dynamics Study (waves collected in 1993, 1998 and 2004), KwaZulu‐Natal province, South Africa | |
| Interventions | Exposure
Duration: up to 36 months. Follow‐up: up to 36 months into the intervention. Intervention design: aimed to reduce poverty among children in poor families; targeted to children living in poor households; provided a total amount of up to USD 900 (USD 25 per month for 36 months; 4.8% of the annual gross domestic product (GPD) per capita). |
|
| Outcomes | Primary outcomes
|
|
| Notes | Intervention context: programme of the Government of South Africa called the Child Support Grant; implemented by the Government of South Africa; unclear population coverage, intervention uptake, and intervention costs. Funder of the study: United Kingdom Department for International Development and United States Agency for International Development. Conflict of interest: none identified. | |
| Risk of bias | ||
| Bias | Authors' judgement | Support for judgement |
| Random sequence generation (selection bias) | High risk | Sampling strategy was random for the first wave, but a non‐random sub‐sample of the study sample was re‐interviewed at waves 2 and 3. Nationally‐representative sample not achieved. High risk of selection bias from likely self‐selection into the intervention by some eligible participants (e.g. those believing they may profit considerably from the intervention), but not other people (e.g. those not believing they may profit considerably from the intervention). |
| Allocation concealment (selection bias) | Unclear risk | Allocation concealment among participants and study personnel unclear |
| Baseline outcome measurements similar | Unclear risk | No overall P values, test statistics or SDs reported |
| Baseline characteristics similar | Unclear risk | No overall P values, test statistics or SDs reported. Unexposed group potentially differed systematically from exposed group in terms of motivation of adopting the intervention. |
| Blinding of participants and personnel (performance bias) All outcomes | Low risk | Participants not allocated to the intervention by the researchers. Secondary analysis of survey data collected for a different purpose than estimating the effect of the UCT on the use of health services and health outcomes. Therefore, blinding of participants neither feasible nor necessary. Blinding of study personnel unclear. |
| Blinding of outcome assessment (detection bias) All subjectively measured outcomes | Low risk | No subjectively‐measured outcome in this study |
| Blinding of outcome assessment (detection bias) All objectively measured outcomes | Low risk | Participants not allocated to the intervention by the researchers. Secondary analysis of survey data collected for a different purpose than estimating the effect of the UCT on use of health services and health outcomes. Therefore, blinding of outcome assessors neither feasible nor necessary. The outcome is unlikely to be influenced by the lack of blinding because it was objectively measured. |
| Contamination | High risk | Allocation was by household, but additional income from the UCT provided to participants in the exposed group may have been transferred to participants in the comparator group (e.g. between family members) |
| Incomplete outcome data (attrition bias) All outcomes | High risk | Survey non‐response unclear. Attrition was high (29%) and it was unclear whether it differed by population characteristics or outcomes, or both. |
| Selective reporting (reporting bias) | Unclear risk | We did not identify a study protocol. |
| Other bias | High risk | Misclassification bias of the exposure: used self‐reported receipt of a UCT collected in surveys, but we considered the risk of this bias to be low. Confounding: this study did not adjust for several potential time‐invariant and time‐varying confounding variables, such as caregiver's motivation, caregiver's cognitive abilities, and changes over time in health services access, fertility, and income. We judged this to carry a high risk of confounding. Reverse causation: the outcome may have impacted the exposure, but we considered the risk of this bias to be low. |
Aizawa 2020.
| Study characteristics | ||
| Methods | Cluster‐randomised controlled trial (2 stages: stage 1, 48 geographic areas were randomly selected and matched into pairs; stage 2, within each matched pair, one geographic area was randomly assigned to the intervention group and the other to the control group), difference‐in‐differences methods, 39 months in 2009 to 2012 | |
| Participants | 3107 households with an unclear number of participants interviewed 3 times (baseline: August 2009 to November 2010; follow‐up 1: November 2010 to November 2011; follow‐up 2: February to November 2012); 4 counties (Mandera, Marsabit, Turkana and Wajir), Kenya | |
| Interventions | 1 intervention group and 1 control group:
Duration: 24 months. Follow‐up: 24 months into the intervention. Intervention design: aimed to reduce poverty, food insecurity and malnutrition, and to promote asset retention and accumulation for beneficiary households; targeted to poor households; eligibility determined through geographic residency in areas with a large proportion of the population living in poverty; provided a total amount of USD 37.40 to USD 74.8 per household (USD 3.40 to USD 6.80 per transfer per capita for an average of 11 transfers in 24 months; 15.6% of the annual GDP per capita); paid in‐hand every second month; and number of transfers received varied considerably across households. |
|
| Outcomes | Alternative primary outcome measures not reported in this review (prioritised measure from same data used from Oxford Policy Management 2012)
|
|
| Notes | Intervention context: pilot programme of the Government of Kenya called the Hunger Safety Net Programme; implemented by the Government of Kenya through its Ministry of State for the Development of Northern Kenya and Other Arid Lands and service providers contracted to the ministry; unclear programme uptake; population coverage of 300,000 beneficiaries in 60,000 households; and unclear total programme cost of the UCT. Funder of study: no funding statement included in study record. Conflict of interest: none identified. Pairing with other studies: Aizawa 2020 and Oxford Policy Management 2012 reported effect estimates for different measurements for the same included outcomes. We always prioritised Oxford Policy Management 2012 because it always reported the preferred outcome measurements. | |
| Risk of bias | ||
| Bias | Authors' judgement | Support for judgement |
| Random sequence generation (selection bias) | Low risk | Randomisation was ensured |
| Allocation concealment (selection bias) | Low risk | Allocation determined by public lottery and therefore concealment protected |
| Participants recruited after cluster allocation (recruitment bias in cluster‐RCTs) | Low risk | Participants recruited after cluster allocation |
| Baseline outcome measurements similar | Low risk | No baseline differences (P < 0.05) between UCT intervention group and control group in outcome measurements |
| Baseline characteristics similar | Unclear risk | No baseline differences (P < 0.05) between UCT intervention group and control group in characteristics. However, the loss of 8 clusters at follow‐up 2 reduced the balance in an unclear number of characteristics and seasonality of the UCT intervention group and the control group, compared with the balance at baseline of the original sample structure. |
| Blinding of participants and personnel (performance bias) All outcomes | High risk | Blinding of participants not possible, and blinding of personnel unclear |
| Blinding of outcome assessment (detection bias) All subjectively measured outcomes | Unclear risk | Outcome assessors not blinded |
| Blinding of outcome assessment (detection bias) All objectively measured outcomes | Unclear risk | Outcome assessors not blinded. Outcome is unlikely to be influenced by lack of blinding because it is objectively measured. |
| Contamination | Unclear risk | No spill‐over control group was included, so the risk of contamination is unclear |
| Incomplete outcome data (attrition bias) All outcomes | High risk | Initial survey non‐response unclear. Loss to follow‐up was large, and the proportion of households lost to follow‐up in the UCT intervention group was larger than that in the control group (18% compared with 13%, no test of statistical significance provided). Loss to follow‐up also differed by one population characteristic, i.e. by district. Number of clusters and number and percentage of participants with missing values by group:
The number and percentage of missing values per outcome were unclear. Considering the large and likely differential loss to follow‐up, we judged the risk of bias from attrition to be high. |
| Selective reporting (reporting bias) | Unclear risk | No study protocol identified |
| Other bias | Low risk | None identified |
Akresh 2012.
| Study characteristics | ||
| Methods | Cluster‐randomised controlled trial (3 stages: first stage, 75 villages with a primary school were randomly assigned to 4 intervention groups and 1 control group in a public meeting; second stage, in the 60 intervention villages, the cash transfer intervention assigned to the village was randomly assigned to poor households in a public meeting; third stage, in the 15 control villages, poor households were randomly sampled), regression analytic methods, 24 months in 2008 to 2010 | |
| Participants | 2559 children (aged 0 to 59 months) interviewed 3 times (baseline: June 2008; follow‐up 1: June 2009; follow‐up 2: June 2010); Nahouri province, Burkina Faso | |
| Interventions | 4 intervention groups and 1 control group:
Intervention duration: 24 months. Follow‐up: 8 months after 24 months of the intervention. Intervention design: aimed to improve health outcomes among children aged 0 to 6 years and education outcomes among children aged 7 to 15 years; targeted to children aged 0 to 15 years who resided in poor households; provided a total amount of USD 19.20 per child aged 0 to 6 years (USD 0.80 per month for 24 months; approximately 1.3% of the annual GDP per capita), USD 38.64 per child aged 7 to 10 years or in grades 1 to 4 (USD 1.61 per month for 24 months; approximately 1.5% of the annual GDP per capita) and USD 77.04 per child aged 11 to 15 years or in grade 5 or higher (USD 3.21 per month for 24 months; approximately 2.8% of the annual GDP per capita); paid in‐hand to the mother or the father every 3 months; CCTs conditional on children aged 0 to 6 years receiving one growth check at a local health clinic every 3 months and on children aged 7 to 15 years being enrolled at school and attending school for 90% of the time every quarter year; and fuzzy design: minor messaging to health administrators in intervention groups (especially to those receiving CCTs) |
|
| Outcomes | Primary outcomes: use of any health service (measure: number of routine preventive health clinic visits, last week) | |
| Notes | Intervention context: pilot programme of the Government of Burkina Faso called the Burkina Faso Nahouri Cash Transfer Pilot Project; implemented by the Government of Burkina Faso; and unclear population coverage, intervention uptake, and intervention costs. Funder of study: World Bank and the National Bureau of Economic Research. Conflict of interest: none identified. | |
| Risk of bias | ||
| Bias | Authors' judgement | Support for judgement |
| Random sequence generation (selection bias) | Low risk | Randomisation ensured |
| Allocation concealment (selection bias) | Low risk | Allocation was by public lottery and therefore concealed |
| Participants recruited after cluster allocation (recruitment bias in cluster‐RCTs) | High risk | Participants recruited after cluster allocation |
| Baseline outcome measurements similar | Unclear risk | No baseline data reported that could be used to test for baseline differences in the outcome measurement between the UCT intervention group, the pure control group, and the CCT comparison group. Baseline differences (if any) in the outcome measurement appear to not have been adjusted for. |
| Baseline characteristics similar | Low risk | Baseline differences (P < 0.05) reported between the 'UCT given to women' intervention group and the pure control group in one characteristic. The households were larger in the UCT intervention group than in the control group (6.90 compared with 6.05, P < 0.05). However, all baseline differences were comprehensively adjusted for using regression analytic methods. In addition, messaging to health administrators in villages in the UCT intervention group and especially the CCT comparison group may have occurred, but such messaging may not equally have occurred in villages in the control group, and this may have influenced the outcome. However, we judged the risk that this may have introduced confounding to be low. |
| Blinding of participants and personnel (performance bias) All outcomes | High risk | Blinding of participants not feasible, and blinding of personnel unclear |
| Blinding of outcome assessment (detection bias) All subjectively measured outcomes | High risk | Outcome assessors not blinded |
| Blinding of outcome assessment (detection bias) All objectively measured outcomes | Low risk | No objectively‐measured outcome in this study |
| Contamination | High risk | Assignment was by village, but additional income from UCTs provided to participants in the UCT intervention groups or the CCT comparison groups may have spilled over to participants in other UCT intervention groups, the control group, and/or the CCT comparison groups (e.g. between family members). Spill‐over effects were not investigated (e.g. no spill‐over control group in this study). |
| Incomplete outcome data (attrition bias) All outcomes | Low risk | Initial survey non‐response unclear. Attrition low (4%). No tests reported for differences in outcome measurements between participants lost to follow‐up and those not lost to follow‐up in the intervention groups, compared with those differences in the pure control group and the CCT comparison groups. Differences in 6 population characteristics reported between participants lost to follow‐up and those not lost to follow‐up in the intervention groups, compared with the control group. Attriting households had fewer adults (P < 0.01), were smaller (P < 0.01), had younger household heads (P < 0.05), were more likely to be Christian (P < 0.01), and were less likely to be Animist (P < 0.01). The numbers of missing participants per UCT intervention group, control group and CCT comparison group and for the outcome were unclear. |
| Selective reporting (reporting bias) | Unclear risk | We did not identify a study protocol |
| Other bias | Low risk | None identified |
Amarante 2011.
| Study characteristics | ||
| Methods | Controlled before‐and‐after study, difference‐in‐differences methods, 59 months in 2003 to 2007 | |
| Participants | 1,037,739 adults (women) reported in 5 years of administrative data linked to vital statistics (before: January 2003 to March 2005; after: April 2005 to December 2007), Uruguay | |
| Interventions | 1 exposed group and 1 unexposed group:
Duration: 1 to 32 months. Follow‐up: 1 to 32 months into the intervention. Intervention design: aimed to reduce poverty; targeted to households with an income score predicted by government personnel to fall below a pre‐determined level; provided a total amount of up to USD 1792 (USD 56 per month for 32 months; approximately 7.0% of the annual GDP per capita); co‐intervention: from mid‐2006 an electronic food card with a monthly value of USD 13.30 (1.3% of the annual GDP per capita) or one‐fourth to one‐half of the value of the UCT, depending on household size and demographic structure; and fuzzy design: conditional on pregnant women's and children's regular health checks and on children's school attendance (but the conditions were not enforced) |
|
| Outcomes | Primary outcomes
Secondary outcomes
Alternative primary outcome measures not reported in this review
|
|
| Notes | Intervention context: Plan de Atención Nacional a la Emergencia Social, implemented by the Government of Uruguay; covered 14% of the population; unclear population uptake; and the total annual cost of the UCT programme was approximately USD 250 million. Funder of the study: the Inter‐American Development Bank. Conflict of interest: none identified | |
| Risk of bias | ||
| Bias | Authors' judgement | Support for judgement |
| Random sequence generation (selection bias) | High risk | Sampling was not random. Rather, administrative records and vital statistics were used, the former of which were collected specifically to determine eligibility for the UCT. Multiple baseline differences between the exposed group and the unexposed group. |
| Allocation concealment (selection bias) | Unclear risk | Allocation concealment among participants and study personnel unclear |
| Baseline outcome measurements similar | Unclear risk | No confidence interval, P value or test statistic reported |
| Baseline characteristics similar | Unclear risk | No confidence interval, P value or test statistic reported |
| Blinding of participants and personnel (performance bias) All outcomes | Low risk | Participants not allocated to the intervention by the researchers. Secondary analysis of survey data collected for a different purpose than estimating the effect of the UCT on health services use and health outcomes. Therefore, blinding of outcome assessors was neither feasible nor necessary. |
| Blinding of outcome assessment (detection bias) All subjectively measured outcomes | Low risk | Participants not allocated to the intervention by the researchers. Secondary analysis of survey data collected for a different purpose than estimating the effect of the UCT on health services use and health outcomes. Therefore, blinding of outcome assessors was neither feasible nor necessary. |
| Blinding of outcome assessment (detection bias) All objectively measured outcomes | Low risk | Participants not allocated to the intervention by the researchers. Secondary analysis of survey data collected for a different purpose than estimating the effect of the UCT on health services use and health outcomes. Therefore, blinding of outcome assessors was neither feasible nor necessary. |
| Contamination | Unclear risk | Allocation was by household, but additional income from UCTs provided to participants in the exposed group may have spilled over to participants in the comparator group (e.g. between family members) |
| Incomplete outcome data (attrition bias) All outcomes | Unclear risk | The initial sample size and survey non‐response were unclear. For the birth weight and social determinants of health outcomes, the complete sample was 71,811 participants. For mother's weight, the sample size was 21,944 participants. Attrition was unclear, since the initial sample size was not reported. Numbers of missing participants per outcome were unclear. Number of observations (68,858) were reported only for low birth weight. Matching between data source could only be performed with a non‐quantifiable error |
| Selective reporting (reporting bias) | Unclear risk | We did not identify a study protocol. |
| Other bias | High risk | Misclassification bias of the exposure: the study used self‐reported receipt of a UCT collected in surveys, but we considered the risk of this bias to be low. Confounding: this study did not adjust comprehensively for all potential confounders, and it used difference‐in‐differences methods, which carry a risk of bias if the underlying time trends differ between the exposed group and the unexposed group. We therefore judged the risk of confounding to be high. Reverse causation: the outcome may have impacted the exposure, but we considered the risk of this bias to be low. |
American Institutes for Research 2013.
| Study characteristics | ||
| Methods | Controlled before‐and‐after study, difference‐in‐differences methods, 51 months in 2013 to 2017 | |
| Participants | 3063 households with 14,575 participants (children and adults) at baseline (2567 households at follow‐up 2) interviewed 3 times (baseline: May 2013; follow‐up 1: July 2014; follow‐up 2: July to August 2017); 90 wards, 6 districts (Binga, Chiredzi, Hwange, Mudzi, Mwenezi, UMP), Zimbabwe | |
| Interventions | 1 exposed group and 1 unexposed group:
Duration: 47 months. Follow‐up: 12 months into the intervention for the outcomes 'is moderately stunted' and 'is moderately underweight', and 47 months into the intervention for the other outcomes. Intervention design: aimed to improve health and human capital development; targeted to households with labour constraints and food poverty; paid in‐hand every 2 months at a dedicated payment point (in 2016 nearly half of all payments were missed, but top‐up payments were provided to ensure the receivable total amounts were also paid); provided a total amount of USD 470.00 to 1175.00 per household (USD 10.00 to 25.00 per month for 47 months; approximately 32.8% to 81.9% of the annual GDP per capita):
paid in‐hand every second month. |
|
| Outcomes | Primary outcomes
Secondary outcomes
Alternative primary outcome measures not reported in this review
|
|
| Notes | Intervention context: Zimbabwe’s Harmonized Social Cash Transfer Programme, implemented by the Government of Zimbabwe; self‐reported population uptake was 92%, population coverage was 0.4% in 2014; and total programme costs unclear. Funder of the study: Ministry of Public Service, Labour and Social Welfare, Zimbabwe; Department for International Development, United Kingdom; European Union; Swiss Development Cooperation, Switzerland; Kingdom of the Netherlands, Netherlands; Embassy of Sweden/Sida, Sweden; Food and Agriculture Organization; CASS; International Initiative for Impact Evaluation (3IE) and the United Nations Children Fund (UNICEF). Conflict of interest: none identified. | |
| Risk of bias | ||
| Bias | Authors' judgement | Support for judgement |
| Random sequence generation (selection bias) | High risk | The study used a non‐experimental study design, which did not randomise participants into the intervention group and control group. |
| Allocation concealment (selection bias) | High risk | Allocation was by geographic, administrative unit (district). Allocation concealment among participants was therefore not feasible, and allocation concealment of study personnel unclear. |
| Baseline outcome measurements similar | Unclear risk | The expenditure shares for health or hygiene was higher among the intervention group than among the control group (0.05 vs. 0.04, P = 0.00). No differences reported in the Food Security Scale scores between intervention and control group. No data reported for the other primary outcomes covered in this review for this study. |
| Baseline characteristics similar | Low risk | The proportion of participants who had attended primary school for over 80% was higher among the intervention group than the control group (0.79 vs. 0.68, P = 0.04). The proportion of adolescents in the treatment group whose first sex was consensual was lower among the intervention group than the control group (0.69 vs. 0.93; P = 0.00). The proportion of adolescents in the treatment group who had ever been forced to have sex was higher among the intervention group than the control group (0.03 vs. 0.01; P = 0.01). The proportion of participants whose grain stores had lasted over 3 months was higher among the treatment group than the control group (0.41 vs. 0.48; P = 0.02). The proportion of participants who were female was higher among the intervention group than the control group (0.56 vs. 0.54; P = 0.04). The proportion of households who had been affected by flood was higher among the intervention group than the control group (0.04 vs. 0.02; P = 0.04). |
| Blinding of participants and personnel (performance bias) All outcomes | High risk | Blinding of participants not possible, and blinding of personnel unclear |
| Blinding of outcome assessment (detection bias) All subjectively measured outcomes | Unclear risk | Blinding of outcome assessors was unclear |
| Blinding of outcome assessment (detection bias) All objectively measured outcomes | Unclear risk | Blinding of outcome assessors was unclear |
| Contamination | Low risk | Contamination was assessed, and little contamination was found, with less than 1 per cent of the unexposed participants reporting having ever received the UCT transfer or currently receiving it. |
| Incomplete outcome data (attrition bias) All outcomes | Unclear risk | Loss to follow‐up was 16.2% of households from baseline to follow‐up 2, with households in the intervention group less likely to be lost than households in the control group (15% vs. 19%). |
| Selective reporting (reporting bias) | Unclear risk | We did not identify a study protocol |
| Other bias | High risk | Misclassification bias of the exposure: assigned the exposure (receipt of a UCT) to all households in a community that received the UCT, which we considered to have a high risk of bias from misclassification. Confounding: this study did not adjust for several potential time‐invariant and time‐varying confounding variables, such as caregiver's motivation, caregiver's cognitive abilities, and changes over time in health services access, fertility, and income. We judged this to carry a high risk of confounding. Reverse causation: the outcome may have impacted the exposure, but we considered the risk of this bias to be low. |
Baird 2010.
| Study characteristics | ||
| Methods | Cluster‐randomised controlled trial (3 stages: first stage, enumeration areas were divided into 3 strata of geographic residency (i.e. within city, within 16 km radius of city, and far rural); second stage, enumeration areas were sampled for each strata (i.e. 29, 119, and 28, respectively); third stage, never‐married females aged 13 to 22 years were randomly sampled from a list of all females within each strata), intention‐to‐treat analysis, difference‐in‐differences and regression analytic methods, 32 months in 2007 to 2010 | |
| Participants | 3896 children or young adults (aged 13 to 22 years) who were never married (split into 2907 in school and 889 out of school/dropouts), interviewed 3 times (baseline: October 2007 to January 2008, follow‐up 1: October 2008 to February 2009, follow‐up 2: February to June 2010), all girls or young women, 176 enumeration areas, Zomba district, Malawi | |
| Interventions | Girls and young women in school at baseline 2 intervention groups and 3 control groups
Girls and young women out of school/dropouts at baseline 1 intervention group and 1 control group
Intervention duration: 24 months. Follow‐up: 12 months into the intervention (alternative follow‐up not reported in this review: 2 to 6 months after 24 months of the intervention). Intervention design: aimed to determine the effectiveness of UCT and CCT (in the baseline school girls group); UCT targeted to never married girls or young women aged 13 to 22 years from poor households; UCT provided a total amount of USD 96, USD 144, USD 192 or USD 240 to parents randomly by enumeration area so that all parents in the same enumeration area received the same amount (USD 4, USD 6, USD 8 or USD 10 per month for 24 months; approximately 8.4%, 12.5%, 16.7% or 20.9% of the annual GDP per capita) and USD 24, USD 48, USD 72, USD 96 or USD 120 to girls or young women randomly by individual through an open public lottery, so that different girls and young women within the same enumeration area received different amounts (USD 1, USD 2, USD 3, USD 4 or USD 5 per month for 24 months; approximately 2.1%, 4.2%, 6.3%, 8.4% or 10.5% of the annual GDP per capita), and an amount equivalent to the average annual amount given to the CCT intervention group towards school fees; paid in‐hand each month; CCT provided the same total amounts as the UCT to parents and girls using the same randomisation procedures; co‐intervention for CCT: school fees were paid directly to the school for girls and young women enrolled in school; the CCT was conditional on regular school attendance (i.e. 80% or more of all school days attended); adherence with the condition was monitored, and non‐adherence was punished (i.e. the CCT for the following month was withheld). |
|
| Outcomes | Primary outcome
Secondary outcomes
Alternative primary outcome measures not reported in this review
|
|
| Notes | Intervention context: experiment by research organisations (the National Bureau of Economic Research), but also appears to be a programme of the Government of Malawi called the Zomba Cash Transfer; unclear who implemented the experiment; unclear population coverage, intervention uptake, and total programme costs. Funder of the study: Bill and Melinda Gates Foundation, Global Development Network, International Initiative for Impact Evaluation, National Bureau of Economic Research, and the World Bank. Conflict of interest: some study records were co‐authored by staff of organisations that funded the study. Pairing of studies: Baird 2010 was replicated by Smith 2017 in a pure replication study (see Measures of treatment effect). We prioritised the included original study (Baird 2010), but considered the findings of the pure replication study to inform our risk of bias assessment. | |
| Risk of bias | ||
| Bias | Authors' judgement | Support for judgement |
| Random sequence generation (selection bias) | Low risk | Randomisation was ensured |
| Allocation concealment (selection bias) | Low risk | Allocation was by public lottery and therefore protected |
| Participants recruited after cluster allocation (recruitment bias in cluster‐RCTs) | Low risk | Participants were recruited before clusters were allocated |
| Baseline outcome measurements similar | Low risk | No baseline differences (P < 0.05) reported between the UCT intervention group and the control groups (all 3 control groups among school girls pooled) in one outcome measurement (has had any illness). No baseline data reported that could be used to test for baseline differences between the UCT intervention group and the control groups in one outcome measurement (number of days had eaten protein‐rich food). No baseline differences reported between the UCT intervention group and the CCT comparison group in any of the outcome measurements. However, all baseline differences in outcomes measurements appear to have been comprehensively adjusted for using regression analytic methods. |
| Baseline characteristics similar | Low risk | Baseline differences (P < 0.05) reported between the UCT intervention group and the control groups (all 3 control groups pooled) in 5 characteristics. The highest grade attended by respondents in the UCT intervention group was higher than that in the control groups (7.90 compared with 7.48, P < 0.05). The proportion of participants in female‐headed household in the UCT intervention group was lower than that in the control group (24% compared with 32%, no test reported). The proportion of participants in households that owned a radio in the UCT intervention group was higher than in the control groups (65% compared with 59%, no test reported). The proportion of participants in households that owned a television in the UCT intervention group was higher than in the control groups (34% compared with 24%, no test reported). The proportion of participants who had piped water available in their dwelling in the UCT intervention group was higher than that in the control groups (60% compared with 47%, no test reported). Baseline differences (P < 0.05) also reported between the UCT intervention group and the CCT comparison group in 2 characteristics. The age in the UCT intervention group was higher than in the CCT comparison group (15.43 compared with 14.95, P < 0.01). The highest grade attended by respondents in the UCT intervention group was higher than that in the CCT comparison group (7.90 compared with 7.25, P < 0.01). However, all baseline differences in characteristics appear to have been comprehensively adjusted for using regression analytic methods. |
| Blinding of participants and personnel (performance bias) All outcomes | High risk | Blinding of participants was not possible, and blinding of personnel was unclear. Qualitative interviews conducted as part of the study suggested that the UCT intervention group was aware of the existence of a CCT comparison group and that the purpose of the cash transfer programme was to improve education. We therefore considered the risk of performance bias to be high. |
| Blinding of outcome assessment (detection bias) All subjectively measured outcomes | Unclear risk | Blinding for subjectively measured outcomes was unclear |
| Blinding of outcome assessment (detection bias) All objectively measured outcomes | Low risk | There were no objectively measured outcomes in this study. |
| Contamination | Low risk | Allocation was by community and the study assessed, but we did not find any evidence of contamination |
| Incomplete outcome data (attrition bias) All outcomes | Low risk | Initial survey non‐response was low (6%). Attrition rate was moderate (10%) and did not differ between the intervention group and the control groups. One area was lost amongst the baseline school girls for an unclear reason. For each group, the number of missing clusters and number and percentage of missing participants were: Girls and young women in school at baseline: 2 intervention groups and 3 control groups
Girls and young women out of school/dropouts at baseline: 1 intervention group and 1 control group
The number of missing participants per outcome was unclear. |
| Selective reporting (reporting bias) | Unclear risk | We did not identify a study protocol |
| Other bias | Low risk | None identified |
Bazzi 2012.
| Study characteristics | ||
| Methods | Controlled before‐and‐after study, difference‐in‐differences methods, 24 months in 2005 to 2007 | |
| Participants | 10,574 households at baseline (7016 households at follow‐up 2) interviewed 3 times in the National Socioeconomic Survey (SUSENAS) (baseline: February 2005; follow‐up 1: February 2006; follow‐up 2: February 2007); 31 provinces, Indonesia | |
| Interventions | 1 exposure and 1 control group:
Intervention duration: 12 months. Follow‐up: 12 months into the intervention (alternative follow‐up not reported in this review: 3 to 6 months into the intervention). Intervention design: aimed to prevent poor households from having to reduce expenditures on essential commodities, health, and education during strong national inflation; targeted to poor, disadvantaged households (but targeting was poorly implemented, with many non‐poor households receiving the UCT and many poor households not receiving it); provided a total amount of USD 120 (USD 30 every 3 months for 12 months; approximately 2.0% of the annual GDP per capita); paid mainly in‐hand at a post office; and fuzzy design: minor messaging that UCT receipt may be conditional on reported level of household welfare. |
|
| Outcomes | Primary outcomes
Secondary outcomes
Alternative primary outcome measures not reported in this review
|
|
| Notes | Intervention context: the Direct Cash Transfer Program, implemented by the Government of Indonesia predominantly through village officials; programme uptake 100%; population coverage over 19 million households; and programme costs between October 2005 and September 2006 approximately USD 380 million. Funder of the study: International Initiative for Impact Evaluation. Conflict of interest: none identified | |
| Risk of bias | ||
| Bias | Authors' judgement | Support for judgement |
| Random sequence generation (selection bias) | High risk | It was unclear whether the sampling strategy was random. A nationally‐representative sample was achieved. |
| Allocation concealment (selection bias) | Unclear risk | Allocation concealment among participants and study personnel was unclear |
| Baseline outcome measurements similar | Unclear risk | No overall P values, test statistics or SDs reported |
| Baseline characteristics similar | Unclear risk | No overall P values or test statistics reported, only SDs for each mean. However, there were no apparent statistically significant imbalances. |
| Blinding of participants and personnel (performance bias) All outcomes | Low risk | The participants were not allocated to the intervention by the researchers. A secondary analysis was conducted of survey data collected for a different purpose than estimating the effect of the UCT on health services use and health outcomes. Therefore, blinding of participants was neither feasible nor necessary. It was unclear whether study personnel were blinded. |
| Blinding of outcome assessment (detection bias) All subjectively measured outcomes | Low risk | The participants were not allocated to the intervention by the researchers. A secondary analysis was conducted of survey data collected for a different purpose than estimating the effect of the UCT on health services use and health outcomes. Therefore, blinding of outcome assessors was neither feasible nor necessary. |
| Blinding of outcome assessment (detection bias) All objectively measured outcomes | Low risk | There were no objectively‐measured outcomes in this study. |
| Contamination | High risk | Allocation was by household, but additional income from UCTs provided to participants in the intervention group may have spilled over to participants in the control group (e.g. between family members). The risk of spill‐over effects was not investigated (e.g. no spill‐over control groups in this study). |
| Incomplete outcome data (attrition bias) All outcomes | High risk | Initial survey non‐response rate was unclear. Attrition rate was very high (34%), and it was unclear whether the attrition rate differed between the intervention group and the control group. The number of missing participants per outcome was also unclear. We considered the missing data to potentially have impacted effect estimates because a very large percentage of participants had missing data (34% or more). |
| Selective reporting (reporting bias) | Unclear risk | We did not identify a study protocol. |
| Other bias | Low risk | None identified |
Beck 2015.
| Study characteristics | ||
| Methods | Cluster‐randomised controlled trial (2 stages: first stage, 20 villages were randomly selected; second stage, 2034 households were randomly selected), regression analytic methods with propensity‐score matching and multiple imputation, 12 months in 2011 to 2012 | |
| Participants | 2034 household interviewed 3 times (baseline: before the start of intervention, date unclear; follow‐up 1: approximately 8 months into the intervention, February 2012; follow‐up 2: after the end of the intervention, date unclear), Madhya Pradesh, India | |
| Interventions | 1 intervention group and 1 control group:
Intervention duration: 12 months. Follow‐up: 8 months into the intervention (alternative follow‐up not reported in this review: unclear number of months after 12 months of intervention). Intervention design: aimed to reduce poverty and increase social protection; non‐targeted (i.e. a basic universal income intervention (Painter 2016)); provided a total amount of approximately USD 160 to adults (USD 13.20 per month for 12 months; approximately 3.2% of the annual GDP per capita) and USD 80 to each child aged 0 to 18 years (USD 6.60 per month for 12 months; approximately 1.6% of the annual GDP per capita); total amount equivalent to approximately 25% to 30% of an average poor family's income; and paid in‐hand in the first 3 months and into a bank account in the remaining months to the mother. |
|
| Outcomes | Primary outcomes
Alternative primary outcome measures not reported in this review
|
|
| Notes | Intervention context: pilot programme conducted by non‐governmental organisation (Self Employed Women's Association); implemented by non‐governmental organisation (Self Employed Women's Association); and unclear population coverage, intervention uptake and intervention costs. Funder of the study: United Nations Children's Fund. Potential conflict of interest: none identified | |
| Risk of bias | ||
| Bias | Authors' judgement | Support for judgement |
| Random sequence generation (selection bias) | Low risk | Cluster‐randomisation was undertaken at the level of the villages. Propensity‐score matching was undertaken of the cases. |
| Allocation concealment (selection bias) | Unclear risk | Allocation concealment was unclear for participants and study personnel. |
| Participants recruited after cluster allocation (recruitment bias in cluster‐RCTs) | Unclear risk | It was unclear whether participants were recruited after clusters had been allocated. |
| Baseline outcome measurements similar | Low risk | No baseline differences (P < 0.05) reported between the intervention group and the control group in outcome measurements |
| Baseline characteristics similar | High risk | Differences (P < 0.05) reported between the intervention group and the control group for 7 of 23 demographic characteristics. Caste, religion, household monetary income, and income sharing differed at P < 0.01, and income sufficient for food needs, income sufficient for food needs (baseline survey), and income sufficient for other needs differed at P < 0.05. It is unclear if these were differences at baseline, except for the one variable that has been clearly labelled as being at the baseline survey. |
| Blinding of participants and personnel (performance bias) All outcomes | High risk | Blinding of participants was not possible, and blinding of personnel was unclear |
| Blinding of outcome assessment (detection bias) All subjectively measured outcomes | Unclear risk | Blinding of outcome assessors was unclear |
| Blinding of outcome assessment (detection bias) All objectively measured outcomes | Unclear risk | Blinding of outcome assessors was unclear |
| Contamination | Unclear risk | Allocation was conducted by village, but additional income from UCTs provided to participants in the intervention group may have spilled over to participants in the control group (e.g. between family members). Spill‐over effects were not formally investigated (e.g. through a spill‐over control group). |
| Incomplete outcome data (attrition bias) All outcomes | High risk | Problems with baseline surveying due to a lack of formal training and supervision of the enumerators led to loss of 25% of all responses and an unclear number and percentage of missing values for some unspecified variables. The number of missing clusters and households and the number of missing values per outcome are unclear. We considered the missing data to potentially have impacted effect estimates because a very large percentage of participants missed data at baseline (25%). |
| Selective reporting (reporting bias) | Unclear risk | We did not identify a study protocol |
| Other bias | Low risk | None identified |
Cunha 2014.
| Study characteristics | ||
| Methods | Cluster‐randomised controlled trial (2 stages: first stage, 208 rural communities or villages were randomly sampled amongst those considered eligible for the government's Programa de Apoyo Alimentario UCT programme; second stage, approximately 33 households were randomly sampled from each community or village), difference‐in‐differences methods, 26 months in 2003 to 2005 | |
| Participants | 5028 households at baseline (4923 households at follow‐up) and 4550 children (0 to 6 years) at baseline (4129 children at follow‐up), interviewed twice (baseline: October 2003 to April 2004; follow‐up: October 2005 to December 2005), 208 villages that were small (< 2500 inhabitants), highly marginalised (as classified by the Census Bureau), non‐welfare (not currently receiving the subsidised milk programme Liconsa or the conditional cash transfer Oportunidades), Mexico | |
| Interventions | 3 intervention groups and 1 control group
Intervention duration: 24 months. Follow‐up: 24 months into the intervention. Intervention design: aimed to improve food security, nutritional intake, and health; targeted to persons in poor households in rural, poor villages; provided a total amount of approximately USD 360 (approximately USD 15 per month for 24 months; approximately 2.8% of the annual GDP per capita); paid in‐hand to women (if possible); minor co‐intervention for UCT was education classes that provided information on nutrition, hygiene, and health (but implemented with participants in the intervention groups not attending and participants in the control group attending); the 2 in‐kind transfer intervention groups were combined in analyses because education classes were offered in both of these intervention groups, making them indistinguishable. |
|
| Outcomes | Primary outcomes
Secondary outcomes
Alternative primary outcome measures not reported in this review
|
|
| Notes | Intervention context: experiment by the Government of Mexico along the government programme called the Programa de Apoyo Alimentario; implemented by a public‐private company (Diconsa) that maintains subsidised general stores in each of the included communities or villages; programme uptake was > 97%; unclear population coverage; and estimated total programme costs were approximately 102% of the total amount of cash transferred. Funder of study: Stanford University. Conflict of interest: none identified | |
| Risk of bias | ||
| Bias | Authors' judgement | Support for judgement |
| Random sequence generation (selection bias) | Low risk | Randomisation ensured |
| Allocation concealment (selection bias) | Unclear risk | Allocation concealment among participants and study personnel unclear |
| Participants recruited after cluster allocation (recruitment bias in cluster‐RCTs) | High risk | Participants recruited after cluster allocation |
| Baseline outcome measurements similar | Low risk | No baseline differences reported for any of the included outcomes |
| Baseline characteristics similar | Low risk | Baseline differences (P < 0.05) reported between the unconditional cash transfer (UCT) intervention group and the control group in 2 characteristics. The years of education of household heads in the UCT group was lower than that in the control group (3.96 compared with 4.50, P < 0.05). The proportion of households who raised animals or farmed in the UCT group was higher than in the control group (0.30 compared with 0.43, P < 0.05). However, all baseline differences in characteristics comprehensively adjusted for using regression analytic methods. |
| Blinding of participants and personnel (performance bias) All outcomes | High risk | Blinding of participants not possible, and blinding of personnel unclear |
| Blinding of outcome assessment (detection bias) All subjectively measured outcomes | High risk | Outcome assessors not blinded |
| Blinding of outcome assessment (detection bias) All objectively measured outcomes | Low risk | Outcome assessors not blinded. Outcome is unlikely to be influenced by lack of blinding because it is objectively measured. |
| Contamination | High risk | Allocation was by community, but additional income from UCTs provided to participants in the intervention groups may have been transferred to participants in other intervention and/or control groups (e.g. between family members) |
| Incomplete outcome data (attrition bias) All outcomes | High risk | Survey non‐response unclear. 8 clusters with 306 baseline households and 216 follow‐up households) were excluded from the study because they: could not be re‐surveyed due to concerns for enumerator safety (2 clusters); received the intervention prior to the baseline survey (2 clusters); were ineligible due to receiving Oportunidades (2 clusters); and were geographically contiguous (2 clusters). For the sample of children, a total of 189 baseline households and 78 follow‐up households were excluded because they missed more than half of the outcomes measurements (35 baseline households and 78 follow‐up households), reported no individual level information (11 baseline households), or reported a non‐normal food consumption pattern (143 baseline households). For the sample of children, a total of 200 children were excluded because they reported age inconsistently across survey waves. Attrition was high (12% to 17%) and differed between the UCT intervention group and the control group (17% compared with 12%). The study reports no differences in outcome measurements and characteristics between participants lost to follow‐up and those not lost to follow‐up between the UCT intervention group and the control group. The numbers of missing households and participants per intervention and control group were unclear. For the sample of households, the number and percentage of households missing per outcome were unclear. For each outcome, the number of missing participants for the sample of households was unclear. For each outcome, the number of missing participants for the sample of children was:
We considered the missing data to potentially have impacted effect estimates because a non‐random sample of clusters was excluded from the study and a large percentage of participants were lost to follow‐up (12% to 17%). |
| Selective reporting (reporting bias) | Unclear risk | No study protocol identified |
| Other bias | Low risk | None identified |
d'Errico 2020.
| Study characteristics | ||
| Methods | Cluster‐randomised controlled trial (4 stages: stage 1, 96 electoral divisions were matched into 48 pairs; stage 2, 40 pairs were randomly selected from the 48 pairs; stage 3, secondary sampling units of clusters of villages in the pairs were constructed; stage 4, households were randomly selected from the secondary sampling units and randomly assigned to the intervention group and the control group), difference‐in‐differences methods, 26 months in 2011 to 2013. | |
| Participants | 1353 households interviewed twice (baseline: June to August 2011; follow‐up: June to August 2013), 5 districts (Berea, Leribe, Mafeteng, Maseru, and Qacha's), Lesotho | |
| Interventions | 1 intervention group and 1 control group
Duration: 24 months. Follow‐up: 24 months into the intervention. Intervention design: aimed to improve the living standards of orphans and other vulnerable children in order to reduce malnutrition, improve health status, and increase school enrolment among these children; targeted to poor and vulnerable households with one or more children; eligibility determined through a combination of means‐testing based on poverty, community validation, and registration in the National Information System for Social Assistance; provided a total amount of USD 98 per household before April 2013 (approximately USD 4 per month for 24 months; 1.5% of the annual GDP per capita) and between USD 216 to households with ≤ 2 children (USD 9 per month for 24 months; 3.9% of the annual GDP per capita) and USD 450 to households with ≥ 5 children (USD 18.75 per month for 24 months; 8.1% of the annual GDP per capita) after April 2013; paid in‐hand every 4 months; minor co‐intervention: the Food Emergency Grant, a UCT for assistance in a humanitarian disaster (i.e. food insecurity from poor harvest) of USD 40 per month (17.4% of the annual GDP per capita), was provided alongside the UCT to recipients over 2012 to 2013; and fuzzy design: UCT was accompanied by instructions from social development officers at the pay point to spend the money on children. |
|
| Outcomes | Alternative primary outcome measures not reported in this review (prioritised measure from same data used from Pellerano 2014)
|
|
| Notes | Intervention context: programme of the Government of Lesotho called the Lesotho Child Grants Programme, implemented through Ministry of Social Development; unclear programme uptake; population coverage was 20,000 households with 50,000 children by the end of 2013; and unclear total programme cost of the UCT. Funder of study: study record does not comprise a funding statement. Conflict of interest: none reported and none identified. Pairing of studies: d'Errico 2020 and Pellerano 2014 reported different measurements for the same included outcomes, and we always prioritised Pellerano 2014 as this study reported the preferred outcome measurements. | |
| Risk of bias | ||
| Bias | Authors' judgement | Support for judgement |
| Random sequence generation (selection bias) | Low risk | Randomisation was ensured. Minor differences in study characteristics at baseline between treatment and control clusters. |
| Allocation concealment (selection bias) | Low risk | Allocation determined by public lottery and therefore concealment protected |
| Participants recruited after cluster allocation (recruitment bias in cluster‐RCTs) | High risk | Participants recruited after cluster allocation |
| Baseline outcome measurements similar | Low risk | No baseline differences (P < 0.05) between the UCT intervention group and the control group in outcome measurements |
| Baseline characteristics similar | High risk | Baseline differences (P < 0.05) between the UCT intervention group and the control group in 5 characteristics: i.e. number of children aged 0 to 5 years (P < 0.01); females aged 18 to 59 years (P < 0.05); price of rubber boots (P < 0.05); average daily wage for females (P < 0.05); and proportion of households that borrowed or received support from other family members, friends or neighbours in (P < 0.05). |
| Blinding of participants and personnel (performance bias) All outcomes | High risk | Blinding of participants not possible, and blinding of personnel unclear |
| Blinding of outcome assessment (detection bias) All subjectively measured outcomes | Unclear risk | Blinding of outcome assessors unclear |
| Blinding of outcome assessment (detection bias) All objectively measured outcomes | Low risk | Blinding of outcome assessors unclear. Outcome is unlikely to be influenced by lack of blinding because it is objectively measured. |
| Contamination | Unclear risk | No spill‐over control group was included, so that the risk of contamination is unclear. An unclear number of households included in the follow‐up in the UCT intervention group might not have received the UCT. |
| Incomplete outcome data (attrition bias) All outcomes | High risk | Initial survey non‐response unclear. Attrition was low (6%), but differed between the group eligible for the intervention and the group ineligible for it (9% versus 1%), as well as between the treatment and control groups among eligible participants (8% versus 12%). |
| Selective reporting (reporting bias) | Unclear risk | No study protocol identified |
| Other bias | Low risk | Minor co‐intervention (UCT for assistance in humanitarian disaster) may have affected the treatment effect estimates, but we judged this risk to be low. |
Fernald 2011.
| Study characteristics | ||
| Methods | Clustered‐randomised controlled trial (1 stage: 378 parishes randomly assigned to intervention group and control group), regression analytic methods, 27 months in 2003 to 2006 | |
| Participants | 786 children (aged 12 to 35 months) at baseline (1285 children at follow‐up) and 786 adults (the included children's mothers) at baseline (1285 adults at follow‐up) interviewed twice (baseline: October 2003 to March 2004; follow‐up: September 2005 to January 2006), 6 provinces, Ecuador | |
| Interventions | 1 intervention group and 1 control group
Intervention duration: 18 to 27 months. Follow‐up: 18 to 27 months into the intervention. Intervention design: aimed to reduce poverty and promote human capital investments among poor families through the provision of direct monetary transfers and incentives for households to invest in human capital (World Bank 2006); targeted to mothers who lived in poverty and had children aged 0 to 16 years; provided a total amount of USD 270 to USD 405 (USD 15 per months for 18 to 27 months; equivalent to 2.7% to 4.1% of the annual GDP per capita); paid in‐hand to mothers; and fuzzy design: conditional on preventive healthcare checks and school attendance among children (but compliance not monitored). |
|
| Outcomes | Primary outcomes
Secondary outcomes
|
|
| Notes | Intervention context: Bono de Desarrollo Humano, implemented by the Government of Ecuador; programme uptake 73% in the intervention group and 3% in the control group; and unclear population coverage and total programme cost. Funder of study: none stated. Conflict of interest: none identified. Pairing of studies: Fernald 2011 and Paxson 2007 analysed the same cluster‐RCT, and when both studies reported the same measurements for some included outcomes, we prioritised Paxson 2007 because it reported treatment effect estimates for the entire study sample, whereas Fernald 2011 reported results for only a selection of study participants. | |
| Risk of bias | ||
| Bias | Authors' judgement | Support for judgement |
| Random sequence generation (selection bias) | Low risk | Randomisation ensured |
| Allocation concealment (selection bias) | Unclear risk | Allocation concealment among participants and study personnel unclear |
| Participants recruited after cluster allocation (recruitment bias in cluster‐RCTs) | High risk | Participants recruited after cluster allocation |
| Baseline outcome measurements similar | Low risk | No baseline differences (P < 0.05) reported between the unconditional cash transfer (UCT) intervention group and the control group in all 8 outcome measurements |
| Baseline characteristics similar | Low risk | No baseline differences (P < 0.05) reported between the UCT intervention group and the control group in characteristics |
| Blinding of participants and personnel (performance bias) All outcomes | High risk | Blinding of participants not possible, and blinding of personnel unclear |
| Blinding of outcome assessment (detection bias) All subjectively measured outcomes | Unclear risk | Unclear whether outcome assessors blinded |
| Blinding of outcome assessment (detection bias) All objectively measured outcomes | Low risk | Unclear whether outcome assessors blinded. Outcome is unlikely to be influenced by lack of blinding because it is objectively measured. |
| Contamination | Low risk | Allocation was by community and little contamination reported (73% of the intervention group and 3% of the control group received the intervention) |
| Incomplete outcome data (attrition bias) All outcomes | High risk | The study extracted and analysed only a small sub‐sample of the total study sample at baseline (i.e. 786 of 5547 children or 14.2% of the total study sample), without an explanation for this selection. Initial survey non‐response unclear. Overall attrition moderate (11%). Attrition non‐differential between treatment and control groups by outcome measurements and characteristics. Number of missing clusters and number and percentage of missing participants:
Number of missing participants for the included outcomes
We considered the missing data to be unlikely to have impacted effect estimates. |
| Selective reporting (reporting bias) | Unclear risk | No study protocol identified |
| Other bias | Low risk | None identified |
Galiani 2014.
| Study characteristics | ||
| Methods | Controlled before‐and‐after study, difference‐in‐differences methods with individual and year fixed effects, 15 months in 2007 to 2008 | |
| Participants | 3477 households and 3556 adults (aged > 65 years) interviewed twice (baseline: September 2007 to November 2007; follow‐up: November 2008 to December 2008), 463 localities, 7 states (Guerrero, Querétaro, Michoacán, San Luis Potosí, Puebla, Veracruz and Hidalgo), Mexico | |
| Interventions | 1 exposure group and 3 control groups
Intervention duration: 12 months. Follow‐up: 12 months into the intervention. Intervention design: aimed to ensure food security and improve the living conditions and quality of life of older people residing in rural areas (ILO 2013); targeted to older adults aged ≥ 60 years who resided in small, non‐welfare, rural communities (ILO 2013); eligibility determined through applicants providing proof of age and residence; provided a total amount of USD 540 (USD 45 per month for 12 months; 3.5% of the annual GDP per capita); paid in‐hand to pensioner every second month; and minor co‐interventions: workshops and social development activities. |
|
| Outcomes | Primary outcomes
Secondary outcomes
|
|
| Notes | Intervention context: Programa de Atención a Adultos Mayores en Zonas Rurales, implemented by the Government of Mexico; unclear programme uptake; population coverage was 2.1 million people; and the total programme cost of the UCT was USD 683 million (approximately 0.1% of Mexico's GDP). Funder of study: none stated. Conflict of interest: none identified. | |
| Risk of bias | ||
| Bias | Authors' judgement | Support for judgement |
| Random sequence generation (selection bias) | High risk | Unclear whether sampling strategy was random. Unclear whether nationally‐representative sample achieved. No baseline differences between treatment and control groups in outcomes, but minor differences in population characteristics |
| Allocation concealment (selection bias) | Unclear risk | Allocation concealment among participants and study personnel unclear |
| Baseline outcome measurements similar | Low risk | No baseline differences (P < 0.05) reported between the unconditional cash transfer exposure group and the control group in the outcome measurements |
| Baseline characteristics similar | High risk | Baseline differences (P < 0.05) reported between the UCT exposure group and the control group in 3 characteristics at the household level. The proportion of households with male household heads was higher in the exposure group than in the control group (0.74 compared with 0.57, P < 0.01). Consumption per adult equivalents (i.e. the sum of food and non‐food expenditures plus the value of home‐produced food) was higher in the exposure group than that in the control group (270.72 compared with 422.91, P < 0.01). The average household was larger in the UCT exposure group than in the control group (5.60 compared with 4.02, P < 0.01). Baseline differences (P < 0.05) reported between the UCT exposure group and the control group in 4 characteristics at the individual level. The proportion of males was higher in the exposure group than in the control group (0.50 compared with 0.35, P < 0.01). The number of years of school was higher in the exposure group than that in the control group (1.86 compared with 1.39, P = 0.01). The proportion of participants who were married was higher in the UCT exposure group than in the control group (0.66 compared with 0.46, P < 0.01). However, all baseline differences in characteristics comprehensively adjusted for using regression analytic methods. |
| Blinding of participants and personnel (performance bias) All outcomes | Low risk | Participants not allocated to the intervention by the researchers. Secondary analysis of survey data collected for a different purpose than estimating the effect of the unconditional cash transfer on use of health services and health outcomes. Therefore, blinding of participants and of personnel was neither feasible nor necessary. |
| Blinding of outcome assessment (detection bias) All subjectively measured outcomes | Low risk | No subjectively‐measured outcome in this study |
| Blinding of outcome assessment (detection bias) All objectively measured outcomes | Low risk | Participants not allocated to the intervention by the researchers. Secondary analysis of survey data collected for a different purpose than estimating the effect of the unconditional cash transfer on use of health services and health outcomes, therefore blinding of outcome assessors was neither feasible nor necessary. Outcome is unlikely to be influenced by lack of blinding because it is objectively measured. |
| Contamination | High risk | Allocation was by individual, and additional income from the UCT provided to participants in the intervention groups may have been transferred to participants in the control group (e.g. between family members) |
| Incomplete outcome data (attrition bias) All outcomes | Low risk | Initial survey non‐response unclear. Attrition moderate (9%), but unclear whether it differed between the intervention and control groups. The number and percentage of missing values per UCT intervention group and control group and for the outcome are unclear. We considered it unlikely that the missing data impacted effect estimates. |
| Selective reporting (reporting bias) | Unclear risk | No study protocol identified. |
| Other bias | High risk | Misclassification bias of the exposure: used self‐reported receipt of a UCT collected in surveys, but we considered the risk of this bias to be low. Confounding: this study did not adjust comprehensively for all potential confounders, and it used difference‐in‐differences methods, which carry a risk of bias, if the underlying time trends differ between the exposed group and the non‐exposed group. We therefore judged the risk of confounding to be high. Reverse causation: the outcome may have impacted the exposure, but we considered the risk of this bias to be low. |
Grellety 2017.
| Study characteristics | ||
| Methods | Cluster‐randomised controlled trial (3 stages: first stage, of 52 clusters (defined as a health centre and its catchment area), 20 were randomly selected for participation in the study; second stage, each of the 20 selected clusters was randomly assigned to intervention or control group; third stage, each cluster selected into the intervention group was randomly assigned to one of the two intervention arms), regression analysis, 6 months in 2015 to 2016 | |
| Participants | 1481 participants (children aged 6 to 59 months with a mid‐upper arm circumference < 115 mm and/or a weight‐for‐height/length z‐score < –3Z [33] and/or with bilateral oedema) interviewed twice (baseline: July 2015; follow‐up: January 2016), 20 clusters (health care centres plus catchment areas), Bipemba commune, Mbuji‐Mayi city, Kasaï‐Oriental province, Democratic Republic of the Congo | |
| Interventions | 1 intervention group and 1 control group
Intervention duration: 6 months. Follow‐up: 6 months into the intervention. Intervention design: aimed to ensure food security and support recovery from severe acute malnutrition; targeted to children with severe acute malnutrition who received treatment for the condition; eligibility determined through the children's participation in treatment for severe acute malnutrition in an eligible healthcare centre; provided a total amount of USD 240 (USD 40 per month for 6 months; 49.3% of the annual GDP per capita); paid in‐hand to heads of households every one month at dedicated payment point; and minor co‐interventions: standard treatment and counselling for acute severe malnutrition. |
|
| Outcomes | Primary outcomes
Alternative primary outcome measures not reported in this review
|
|
| Notes | Intervention context: experiment implemented by research organisations, nongovernmental organisations and international organisations; unclear programme uptake, population coverage and total programme cost of the UCT. Funder of study: UNICEF, Democratic Republic of the Congo; and Department for International Development, United Kingdom. Potential conflict of interest: none reported and none identified. | |
| Risk of bias | ||
| Bias | Authors' judgement | Support for judgement |
| Random sequence generation (selection bias) | Low risk | Random sequence generation was ensured |
| Allocation concealment (selection bias) | Low risk | Allocation was concealed among participants and study personnel |
| Participants recruited after cluster allocation (recruitment bias in cluster‐RCTs) | Low risk | Participants recruited after cluster allocation |
| Baseline outcome measurements similar | Low risk | For all included outcomes, baseline outcome measurements were reported, and there were no important differences between groups. |
| Baseline characteristics similar | Low risk | Baseline characteristics were reported and there were no important differences between groups; however, there were differences at baseline between intervention and control group in the distribution into categories of school achievement (four categories, P < 0.001), and the intervention group had larger mean household size than the control group (8.0 vs. 7.6; P = 0.001) and a larger number of children (2.7 vs. 2.1; P < 0.001) |
| Blinding of participants and personnel (performance bias) All outcomes | High risk | Blinding of participants not possible, but at least some study personnel (data cleaners) were blinded, reducing the risk of bias from lack of blinding |
| Blinding of outcome assessment (detection bias) All subjectively measured outcomes | Low risk | Outcome assessors were not blinded, but blinded study personnel cleaned the outcome data and assessed any obvious errors against blinded data |
| Blinding of outcome assessment (detection bias) All objectively measured outcomes | Low risk | Outcome assessors were not blinded, but blinded study personnel cleaned the outcome data and assessed any obvious errors against blinded data |
| Contamination | Low risk | Geographically‐adjacent clusters were excluded from the study population to reduce risk of bias from contamination |
| Incomplete outcome data (attrition bias) All outcomes | Low risk | Initial survey non‐response unclear. Attrition was relatively small among both intervention group and control group, but was lower among the intervention group than the control group, for both non‐response to the follow‐up survey (1% vs. 3%, P = 0.02) and defaulting defined as absence for two consecutive health centre visits and confirmed as absent by a home visit at week 3 (1% vs. 6%, P < 0.001). Number and percentage of missing clusters and missing participants per group:
The number and percentage of participants with missing values per outcome was unclear. |
| Selective reporting (reporting bias) | Low risk | All outcomes reported in the study protocol (registration in ClinicalTrials.gov under NCT02460848) were also reported in the study record |
| Other bias | Low risk | None identified |
Haushofer 2013.
| Study characteristics | ||
| Methods | Cluster‐randomised controlled trial (3 stages: first stage, villages were randomly selected; second stage, eligible households were randomly assigned to intervention group or control group; third stage, either the female or male head of the assigned household was randomly assigned to intervention group or control group), regression analytic methods, 19 months in 2011 to 2012 | |
| Participants | 1440 poor (i.e. without a thatch roof) households in rural areas, 2140 primary household members and 1203 children (aged < 5 years) interviewed twice (baseline: May 2011 to November 2011; follow‐up: September 2012 to December 2012), 62 villages, Rarieda region, Kenya | |
| Interventions | 2 intervention groups and 2 control groups
Intervention duration: 9 months (for the included UCT intervention). Follow‐up: 7 to 9 months into the intervention and up to 10 months after 9 months of intervention. Intervention design: aimed to alleviate poverty among poor households; in both intervention groups, the UCT was stratified into random assignment of either a small or large cash amount; provided a total amount of USD 404 for the small UCT (approximately USD 4.89 per month for 9 months; or approximately 14.3% of the annualised purchasing power parity (PPP)‐adjusted, per‐capita GDP) and USD 1516 for the large UCT (USD 168.44 per month for 9 months; approximately 53.8% of the annual GDP per capita); provided via mobile money service; and minor co‐intervention: participants were provided with a SIM card for their cell phone. |
|
| Outcomes | Primary outcomes
Secondary outcomes
Alternative primary outcome measures not reported in this review
|
|
| Notes | Intervention context: experiment implemented by a nongovernmental organisation (GiveDirectly); unclear programme uptake, population coverage and total programme cost of the UCT. Funder of study: National Institute of Health and Cogito Foundation. Potential conflict of interest: one study author co‐founded and formerly directed the organisation implementing the studied UCT. Pairing of studies: Haushofer 2013 was replicated by Wang 2019 (pure replication study), and we prioritised the original included study, but considered the replication study's findings when we assessed risk of bias. | |
| Risk of bias | ||
| Bias | Authors' judgement | Support for judgement |
| Random sequence generation (selection bias) | Low risk | Randomisation ensured |
| Allocation concealment (selection bias) | Low risk | Allocation concealment among participants unclear and among study personnel ensured |
| Participants recruited after cluster allocation (recruitment bias in cluster‐RCTs) | Low risk | Participants recruited after cluster allocation, but they were randomly assigned to intervention or control group |
| Baseline outcome measurements similar | Unclear risk | The study reports "largely insignificant" (p. 14; Haushofer 2016) differences between the intervention groups (combined) and the control groups (combined). However, we found a significant baseline difference across index variables when comparing male to female recipients of the UCTs (P = 0.02). |
| Baseline characteristics similar | Low risk | No baseline differences (P < 0.05) were observed comparing the baseline characteristics between the UCT intervention groups (combined) and the control group included in this review |
| Blinding of participants and personnel (performance bias) All outcomes | High risk | Blinding of participants not possible, and blinding of personnel unclear |
| Blinding of outcome assessment (detection bias) All subjectively measured outcomes | High risk | Outcome assessors not blinded |
| Blinding of outcome assessment (detection bias) All objectively measured outcomes | Low risk | Outcome assessors not blinded. Outcome is unlikely to be influenced by lack of blinding because it is objectively measured. |
| Contamination | Low risk | This study tested for spill‐over effects, and it did not find any evidence for contamination for the outcomes included in this review. |
| Incomplete outcome data (attrition bias) All outcomes | Low risk | Initial survey response unclear. Attrition low (7%) and did not differ between treatment and control groups and by outcomes. No significant (P < 0.05) baseline differences observed in index variables between people lost to follow‐up and those remaining in the study. The number and percentage of missing values per UCT intervention group and control group and for each of the outcomes is unclear. |
| Selective reporting (reporting bias) | Low risk | All outcomes reported in the study protocol were also reported in the study record. However, the study protocol was only registered in the American Economic Association's registry for randomised controlled trials on 28 June 2013 (RCT ID: AEARCTR‐0000019), which is after data collection for the trial had occurred between 1 May 2011 and 28 February 2013. |
| Other bias | Low risk | None identified |
Hessel 2018.
| Study characteristics | ||
| Methods | Cohort study, regression analysis with instrumental variable analysis, 3 years: 2010 to 2013 | |
| Participants | 22,297 participants (all older people) interviewed over 4 waves of the (2010 to 13) of the Encuesta Nacional de Calidad de Vida (National Quality of Life Survey) (waves collected in 2010, 2011, 2012 and 2013), 7 municipalities (Arguachica, Bucaramanga, Calarca,Chaparral, Ibague, Manizales, and Ocana), Colombia | |
| Interventions | Exposure
Duration: up to 36 months. Follow‐up: up to 36 months into the intervention. Intervention design: aimed to reduce poverty among older people; targeted to women aged > 53 years and men aged > 58 years who met a poverty threshold; provided a total amount of USD 576.00 to USD 1,224.00 (USD 16.00 to USD 34.00 per month for 36 months; 9.0% to 19.0% of the annual gross domestic product (GPD) per capita) |
|
| Outcomes | Primary outcomes
|
|
| Notes | Intervention context: government programme of Colombia called the Colombia Mayor (noncontributory pension); implemented by the Governmen of Colombia; covered nearly 1.5 million older adults in 2003; unclear intervention uptake and intervention costs. Funder of the study: European Union; and Economic and Social Research Council, United Kingdom. Conflict of interest: none identified | |
| Risk of bias | ||
| Bias | Authors' judgement | Support for judgement |
| Random sequence generation (selection bias) | Low risk | A random sampling strategy was employed, the longitudinal survey was collected by a national official statistics department, and a nationally representative sample was achieved |
| Allocation concealment (selection bias) | Low risk | Allocation concealment among participants and study personnel unclear |
| Baseline outcome measurements similar | Unclear risk | No overall P values, test statistics or SDs reported |
| Baseline characteristics similar | Unclear risk | No overall P values, test statistics or SDs reported |
| Blinding of participants and personnel (performance bias) All outcomes | Low risk | Participants not allocated to the intervention by the researchers. Secondary analysis of survey data collected for a different purpose than estimating the effect of the UCT on the use of health services and health outcomes. Therefore, blinding of participants neither feasible nor necessary. Blinding of study personnel unclear |
| Blinding of outcome assessment (detection bias) All subjectively measured outcomes | Low risk | Participants not allocated to the intervention by the researchers. Secondary analysis of survey data collected for a different purpose than estimating the effect of the UCT on use of health services and health outcomes. Therefore, blinding of outcome assessors neither feasible nor necessary. The outcomes are unlikely to be influenced by the lack of blinding. |
| Blinding of outcome assessment (detection bias) All objectively measured outcomes | Low risk | No objectively‐measured outcome in this study |
| Contamination | Unclear risk | Allocation was by household, but additional income from the UCT provided to participants in the exposed group may have been transferred to participants in the unexposed group (e.g. between family members) |
| Incomplete outcome data (attrition bias) All outcomes | Unclear risk | Survey non‐response, loss to follow‐up and item non‐response rates are unclear, as is whether they differed by outcome or participant characteristic. |
| Selective reporting (reporting bias) | Unclear risk | We did not identify a study protocol. |
| Other bias | High risk | Misclassification bias of the exposure: UCT receipt was assigned to all participants in households with one or more recipients of the UCT, and we therefore considered the risk of misclassification bias to be high. Confounding: the study analysed what we judged to be a genuine natural experiment (Craig 2017), using instrumental variables (Greenland 2000). We judged the assumptions made in this study for the instrumental variable analyses to be reasonable and, in turn, judged the intervention effect estimates to have therefore been reasonably controlled for potential confounding variables in these natural experiments. However, this study did not adjust for receipt of other social protection interventions in the household. Nevertheless, we judged the risk of confounding to be low. Reverse causation: the outcome may have impacted the exposure, but the use of instrumental variables further reduced the risk of reverse causation, and we therefore considered the risk of this bias to be low. |
Huang 2016.
| Study characteristics | ||
| Methods | Cluster‐randomised controlled trial (3 stages: stage 1, 4 locations in each of 7 districts were selected; stage 2, 2 locations each were randomly assigned to the intervention group and the control group; stage 3, households receiving the UCT were randomly selected from a list supplied by the UCT programme and other households were randomly selected from a household listing undertaken in a random sample of census enumeration areas), difference‐in‐differences methods, 28 months in 2007 to 2009 | |
| Participants | 2634 children (aged 0 to 17 years) at baseline (1184 children at follow‐up 1) in households with orphans or vulnerable (i.e. chronically ill or with a chronically ill caregiver) children interviewed twice (baseline: March 2007 to August 2007; follow‐up: March 2009 to July 2009; follow‐up 2: unclear month(s) 2011), 28 locations, 7 districts, Kenya | |
| Interventions | 1 intervention group and 1 control group
Intervention duration: 24 months. Follow‐up: 24 months into the intervention. Intervention design: aimed to provide a social protection system through regular and predictable cash transfers to families living with orphans or vulnerable children in order to encourage fostering and retention of orphans or vulnerable children within their families and communities, and to promote their human capital development; targeted to poor households with one or more non‐welfare (i.e. not receiving any other cash transfers) orphans or vulnerable children; eligibility determined through screening geographically, by a community committee and a survey; provided a total amount of approximately USD 352.80 (USD 14.70 per month for 24 months; 29.6% of the annual GDP per capita); paid in‐hand every second month; and fuzzy design: the cash transfer was conditional on attendance of a health facility for immunisations among children aged 0 to 1 year, growth monitoring and vitamin supplements among children aged 0 to 5 years, school enrolment among children aged 6 to 18 years and attendance of awareness sessions among adult parents or caregivers, but non‐compliance was not penalised in 4 out of 7 clusters (Ward 2010) |
|
| Outcomes | Primary outcomes
Alternative primary outcome measures not reported in this review
|
|
| Notes | Intervention context: pilot programme of the Government of Kenya called the Cash Transfer Programme for Orphans and Vulnerable Children; implemented through the Ministry of Gender, Children and Social Development; population coverage was approximately 15,000 recipients in July 2009; programme uptake was 97% among initial recipients (i.e. 3% of recipients dropped out of the programme); and the total programme cost of the UCT was USD 9.96 million in the 7 pilot districts between July 2006 and June 2009. Funder of studies: United Nations Children's Fund, Government of Kenya and United Kingdom Department for International Development. Conflict of interest: none identified | |
| Risk of bias | ||
| Bias | Authors' judgement | Support for judgement |
| Random sequence generation (selection bias) | Low risk | Locations were assigned to intervention group and control group via random sequence generated via lottery, and households in the locations were selected based on random numbers generated via computer |
| Allocation concealment (selection bias) | Unclear risk | Allocation concealment among participants and study personnel unclear |
| Participants recruited after cluster allocation (recruitment bias in cluster‐RCTs) | Low risk | Households were recruited after locations had been assigned to intervention group and control group |
| Baseline outcome measurements similar | Unclear risk | Outline measurements at baseline not reported disaggregated by treatment status |
| Baseline characteristics similar | Low risk | Baseline characteristics were reported. There were differences (P < 0.05) between treatment group and control group in six baseline characteristics: education of the head of household (3.38 vs. 4.88, P < 0.05); the household head's age (60.84 years vs. 55.15 years, P < 0.01); the proportion of participants who were in female‐headed households (0.61 compared with 0.51, P < 0.01); the proportion of children who were aged 5 to 7 years (0.68 vs. 0.86, P < 0.01); the average number of girls in the household (1.71 vs. 1.95, P < 0.01). We considered this level of difference to carry a low risk of bias. |
| Blinding of participants and personnel (performance bias) All outcomes | High risk | Blinding of participants was not possible, and study personnel were not blinded |
| Blinding of outcome assessment (detection bias) All subjectively measured outcomes | High risk | Outcome assessors were not blinded |
| Blinding of outcome assessment (detection bias) All objectively measured outcomes | Low risk | There were no objectively‐measured outcomes in this study |
| Contamination | Unclear risk | It is unclear if the study suffered from contamination |
| Incomplete outcome data (attrition bias) All outcomes | High risk | Initial survey non‐response was high (13%) (see Ward 2010). The proportion of participants lost to follow‐up was very large (55%); the proportion of participants lost to follow‐up in the intervention group (54%) was smaller than that in the control group (57%; statistical significance not tested). The study found no evidence for differences in attrition between the intervention group and in the control group by several population characteristics (Ward 2010). Of all participants, 1677 (or 64%) provided no response for the outcome "Had any illness" at follow‐up 1. The reasons for this very high level of item non‐response was that participants had aged out of the eligible age group (0 to 7 years) (956 participants or 36%) or were lost to follow‐up (494 participants 19%), at follow‐up 1. |
| Selective reporting (reporting bias) | Unclear risk | Study protocol identified (Protocol #265, Kenya Medical Research Institute Ethics Review Committee), but we were unable to locate a copy of it |
| Other bias | Low risk | Intervention occurred during a phase of post‐election violence, which may have impacted the intervention's effectiveness |
Leroy 2010.
| Study characteristics | ||
| Methods | Cluster‐randomised controlled trial (3 stages: first stage, 208 rural communities were randomly sampled; second stage, 33 households were randomly sampled from each community; and third stage, the households were randomly assigned to 3 intervention groups and 1 control group), difference‐in‐differences methods, 26 months in 2003 to 2005 | |
| Participants | 2876 households and 1509 women (18 to 49 years) from the households, who were not pregnant or lactating and had no missing data at baseline, interviewed twice (baseline: October 2003 to April 2004; follow‐up: October 2005 to December 2005); 8 states (Chiapas, Guerrero, Oaxaca, Quintana Roo, Tabasco, Campeche, Yucatan, and Veracruz), Mexico | |
| Interventions | 3 intervention groups and one control group
Intervention duration: unclear, but 14 months on average. Follow‐up: unclear, but 23 months after the intervention had started. Intervention design: aimed to reduce short‐term household vulnerability and to invest in long‐term human capital accumulation through interventions in health, nutrition and education; targeted to communities that did not receive benefits from other federal food aid programmes, had < 2500 inhabitants, and had a high level of marginalisation (but 37% of the communities receiving the UCT had a medium rather than a high level of marginalisation, suggesting that the community‐level targeting was not implemented successfully); provided a total amount of approximately USD 168 (approximately USD 14 per month for 14 months, 1.3% of the annual GDP per capita); paid in‐hand every second month; minor co‐intervention of UCT: education classes (which recipients did not commonly attend); and the 2 in‐kind transfer groups were joined in the analysis. |
|
| Outcomes | Primary outcomes
Alternative primary outcome measures not reported in this review
|
|
| Notes | Intervention context: Programa de Apoyo Alimentario, implemented by the Government of Mexico through its Ministry of Social Development; unclear programme uptake, population coverage and the total programme costs of the UCT. Funder of study: none stated. Conflict of interest: none identified | |
| Risk of bias | ||
| Bias | Authors' judgement | Support for judgement |
| Random sequence generation (selection bias) | Low risk | Randomisation ensured (although exact mechanism unclear). No differences between treatment and control groups in outcomes at baseline |
| Allocation concealment (selection bias) | Low risk | Allocation concealment among participants unclear and among study personnel partially ensured |
| Participants recruited after cluster allocation (recruitment bias in cluster‐RCTs) | Low risk | Participants recruited after cluster allocation, but they were randomly sampled from all households in the cluster |
| Baseline outcome measurements similar | Low risk | Among the sample of households, significant baseline differences were reported for one outcome. The UCT intervention group had a larger level of vitamin C intake than the in‐kind transfer intervention group (85.8 compared with 73.6, P < 0.05). Among the sample of individuals (extracted from a sub‐sample of households), no significant differences (P < 0.05) were observed between the UCT intervention group and the control group in the outcome measurements. |
| Baseline characteristics similar | Low risk | No significant differences (P < 0.05) were observed between the UCT intervention group and the control group. However, not many variables were assessed to show balance in baseline characteristics. |
| Blinding of participants and personnel (performance bias) All outcomes | High risk | Blinding of participants not possible; personnel blinded at least to the study objectives |
| Blinding of outcome assessment (detection bias) All subjectively measured outcomes | Low risk | Outcome assessors were partially blinded to treatment allocation |
| Blinding of outcome assessment (detection bias) All objectively measured outcomes | Low risk | Outcome assessors were partially blinded to treatment allocation. Outcome is unlikely to be influenced by lack of blinding because it is objectively measured. |
| Contamination | Unclear risk | No spill‐over control group was included, so the risk of contamination is unclear |
| Incomplete outcome data (attrition bias) All outcomes | High risk | Initial survey non‐response unclear. Among the sample of households, attrition was large (13%) and differed between the UCT intervention group and the control group (12% compared with 17%, no test provided). Among the sample of communities (extracted from a sub‐sample of households), attrition was small (2% of participants), but differed between the UCT intervention group and the control group (0% compared with 3%). Number of missing clusters and number and percentage of missing participants per group:
The number and percentage of participants with missing values per outcome was unclear. We considered the missing data to potentially have impacted effect estimates because a large percentage of participants were missing in the UCT intervention group (18%) and in the control group (24%). |
| Selective reporting (reporting bias) | Unclear risk | No study protocol was identified |
| Other bias | Low risk | None identified |
Luseno 2012.
| Study characteristics | ||
| Methods | Cluster‐randomised controlled trial (2 stages: first stage, 8 villages and 100 households per village were selected by a community committee; second stage, 4 villages each were randomly assigned to the UCT intervention group and to the control group), regression analytic methods, 12 months in 2007 to 2008 | |
| Participants | 1649 children (aged 6 to 17 years) interviewed twice (baseline: March 2007, follow‐up: April 2008), Mchinji district, Malawi | |
| Interventions | 1 intervention group and 1 control group
Intervention duration: 12 months. Follow‐up: 12 months into the intervention. Intervention design: aimed to alleviate poverty, reduce hunger and malnutrition, and improve school enrolment within ultra‐poor households; targeted to ultra‐poor (poorest 10% of the population) and/or labour‐constrained households with one or more adults; eligibility determined by volunteer village committees; and provided an average total amount of USD 124 (USD 12 per month for 12 months; 25.1% of the annual GDP per capita), but amount depended on household size and number of school‐aged children:
Plus
|
|
| Outcomes | Primary outcomes
Secondary outcomes
Alternative primary outcome measures not reported in this review
|
|
| Notes | Intervention context: pilot programme of the Government of Malawi called the Malawi Social Cash Transfer Pilot Scheme; unclear programme uptake, population coverage and total programme costs. Funder of study: United Nations Children's Fund, European Union, Malawi National AIDS Commission, Government of Germany, and Irish Aid. Conflict of interest: none identified | |
| Risk of bias | ||
| Bias | Authors' judgement | Support for judgement |
| Random sequence generation (selection bias) | Low risk | Randomisation ensured. However, the exact randomisation procedures are unclear. |
| Allocation concealment (selection bias) | Unclear risk | Allocation concealment among participants and among study personnel unclear |
| Participants recruited after cluster allocation (recruitment bias in cluster‐RCTs) | High risk | Participants recruited after cluster allocation |
| Baseline outcome measurements similar | High risk | Baseline differences (P < 0.05) were reported between the UCT intervention group and the control group in one outcome measurement. Health care used for child's worst illness in the past year was lower in the UCT intervention group than in the control group (80% compared with 90%, P < 0.01). |
| Baseline characteristics similar | High risk | At the individual level, baseline differences were reported between the UCT intervention group and the control group in one characteristic. The distribution of orphans (maternal, paternal, double) differed (P = 0.02). At the household level, baseline differences between the UCT intervention group and the control group were reported in 6 characteristics: the UCT intervention group had higher educational status of the household head (P = 0.02); a smaller number of working‐age adults in household (P = 0.01); a smaller number of children aged 6 to 9 years (P < 0.01); a smaller number of children aged 10 to 14 years (P < 0.01); a smaller number of children aged 14 to 17 years (P = 0.01); and a smaller overall household size (P < 0.01). |
| Blinding of participants and personnel (performance bias) All outcomes | High risk | Blinding of participants not possible and blinding of personnel unclear |
| Blinding of outcome assessment (detection bias) All subjectively measured outcomes | High risk | Outcome assessors not blinded |
| Blinding of outcome assessment (detection bias) All objectively measured outcomes | Low risk | No objectively‐measured outcome in this study |
| Contamination | Unclear risk | No spill‐over control group was included, so that the risk of contamination is unclear |
| Incomplete outcome data (attrition bias) All outcomes | High risk | Initial survey non‐response unclear. A large proportion of participants was lost to follow‐up (15%), and a larger proportion of participants in the UCT intervention group was lost to follow‐up (18%), compared with that in the control group (12%). For each group, the number of clusters and number and percentage of participants (i.e. those who did not drop out of the study) with missing values were:
The number and percentage of missing values per outcome is unclear. We considered the missing data to potentially have impacted effect estimates because of the large and differential loss to follow‐up and the large percentage of participants with missing values. |
| Selective reporting (reporting bias) | Unclear risk | No study protocol identified |
| Other bias | Low risk | None identified |
Miller 2008.
| Study characteristics | ||
| Methods | Cluster‐randomised controlled trial (2 stages: stage 1, 800 households in 8 village groups with a total of 23 villages were selected by community committees and enrolled in the UCT; stage 2, 4 village groups each were randomly assigned to the intervention group and to the control group); difference‐in‐differences methods; 13 months in 2007 to 2008 | |
| Participants | 819 ultra‐poor, labour‐constrained households interviewed 3 times (baseline: March 2007; follow‐up 1: September 2007; follow‐up 2: April 2008); Mchinji District, Malawi | |
| Interventions | 1 intervention group and 1 control group
Duration: 13 months. Follow‐up: 13 months into the intervention. Intervention design: aimed to alleviate poverty, reduce hunger and malnutrition, and improve school enrolment within ultra‐poor households; was targeted to ultra‐poor (poorest 10% of the population) and/or labour‐constrained households with one or more adults; eligibility determined by volunteer community social protection committees; and provided an average total amount of USD 124 (USD 12 per month for 12 months; 25.1% of the annual GDP per capita), but amount depended on household size and number of school‐aged children.
Plus
|
|
| Outcomes | Primary outcomes
|
|
| Notes | Intervention context: programme of the Government of Malawi called the Social Cash Transfer Scheme; unclear programme uptake; population coverage of over 83,000 households in 2010; and unclear total programme costs of the UCT. Funder of study: United Nations Children's Fund and United States Agency for International Development. Conflict of interest: none identified | |
| Risk of bias | ||
| Bias | Authors' judgement | Support for judgement |
| Random sequence generation (selection bias) | Low risk | Randomisation likely ensured. Exact randomisation procedures unclear . |
| Allocation concealment (selection bias) | Unclear risk | Allocation concealment among participants and among study personnel unclear |
| Participants recruited after cluster allocation (recruitment bias in cluster‐RCTs) | Unclear risk | Unclear whether participants recruited after cluster allocation |
| Baseline outcome measurements similar | Low risk | No baseline differences (P < 0.05) in outcome measurements reported between the intervention group and the control group. However, formal statistical tests are only reported for level of dietary diversity. |
| Baseline characteristics similar | High risk | Baseline differences (P < 0.05) reported between the UCT intervention group and the control group for 5 population characteristics: the proportion of households headed by person with no schooling was lower in the UCT intervention group (44% compared with 65%, P < 0.01); the household size was larger in the UCT intervention group (4.7 compared with 3.5, P < 0.01); the proportion of elderly‐only households was lower in the UCT intervention group (12% compared with 22%, P < 0.01); the proportion of households in which one adult provides for more than 3 dependents was larger in the UCT intervention group (23% compared with 16%, P < 0.01); the proportion of households with no healthy adult aged 19 to 64 years was lower in the UCT intervention group (55% compared with 62%, P < 0.05). The proportion of households with their house's outer walls made from grass was higher in the UCT intervention group (4% compared with 2%, P < 0.01). |
| Blinding of participants and personnel (performance bias) All outcomes | High risk | Blinding of participants not possible, and blinding of personnel unclear |
| Blinding of outcome assessment (detection bias) All subjectively measured outcomes | High risk | Outcome assessors not blinded |
| Blinding of outcome assessment (detection bias) All objectively measured outcomes | Low risk | Outcome assessors not blinded. Outcome is unlikely to be influenced by lack of blinding because it is objectively measured. |
| Contamination | Unclear risk | No spill‐over control group was included, so that the risk of contamination is unclear. Resources (food buckets) were only given to the control group, but anticipation bias could have impacted household spending for the control group (they were told in March 2007 that they would receive money transfers in April 2008 and could have borrowed against the future transfer). The intervention group may have overestimated their food expenditures to make sure they would continue to get the intervention. |
| Incomplete outcome data (attrition bias) All outcomes | Unclear risk | The proportion of participants who were lost to follow‐up was moderate (9%), but the proportion of participants lost to follow‐up in the UCT intervention group was larger than that in the control group (10% compared with 6%). The number and percentage of missing values per UCT intervention group and control group and for each of the outcomes is unclear. We were not able to judge the risk of attrition bias from incomplete outcome data. |
| Selective reporting (reporting bias) | Unclear risk | No study protocol identified |
| Other bias | Low risk | Minor co‐intervention (food transfer) may have affected the treatment effect estimate, but we judged this risk to be low |
Ohrnberger 2019.
| Study characteristics | ||
| Methods | Cohort study, regression analysis with instrumental variable analysis with fixed effects methods, 6 years: 2008 to 2014 | |
| Participants | 10,925 participants (children aged 15 to 18 years and adults) interviewed over 4 waves of the National Income Dynamics Study (waves collected in 2008, 2010, 2012 and 2014), South Africa | |
| Interventions | Exposure
Duration: up to 72 months. Follow‐up: up to 72 months into the intervention. Intervention design: aimed to reduce poverty among children in poor families; targeted to children living in poor households; provided an average total amount of up to USD 982.80 per child (USD 13.65 per month for 72 months (Delany 2008); 16.8% of the annual GDP per capita); potential minor co‐intervention of one or more other cash transfers (e.g. Foster Care Grant, Disability Grant, Care Dependency Grant and/or Old Age Pension) |
|
| Outcomes | Primary outcomes
|
|
| Notes | Intervention context: programme of the Government of South Africa called the Child Support Grant; implemented by the Government of South Africa; unclear population coverage, intervention uptake, and intervention costs. Funder of the study: University of Manchester. Conflict of interest: none identified. | |
| Risk of bias | ||
| Bias | Authors' judgement | Support for judgement |
| Random sequence generation (selection bias) | Low risk | This study analyses a natural experiment using eligibility for the intervention as an instrumental variable for intervention assignment |
| Allocation concealment (selection bias) | Low risk | Since this study was a retrospective cohort study that used an instrumental variable for the intervention assignment, allocation concealment as a risk of bias domain is not applicable |
| Baseline outcome measurements similar | Unclear risk | Baseline outcome measurements are not reported |
| Baseline characteristics similar | Unclear risk | Baseline characteristics are not reported |
| Blinding of participants and personnel (performance bias) All outcomes | Low risk | Participants not allocated to the intervention by the researchers. Secondary analysis of survey data collected for a different purpose than estimating the effect of the UCT on the use of health services and health outcomes. Therefore, blinding of participants neither feasible nor necessary. Blinding of study personnel unclear. |
| Blinding of outcome assessment (detection bias) All subjectively measured outcomes | High risk | Outcome assessors were not blinded |
| Blinding of outcome assessment (detection bias) All objectively measured outcomes | Low risk | No objectively measured outcomes in this study |
| Contamination | Unclear risk | It is unclear if the study suffered from contamination |
| Incomplete outcome data (attrition bias) All outcomes | Unclear risk | Initial survey non‐response was unclear. The proportion of participants lost to follow‐up was unclear. The study found no evidence for differences in outcome measurements between attriters and non‐attriters (see the study record's Supplementary information file in Ohrnberger 2020). The numbers and percentages of missing households and missing values per outcome were unclear. |
| Selective reporting (reporting bias) | Unclear risk | No study protocol identified |
| Other bias | High risk | Misclassification bias of the exposure: UCT receipt was assigned to all participants in households with one or more child eligible for UCT, and we considered this exposure assignment to carry a high risk of misclassification bias. Confounding: the study analysed what we judged to be a genuine natural experiment (Craig 2017), using instrumental variables (Greenland 2000). We judged the assumptions made in this study for the instrumental variable analyses to be reasonable and, in turn, judged the intervention effect estimates to have therefore been reasonably controlled for potential confounding variables in these natural experiments. We judged the risk of confounding to be low. Reverse causation: the outcome may have impacted the exposure, but the use of instrumental variables further reduced the risk of reverse causation, and we therefore considered the risk of this bias to be low. Potential effects of co‐interventions: a substantial proportion (38%) of participants received another cash transfer (i.e. Old Age Pension) during at least one survey wave, and the UCT effects may have been influenced by this co‐intervention; however, we judged the risk for bias from this to be low. |
Olajide 2013.
| Study characteristics | ||
| Methods | Cluster‐randomised controlled trial (2 stages: first stage, 112 wards were identified with ≥ 60 older adults aged ≥ 65 years; second stage, 56 wards each were randomly assigned to the UCT intervention group and to the control group), regression analytic methods, 24 months in 2013 to 2015 | |
| Participants | 6236 participants (older adults aged ≥ 65 years) interviewed three times (baseline: July to September 2013, follow‐up 1: July to September 2014, follow‐up 2: April to July 2015), 112 wards, 1 state (Ekiti), Nigeria | |
| Interventions | 1 intervention group and 1 control group
Duration: 12 months. Follow‐up: 12 months into the intervention. Intervention design: aimed to reduce poverty and vulnerability to economic shocks among older adults; targeted to persons aged ≥ 65 years old, receiving no pension, and with a monthly income < Nigerian naira (NGN) 3000 (USD 19); eligibility determined through geographic residency in areas with a large proportion of the population living in poverty; provided a total amount of USD 384 per person (USD 32 per transfer per capita for an average of 12 transfers in 12 months; 13.0% of the annual GDP per capita); paid in‐hand every one month at dedicated payment points. |
|
| Outcomes | Primary outcomes
Secondary outcomes
|
|
| Notes | Intervention context: programme of the Government of Nigeria called the Ekiti State Pension Program; implemented by the State Government of Ekiti; unclear population coverage, intervention uptake, and intervention costs. Funders of the study: Department for International Development, United Kingdom; and International Development Research Centre, Canada. Conflict of interests: none reported and none identified | |
| Risk of bias | ||
| Bias | Authors' judgement | Support for judgement |
| Random sequence generation (selection bias) | Low risk | If the protocol was implemented as planned, random sequence generation was done using dedicated computer software |
| Allocation concealment (selection bias) | Unclear risk | Allocation concealment among participants and study personnel unclear |
| Participants recruited after cluster allocation (recruitment bias in cluster‐RCTs) | Low risk | Participants were recruited before cluster allocation |
| Baseline outcome measurements similar | Unclear risk | Baseline outcome measurements are not reported |
| Baseline characteristics similar | Unclear risk | Baseline measures for a large number of characteristics reported, but no overall P values or test statistics reported |
| Blinding of participants and personnel (performance bias) All outcomes | High risk | Blinding of participants not possible, and blinding of personnel unclear |
| Blinding of outcome assessment (detection bias) All subjectively measured outcomes | Unclear risk | Unclear whether outcome assessors blinded |
| Blinding of outcome assessment (detection bias) All objectively measured outcomes | Low risk | No objectively‐measured outcomes in this study |
| Contamination | Low risk | Allocation by small and homogeneous geographic unit (ward) to reduce risk of contamination, and evidence was reported that there were only minor spill‐over effects on labour outcomes, indicating low risk of bias in this domain |
| Incomplete outcome data (attrition bias) All outcomes | Unclear risk | Survey non‐responses were unclear, loss to follow‐up was low (5%), but differed between intervention and control group (1% vs. 9%; P not reported). Item non‐response rates were unclear |
| Selective reporting (reporting bias) | Low risk | The study protocol is available and all of the study’s pre‐specified (primary and secondary) outcomes that are of interest in the review have been reported in the pre‐specified way |
| Other bias | Low risk | None identified |
Oxford Policy Management 2012.
| Study characteristics | ||
| Methods | Cluster‐randomised controlled trial (2 stages: stage 1, 48 geographic areas were randomly selected and matched into pairs; stage 2, within each matched pair, one geographic area was randomly assigned to the intervention group and the other to the control group), difference‐in‐differences methods, 39 months in 2009 to 2012 | |
| Participants | 6800 children (aged 0 to 17 years) and 2440 adults (aged 18 to 54 years) interviewed 3 times (baseline: August 2009 to November 2010; follow‐up 1: November 2010 to November 2011; follow‐up 2: February to November 2012), 4 counties (Mandera, Marsabit, Turkana and Wajir), Kenya | |
| Interventions | 1 intervention group and 1 control group
Duration: 24 months. Follow‐up: 24 months into the intervention. Intervention design: aimed to reduce poverty, food insecurity and malnutrition and to promote asset retention and accumulation for beneficiary households; targeted to poor households; eligibility determined through geographic residency in areas with a large proportion of the population living in poverty; provided a total amount of USD 37.40 to USD 74.8 per household (USD 3.40 to USD 6.80 per transfer per capita for an average of 11 transfers in 24 months; 15.6% of the annual GDP per capita); paid in‐hand every second month; and number of transfers received varied considerably across households. |
|
| Outcomes | Primary outcomes
Secondary outcomes
Alternative primary outcome measures not reported in this review
|
|
| Notes | Intervention context: pilot programme of the Government of Kenya called the Hunger Safety Net Programme; implemented by the Government of Kenya through its Ministry of State for the Development of Northern Kenya and Other Arid Lands and service providers contracted to the ministry; unclear programme uptake; population coverage of 300,000 beneficiaries in 60,000 households; and unclear total programme cost of the UCT. Funder of study: United Kingdom Department for International Development. Conflict of interest: none identified. Pairing with other studies: Aizawa 2020 and Oxford Policy Management 2012 reported effect estimates for different measurements for the same included outcomes. We always prioritised Oxford Policy Management 2012 because it always reported the preferred outcome measurements. | |
| Risk of bias | ||
| Bias | Authors' judgement | Support for judgement |
| Random sequence generation (selection bias) | Low risk | Randomisation was ensured |
| Allocation concealment (selection bias) | Low risk | Allocation determined by public lottery and therefore concealment protected |
| Participants recruited after cluster allocation (recruitment bias in cluster‐RCTs) | High risk | Participants recruited after cluster allocation |
| Baseline outcome measurements similar | Low risk | No baseline differences (P < 0.05) between UCT intervention group and control group in outcome measurements |
| Baseline characteristics similar | Low risk | No baseline differences (P < 0.05) between UCT intervention group and control group in characteristics. However, the loss of 8 clusters at follow‐up 2 reduced the balance in an unclear number of characteristics and seasonality of the UCT intervention group and the control group, compared with the balance at baseline of the original sample structure. |
| Blinding of participants and personnel (performance bias) All outcomes | High risk | Blinding of participants not possible, and blinding of personnel unclear |
| Blinding of outcome assessment (detection bias) All subjectively measured outcomes | High risk | Outcome assessors not blinded |
| Blinding of outcome assessment (detection bias) All objectively measured outcomes | Low risk | Outcome assessors not blinded. Outcome is unlikely to be influenced by lack of blinding because it is objectively measured. |
| Contamination | Unclear risk | No spill‐over control group was included, so the risk of contamination is unclear |
| Incomplete outcome data (attrition bias) All outcomes | High risk | Initial survey non‐response unclear. Loss to follow‐up was large, and the proportion of households lost to follow‐up in the UCT intervention group was larger than that in the control group (18% compared with 13%, no test of statistical significance provided). Loss to follow‐up also differed by one population characteristic, i.e. by district. Number of clusters and number and percentage of participants with missing values by group:
The number and percentage of missing values per outcome were unclear. Considering the large and likely differential loss to follow‐up, we judged the risk of bias from attrition to be high. |
| Selective reporting (reporting bias) | Unclear risk | No study protocol identified |
| Other bias | Low risk | None identified |
Paxson 2007.
| Study characteristics | ||
| Methods | Cluster‐randomised controlled trial (3 stages: stage 1, 118 parishes were randomly selected from a total of 378 parishes; stage 2, the 118 parishes were randomly assigned to the intervention group and the control group; stage 3, 50 families per parish were selected into the study), difference‐in‐differences methods, 27 months in 2003 to 2006 | |
| Participants | 2069 children (aged 36 to 84 months at follow‐up) and 2069 mothers (aged 24 years on average) in poor, non‐welfare (Bono Solidario) families with one or more children aged 0 to 72 months at baseline and no children aged > 72 months interviewed twice (baseline: October 2003 to March 2004; follow‐up: September 2005 to January 2006), 6 rural provinces, Ecuador | |
| Interventions | 1 intervention group and 1 control group
Duration: 15 to 19 months. Follow‐up: 15 to 19 months. Intervention design: aimed to reduce poverty and promote human capital investments among poor families through the provision of direct monetary transfers and incentives for households to invest in human capital (World Bank 2006); targeted to low‐income mothers of children aged 0 to 16 years; eligibility determined by a programme‐specific poverty threshold; provided an amount of USD 225 to USD 285 in 2006 (USD 15 per month for 15 to 19 months; 2.7% of the annual GDP per capita); paid in‐hand to mothers every month; and fuzzy design: compliance with conditions for preventive healthcare checks and school attendance for children existed but were not monitored. |
|
| Outcomes | Primary outcomes
Secondary outcomes
|
|
| Notes | Intervention context: programme of the Government of Ecuador called the Bono de Desarrollo Humano; uptake was 73% in the intervention group and 3% in the control group; population coverage was 40%; and unclear total programme costs of the UCT. Funder of study: the World Bank, Government of Ecuador and Princeton University. Conflict of interest: none identified. Pairing of studies: Fernald 2011 and Paxson 2007 analysed the same cluster‐RCT, and when both studies reported the same measurements for some included outcomes, we prioritised Paxson 2007 because it reported treatment effect estimates for the entire study sample, whereas Fernald 2011 reported results for only a selection of study participants. | |
| Risk of bias | ||
| Bias | Authors' judgement | Support for judgement |
| Random sequence generation (selection bias) | Low risk | Randomisation was ensured. Minor differences between treatment and control groups at baseline. |
| Allocation concealment (selection bias) | Unclear risk | Allocation concealment among participants and study personnel unclear |
| Participants recruited after cluster allocation (recruitment bias in cluster‐RCTs) | High risk | Participants recruited after cluster allocation |
| Baseline outcome measurements similar | Low risk | No baseline differences (P < 0.05) between the UCT intervention group and the control group in outcome measurements |
| Baseline characteristics similar | Low risk | No baseline differences (P < 0.05) between the UCT intervention group and the control group in characteristics |
| Blinding of participants and personnel (performance bias) All outcomes | High risk | Blinding of participants not possible, and blinding of personnel unclear |
| Blinding of outcome assessment (detection bias) All subjectively measured outcomes | Unclear risk | Blinding of outcome assessors unclear |
| Blinding of outcome assessment (detection bias) All objectively measured outcomes | Low risk | Blinding of outcome assessors unclear. Outcome is unlikely to be influenced by lack of blinding because it is objectively measured. |
| Contamination | Low risk | 3.7% of families in the control group received the UCT |
| Incomplete outcome data (attrition bias) All outcomes | High risk | Initial survey non‐response rate low (6%). Attrition low (6%) and reported as being non‐differential by treatment versus control group. The number and percentage of missing values per UCT intervention group and control group is unclear. Approximately 33% of children have a missing value on one or more outcomes. Considering the large percentage of children with missing values, we judged the risk of attrition bias to be high. |
| Selective reporting (reporting bias) | Unclear risk | No study protocol identified |
| Other bias | Low risk | None identified |
Pellerano 2014.
| Study characteristics | ||
| Methods | Cluster‐randomised controlled trial (4 stages: stage 1, 96 electoral divisions were matched into 48 pairs; stage 2, 40 pairs were randomly selected from the 48 pairs; stage 3, secondary sampling units of clusters of villages in the pairs were constructed; stage 4, households were randomly selected from the secondary sampling units and randomly assigned to the intervention group and the control group), difference‐in‐differences methods, 26 months in 2011 to 2013. | |
| Participants | 3102 households interviewed twice (baseline: June to August 2011; follow‐up: June to August 2013), 5 districts (Qacha's Nek, Maseru, Leribe, Berea and Mafeteng), Lesotho | |
| Interventions | 1 intervention group and 1 control group
Duration: 24 months. Follow‐up: 24 months into the intervention. Intervention design: aimed to improve the living standards of orphans and other vulnerable children in order to reduce malnutrition, improve health status and increase school enrolment among these children; targeted to poor and vulnerable households with one or more children; eligibility determined through a combination of means‐testing based on poverty, community validation and registration in the National Information System for Social Assistance; provided a total amount of USD 98 per household before April 2013 (approximately USD 4 per month for 24 months; 1.5% of the annual GDP per capita) and between USD 216 to households with ≤ 2 children (USD 9 per month for 24 months; 3.9% of the annual GDP per capita) and USD 450 to households with ≥ 5 children (USD 18.75 per month for 24 months; 8.1% of the annual GDP per capita) after April 2013; paid in‐hand every 4 months; minor co‐intervention: the Food Emergency Grant, a UCT for assistance in a humanitarian disaster (i.e. food insecurity from poor harvest) of USD 40 per month (17.4% of the annual GDP per capita), was provided alongside the UCT to recipients over 2012 to 2013; and fuzzy design: UCT was accompanied by instructions from social development officers at the pay point to spend the money on children. |
|
| Outcomes | Primary outcomes
Secondary outcomes
Alternative primary outcome measures not reported in this review
|
|
| Notes | Intervention context: programme of the Government of Lesotho called the Lesotho Child Grants Programme, implemented through Ministry of Social Development; unclear programme uptake; population coverage was 20,000 households with 50,000 children by the end of 2013; and unclear total programme cost of the UCT. Funder of study: European Union. Conflict of interest: none identified. | |
| Risk of bias | ||
| Bias | Authors' judgement | Support for judgement |
| Random sequence generation (selection bias) | Low risk | Randomisation was ensured. Minor differences in study characteristics at baseline between treatment and control clusters . |
| Allocation concealment (selection bias) | Low risk | Allocation determined by public lottery and therefore concealment protected |
| Participants recruited after cluster allocation (recruitment bias in cluster‐RCTs) | High risk | Participants recruited after cluster allocation |
| Baseline outcome measurements similar | Low risk | No baseline differences (P < 0.05) between the UCT intervention group and the control group in outcome measurements |
| Baseline characteristics similar | High risk | Baseline differences (P < 0.05) between the UCT intervention group and the control group in 5 characteristics: number of children aged 0 to 5 years (P < 0.01); females aged 18 to 59 years (P < 0.05); price of rubber boots (P < 0.05); average daily wage for females (P < 0.05); and proportion of households that borrowed or received support from other family members, friends or neighbours in (P < 0.05). |
| Blinding of participants and personnel (performance bias) All outcomes | High risk | Blinding of participants not possible, and blinding of personnel unclear |
| Blinding of outcome assessment (detection bias) All subjectively measured outcomes | Unclear risk | Blinding of outcome assessors unclear |
| Blinding of outcome assessment (detection bias) All objectively measured outcomes | Low risk | Blinding of outcome assessors unclear. Outcome is unlikely to be influenced by lack of blinding because it is objectively measured. |
| Contamination | Unclear risk | No spill‐over control group was included, so that the risk of contamination is unclear. An unclear number of households included in the follow‐up in the UCT intervention group might not have received the UCT. |
| Incomplete outcome data (attrition bias) All outcomes | High risk | Initial survey non‐response unclear. Attrition low (6%), but differed between the group eligible for the intervention and the group ineligible for it (9% versus 1%), as well as between the treatment and control groups among eligible participants (8% versus 12%). |
| Selective reporting (reporting bias) | Unclear risk | No study protocol identified |
| Other bias | Low risk | Minor co‐intervention (UCT for assistance in humanitarian disaster) may have affected the treatment effect estimates, but we judged this risk to be low. |
Robertson 2012.
| Study characteristics | ||
| Methods | Matched cluster‐randomised controlled trial (3 stages: stage 1, each of 10 sites were divided into 3 clusters; stage 2, each cluster within each site was randomly assigned to a UCT group, CCT group and control group; stage 3, all eligible households in each cluster were included), regression analytic methods, 22 months in 2009 to 2011 | |
| Participants | 2008 children (aged 0 to 5 years) in poor households that included one or more non‐welfare (other cash transfers for orphans or children) children (aged 0 to 17 years at baseline) and were headed by a child (aged 0 to 17 years) or cared for one or more orphan children (aged 0 to 17 years), disabled persons or chromically ill persons interviewed twice (baseline: July 2009 to September 2009; follow‐up: March 2011 to May 2011), 10 sites, Manicaland, Zimbabwe | |
| Interventions | 2 intervention groups and 1 control group
Duration: 12 months. Follow‐up: 2 to 4 months after 12 months of the intervention. Intervention design: aimed to reduce poverty; targeted to poor households with one or more non‐welfare (other cash transfers for orphans or children) children (aged 0 to 17 years at baseline) that were headed by a child (aged 0 to 17 years) or cared for one or more orphan children (aged 0 to 17 years), disabled persons or chronically ill persons; eligibility determined through population survey and community committees made up of a nongovernmental organisation (Diocese of Mutare Community Care Programme) and other local stakeholders (e.g. community health workers); UCT and CCT provided a total amount of USD 108 (USD 9 per month for 12 months; 7.8% of the annual GDP per capita) plus USD 24 per child (up to a maximum of 3 children) (USD 2 per month for 12 months; 1.7% of the annual GDP per capita); paid in‐hand every 2 months; co‐interventions for UCT and CCT: in‐kind transfers of maize seeds and fertiliser were provided alongside the UCT twice (December 2009 and August 2010) and parenting skill training was provided from September 2010; and CCT was conditional on applying for a birth certificate within 3 months for all children younger than 18 years (including newborn babies) whose births had not been registered; children younger than 5 years being fully vaccinated and attending growth monitoring clinics twice a year; children aged 6 to 17 years attending school at least 90% of the time each month; and a representative from every household attending two‐thirds of local parenting skills classes. |
|
| Outcomes | Primary outcomes
Secondary outcomes
|
|
| Notes | Intervention context: experiment conducted by research organisations; implemented by a nongovernmental organisation (Diocese of Mutare Community Care Programme); programme uptake was large, with 90% of eligible households reporting receiving the UCT; population coverage was 18% of the population (in the study sites); and unclear total programme cost of the UCT. Funder of study: World Bank, Programme of Support for the Zimbabwe National Action Plan for Orphans and Vulnerable Children and Wellcome Trust. Conflict of interest: none identified | |
| Risk of bias | ||
| Bias | Authors' judgement | Support for judgement |
| Random sequence generation (selection bias) | Low risk | Random sequence generation ensured. 2 control villages were accidentally enrolled into the UCT arm. |
| Allocation concealment (selection bias) | Unclear risk | Allocation determined by public lottery and therefore concealment protected |
| Participants recruited after cluster allocation (recruitment bias in cluster‐RCTs) | Low risk | Participants recruited before cluster allocation |
| Baseline outcome measurements similar | High risk | Baseline differences (P < 0.05) between the UCT intervention group, CCT intervention group and the control group in one outcome measurement. The proportion of children who were fully vaccinated in the UCT intervention group was 65%, in the CCT comparison group was 66% and in the control group was 66% (P = 0.03). |
| Baseline characteristics similar | Unclear risk | No baseline differences (P < 0.05) between the UCT intervention group, CCT intervention group and the control group in population characteristics |
| Blinding of participants and personnel (performance bias) All outcomes | High risk | Blinding of participants not possible, and blinding of personnel partially ensured (i.e. among data analysts) |
| Blinding of outcome assessment (detection bias) All subjectively measured outcomes | Low risk | Outcome assessors were blinded |
| Blinding of outcome assessment (detection bias) All objectively measured outcomes | Low risk | No objectively‐measured outcome in this study |
| Contamination | Unclear risk | No spill‐over control group was included, so the risk of contamination is unclear |
| Incomplete outcome data (attrition bias) All outcomes | High risk | Initial survey response rate unclear. 2 of the original 12 eligible sites were not included in the study. The proportion of children lost to follow‐up was very high (53%), and the proportion of participants lost to follow‐up in the UCT intervention group (50%) differed from that in the CCT comparison group (56%) and the control group (55%). Number of clusters and number and percentage of participants with missing values per group:
Number of missing participants for primary outcomes:
Due to the very high loss to follow‐up (53%), we judged the risk of attrition bias to be high. |
| Selective reporting (reporting bias) | Unclear risk | No study protocol identified |
| Other bias | Low risk | The economic crisis may have affected the results, but we judged this risk to be low. |
Salinas‐Rodríguez 2014.
| Study characteristics | ||
| Methods | Controlled before‐and‐after study, difference‐in‐difference linear probability model with individual fixed effect, unclear number of months in 2007 to 2009 | |
| Participants | 5465 older adults (≥ 70 years) residing in locations with ≤ 2500 residents at baseline (5270 older adults at follow‐up) interviewed twice (baseline: October 2007 to December 2007; follow‐up: November 2008 to December 2008), 516 rural locations, 7 districts, Mexico | |
| Interventions | 1 exposure group and 3 control groups
Intervention duration: unclear. Follow‐up: up to 24 months into the intervention. Intervention design: aimed to improve the living conditions among adults aged ≥ 70 years by boosting their social protection through policy mechanisms; targeted to all older adults aged ≥ 70 years (i.e. universal UCT); and provided a total amount of up to USD 960 (USD 40 per month for 24 months). |
|
| Outcomes | Primary outcome
|
|
| Notes | Intervention context: programme of the Government of Mexico called the Programa 70 y más; population coverage was 1 million in 2007, 1.8 million in 2009 and 3.9 million in 2014; unclear intervention uptake; and total programme costs of the UCT were approximately USD 595 million in 2007, USD 1.4 billion (USD 1400 million) in 2009 and USD 3.5 billion (USD 3500 million) in 2014. Funders of the study: Mexican Ministry of Social Development and International Initiative for Impact Evaluation. Potential conflict of interest: none identified | |
| Risk of bias | ||
| Bias | Authors' judgement | Support for judgement |
| Random sequence generation (selection bias) | High risk | Randomisation not ensured |
| Allocation concealment (selection bias) | Unclear risk | Allocation concealment not feasible among participants in the intervention group; unclear for control groups |
| Baseline outcome measurements similar | Low risk | Baseline health outcomes were not statistically significantly different from each other (P = 0.05) |
| Baseline characteristics similar | High risk | Groups were not well balanced at baseline, no overall test reported |
| Blinding of participants and personnel (performance bias) All outcomes | High risk | Blinding of participants not possible, and blinding of personnel unclear |
| Blinding of outcome assessment (detection bias) All subjectively measured outcomes | Low risk | No subjectively‐measured outcome in this study |
| Blinding of outcome assessment (detection bias) All objectively measured outcomes | Unclear risk | Blinding of outcome assessors unclear. Outcome is unlikely to be influenced by lack of blinding because it is objectively measured. |
| Contamination | Unclear risk | Allocation was by locality, but risk of contamination is unclear |
| Incomplete outcome data (attrition bias) All outcomes | Unclear risk | Response rate of 91% (5465 out of 6000 participants), follow‐up of 96% (5270 out of 5465 participants) and complete response of 4468 participants. Non‐response, attrition, and incomplete response not reported by group, but 2 control groups have substantially lower complete responses than the intervention group and the third control group (59.2% and 58.8% vs 89.7% and 90.2%, respectively). |
| Selective reporting (reporting bias) | Unclear risk | No study protocol found |
| Other bias | High risk | Misclassification bias of the exposure: used self‐reported receipt of a UCT collected in surveys, but we considered the risk of this bias to be low. Confounding: this study did not adjust comprehensively for all potential confounders, and it used difference‐in‐differences methods, which carry a risk of bias, if the underlying time trends differ between the exposed group and the non‐exposed group. We therefore judged the risk of confounding to be high. Reverse causation: the outcome may have impacted the exposure, but we considered the risk of this bias to be low. |
Schady 2012.
| Study characteristics | ||
| Methods | Cluster‐randomised controlled trial (3 stages: stage 1, the 6 provinces in which the UCT had not yet been implemented were non‐randomly selected; stage 2, all 77 rural parishes in the 6 provinces were randomly assigned to an intervention group and a control group; stage 3, all eligible families within the intervention were enrolled for the intervention), regression analytic methods, 57 months in 2003 to 2008. | |
| Participants | 1702 adults (aged 24 years on average) in poor households interviewed 3 times (baseline: October 2003 to March 2004; follow‐up 1: September 2005 to January 2006; follow‐up 2: May 2008 to July 2008), all women, 77 rural parishes, 6 provinces, Ecuador | |
| Interventions | 1 intervention group and 1 control group
Intervention duration: 50 to 57 months. Follow‐up: 50 to 57 months into the intervention (alternative follow‐up not reported in this review: 18/27 months into the intervention). Intervention design: aimed to reduce poverty and promote human capital investments among poor families through the provision of direct monetary transfers and incentives for households to invest in human capital (World Bank 2006); targeted to low‐income mothers of children aged 0 to 16 years; eligibility determined by a programme‐specific poverty threshold; provided a total amount of USD 750 to USD 855 in 2006 (USD 15 per month for 50/57 months; 2.7% of the annual GDP per capita); paid in‐hand every month to mothers; and fuzzy design: compliance with conditions for preventive healthcare checks and school attendance among children existed, but they were not monitored. |
|
| Outcomes | Primary outcome
|
|
| Notes | Intervention context: programme of the Government of Ecuador called the Bono de Desarrollo Humano; programme uptake was 84% of clusters in the intervention group and < 4% of clusters in the control group at follow‐up 1, and 85% of clusters in the intervention group and 48% of clusters in the control group at follow‐up 2; population coverage was approximately 40%; and unclear total programme cost of the UCT. Funder of study: none stated. Conflict of interest: none identified | |
| Risk of bias | ||
| Bias | Authors' judgement | Support for judgement |
| Random sequence generation (selection bias) | Low risk | Randomisation ensured. No baseline differences between treatment and control group in population characteristics and outcomes . |
| Allocation concealment (selection bias) | Low risk | Allocation concealment among participants unclear and among study personnel ensured (at least among enumerators) |
| Participants recruited after cluster allocation (recruitment bias in cluster‐RCTs) | High risk | Participants recruited after cluster allocation |
| Baseline outcome measurements similar | Low risk | No baseline differences (P < 0.05) between the UCT intervention group and the control group in the outcome measurement |
| Baseline characteristics similar | Low risk | No baseline differences (P < 0.05) between the UCT intervention group and the control group in population characteristics |
| Blinding of participants and personnel (performance bias) All outcomes | High risk | Blinding of participants not possible, and blinding of study personnel unclear |
| Blinding of outcome assessment (detection bias) All subjectively measured outcomes | Low risk | No subjectively measured outcome in this study |
| Blinding of outcome assessment (detection bias) All objectively measured outcomes | Low risk | Blinding of outcome assessors unclear. Outcome is unlikely to be influenced by lack of blinding because it is objectively measured. |
| Contamination | Unclear risk | No spill‐over control group was included, so the risk of contamination is unclear. |
| Incomplete outcome data (attrition bias) All outcomes | High risk | Initial survey non‐response unclear. The proportion of participants who were lost to follow‐up was large (17.7%), and the proportion of participants who were lost to follow‐up in the intervention group was similar to that in the control group. The number and percentage of clusters and participants missing in the intervention group and in the control group was unclear. The number and percentage of missing values per outcome was unclear. Considering the large proportion of participants who were lost to follow‐up, we judged the risk of attrition bias to be high. |
| Selective reporting (reporting bias) | Unclear risk | No study protocol identified |
| Other bias | Low risk | None identified |
Seidenfeld 2012.
| Study characteristics | ||
| Methods | Cluster‐randomised controlled trial (2 stages: 92 communities were randomly assigned to the intervention group and the control group; stage 2, all eligible households in the intervention group were enrolled into the UCT), difference‐in‐differences methods, 36 months during the years 2011 to 2014 | |
| Participants | 3076 households interviewed 3 times (baseline: November to December 2011; follow‐up 1: November to December 2013; follow‐up 2: November to December 2014), 92 communities, 2 districts (Luwingo and Serenje), Zambia | |
| Interventions | 1 intervention group and 1 control group
Intervention duration: 36 months. Follow‐up: 36 months. Intervention design: aimed to reduce extreme poverty and the intergenerational transfer of poverty by increasing income, education, health, food security, and livelihoods; provided a total amount of approximately USD 396 (approximately USD 11 per month for 36 months; 21.1% of the annual GDP per capita); and paid in‐hand every second month. |
|
| Outcomes | Primary outcomes
Secondary outcomes
Alternative primary outcome measures not reported in this review
|
|
| Notes | Intervention context: programme of the Government of Zambia called the Multiple Category Targeting Grant implemented through Ministry of Community Development, Mother and Child Health; unclear population coverage, programme uptake and total programme cost. Funder of study: UNICEF; Ministry of Community Development, Mother and Child Health, Zambia; United Kingdom Department for International Development, Irish Aid, and Palm Associates. Conflict of interest: none identified | |
| Risk of bias | ||
| Bias | Authors' judgement | Support for judgement |
| Random sequence generation (selection bias) | Unclear risk | Unclear how the random sequence was generated |
| Allocation concealment (selection bias) | Low risk | Allocation was by public lottery and therefore protected |
| Participants recruited after cluster allocation (recruitment bias in cluster‐RCTs) | Low risk | Participants were recruited before clusters were allocated |
| Baseline outcome measurements similar | High risk | For the outcome of level of depression, baseline measurements are reported, and no statistically significant differences were found between treatment group and control group (low risk of bias). For the other two included primary outcomes, baseline measurements are not reported, and we cannot be certain that no differences existed (high risk of bias). |
| Baseline characteristics similar | Low risk | Baseline differences in characteristics were reported, and no statistically significant differences were found between treatment group and control group |
| Blinding of participants and personnel (performance bias) All outcomes | High risk | Blinding of participants not possible, and blinding of study personnel unclear |
| Blinding of outcome assessment (detection bias) All subjectively measured outcomes | Unclear risk | Blinding of outcome assessors unclear |
| Blinding of outcome assessment (detection bias) All objectively measured outcomes | Low risk | No objectively‐measured outcome in this study |
| Contamination | Unclear risk | No data or analyses are reported that would allow an assessment of risk of contamination |
| Incomplete outcome data (attrition bias) All outcomes | Unclear risk | Survey non‐responses were unclear; loss to follow‐up was low (4%) and non‐differential between treatment and control groups. Item non‐response rates were unclear. |
| Selective reporting (reporting bias) | Unclear risk | No study protocol identified |
| Other bias | Low risk | None identified |
Seidenfeld 2013.
| Study characteristics | ||
| Methods | Cluster‐randomised controlled trial (2 stages: stage 1, 90 communities were randomly assigned to the intervention group and the control group; stage 2, all eligible households in the intervention group were immediately enrolled into the UCT after having a newborn baby), difference‐in‐differences methods, 33 months during the years 2010 to 2013 | |
| Participants | 2515 households with one or more children (aged < 3 years) interviewed 4 times (baseline: October 2010 to November 2010; follow‐up 1: October 2012 to November 2012; follow‐up 2: June 2013 to July 2013, follow‐up 3: September to October 2014), 90 communities, 3 districts (Kalabo, Shangombo and Kaputa), Zambia | |
| Interventions | 1 intervention group and 1 control group
Intervention duration: 48 months. Follow‐up: 24 months (for all primary outcomes and most secondary outcomes), 30 months (for some secondary outcomes) or 48 months (for one primary outcome; namely, moderate stunting). Intervention design: aimed to reduce extreme poverty and the intergenerational transfer of poverty by increasing food security, young child nutrition and health, and education for school‐age children, as well as by strengthening livelihoods; provided a total amount of approximately USD 360 (approximately USD 12 per month for 30 months; 4.3% of the annual GDP per capita); and paid in‐hand every second month. |
|
| Outcomes | Primary outcomes
Secondary outcomes
Alternative primary outcome measures not reported in this review
|
|
| Notes | Intervention context: programme of the Government of Zambia called the Zambian Child Grant Program, implemented through Ministry of Community Development, Mother and Child Health; unclear population coverage, programme uptake and total programme cost. Funder of study: United Nations Children Fund, Zambian Ministry of Community Development, Mother and Child Health, United Kingdom Department for International Development, Irish Aid, and Palm Associates. Conflict of interest: none identified | |
| Risk of bias | ||
| Bias | Authors' judgement | Support for judgement |
| Random sequence generation (selection bias) | Low risk | Randomisation ensured (coin flip). No baseline differences between treatment and control group in outcomes and population characteristics . |
| Allocation concealment (selection bias) | Unclear risk | Allocation concealment among participants and study personnel unclear |
| Participants recruited after cluster allocation (recruitment bias in cluster‐RCTs) | Unclear risk | Unclear whether participants recruited after cluster allocation |
| Baseline outcome measurements similar | Low risk | No baseline differences (P < 0.05) between the UCT intervention group and the control group in the outcome measurements |
| Baseline characteristics similar | Low risk | No baseline differences (P < 0.05) between the UCT intervention group and the control group in population characteristics |
| Blinding of participants and personnel (performance bias) All outcomes | High risk | Blinding of participants not possible, and blinding of personnel unclear |
| Blinding of outcome assessment (detection bias) All subjectively measured outcomes | High risk | Outcome assessors not blinded |
| Blinding of outcome assessment (detection bias) All objectively measured outcomes | Low risk | Outcome assessors not blinded. Outcome is unlikely to be influenced by lack of blinding because it is objectively measured |
| Contamination | Unclear risk | No spill‐over control group was included, so the risk of contamination is unclear. |
| Incomplete outcome data (attrition bias) All outcomes | Unclear risk | Survey non‐response rates were unclear. The proportion of participants lost to follow‐up was low (9%), and the proportion of participants lost to follow‐up among the UCT intervention group was similar to that among the control group. The number and percentage of missing communities and households and the percentage of missing values per outcome were unclear. We are unable to judge the risk of attrition bias. |
| Selective reporting (reporting bias) | Unclear risk | No study protocol identified |
| Other bias | Low risk | None identified |
Smith 2017.
| Study characteristics | ||
| Methods | Replication study of Baird 2010: cluster‐randomised controlled trial (3 stages: first stage, enumeration areas were divided into 3 strata of geographic residency (i.e. within city, within 16 km radius of city, and far rural); second stage, enumeration areas were sampled for each strata (i.e. 29, 119, and 28, respectively); third stage, never‐married females aged 13 to 22 years were randomly sampled from a list of all females within each strata), intention‐to‐treat analysis, difference‐in‐differences and regression analytic methods, 32 months in 2007 to 2010 | |
| Participants | 3896 children or young adults (aged 13 to 22 years) who were never married (split into 2907 in school and 889 out of school/dropouts), interviewed 3 times (baseline: October 2007 to January 2008; follow‐up 1: October 2008 to February 2009; follow‐up 2: February to June 2010), all girls or young women, 176 enumeration areas, Zomba district, Malawi | |
| Interventions | Girls and young women in school at baseline 2 intervention groups and 3 control groups
Girls and young women out of school/dropouts at baseline 1 intervention group and 1 control group
Intervention duration: 24 months. Follow‐up: 12 months into the intervention (alternative follow‐up not reported in this review: 2 to 6 months after 24 months of the intervention). Intervention design: aimed to determine the effectiveness of UCT and CCT (in the baseline school girls group); UCT targeted to never married girls or young women aged 13 to 22 years from poor households; UCT provided a total amount of USD 96, USD 144, USD 192 or USD 240 to parents randomly by enumeration area so that all parents in the same enumeration area received the same amount (USD 4, USD 6, USD 8 or USD 10 per month for 24 months; approximately 8.4%, 12.5%, 16.7% or 20.9% of the annual GDP per capita) and USD 24, USD 48, USD 72, USD 96 or USD 120 to girls or young women randomly by individual through an open public lottery, so that different girls and young women within the same enumeration area received different amounts (USD 1, USD 2, USD 3, USD 4 or USD 5 per month for 24 months; approximately 2.1%, 4.2%, 6.3%, 8.4% or 10.5% of the annual GDP per capita), and an amount equivalent to the average annual amount given to the CCT intervention group towards school fees; paid in‐hand each month; CCT provided the same total amounts as the UCT to parents and girls using the same randomisation procedures; co‐intervention for CCT: school fees were paid directly to the school for girls and young women enrolled in school; the CCT was conditional on regular school attendance (i.e. 80% or more of all school days attended); adherence with the condition was monitored, and non‐adherence was punished (i.e. the CCT for the following month was withheld). |
|
| Outcomes | Alternative primary outcome measures not reported in this review (prioritised measure from same data used from Baird 2010)
|
|
| Notes | Intervention context: experiment by research organisations (the National Bureau of Economic Research), but also appears to be a programme of the Government of Malawi called the Zomba Cash Transfer; unclear who implemented the experiment; unclear population coverage, intervention uptake, and total programme costs. Funder of the study: International Initiative for Impact Evaluation. Conflict of interest: none identified. | |
| Risk of bias | ||
| Bias | Authors' judgement | Support for judgement |
| Random sequence generation (selection bias) | Low risk | Randomisation was ensured |
| Allocation concealment (selection bias) | Low risk | Allocation was by public lottery and therefore protected |
| Participants recruited after cluster allocation (recruitment bias in cluster‐RCTs) | Low risk | Participants were recruited before clusters were allocated |
| Baseline outcome measurements similar | Low risk | No baseline differences (P < 0.05) reported between the UCT intervention group and the control groups (all 3 control groups among school girls pooled) in one outcome measurement (has had any illness). No baseline data reported that could be used to test for baseline differences between the UCT intervention group and the control groups in one outcome measurement (number of days had eaten protein‐rich food). No baseline differences reported between the UCT intervention group and the CCT comparison group in any of the outcome measurements. However, all baseline differences in outcomes measurements appear to have been comprehensively adjusted for using regression analytic methods. |
| Baseline characteristics similar | Low risk | Baseline differences (P < 0.05) reported between the UCT intervention group and the control groups (all 3 control groups pooled) in 5 characteristics: the highest grade attended by respondents in the UCT intervention group was higher than that in the control groups (7.90 compared with 7.48, P < 0.05); the proportion of participants in female‐headed households in the UCT intervention group was lower than that in the control group (24% compared with 32%, no test reported); the proportion of participants in households that owned a radio in the UCT intervention group was higher than in the control groups (65% compared with 59%, no test reported); the proportion of participants in households that owned a television in the UCT intervention group was higher than in the control groups (34% compared with 24%, no test reported); the proportion of participants who had piped water available in their dwelling in the UCT intervention group was higher than that in the control groups (60% compared with 47%, no test reported). Baseline differences (P < 0.05) also reported between the UCT intervention group and the CCT comparison group in 2 characteristics: the age in the UCT intervention group was higher than in the CCT comparison group (15.43 compared with 14.95, P < 0.01); the highest grade attended by respondents in the UCT intervention group was higher than that in the CCT comparison group (7.90 compared with 7.25, P < 0.01). However, all baseline differences in characteristics appear to have been comprehensively adjusted for using regression analytic methods. |
| Blinding of participants and personnel (performance bias) All outcomes | High risk | Blinding of participants was not possible, and blinding of personnel was unclear. Qualitative interviews conducted as part of the study suggested that the UCT intervention group was aware of the existence of a CCT comparison group and that the purpose of the cash transfer programme was to improve education. We therefore considered the risk of performance bias to be high. |
| Blinding of outcome assessment (detection bias) All subjectively measured outcomes | Unclear risk | Blinding for subjectively‐measured outcomes was unclear |
| Blinding of outcome assessment (detection bias) All objectively measured outcomes | Low risk | There were no objectively‐measured outcomes in this study |
| Contamination | Low risk | Allocation was by community and the study assessed, but we did not find any evidence of contamination |
| Incomplete outcome data (attrition bias) All outcomes | Low risk | Initial survey non‐response was low (6%). Attrition rate was moderate (10%) and did not differ between the intervention group and the control groups. One area was lost amongst the baseline school girls for an unclear reason. For each group, the number of missing clusters and number and percentage of missing participants were: Girls and young women in school at baseline: 2 intervention groups and 3 control groups
Girls and young women out of school/dropouts at baseline: 1 intervention group and 1 control group
The number of missing participants per outcome was unclear. |
| Selective reporting (reporting bias) | Unclear risk | The study pre‐published a replication plan, but we could not access the plan from the link provided in the study record (http://3ieimpact.org/media/ filer_public/2016/04/09/smith‐revised‐replication‐plan.pdf.) |
| Other bias | Low risk | None identified |
Tiwari 2019.
| Study characteristics | ||
| Methods | Controlled before‐and‐after study, difference‐in‐differences methods with propensity‐score matching, 93 months in 2000 to 2008 | |
| Participants | 8586 households interviewed in two waves of the Indonesian Family Life Survey (before: June to November 2000; after: November 2007 to May 2008), 13 provinces, Indonesia | |
| Interventions | 1 exposed group and 1 unexposed group
Duration: 10 months. Follow‐up: 25 to 29 months after 10 months of the intervention. Intervention design: aimed to prevent poor households from having to reduce expenditures on essential commodities, health, and education during strong national inflation; targeted to poor, disadvantaged households (but targeting was poorly implemented, with many non‐poor households receiving the UCT and many poor households not receiving it); provided a total amount of USD 120 (USD 30 every 3 months for 12 months; approximately 2.0% of the annual GDP per capita); paid mainly in‐hand at a post office; and fuzzy design: minor messaging that UCT receipt may be conditional on reported level of household welfare. |
|
| Outcomes | Primary outcomes
Alternative primary outcome measures not reported in this review
|
|
| Notes | Intervention context: the Direct Cash Transfer Program, implemented by the Government of Indonesia predominantly through village officials; programme uptake 100%; population coverage over 19 million households; and programme costs between October 2005 and September 2006 approximately USD 380 million (Bazzi 2012). Funder of the study: unclear. Conflict of interest: none identified | |
| Risk of bias | ||
| Bias | Authors' judgement | Support for judgement |
| Random sequence generation (selection bias) | High risk | Participants were allocated to the intervention based on pre‐specified targeting criteria through a combination of community‐based targeting and means testing, but targeting criteria were inconsistently applied |
| Allocation concealment (selection bias) | Unclear risk | It is unclear if allocation was concealed |
| Baseline outcome measurements similar | Low risk | The baseline measurements for intervention group and control group were similar |
| Baseline characteristics similar | High risk | Baseline characteristics differed (P < 0.05) for 22 of 26 population characteristics of the household head and the household between intervention group and control group. |
| Blinding of participants and personnel (performance bias) All outcomes | Low risk | The participants were not allocated to the intervention by the researchers. A secondary analysis was conducted of survey data collected for a different purpose than estimating the effect of the UCT on health services use and health outcomes. Therefore, blinding of outcome assessors was neither feasible nor necessary. |
| Blinding of outcome assessment (detection bias) All subjectively measured outcomes | Unclear risk | Blinding of outcome assessors was unclear |
| Blinding of outcome assessment (detection bias) All objectively measured outcomes | Low risk | No objectively‐measured outcomes in this study |
| Contamination | High risk | Contamination occurred as a result of mistargeting |
| Incomplete outcome data (attrition bias) All outcomes | Unclear risk | Initial survey non‐response was unclear. A balanced panel was created for analysis. The proportion of participants lost to follow‐up was unclear. The study found no evidence for differences in outcome measurements between attriters and non‐attriters (see Table A1 in the study record's appendix). The numbers and percentages of missing households and missing values per outcome were unclear. |
| Selective reporting (reporting bias) | Unclear risk | We did not identify a study protocol |
| Other bias | Low risk | Misclassification bias of the exposure: it seems that self‐reported receipt of a UCT was collected in a survey, but we considered the risk of this introducing bias to be low. Confounding: this study adjusted for several potential time‐invariant and time‐varying confounding variables through propensity‐score matching. We judged this to carry a low risk of confounding. Reverse causation: the outcome may perhaps have impacted the exposure, but we considered the risk of this bias to be low. |
Wang 2019.
| Study characteristics | ||
| Methods | Replication study of Haushofer 2013: cluster‐randomised controlled trial (3 stages: first stage, villages were randomly selected; second stage, eligible households were randomly assigned to intervention group or control group; third stage, either the female or male head of the assigned household was randomly assigned to intervention group or control group), regression analytic methods, 19 months in 2011 to 2012 | |
| Participants | 1440 poor (i.e. without a thatch roof) households in rural areas, 2140 primary household members and 1203 children (aged < 5 years) interviewed twice (baseline: May to November 2011; follow‐up: September to December 2012), 62 villages, Rarieda region, Kenya | |
| Interventions | 2 intervention groups and 2 control groups
Intervention duration: 9 months (for the included UCT intervention). Follow‐up: 7 to 9 months into the intervention and up to 10 months after 9 months of intervention. Intervention design: aimed to alleviate poverty among poor households; in both intervention groups, the UCT was stratified into random assignment of either a small or large cash amount; provided a total amount of USD 404 for the small UCT (approximately USD 4.89 per month for 9 months; or approximately 14.3% of the annualised purchasing power parity (PPP)‐adjusted, per‐capita GDP) and USD 1516 for the large UCT (USD 168.44 per month for 9 months; approximately 53.8% of the annual GDP per capita); provided via mobile money service; and minor co‐intervention: participants were provided with a SIM card for their cell phone. |
|
| Outcomes | Alternative primary outcome measures not reported in this review (prioritised measure from same data used from Haushofer 2013)
|
|
| Notes | Intervention context: experiment implemented by a nongovernmental organisation (GiveDirectly); unclear programme uptake, population coverage and total programme cost of the UCT. Funder of study: International Initiative for Impact Evaluation. Potential conflict of interest: none identified. Pairing of studies: Haushofer 2013 was replicated by Wang 2019 (pure replication study), and we prioritised the original included study, but considered the replication study's findings when we assessed risk of bias. | |
| Risk of bias | ||
| Bias | Authors' judgement | Support for judgement |
| Random sequence generation (selection bias) | Low risk | Randomisation ensured |
| Allocation concealment (selection bias) | Low risk | Allocation concealment among participants unclear and among study personnel ensured |
| Participants recruited after cluster allocation (recruitment bias in cluster‐RCTs) | Low risk | Participants recruited after cluster allocation, but they were randomly assigned to intervention or control group |
| Baseline outcome measurements similar | Unclear risk | The study replicated the analyses from the original study (Haushofer 2013), and also found no statistically significant differences in outcome measures between the intervention groups (combined) and the control groups (combined) (see Table 1 in Wang 2019). We found a significant baseline difference across index variables when comparing male to female recipients of the UCTs (P = 0.02). |
| Baseline characteristics similar | Low risk | No baseline differences (P < 0.05) were observed comparing the baseline characteristics between the UCT intervention groups (combined) and the control group included in this review |
| Blinding of participants and personnel (performance bias) All outcomes | High risk | Blinding of participants not possible, and blinding of personnel unclear |
| Blinding of outcome assessment (detection bias) All subjectively measured outcomes | High risk | Outcome assessors not blinded |
| Blinding of outcome assessment (detection bias) All objectively measured outcomes | Low risk | Outcome assessors not blinded. Outcome is unlikely to be influenced by lack of blinding because it is objectively measured. |
| Contamination | Unclear risk | This study tested for spill‐over effects, and it did not find any evidence for contamination for the outcomes included in this review. |
| Incomplete outcome data (attrition bias) All outcomes | Low risk | Initial survey response unclear. Attrition low (7%) and non‐differential between treatment and control groups and by outcomes. No significant (P < 0.05) baseline differences observed in index variables between people lost to follow‐up and those remaining in the study. The number and percentage of missing values per UCT intervention group and control group and for each of the outcomes is unclear. |
| Selective reporting (reporting bias) | Unclear risk | The study pre‐published a replication plan, but we could not access the plan from the link provided in the study record (http://www.3ieimpact.org/media/filer_public/2017/06/30/wang_revised_replication_plan.pdf) |
| Other bias | Low risk | None identified |
Ward 2010.
| Study characteristics | ||
| Methods | Cluster‐randomised controlled trial (3 stages: stage 1, 4 locations in each of 7 districts were selected; stage 2, 2 locations each were randomly assigned to the intervention group and the control group; stage 3, households receiving the UCT were randomly selected from a list supplied by the UCT programme and other households were randomly selected from a household listing undertaken in a random sample of census enumeration areas), difference‐in‐differences methods, 28 months in 2007 to 2009 | |
| Participants | 9231 children (0 to 17 years) in households with orphans or vulnerable (i.e. chronically ill or with a chronically ill caregiver) children interviewed twice (baseline: March 2007 to August 2007; follow‐up 1: March 2009 to July 2009; follow‐up 2: unclear month(s) 2011), 28 locations, 7 districts, Kenya | |
| Interventions | 1 intervention group and 3 control groups
Intervention duration: 24 months. Follow‐up: 24 months. Intervention design: aimed to provide a social protection system through regular and predictable cash transfers to families living with orphans or vulnerable children in order to encourage fostering and retention of orphans or vulnerable children within their families and communities, and to promote their human capital development; targeted to poor households with one or more non‐welfare (i.e. not receiving any other cash transfers) orphans or vulnerable children; eligibility determined through screening geographically, by a community committee and a survey; provided a total amount of approximately USD 352.80 (USD 14.70 per month for 24 months; 29.6% of the annual GDP per capita); paid in‐hand every second month; and fuzzy design: the cash transfer was conditional on attendance of a health facility for immunisations among children aged 0 to 1 year, growth monitoring and vitamin supplements among children aged 0 to 5 years, school enrolment among children aged 6 to 18 years and attendance of awareness sessions among adult parents or caregivers, but non‐compliance was not penalised in 4 out of 7 clusters. |
|
| Outcomes | Primary outcomes
Secondary outcomes
|
|
| Notes | Intervention context: pilot programme of the Government of Kenya called the Cash Transfer Programme for Orphans and Vulnerable Children; implemented through Ministry of Gender, Children and Social Development; population coverage was approximately 15,000 recipients in July 2009; programme uptake was 97% among initial recipients (i.e. 3% of recipients dropped out of the programme); and the total programme cost of the UCT was USD 9.96 million in the 7 pilot districts between July 2006 and June 2009. Funder of studies: United Nations Children's Fund, Government of Kenya and United Kingdom Department for International Development. Conflict of interest: none identified | |
| Risk of bias | ||
| Bias | Authors' judgement | Support for judgement |
| Random sequence generation (selection bias) | Unclear risk | Random sequence generation unclear |
| Allocation concealment (selection bias) | Low risk | Allocation concealment among participants and study personnel unclear |
| Participants recruited after cluster allocation (recruitment bias in cluster‐RCTs) | High risk | Participants recruited after cluster allocation |
| Baseline outcome measurements similar | Low risk | No baseline differences (P < 0.05) between the UCT intervention group and the control group in the outcome measurements |
| Baseline characteristics similar | High risk | Baseline differences (P < 0.05) between the UCT intervention group and the control group in 4 characteristics outcome measurements: there were differences in the proportion of participants who were male (0.55 compared with 0.52, P < 0.05), whose mother was dead (0.44 compared with 0.30, P < 0.05), and whose mother is a caregiver (0.44 vs. 0.61, P < 0.01), as well as the age of the participants' caregiver (48.7 compared with 40.8, P < 0.01). |
| Blinding of participants and personnel (performance bias) All outcomes | High risk | Blinding of participants not possible, and blinding of personnel unclear |
| Blinding of outcome assessment (detection bias) All subjectively measured outcomes | High risk | Outcome assessors not blinded |
| Blinding of outcome assessment (detection bias) All objectively measured outcomes | Low risk | Outcome assessors not blinded. Outcome is unlikely to be influenced by lack of blinding because it is objectively measured. |
| Contamination | Low risk | 4% of households in the UCT intervention group did not meet the eligibility criteria, with 3% of households containing no orphan or vulnerable child and 1% not being poor. |
| Incomplete outcome data (attrition bias) All outcomes | High risk | Initial survey non‐response was high (13%). The proportion of participants lost to follow‐up was large (18%); the proportion of participants lost to follow‐up in the intervention group (14%) was smaller than that in the control group (24%; statistical significance not tested). Attrition in the intervention group and in the control group differed by several population characteristics, including by location. The number and percentage of missing communities and households and the percentage of missing values per outcome were unclear. |
| Selective reporting (reporting bias) | Unclear risk | Study protocol identified, but we were unable to locate a copy of it |
| Other bias | Low risk | Intervention occurred during a phase of post‐election violence, which may have impacted the intervention's effectiveness. |
CCT: conditional cash transfer; CESD: Centre for Epidemiological Studies Depression Scale; GDP: gross domestic product; SD: standard deviation; UCT: unconditional cash transfer; VCT: voluntary counselling and (HIV) testing
Characteristics of excluded studies [ordered by study ID]
| Study | Reason for exclusion |
|---|---|
| Aguila 2017 | Ineligible comparator |
| Akee 2013 | No eligible study population studied |
| Aker 2013 | UCT for assistance in humanitarian disasters studied (see Pega 2015a for systematic review of this type of UCT) |
| Attanasio 2015 | No eligible UCT studied |
| Ayuku 2013 | No eligible UCT studied |
| Benedetti 2016 | No eligible UCT studied |
| Benhassine 2013 | No eligible outcome reported |
| Buller 2016 | No eligible UCT studied |
| Buser 2014 | Ineligible study type used |
| Cluver 2013 | No eligible UCT studied |
| Doocey 2017 | UCT for assistance in humanitarian disasters studied |
| Fenn 2017 | UCT for assistance in humanitarian disasters studied |
| Galárraga 2014 | No eligible UCT studied |
| Gangophadyay 2015 | Ineligible comparator |
| Han 2020 | No eligible outcome reported |
| Haushofer 2020 | No eligible UCT studied |
| Heath 2020 | No eligible outcome reported |
| Hidrobo 2013 | No eligible outcome reported |
| Hoddinott 2018 | Ineligible study type used |
| Kenya CT‐OVC Evaluation Team 2012 | No eligible outcome reported |
| Kilburn 2016 | Ineligible study type used |
| McIntosh 2020 | No eligible UCT studied |
| Ndlovu 2013 | No eligible outcome reported |
| Pereznieto 2014 | Ineligible study type used |
| Pratinidhi 2014 | Ineligible study type used |
| Rocha 2013 | No eligible UCT studied |
| Sabates‐Wheeler 2018 | Ineligible study type used |
| Seidenfeld 2011 | Inelible study type used |
| Skoufias 2013 | No eligible outcome reported |
| Tonguet‐Papucci 2017 | UCT for assistance in humanitarian disasters studied |
UCT: unconditional cash transfer
Characteristics of studies awaiting classification [ordered by study ID]
Aguila 2020.
| Methods | Randomised controlled trial |
| Participants | Unclear, Mexico |
| Interventions | UCT |
| Outcomes | Health services use, food security, depression |
| Notes | — |
Banarjee 2020.
| Methods | Cluster‐randomised controlled trial |
| Participants | 33,600 participants, Kenya |
| Interventions | UCT (universal basic income intervention) |
| Outcomes | Health services use, disease or illness, food security, depression |
| Notes | — |
Chen 2019.
| Methods | Cohort study |
| Participants | 8636 participants, People's Republic of China |
| Interventions | UCT |
| Outcomes | Depression |
| Notes | — |
Davis 2016.
| Methods | Cluster‐randomised controlled trials or cohort studies |
| Participants | Various |
| Interventions | Unconditional cash transfers (Cash Transfer Program for Orphans and Vulnerable Children, Kenya; Child Grants Programme, Lesotho; Child Support Grant, South Africa; Harmonised Social Cash Transfer Programme, Zimbabwe; Social Cash Transfer Programme, Malawi; Social Cash Transfer Programme, Zambia; and Tigray Pilot Social Cash Transfer Programme, Ethiopia) |
| Outcomes | Health services use, anthropometric measures, disease or illness, food security, dietary diversity, mental health |
| Notes | — |
De Groot 2021.
| Methods | Cluster‐randomised controlled trial |
| Participants | Unclear, Lesotho |
| Interventions | UCT |
| Outcomes | Health services use, food security |
| Notes | — |
Haushofer 2018.
| Methods | Cluster‐randomised controlled trial |
| Participants | 1440 households, Kenya |
| Interventions | UCT |
| Outcomes | Disease prevalence, food security, dietary diversity, depression |
| Notes | — |
Haushofer 2021.
| Methods | Cluster‐randomised controlled trial |
| Participants | 5756 households, Kenya |
| Interventions | UCT |
| Outcomes | Food security |
| Notes | — |
Ma 2020.
| Methods | Cohort study |
| Participants | Unclear, China |
| Interventions | UCT |
| Outcomes | Disease or illness |
| Notes | — |
Ohrnberger 2020.
| Methods | Cohort study |
| Participants | 4535 participants, South Africa |
| Interventions | UCT |
| Outcomes | Depression |
| Notes | This is likely an additional study record of the included study Ohrnberger 2019. |
Oxford Policy Management, Makarere University 2013.
| Methods | Controlled before‐and‐after study |
| Participants | Unclear number of households, Uganda |
| Interventions | UCT |
| Outcomes | Stunting, disease or illness, food security, dietary diversity |
| Notes | — |
Shangani 2017.
| Methods | Cohort study |
| Participants | 655 participants, Kenya |
| Interventions | UCT |
| Outcomes | Depression |
| Notes | — |
Zheng 2020.
| Methods | Unclear |
| Participants | Unclear, China |
| Interventions | UCT |
| Outcomes | Dietary diversity |
| Notes | — |
Differences between protocol and review
There are the following differences between the protocol and the review.
Background: updated to reflect the most recent state of evidence.
Types of studies: added that if a study compared a UCT with both no UCT and with a smaller amount of UCT, then we prioritised comparisons with the group who received no UCT over those receiving a smaller amount of the UCT. The comparison with no intervention is more consistent with the objectives of the review of evaluating intervention effectiveness, because receipt of any UCT may be more important for health effects than the amount of a UCT received (Baird 2011; Filmer 2011).
Types of studies: added that instrumental variable analytic studies that used instruments for a UCT to estimate the effect of the UCT on health were included in the systematic review.
Types of studies: added that an original study was prioritised over its (pure) replication study, as long as the original study had collected the data both studies analysed.
Types of interventions: refined the definition of UCTs by excluding vouchers. Unlike cash transfers, transfers via vouchers restrict their recipients' ability to spend the additional income, for example, by requiring recipients to only purchase certain goods and services from certain suppliers. Therefore, voucher transfers may impact health differently from genuine cash transfers, and may potentially act through different pathways.
Types of interventions: refined the definition of UCTs by including payments via mobile phone, because these electronic payments may have another health effect than in‐hand cash payments.
Types of interventions: changed the inclusion/exclusion criteria for UCTs with co‐intervention. In the protocol, we excluded all UCTs with one or more co‐interventions. In the review, we excluded UCTs with major co‐interventions and included UCTs with minor co‐interventions (defined as interventions that we anticipated to very likely be of relatively low or no impact, such as a minor educational co‐intervention or very small once‐off payment). We now believe that minor co‐interventions, which are commonly provided alongside or in combination with UCTs, do not constitute a threat to causal inference.
Types of interventions: changed the inclusion/exclusion of fuzzy UCTs. In the protocol, we included fuzzy UCTs if their intention was to be unconditional, and excluded (but noted) UCTs with any de facto conditions. In the review, we included fuzzy UCTs that were in practice unconditional, regardless of intention, and we excluded fuzzy UCTs with de facto conditions (e.g. major administrative linking of the cash transfer or major messaging around the cash transfer). We now believe that what matters for effects on use of health services and health outcomes is likely more the actual, experienced conditionality of the cash transfer, rather than the cash transfer's design as such.
Types of outcomes measures: added criteria around selection of time points to be reported to ensure a systematic and consistent approach.
Types of outcomes measures: refined morbidity outcomes included in the review to more specifically identify the most important health outcomes.
Types of outcomes measures: refined the criteria for prioritising the types of outcomes measures to ensure prioritisation of the most relevant measures.
Types of outcomes: made explicit which included primary outcome were the seven prioritised ones.
Types of participants: in our protocol, we put the division between a child and an adult at 14 years. In the review, we put this division at 17 years. We now believe that children are more commonly defined as people under the age of 18 years, and that adults are more commonly defined as people aged 18 years or older.
Search: added handsearches of previous reviews in the field as a search source.
Search: did not search the Global Health, Web of Science database as planned.
Search: searched slightly different time ranges for: Embase: 1974 to 10 May 2017; CINAHL: 1981 to 08 September 2021; PsycINFO: 1920 to 08 September 2021; MEDLINE: 1946 to Present, plus Daily Update through 08 September 2021; Social Sciences Citation Index: 1900 to 08 September 2021; Academic Search Premier: 1975 to 5 May 2017; Business Source Complete: 1886 to 8 September 2021; EconLit: 1886 to 08 September 2021; and Sociological Abstracts: 1952 to 08 September 2021.
Search: in the protocol, we did not specify the number of hits from searches of grey literature databases we would screen for eligible records. But in the review and the update, we only screened the first 100 hits in grey literature database searches that exceeded 500 hits, after ordering hits for relevance, if possible. The reason was that some grey literature database searches returned very large numbers of hits, and it was not feasible to screen all of these hits.
Search: also searched the websites of two additional organisations (i.e. the Cash Transfer Projects in Humanitarian Aid and Save the Children).
Updated search: did not search the Academic Search Premier, ProQuest Dissertations & Theses Database, and OpenDOAR databases, because the information specialist who conducted the searches did not have access to these.
Updated search: in the protocol, we planned to handsearch the three journals with the largest number of included studies, but in the systematic review we searched the five journals with the largest number of studies, because the third largest number of included studies was achieved by three journals.
Updated search: did not again contact additional experts for advice.
Updated search: did not again convene the review advisory group and ask the group to check included studies.
Assessment of risk of bias in included studies: if the review had included interrupted time series studies, to assess risk of bias in interrupted time series studies, we would have used the Cochrane Effective Practice and Organisation of Care's risk of bias criteria (EPOC 2012), plus an item assessing the risk of bias from confounding. Had the review included cohort studies, in the absence of credible standard tools for assessing risk of bias, we would have, at a minimum, assessed the risk of bias from sampling; low response rates; attrition; exposure measurement; outcome measurement; confounding; and reverse causation (as in our previous reviews: Pega 2013; Pega 2015a, and in the original systematic review: Pega 2017).
Assessment of risk of bias: in the protocol, we planned to require all authors to agree on any discrepancy in risk of bias assessment. In this review, we resolved disputes between two review authors through a third author.
Measures of treatment effect: added a framework for selecting between multiple models of adjustment to ensure a systematic and consistent approach.
Measures of treatment effect: added prioritisation of estimates of the effect of being eligible for or receiving the UCT over estimates of the effect of the specific dollar amount of the UCT that the recipient was eligible for or received. The reason was that we assume that the former treatment effect measures are more relevant than the latter for intervention effectiveness.
Unit of analysis issues: in the protocol, we planned to request individual participant data for re‐analysis for cluster‐RCTs that did not adjust for clustering in their analysis and to exclude any studies for which individual data were not available. In the review, we requested adjusted data from the primary study authors. The reason is that it was not feasible to obtain individual‐level data for all studies whose study records only provided effect estimates unadjusted for clustering, but we were able to obtain the cluster‐adjusted effect estimates for all these studies.
Meta‐analysis: refined and added criteria for combining studies in meta‐analysis for the purpose of ensuring consistent rules being applied on unanticipated issues, such as the question of whether or not to meta‐analyse subgroups from the same study.
Updated data synthesis: as per the new Cochrane Handbook (McKenzie 2020), we added that if we could not meta‐analyse studies that reported the same outcome due to incomplete or incompatible required statistical data, we synthesised those results using vote counting based on the direction of effect and displayed the results using effect direction plots.
Updated data synthesis: added an overview of synthesis and included studies table.
Updated data synthesis: added use of an effect direction plot.
Updated data synthesis: used RevMan 5.4, rather than RevMan 5.2.
Subgroup analyses: if subgroup analyses had been feasible, we would have conducted such analyses by: age (children aged 0 to 17 years), adults (18 years or older); level of income (e.g. total personal or household annual income after tax); and WHO region (Africa, Americas, Eastern Mediterranean, Europe, South‐East Asia and Western Pacific).
Contributions of authors
Original systematic review (Pega 2017): Pega conceived of the review. Pega led and all authors contributed to the protocol development. Bain and Pega searched the electronic and grey literature databases. Pega led and Liu, Pabayo and Walter contributed to searches of key organisational websites. Walter and Pega led and all authors contributed to screening of records identified in the searches. Pega led and Henning, Paeck and all authors contributed to the data extraction. Pega led and all authors contributed to the certainty of evidence assessment of included studies, analysis and interpretation of data, and writing of the review.
This update of the systematic review: Pega conceived of the update. The Cochrane Public Health Information Specialist conducted the update searches of the electronic academic databases. Lee updated the searches of the grey literature databases, search engines and organisational websites, and the handsearches. Pega led and all authors contributed to screening of records identified in the searches. Pega led and Pabayo, Benny, Lee and Liu contributed to the data extraction and risk of bias assessment of included studies. Pega led and all authors contributed to the certainty of evidence assessment of included studies, analysis and interpretation of data. Pega wrote the updated review, and all other authors contributed comments and revisions.
Sources of support
Internal sources
-
Montclair State University, USA
Montclair State University provided salary funding to Liu.
-
Queen’s University, Canada
Queen's University provided salary funding to Lee.
-
University of Alberta, Canada
The University of Alberta provided salary funding to Pabayo.
-
University of Otago, New Zealand
The University of Otago provided an honorary research fellowship to Pega and salary funding to Fauchelle and Cho.
External sources
No sources of support provided
Declarations of interest
Pega: none known. Frank Pega is a technical officer for the World Health Organization but was an honorary research fellow for the University of Otago at the time of writing.
Pabayo: none known.
Benny: none known.
Lee: none known.
Lhachimi: none known.
Liu: none known.
New search for studies and content updated (conclusions changed)
References
References to studies included in this review
Abdoulayi 2014 {published data only}
- Abdoulayi S, Angeles G, Barrington C, Brugh K, Handa S, Hill MJ, et al.Malawi Social Cash Transfer Program: Baseline Evaluation Report. Chapel Hill (NC): University of North Carolina, 2014. [Google Scholar]
- Abdoulayi S, Angeles G, Barrington C, Brugh K, Handa S, Kilburn K, et al.Malawi Social Cash Transfer Program: Midline Impact Evaluation Report. Chapel Hill (NC): University of North Carolina, 2015. [Google Scholar]
- Brugh K, Angeles G, Mvula P, Tsoka M, Handa S.Impacts of the Malawi social cash transfer program on household food and nutrition security. Food Policy 2018;76:19-32. [Google Scholar]
- Brugh KN.Impacts of an Unconditional Cash Transfer on Household Food and Nutrition Security and Child Health in Malawi [PhD thesis]. Chapel Hill (NC): University of North Carolina, 2016. [Google Scholar]
- Kilburn K, Handa S, Angeles G, Tsoka M, Mvula P.Paying for happiness: experimental results from a large cash transfer program in Malawi. Journal of Policy Analysis and Management 2018;37(2):331-56. [DOI] [PMC free article] [PubMed] [Google Scholar]
- Kilburn K.Cash Transfers, Behavioral Change, and Child Development: Experimental Evidence from Malawi's Cash Transfer Program [PhD thesis]. Chapel Hill, NC): University of North Carolina, 2016. [Google Scholar]
- University of North Carolina & University of Malawi.Impact of the Malawi Social Cash Transfer Programme on Household Resilience. Chapel Hil, NC: University of North Carolina, 2016. [Google Scholar]
- University of North Carolina & University of Malawi.Malawi Social Cash Transfer Programme: Endline Impact Evaluation Report. Chapel Hill, NC: University of North Carolina, 2016. [Google Scholar]
Agüero 2007 {published data only}
- Agüero JM, Carter M, Woolard I.The Impact of Unconditional Cash Transfers on Nutrition: the South African Child Support Grant. Brasilia, Brazil: United Nations Development Programme (UNDP), 2007. [Google Scholar]
- Agüero JM, Carter MR, Woolard I.The impact of unconditional cash transfers on nutrition: the South African Child Support Grant. Southern Africa Labour and Development. Cape Town: University of Cape Town; 2006. Research Unit Working Paper Number 06/08.
Aizawa 2020 {published data only}
- Aizawa, T.Do cash transfers increase nutritional intakes? Experimental evidence from an unconditional cash transfer in Kenya. Health Policy & Planning 2020;35:784-98. [DOI] [PubMed] [Google Scholar]
Akresh 2012 {published data only}
- Akresh R, Walque D, Kazianga H.Alternative cash transfer delivery mechanisms: impacts on routine preventative health clinic visits in Burkina Faso. Bonn: Institute for the Study of Labor; 2012. IZA Discussion Paper No. 6321.
- Akresh R, Walque D, Kazianga H.Alternative cash transfer delivery mechanisms: impacts on routine preventative health clinic visits in Burkina Faso. Cambridge (MA): National Bureau of Economic Research; 2012. NBER Working Paper No. 17785.
- Akresh R, Walque D, Kazianga H.Alternative cash transfer delivery mechanisms: impacts on routine preventative health clinic visits in Burkina Faso. In: Edwards S, Johnson S, Weil DN, editors(s). African Successes: Human Capital. Vol. 2. Chicago, IL: University of Chicago Press, 2016. [Google Scholar]
- Akresh R, Walque D, Kazianga H.Alternative cash transfer delivery mechanisms: impacts on routine preventative health clinic visits in Burkina Faso. Washington, DC: World Bank; 2012. Policy Research Working Paper 5958.
- Akresh R, Walque D, Kazianga H.Evidence from a randomized evaluation of the household welfare impacts of conditional and unconditional cash transfers given to mothers or fathers. Washington, DC: World Bank; 2016. Policy Research Working Paper 7730.
Amarante 2011 {published data only}
- Amarante V, Manacorda M, Miguel E, Vigorito A.Do cash transfers improve birth outcomes? Evidence from matched vital statistics, program, and social security data. American Economic Journal: Economic Policy 2016;8(2):1-43. [DOI: 10.1257/pol.8.2.1] [DOI] [Google Scholar]
- Amarante V, Manacorda M, Miguel E, Vigorito A.Do cash transfers improve birth outcomes? Evidence from matched vital statistics, social security and program data. Bonn: Institute for the Study of Labor; 2011. IZA Discussion Paper No. 6231.
- Amarante V, Manacorda M, Miguel E, Vigorito A.Social assistance and birth outcomes: evidence from the Uruguayan PANES. Washington, DC: Inter-American Development Bank, Department of Research and Chief Economist; 2011. IDB Working Paper Series No. IDB-WP-244.
American Institutes for Research 2013 {published data only}
- American Institutes for Research.12-month Impact Report for Zimbabwe’s Harmonised Social Cash Transfer Programmes. Washington, DC: American Institutes for Research, 2014. [Google Scholar]
- American Institutes for Research.Baseline Report for Zimbabwe’s Harmonized Social Cash Transfer Programmes. Washington, DC: American Institutes for Research, 2013. [Google Scholar]
- American Institutes for Research.Process Evaluation of Zimbabwe’s Harmonised Social Cash Transfer Programmeme. Washington, DC: American Institutes for Research, 2014. [Google Scholar]
- Angeles G, Chakrabarti A, Handa S, Otchere F, Spektor G.Zimbabwe’s Harmonised Social Cash Transfer Programme: Endline Impact Evaluation Report. Chapel Hill, NC: University of North Carolina at Chapel Hill, 2018. [Google Scholar]
- Angeles G, Handa S, Spektor G, Chakrabarti A, Otchere F.Impacts of Zimbabwe’s Harmonised Social Cash Transfer Programme: 3ie Grantee Final Report. New Delhi, India: International Initiative for Impact Evaluation (3ie), 2019. [Google Scholar]
- Bhalla G, Handa S, Angeles G, Seidenfeld D.The effect of cash transfers and household vulnerability on food security in Zimbabwe. Food Policy 2018;74:82-99. [DOI] [PMC free article] [PubMed] [Google Scholar]
- Daidone S, Dewbre J, Prifti E, Ruvalcaba A, Davis B.Zimbabwe’s Harmonized Cash Transfer Programme: 12-month impact report on productive activities and labour allocation: Zimbabwe country case study report. Rome, Italy: Food and Agriculture Organization of the United Nations, 2018. [Google Scholar]
Baird 2010 {published data only}
- Baird S, Chirwa E, McIntosh C, Özler B.What Happens Once the Intervention Ends? The Medium-term Impacts of a Cash Transfer Programme in Malawi. 3ie Impact Evaluation Report 27. New Delhi: International Initiative for Impact Evaluation, 2015. [Google Scholar]
- Baird S, De Hoop J, Özler B.Income shocks and adolescent mental health. Journal of Human Resources 2013;48(2):370-403. [DOI: 10.1353/jhr.2013.0014] [DOI] [Google Scholar]
- Baird S, De Hoop J, Özler B.Income shocks and adolescent mental health. Washington, DC: World Bank; 2011. Policy Research Working Paper No 5644.
- Baird S, McIntosh C, Özler B.Cash or condition? Evidence from a cash transfer experiment. Quarterly Journal of Economics 2011;126(4):1709-53. [DOI: 10.1093/qje/qjr032] [DOI] [Google Scholar]
- Baird S, McIntosh C, Özler B.Cash or condition? Evidence from a cash transfer experiment. Washington, DC: World Bank; 2010. Policy Research Working Paper 5259.
- Baird S, McIntosh C, Özler B.When the money runs out: do cash transfers have sustained effects on human capital accumulation? Washington, DC: World Bank; 2016. Policy Research Working Paper 7901.
- Baird SJ, Chirwa E, De Hoop J, Özler B.Girl power: cash transfers and adolescent welfare: evidence from a cluster-randomized experiment in Malawi. Cambridge, MA: National Bureau of Economic Research; 2013. NBER Working Paper 19479.
- Baird SJ, Garfein RS, McIntosh CT, Özler B.Effect of a cash transfer programme for schooling on prevalence of HIV and herpes simplex type 2 in Malawi: a cluster randomised trial. Lancet 2012;379(9823):1320-9. [DOI: 10.1016/S0140-6736(11)61709-1] [DOI] [PubMed] [Google Scholar]
Bazzi 2012 {published and unpublished data}
- Bazzi S, Sumarto S, Suryahadi A.Evaluating Indonesia’s Unconditional Cash Transfer Program, 2005-6. Washington, DC: International Initiative for Impact Evaluation, 2012. [Google Scholar]
- Bazzi S (Boston University, Boston, US).[personal communication]. Conversation with: F Pega (University of Otago, Wellington, New Zealand) 19 February 2015.
Beck 2015 {published data only}
- Beck S, Pulkki-Brännströma A-M, San Sebastiána M.Basic income – healthy outcome? Effects on health of an Indian basic income pilot project: a cluster randomised trial. Journal of Development Effectiveness 2015;7(1):111-26. [DOI: 10.1080/19439342.2014.974200] [DOI] [Google Scholar]
Cunha 2014 {published and unpublished data}
- Cunha JM.Testing paternalism: cash versus in-kind transfers. American Economic Journal: Applied Economics 2014;6(2):195-230. [DOI: 10.1257/app.6.2.195] [DOI] [Google Scholar]
- Cunha JM (Naval Postgraduate School, Monterey, US).[personal communication]. Conversation with: F Pega (University of Otago, Wellington, New Zealand) 17 February 2015.
d'Errico 2020 {published data only}
- d’Errico M, Garbero A, Letta M, Winters P.Evaluating program impact on resilience: evidence from Lesotho’s Child Grants Programme. Journal of Development Studies 2020;12:2212-34. [DOI: 10.1080/00220388.2020.1746279] [DOI] [Google Scholar]
Fernald 2011 {published and unpublished data}
- Fernald LC, Hidrobo M.Effect of Ecuador's cash transfer program (Bono de Desarrollo Humano) on child development in infants and toddlers: a randomized effectiveness trial. Social Science & Medicine 2011;72(9):1437-46. [DOI: 10.1016/j.socscimed.2011.03.005] [DOI] [PubMed] [Google Scholar]
- Hidrobo M (International Food Policy Research Institute, Washington, US).[personal communication]. Conversation with: F Pega (University of Otago, Wellington, New Zealand) 6 March 2015.
Galiani 2014 {published and unpublished data}
- Bando-Grana R (Inter-American Development Bank, Washington, US).[personal communication]. Conversation with: F Pega (University of Otago, Wellington, New Zealand) 2 March 2015.
- Galiani S, Gertler P, Bando R.Non-contributory pensions. Labour Economics 2016;38:47–58. [DOI: 10.1016/j.labeco.2015.11.003] [DOI] [Google Scholar]
- Galiani S.Non-contributory pensions. Washington, DC: Inter-American Development Bank; 2014. IDB Working Paper Series No. IDB-WP-517.
Grellety 2017 {published data only}
- Grellety E, Babakazo P, Bangana A, Mwamba G, Lezama I, Zagre NM, et al.Effects of unconditional cash transfers on the outcome of treatment for severe acute malnutrition (SAM): a cluster-randomised trial in the Democratic Republic of the Congo. BMC Medicine 2017;15(1):87. [DOI: 10.1186/s12916-017-0848-y] [DOI] [PMC free article] [PubMed] [Google Scholar]
Haushofer 2013 {published data only}
- Haushofer J, Ringdal C, Shapiro JP, Wang XY.Income changes and intimate partner violence: evidence from unconditional cash transfers in Kenya. Cambridge, MA: National Bureau of Economic Research; 2019. NBER Working Paper 25627.
- Haushofer J, Shapiro J.Household Response to Income Changes: Evidence from an Unconditional Cash Transfer Program in Kenya. Princeton, NJ: Princeton University, 2013. [Google Scholar]
- Haushofer J, Shapiro J.The short-term impact of unconditional cash transfers to the poor: experimental evidence from Kenya. Quarterly Journal of Economics 2016;131(4):1973-2042. [DOI: 10.1093/qje/qjw025] [DOI] [PMC free article] [PubMed] [Google Scholar]
Hessel 2018 {published and unpublished data}
- Hessel P, Avendano M, Rodríguez-Castelán C, Pfutze T.Social pension income associated with small improvements in self-reported health of poor older men in Colombia. Health Affairs 2018;37(3):456-63. [DOI: 10.1377/hlthaff.2017.1284] [DOI] [PubMed] [Google Scholar]
- Hessel P (University of the Andes, Bogotá, Colombia).[personal communication]. Conversation with: F Pega (University of Otago, Wellington, New Zealand) 3 February 2021.
Huang 2016 {published and unpublished data}
- Huang C, Singh K, Handa S, Halpern C, Pettifor A, Thirumurthy H.Investments in children’s health and the Kenyan cash transfer for orphans and vulnerable children: evidence from an unconditional cash transfer scheme. Health Policy and Planning 2017;32:943–55. [DOI] [PMC free article] [PubMed] [Google Scholar]
- Huang C.Sub-Saharan African Social and Health Policies and the Poor: Three essays examining impacts of public programs on maternal health utilization, children's health and household composition [PhD thesis]. Chapel Hill, NC: University of North Carolina at Chapel Hill, 2016. [Google Scholar]
- Huang C (University of University of North Carolina at Chapel Hill, Chapel Hill, US).[personal communication]. Conversation with: F Pega (University of Otago, Wellington, New Zealand) 18 February, 2021.
Leroy 2010 {published data only}
- Leroy JL, Gadsden P, Cossio TG, Gertler P.Cash and in-kind transfers lead to excess weight gain in a population of women with a high prevalence of overweight in rural Mexico. Journal of Nutrition 2013;143(3):378-83. [DOI: 10.3945/jn.112.167627] [DOI] [PubMed] [Google Scholar]
- Leroy JL, Gadsden P, Rodriguez-Ramirez S, Cossio TG.Cash and in-kind transfers in poor rural communities in Mexico increase household fruit, vegetable, and micronutrient consumption but also lead to excess energy consumption. Journal of Nutrition 2010;140(3):612-7. [DOI: 10.3945/jn.109.116285] [DOI] [PubMed] [Google Scholar]
- Leroy JL (International Food Policy Research Institute, Washington, US).[personal communication]. Conversation with: F Pega (University of Otago, Wellington, New Zealand) 28 April 2015.
Luseno 2012 {published and unpublished data}
- Handa S (University of North Carolina at Chapel Hill, Chapel Hill, US).[personal communication]. Conversation with: F Pega (University of Otago, Wellington, New Zealand) 15 April 2015.
- Luseno WK, Singh K, Handa S, Suchindran C.A multilevel analysis of the effect of Malawi's Social Cash Transfer Pilot Scheme on school-age children's health. Health Policy and Planning 2014;29(4):421-32. [DOI: 10.1093/heapol/czt028] [DOI] [PMC free article] [PubMed] [Google Scholar]
- Luseno WK.Effect of the Mchinji Social Cash Transfer Pilot Scheme on Children's Schooling, Work and Health Outcomes: a Multilevel Study Using Experimental Data [PhD thesis]. Chapel Hill (NC): University of North Carolina, 2012. [Google Scholar]
Miller 2008 {published and unpublished data}
- Miller C, Tsoka M, Reichert K.The impacts of the cash transfer on children in Malawi. In: Handa S, Devereux S, Webb D, editors(s). Social Protection for Africa’s Children. New York, NY: Routledge, 2010. [Google Scholar]
- Miller C (Mathematica Policy Research, Princeton, US).[personal communication]. Conversation with: F Pega (University of Otago, Wellington, New Zealand) 28 March 2015.
- Miller CM, Tsoka M, Reichert K.Impact Evaluation Report: External Evaluation of the Mchinji Social Cash Transfer Pilot. Boston, MA: Boston University & University of Malawi, 2008. [Google Scholar]
- Miller CM, Tsoka M, Reichert K.The impact of the Social Cash Transfer Scheme on food security in Malawi. Food Policy 2011;36(2):230-8. [DOI: 10.1016/j.foodpol.2010.11.020] [DOI] [Google Scholar]
Ohrnberger 2019 {published data only}
- Ohrnberger J, Fichera E, Sutton M, Anselmi L.The effect of cash transfers on mental health - new evidence from South Africa. BMC Public Health 2020;20(1):436. [DOI] [PMC free article] [PubMed] [Google Scholar]
- Ohrnberger JW.An Analysis of the Effects of Cash Transfer Programmes on Adult Mental Health in Low- and Middle-income Countries [PhD Thesis]. Manchester, UK: University of Manchester, 2019. [Google Scholar]
Olajide 2013 {published data only}
- Alzua ML, Cantet N, Dammert AC, Olajide D.Mental health effects of an old age pension: experimental evidence for Ekiti State in Nigeria. In: Selected Presentation at the 2020 Agricultural & Applied Economics Association Annual Meeting, 2020 July 26-28; Kansas City (MO). 2020.
- Alzua ML, Cantet N, Dammert AC, Olajide D.Welfare effects of a non-contributory old age pension: experimental evidence for Ekiti State, Nigeria. Lagos, Nigeria: Partnership for Economic Policy, 2019. PEP Working Paper 2019-15.
- Olajide D, Alzua ML, Dammert A, Sotola O, Ayodele T.Randomized evaluation of the unconditional cash transfer scheme for the elderly in Ekiti State, Nigeria. Nairobi, Kenya: Partnership for Economic Policy, 2016. PEP Working Paper 2016-21.
- Olajide D, Ezeibe A, Sotola O, Gold K, Olufemi O, Adebayo F.Randomised evaluation of unconditional cash transfer scheme for the elderly in Ekiti State Nigeria: baseline survey report. Lagos, Nigeria: Partnership for Economic Policy, 2014. PEP Working Paper 2019-15.
- Olajide D, Ezeibe A, Sotola O, Gold K, Olufemi O, Adebayo F.Randomised evaluation of unconditional cash transfer scheme for the elderly in Ekiti State Nigeria: research proposal. Nigeria: Partnership for Economic Policy, 2013. [Google Scholar]
Oxford Policy Management 2012 {published and unpublished data}
- Garcia M (Oxford Policy Management, Oxford, UK).[personal communication]. Conversation with: F Pega (University of Otago, Wellington, New Zealand) 3 March 2015.
- Merttens F, Hurrell A, Marzi M, Attah R, Farhat M, Kardan A, et al.Kenya Hunger Safety Net Programme Monitoring and Evaluation Component: Impact Evaluation Final Report: 2009 to 2012. Oxford, United Kingdom: Oxford Policy Mangement, 2013. [Google Scholar]
- Oxford Policy Management & Institute of Development Studies.Kenya Hunger Safety Net Programme: Monitoring and Evaluation Component: Impact Analysis Synthesis Report. Oxford, United Kingdom: Oxford Policy Management & Institute of Development Studies, 2012. [Google Scholar]
- Oxford Policy Management & Institute of Development Studies.Kenya Hunger Safety Net Programme: Monitoring and Evaluation Component: Quantitative Impact Evaluation Report: 2009/10 to 2010/11. Oxford, United Kingdom: Oxford Policy Management, 2012. [Google Scholar]
Paxson 2007 {published data only}
- Paxson C, Schady N.Does money matter? The effects of cash transfers on child development in rural Ecuador. Economic Development & Cultural Change 2010;59(1):187-229. [DOI] [PubMed] [Google Scholar]
- Paxson C, Schady N.Does money matter? The effects of cash transfers on child health and development in rural Ecuador. Washington, DC: World Bank, 2007. Policy Research Working Paper 4226.
Pellerano 2014 {published and unpublished data}
- Pace N, Daidone S, Davis B, Pellerano L.Does “soft conditionality” increase the impact of cash transfers on desired outcomes? Evidence from a randomized control trial in Lesotho. Working Paper. Venice, Italy: Department of Economics, Ca’Foscari University of Venice, 2016. [Google Scholar]
- Pace N, Daidone S, Davis B, Pellerano L.Shaping cash transfer impacts through ‘soft-conditions’: evidence from Lesotho. Journal of African Economies 2019;28:139–69. [Google Scholar]
- Pellerano L, Hurrell A, Kardan A, Barca V, Hove F, Beazley R, et al.CGP Impact Evaluation: Targeting and Baseline Evaluation Report. Oxford, United Kingdom: Oxford Policy Mangement, 2012. [Google Scholar]
- Pellerano L, Moratti M, Jakobsen M, Bajgar M, Barca V.The Lesotho Child Grants Programme impact evaluation: Follow-up Report. Maseru, Lesotho: UNICEF-Lesotho (with EU funding and technical support from FAO). Prepared by Oxford Policy Management, 2014. [Google Scholar]
- Pellerano L (Oxford Policy Management, Oxford, UK).[personal communication]. Conversation with: F Pega (University of Otago, Wellington, New Zealand) 14 March 2015.
- Tiwari S, Daidone S, Ruvalcaba MA, Prifti E, Handa S, Davis B, et al.Impact of cash transfer programs on food security and nutrition in sub-Saharan Africa: a cross-country analysis. Global Food Security 2016;11:72-83. [DOI: 10.1016/j.gfs.2016.07.009] [DOI] [PMC free article] [PubMed] [Google Scholar]
Robertson 2012 {published and unpublished data}
- Crea TM, Reynolds AD, Sinha A, Eaton JW, Robertson LA, Mushati P, et al.Effects of cash transfers on children's health and social protection in Sub-Saharan Africa: differences in outcomes based on orphan status and household assets. BMC Public Health 2015;15:511. [DOI: 10.1186/s12889-015-1857-4] [DOI] [PMC free article] [PubMed] [Google Scholar]
- Gregson S (Imperial College London, London, UK).[personal communication]. Conversation with: F Pega (University of Otago, Wellington, New Zealand) 11 March 2015.
- Robertson L, Mushati P, Eaton JW, Dumba L, Mavise G, Makoni J, et al.Effects of unconditional and conditional cash transfers on child health and development in Zimbabwe: a cluster-randomised trial. Lancet 2013;381(9874):1283-92. [DOI: 10.1016/S0140-6736(12)62168-0] [DOI] [PMC free article] [PubMed] [Google Scholar]
- Robertson L, Mushati P, Eaton JW, Dumba L, Mavise G, Makoni JC, et al.Conditional cash transfers improve birth registration and school attendance amongst orphans and vulnerable children in Manicaland, Zimbabwe. Journal of the International AIDS Society 2012;15(Suppl 3):158-9. [Google Scholar]
Salinas‐Rodríguez 2014 {published data only}
- Salinas-Rodríguez A, Torres-Pereda Mdel P, Manrique-Espinoza B, Moreno-Tamayo K, Téllez-Rojo Solís MM.Impact of the non-contributory social pension program 70 y más on older adults' mental well-being. PloS One 2014;9(11):e113085. [DOI: 10.1371/journal.pone.0113085] [DOI] [PMC free article] [PubMed] [Google Scholar]
Schady 2012 {published and unpublished data}
- Schady N.Cash transfers and anemia among women of reproductive age. Economics Letters 2012;117(3):887-90. [DOI: 10.1016/j.econlet.2012.07.014] [DOI] [Google Scholar]
- Schady N.Cash transfers and anemia among women of reproductive age. Washington, DC: Inter-American Development Bank, 2012. IDB Working Paper Series No. IDB-WP-336.
- Schady N (Inter-American Development Bank, Washington, US).[personal communication]. Conversation with: F Pega (University of Otago, Wellington, New Zealand) 25 March 2015.
Seidenfeld 2012 {published data only}
- American Institutes for Research.Zambia’s Multiple Category Targeting Grant: 24-Month Impact Report. Washington, DC: American Institutes for Research, 2014. [Google Scholar]
- American Institutes for Research.Zambia’s Multiple Category Targeting Grant: 36-Month Impact Report. Washington, DC: American Institutes for Research, 2015. [Google Scholar]
- Ministry of Community Development and Social Welfare, Zambia.The Multiple Categorical Trageting Grant: A Comprehensive Summary of Impacts (2011-2014). Washintgon, DC: American Institutes for Resarch, 2016. [Google Scholar]
- Seidenfeld D, Prencipe L, Handa S, Tembo G, Sherman D.Zambia’s Multiple Category Cash Transfer Program: Baseline Report. Washington, DC: American Institutes for Research, 2012. [Google Scholar]
Seidenfeld 2013 {published and unpublished data}
- American Institutes for Research.Zambia’s Child Grant Program: 24-month Impact Report. Washington, DC: American Institutes for Research, 2013. [Google Scholar]
- American Institutes for Research.Zambia’s Child Grant Program: 30-month Impact Report. Washington, DC: American Institutes for Research, 2014. [Google Scholar]
- American Institutes for Research.Zambia’s Child Grant Program: 36-month Impact Report. Washington, DC: American Institutes for Research, 2014. [Google Scholar]
- American Institutes for Research.Zambia’s Child Grant Program: 48-month Impact Report. Washington, DC: American Institutes for Research, 2016. [Google Scholar]
- Chakrabarti A, Handa S, Natali L, Seidenfeld D, Tembo G, on behalf of the Zambia Cash Transfer Evaluation Team.More evidence on the relationship between cash transfers and child height. Journal of Development Effectiveness 2020;12(1):14-37. [DOI: 10.1080/19439342.2020.1731568] [DOI] [Google Scholar]
- Handa S, Natalib L, Seidenfeld D, Tembo G, Davis B, Zambia Cash Transfer Evaluation Study Team.Can unconditional cash transfers raise long-term living standards? Evidence from Zambia. Journal of Development Economics 2018;133:42–65. [DOI] [PMC free article] [PubMed] [Google Scholar]
- Handa S, Peterman A, Seidenfeld D, Tembo G.Income transfers and maternal health: evidence from a national randomized social cash transfer program in Zambia. Health Economics 2015;25(2):225-36. [DOI: 10.1002/hec.3136] [DOI] [PMC free article] [PubMed] [Google Scholar]
- Handa S, Seidenfeld D, Davis B, Tembo G, Zambia Cash Transfer Evaluation Team.Are cash transfers a silver bullet? Evidence from the Zambian Child Grant. Florence, Italy: UNICEF, 2014. Office of Research Working Paper WP-2014-No. 08.
- Handa S, Seidenfeld D, Davis B, Tembo G.The social and productive impacts of Zambia's child grant. Journal of Policy Analysis and Management 2016;35(2):357-87. [DOI: 10.1002/pam.21892] [DOI] [PubMed] [Google Scholar]
- Hjelm L, Handa S, Hoop J, Palermo T, Zambia CGP and MCP Evaluation Teams.Poverty and perceived stress: evidence from two unconditional cash transfer programs in Zambia. Social Science & Medicine 2017;177:110-7. [DOI: 10.1016/j.socscimed.2017.01.023] [DOI] [PMC free article] [PubMed] [Google Scholar]
- Lawlor K, Handa S, Seidenfeld D, Zambia Cash Transfer Evaluation Team.Cash transfers enable households to cope with agricultural production and price shocks: evidence from Zambia. Journal of Development Studies 2019;55(2):209-26. [DOI] [PMC free article] [PubMed] [Google Scholar]
- Lawlor K.Impacts of Poverty Reduction Programs in Remote Rural Landscapes: Evidence from Cash Transfers in Zambia [PhD thesis]. Chapel Hill (NC): University of North Carolina, 2015. [Google Scholar]
- Ministry of Community Development and Social Welfare, Zambia.The Child Grant Programme: A Comprehensive Summary of Impacts (2010-2014). Washintgon, DC: American Institutes for Research, 2016. [Google Scholar]
- Seidenfeld D, Handa S, Tembo G, Michelo S, Scott CH, Prencipe L.The impact of an unconditional cash transfer on food security and nutrition: the Zambia Child Grant Programme. In: Harris J, Haddad L, Seco-Grütz S, editors(s). IDS Special Collection: Turning Rapid Growth into Meaningful Growth: Sustaining the Commitment to Nutrition in Zambia. Brighton (UK): Institute of Development Studies, 2014:36-42. [Google Scholar]
- Seidenfeld D, Handa S.Zambia’s Child Grant Program: Baseline Report. Washington, DC: American Institutes for Research, 2011. [Google Scholar]
- Seidenfeld D (American Institutes for Research, Washington, US).[personal communication]. Conversation with: F Pega (University of Otago, Wellington, New Zealand) 12 March 2015.
- Tiwari S, Daidone S, Ruvalcaba MA, Prifti E, Handa S, Davis B, et al.Impact of cash transfer programs on food security and nutrition in sub-Saharan Africa: a cross-country analysis. Global Food Security 2016;11:72-83. [DOI: 10.1016/j.gfs.2016.07.009] [DOI] [PMC free article] [PubMed] [Google Scholar]
Smith 2017 {published data only}
- Smith LM, Hein NA, Bagenda DS.Cash Transfers and HIV/HSV-2 Prevalence: A Replication of a Cluster Randomized Trial in Malawi. 3ie Replication Paper 12. Washington, DC: International Initiative for Impact Evaluation (3ie), 2017. [Google Scholar]
- Smith LM, Hein NA, BagendaI DS.Cash transfers and HIV/HSV-2 prevalence: a replication of a cluster randomized trial in Malawi. PloS One 2019;14(1):e0210405. [DOI] [PMC free article] [PubMed] [Google Scholar]
Tiwari 2019 {published and unpublished data}
- Tiwari S.Long-term effects of temporary income shocks on food consumption and subjective well-being. Journal of Development Studies 2019;55(8):1687-707. [Google Scholar]
- Tiwari S (Skidmore College, Saratoga Springs, US).[personal communication]. Conversation with: F Pega (University of Otago, Wellington, New Zealand) 18 February, 2021.
Wang 2019 {published data only}
- Wang H, Luo J.The short-term impact of unconditional cash transfers: a replication study of a randomized controlled trial in Kenya. Journal of Development Effectiveness 2019;11(4):391-408. [Google Scholar]
- Wang H, Qui F, Luo J.Impact of unconditional cash transfers: a replication study of the short-term effects in Kenya. Washington, DC: International Initiative for Impact Evaluation (3ie), 2018. 3ie Replication Paper 20.
Ward 2010 {published and unpublished data}
- Bahety G (Oxford Policy Management, Oxford, UK).[personal communication]. Conversation with: F Pega (University of Otago, Wellington, New Zealand) 11 March 2015.
- Hurrell A, Ward P, Merttens F.Kenya OVC-CT Programme Operational and Impact Evaluation: Baseline Survey Report. Oxford (UK): Oxford Policy Management, 2008. [Google Scholar]
- Tiwari S, Daidone S, Ruvalcaba MA, Prifti E, Handa S, Davis B, et al.Impact of cash transfer programs on food security and nutrition in sub-Saharan Africa: a cross-country analysis. Global Food Security 2016;11:72-83. [DOI: 10.1016/j.gfs.2016.07.009] [DOI] [PMC free article] [PubMed] [Google Scholar]
- Ward P, Hurrell A, Visram A, Riemenschneider N, Pellerano L, O’Brien C, et al.Cash Transfer Programme For Orphans And Vulnerable Children, Kenya: Operational and Impact Evaluation, 2007-2009: Final Report. Oxford (UK): Oxford Policy Management, 2010. [Google Scholar]
References to studies excluded from this review
Aguila 2017 {published data only}
- Aguila E, Kapteyn A, Perez-Arce F.Consumption smoothing and frequency of benefit payments of cash transfer programs. American Economic Review 2017;107(5):430-35. [DOI: 10.1257/aer.p20171147] [DOI] [PMC free article] [PubMed] [Google Scholar]
Akee 2013 {published data only}
- Akee R, Simeonova E, Copeland W, Angold A, Costello EJ.Young adult obesity and household income: effects of unconditional cash transfers. American Economic Journal: Applied Economics 2013;5(2):1-28. [DOI: 10.1257/app.5.2.1] [DOI] [PMC free article] [PubMed] [Google Scholar]
Aker 2013 {published data only}
- Aker J.Cash or coupons? Testing the impacts of cash versus vouchers in the Democratic Republic of Congo. Washington, DC: Center for Global Development, 2013. CGD Working Paper 320.
- Aker JC.Comparing cash and voucher transfers in a humanitarian context: evidence from the Democratic Republic of Congo. World Bank Economic Review 2017;31(1):44-70. [DOI: 10.1093/wber/lhv055] [DOI] [Google Scholar]
Attanasio 2015 {published data only}
- Attanasio OP, Oppedisano V, Vera-Hernández M.Should cash transfers be conditional? Conditionality, preventive care, and health outcomes. American Economic Journal: Applied Economics 2015;7(3):25-43. [DOI: 10.1257/app.20130126] [DOI] [Google Scholar]
Ayuku 2013 {published data only}
- Ayuku D, Atwoli L, Ayaya S, Koech J, Nyandat J, Gisore P, et al.Do government cash transfers work to support households in caring for orphaned youth? Evidence from Western Kenya. Turkish Archives of Pediatrics 2013;48(Suppl 2):114. [Google Scholar]
Benedetti 2016 {published data only}
- Benedetti F, Ibarrarán P, McEwan PJ.Do education and health conditions matter in a large cash transfer? Evidence from a Honduran experiment. Economic Development and Cultural Change 2016;64(4):759-93. [DOI: 10.1086/686583] [DOI] [Google Scholar]
Benhassine 2013 {published data only}
- Benhassine N, Devoto F, Duflo E, Dupas P, Pouliquen V.Turning a shove into a nudge? A "labelled cash transfer" for education. American Economic Journal: Economic Policy 2015;7(3):86-125. [DOI: 10.1257/pol.20130225] [DOI] [Google Scholar]
- Benhassine N, Devoto F, Duflo E, Dupas P, Pouliquen V.Turning a shove into a nudge? A "labelled cash transfer" for education. Cambridge (MA): National Bureau of Economic Research; 2013. NBER Working Paper No. 19227.
Buller 2016 {published data only}
- Buller AM, Hidrobo M, Peterman A, Heise L.The way to a man’s heart is through his stomach? A mixed methods study on causal mechanisms through which cash and in-kind food transfers decreased intimate partner violence. BMC Public Health 2016;16:488. [DOI: 10.1186/s12889-016-3129-3] [DOI] [PMC free article] [PubMed] [Google Scholar]
Buser 2014 {published data only}
- Buser T, Oosterbeek H, Plug E, Ponce J, Rosero J.The impact of positive and negative income changes on the height and weight of young children. Bonn (Germany): IZA; 2014. IZA Discussion Paper No. 8130.
Cluver 2013 {published data only}
- Cluver L, Boyes M, Orkin M, Pantelic M, Molwena T, Sherr L.Child-focused state cash transfers and adolescent risk of HIV infection in South Africa: a propensity-score-matched case-control study. Lancet Global Health 2013;1(6):e362-70. [DOI: 10.1016/S2214-109X(13)70115-3] [DOI] [PubMed] [Google Scholar]
- Cluver LD, Orkin FM, Boyes ME, Sherr L.Cash plus care: social protection cumulatively mitigates HIV-risk behaviour among adolescents in South Africa. AIDS 2014;28(Suppl 3):S389-97. [DOI: 10.1097/QAD.0000000000000340] [DOI] [PubMed] [Google Scholar]
- Cluver LD, Orkin FM, Meinck F, Boyes ME, Sherr L.Structural drivers and social protection: mechanisms of HIV risk and HIV prevention for South African adolescents. Journal of the International AIDS Society 2016;19(2):20646. [DOI: 10.7448/IAS.19.1.20646] [DOI] [PMC free article] [PubMed] [Google Scholar]
- Cluver LD, Orkin FM, Meinck F, Boyes ME, Yakubovich AR, Sherr L.Can social protection improve Sustainable Development Goals for adolescent health? PloS One 2016;11(10):e0164808. [DOI: 10.1371/journal.pone.0164808] [DOI] [PMC free article] [PubMed] [Google Scholar]
- Cluver LD, Orkin FM, Yakubovich AR, Sherr L.Combination social protection for reducing HIV-risk behavior among adolescents in South Africa. Journal of Acquired Immune Deficiency Syndromes 2016;72(1):96-104. [DOI: 10.1097/QAI.0000000000000938] [DOI] [PMC free article] [PubMed] [Google Scholar]
- Cluver LD, Toska E, Orkin FM, Meinck F, Hodes R, Yakubovich AR, et al.Achieving equity in HIV-treatment outcomes: can social protection improve adolescent ART-adherence in South Africa? AIDS Care 2016;28(Suppl 2):73-82. [DOI: 10.1080/09540121.2016.1179008] [DOI] [PMC free article] [PubMed] [Google Scholar]
- Cluver LD, Toska E, Orkin FM, Yakubovich AR, Hodes R, Sherr L.Cash, care and HIV community: social protection improves adolescent ART adherence in South Africa. Journal of the International AIDS Society 2016;19(6 (Suppl 5)):21264. [DOI: 10.7448/IAS.19.1.20646] [DOI] [Google Scholar]
Doocey 2017 {published data only}
- Doocy S, Tappis H, Lyles E, Witiw J, Aken V.Emergency food assistance in Northern Syria: an evaluation of transfer programs in Idleb Governorate. Food and Nutrition Bulletin 2017;38(2):240-59. [DOI: 10.1177/0379572117700755] [DOI] [PubMed] [Google Scholar]
Fenn 2017 {published data only}
- Fenn B, Colbourn T, Dolan C, Pietzsch S, Sangrasi M, Shoham J.Impact evaluation of different cash-based intervention modalities on child and maternal nutritional status in Sindh Province, Pakistan, at 6 mo and at 1 y: a cluster randomised controlled trial. PLoS Medicine 2017;14(5):e1002305. [DOI: 10.1371/journal.pmed.1002305] [DOI] [PMC free article] [PubMed] [Google Scholar]
Galárraga 2014 {published data only}
- Galárraga O, Sosa-Rubí SG, Conde-Glez CJ, Juárez-Figueroa L, González A, Badial-Hernández F, et al.Conditional economic incentives to reduce HIV risks among high risk men who have sex with men: a randomized pilot in Mexico. In: Conference proceedings of the 10th World Congress in Health Economics; 2014 Jul 13-16; Dublin (Ireland). Dublin (Ireland): International Health Economics Association, 2014.
- Galárraga O, Sosa-Rubí SG, González A, Badial-Hernández F, Conde-Glez CJ, Juárez-Figueroa L, et al.The disproportionate burden of HIV and STIs among male sex workers in Mexico City and the rationale for economic incentives to reduce risks. Journal of the International AIDS Society 2014;17:19218. [DOI: 10.7448/IAS.17.1.19218] [DOI] [PMC free article] [PubMed] [Google Scholar]
Gangophadyay 2015 {published data only}
- Gangopadhyay S, Lensink R, Yadav B.Cash or in-kind transfers? Evidence from a randomised controlled trial in Delhi, India. Journal of Development Studies 2015;51(6):660-73. [DOI: 10.1080/00220388.2014.997219] [DOI] [Google Scholar]
Han 2020 {published data only}
- Han H, Gao Q.Does welfare participation improve life satisfaction? Evidence from panel data in rural China. Journal of Happiness Studies 2020;21(5):1795-822. [DOI: 10.1007/s10902-019-00157-z] [DOI] [Google Scholar]
Haushofer 2020 {published data only}
- Haushofer J, Chemin M, Jang C, Abraham J.Economic and psychological effects of health insurance and cash transfers: evidence from a randomized experiment in Kenya. Journal of Development Economics 2020;144:102416. [DOI: 10.1016/j.jdeveco.2019.102416] [DOI] [Google Scholar]
Heath 2020 {published data only}
- Heath R, Hidrobo M, Roy S.Cash transfers, polygamy, and intimate partner violence: experimental evidence from Mali. Journal of Development Economics 2020;143:102410. [DOI: 10.1016/j.jdeveco.2019.102410] [DOI] [Google Scholar]
Hidrobo 2013 {published data only}
- Hidrobo M, Fernald L.Cash transfers and domestic violence. Journal of Health Economics 2013;32(1):304-19. [DOI: 10.1016/j.jhealeco.2012.11.002] [DOI] [PubMed] [Google Scholar]
Hoddinott 2018 {published data only}
- Hoddinott J, Ahmed A, Roy S.Randomized control trials demonstrate that nutrition-sensitive social protection interventions increase the use of multiple-micronutrient powders and iron supplements in rural pre-school Bangladeshi children. Public Health Nutrition 2018;21(9):1753-61. [DOI: 10.1017/S1368980017004232] [DOI] [PMC free article] [PubMed] [Google Scholar]
Kenya CT‐OVC Evaluation Team 2012 {published data only}
- KCT-OVCET.The impact of the Kenya Cash Transfer Program for Orphans and Vulnerable Children on household spending. Journal of Development Effectiveness 2012;4(1):9-37. [DOI: 10.1080/19439342.2011.653980] [DOI] [Google Scholar]
Kilburn 2016 {published data only}
- Kilburn K, Thirumurthy H, Halpern CT, Pettifor A, Handa S.Effects of a large-scale unconditional cash transfer program on mental health outcomes of young people in Kenya. Journal of Adolescent Health 2016;58(2):223-9. [DOI] [PMC free article] [PubMed] [Google Scholar]
McIntosh 2020 {published data only}
- McIntosh C, Zeitlin A.Using household grants to benchmark the cost effectiveness of a USAID workforce readiness program. arXiv 2020 Sept 2 [Epub ahead of print]:2009.01749v1. [Google Scholar]
Ndlovu 2013 {published data only}
- Ndlovu PV.Effects of Social Grants on Labor Supply and Food Security of South African Households: Is There a Disincentive Effect? [Masters thesis]. Alberta (Canada): University of Alberta, 2013. [Google Scholar]
Pereznieto 2014 {published data only}
- Pereznieto P, Jones N, Hamad BA, Shaheen M, O'Neill K.Tackling Childhood Poverty and Vulnerability: Making the Palestinian National Cash Transfer Programme More Effective for Children. London, United Kingdom: Overseas Development Institute & UNICEF, 2014. [Google Scholar]
Pratinidhi 2014 {published data only}
- Pratinidhi AK.Effects of age, years of schooling, income, and cash incentive on postponement of first pregnancy among newly married couples in Satara district of Maharashtra (India). International Journal of Medicine and Public Health 2014;4(1):66-71. [DOI: 10.4103/2230-8598.127130] [DOI] [Google Scholar]
Rocha 2013 {published data only}
- Rocha S.The Brazilian Bolsa-Familia, 2003-2010: the workings of the new cash transfer program. Economie Appliquee 2013;66(1):125-54. [Google Scholar]
Sabates‐Wheeler 2018 {published data only}
- Sabates‐Wheeler R, Sabates R, Devereux S.Enabling graduation for whom? Identifying and explaining heterogeneity in livelihood trajectories post‐cash transfer exposure. Journal of Development Studies 2018;30(7):1071-1095. [Google Scholar]
Seidenfeld 2011 {published data only}
- Seidenfeld D, Handa S, Huang C, Tembo G, Sherman D.Results of the Three Year Impact Evaluation of Zambia’s Cash Transfer Program in Monze District: Final Report. Washington, DC: American Institutes for Research, 2011. [Google Scholar]
Skoufias 2013 {published data only}
- Skoufias E, Unar M, Cossio TG.The poverty impacts of cash and in-kind transfers: experimental evidence from rural Mexico. Journal of Development Effectiveness 2013;5(4):401-29. [DOI: 10.1080/19439342.2013.843578] [DOI] [Google Scholar]
Tonguet‐Papucci 2017 {published data only}
- Houngbe F, Tonguet-Papucci A, Altare C, Ait-Aissa M, Huneau JF, Huybregts L, et al.Unconditional cash transfers do not prevent children's undernutrition in the Moderate Acute Malnutrition Out (MAM'Out) Cluster-Randomized Controlled Trial in rural Burkina Faso. Journal of Nutrition 2017;147(7):1410-7. [DOI: 10.3945/jn.117.247858] [DOI] [PubMed] [Google Scholar]
- Tonguet-Papucci A, Houngbe F, Huybregts L, Ait-Aissa M, Altare C, Kolsteren P, et al.Unconditional seasonal cash transfer increases intake of high-nutritional-value foods in young Burkinabe children: results of 24-hour dietary recall surveys within the MAM'Out Randomized Controlled Trial. Journal of Nutrition 2017;147(7):1418-25. [DOI: 10.3945/jn.116.244517] [DOI] [PubMed] [Google Scholar]
References to studies awaiting assessment
Aguila 2020 {published data only}
- Aguila E, Casanova M.Short-term impact of income on cognitive function: evidence from a sample of Mexican older adults. Journal of Aging and Health 2020;32(7/8):591-603. [DOI: 10.1177/0898264319841155] [PMID: ] [DOI] [PubMed] [Google Scholar]
Banarjee 2020 {published data only}
- Banerjee A, Faye M, Krueger A, Niehaus P, Suri T.Effects of a universal basic income during the pandemic. Working paper, Cambridge, MA; September 2020. Available at mitsloan.mit.edu/shared/ods/documents?PublicationDocumentID=7568.
Chen 2019 {published data only}
- Chen X, Wang T, Buscha SH.Does money relieve depression? Evidence from social pension expansions in China. Social Science & Medicine 2019;220:411–420. [DOI: 10.1016/j.socscimed.2018.12.004] [DOI] [PMC free article] [PubMed] [Google Scholar]
Davis 2016 {published data only}
- Davis B, Handa S, Hypher N, Winder N, Winters PC, Yablonski J.From Evidence to Action: The Story of Cash Transfers and Impact Evaluation in Sub-Saharan Africa. Oxford (UK): Oxford University Press, 2016. [Google Scholar]
De Groot 2021 {published data only}
- De Groot R, Palermo T, Banks LM, Kuper H.The impact of the Lesotho Child Grant Programme in the lives of children and adults with disabilities: disaggregated analysis of a community randomized controlled trial. International Social Security Review 2021;74(2):55-81. [DOI: 10.1111/issr.12265] [DOI] [Google Scholar]
Haushofer 2018 {published data only}
- Haushofer J, Shapiro J.The long-term impact of unconditional cash transfers: experimental evidence from Kenya. Nairobi, Kenya: Busara Center for Behavioral Economics, 2018. [DOI] [PMC free article] [PubMed] [Google Scholar]
Haushofer 2021 {published data only}
- Haushofer J, Mudida R, Shapiro J.The Comparative Impact of Cash Transfers and a Psychotherapy Program on Psychological and Economic Well-being. IFN Working Paper No. 1377. Stockholm, Sweden: Research Institute of Industrial Economics, 2021. [Google Scholar]
Ma 2020 {published data only}
- Ma X, Oshio T.The impact of social insurance on health among middle-aged and older adults in rural China: a longitudinal study using a three-wave nationwide survey. BMC Public Health 2020;20:1842. [DOI: 10.1186/s12889-020-09945-2] [PMID: ] [DOI] [PMC free article] [PubMed] [Google Scholar]
Ohrnberger 2020 {published data only}
- Ohrnberger J, Anselmi L, Fichera E, Sutton M.The effect of cash transfers on mental health: opening the black box. A study from South Africa. Social Science & Medicine 2020;260:113181. [DOI: 10.1016/j.socscimed.2020.113181] [PMID: ] [DOI] [PMC free article] [PubMed] [Google Scholar]
Oxford Policy Management, Makarere University 2013 {published data only}
- Binci M, Merttens F, O’Leary S, Sindou E.Evaluation of the Uganda Social Assistance Grants for Empowerment (SAGE) Programme: Technical Report on Regression Discontinuity Design. Oxford, United Kingdom: Oxford Policy Management, 2014. [Google Scholar]
- Brook S, Jones E, Merttens F.Evaluation of the Uganda Social Assistance Grants for Empowerment (SAGE) Programme: Midline Qualitative Research Evaluation Report February 2012 – October 2013. Oxford, United Kingdom: Oxford Policy Management, 2014. [Google Scholar]
- Merttens F, Jones E.Evaluation of the Uganda Social Assistance Grants for Empowerment (SAGE) Programme: Programme Operations Performance Report. Oxford, United Kingdom: Oxford Policy Management, 2014. [Google Scholar]
- Merttens F, Pellerano L, O’Leary S, Sindou E, Attah R, Jones E, et al.Evaluation of the Uganda Social Assistance Grants for Empowerment (SAGE) Programme: Impact After One Year of Programme Operations 2012-2013. Oxford, United Kingdom: Oxford Policy Management, 2015. [Google Scholar]
- Merttens F, Sindou E, Attah R, Hearle C.Evaluation of the Uganda Social Assistance Grants for Empowerment (SAGE) Programme: Endline Programme Operations Performance – Final Report. Oxford, United Kingdom: Oxford Policy Management, 2016. [Google Scholar]
- Merttens F, Sindou E, Lipcan A, Pellerano L, Binci M, Ssewanyana S, et al.Evaluation of the Uganda Social Assistance Grants for Empowerment (SAGE) Programme: Impact After Two Years of Programme Operations 2012-2014: Final Report. Oxford, United Kingdom: Oxford Policy Management, 2016. [Google Scholar]
- Oxford Policy Management, University of Makerere.Evaluation of the Uganda Social Assistance Grants for Empowerment (SAGE) Programme: Baseline Report. Oxford, United Kingdom: Oxford Policy Management, 2013. [Google Scholar]
Shangani 2017 {published data only}
- Shangani S, Operario D, Genberg B, Kirwa K, Midoun M, Atwoli L, et al.Unconditional government cash transfers in support of orphaned and vulnerable adolescents in western Kenya: is there an association with psychological wellbeing? PLoS One 2017;12(5):e0178076. [DOI: 10.1371/journal.pone.0178076] [DOI] [PMC free article] [PubMed] [Google Scholar]
Zheng 2020 {published data only}
- Zheng XD, Fang XM, Brown DS.Social pensions and child health in rural China. Journal of Development Studies 2020;56(3):545-59. [DOI: 10.1080/00220388.2019.1577387] [DOI] [Google Scholar]
Additional references
Adato 2009
- Adato M, Bassett L.Social protection to support vulnerable children and families: the potential of cash transfers to protect education, health and nutrition. AIDS Care 2009;21(Suppl 1):60-75. [DOI] [PMC free article] [PubMed] [Google Scholar]
Alvaredo 2013
- Alvaredo F, Gasparini L.Chapter 10: Recent trends in inequality and poverty in developing countries. In: Atkinson A, Bourguignon F, editors(s). Handbook of Income Distribution. Vol. 2. Amsterdam, Netherlands and New York, NY: Elsevier, 2013. [Google Scholar]
Arnold 2011
- Arnold C, Conway T, Greenslade M.Cash Transfers Literature Review. London (UK): Department for International Development, 2011. [Google Scholar]
Awojobi 2020
- Awojobi ON, Adeniji OA, Abe JT.Is money important? The effects of conditional and unconditional cash transfer programmes on maternal health outcomes in Africa and Latin America. Journal of Community Medicine and Primary Health Care 2020;32(1):30-46. [Google Scholar]
Baird 2011
- Baird S, McIntosh C, Özler B.Cash or condition? Evidence from a cash transfer experiment. Quarterly Journal of Economics 2011;126(4):1709-53. [Google Scholar]
Baird 2012
- Baird SJ, Garfein RS, McIntosh CT, Özler B.Effect of a cash transfer programme for schooling on prevalence of HIV and herpes simplex type 2 in Malawi: a cluster randomised trial. Lancet 2012;379(9823):1320-9. [DOI] [PubMed] [Google Scholar]
Baird 2013
- Baird S, Ferreira FH, Özler B, Woolcock M.Relative effectiveness of conditional and unconditional cash transfers for schooling outcomes in developing countries: a systematic review. Campbell Systematic Reviews 2013;8.
Barrientos 2006
- Barrientos A, DeJong J.Reducing child poverty with cash transfers: a sure thing? Development Policy Review 2006;24(5):537-52. [Google Scholar]
Barrientos 2008
- Barrientos A, Hulme D.Social protection for the poor and poorest in developing countries: reflections on a quiet revolution. Manchester (UK): University of Manchester; 2008. BWPI Working Paper 30.
Bassani 2013
- Bassani DG, Arora P, Wazny K, Gaffey MF, Lenters L, Bhutta ZA.Financial incentives and coverage of child health interventions: a systematic review and meta-analysis. BMC Public Health 2013;13(Suppl 3):S30. [DOI] [PMC free article] [PubMed] [Google Scholar]
Benach 2010a
- Benach J, Solar O, Santana V, Castedo A, Chung H, Muntaner C, EMCONET Network.A micro-level model of employment relations and health inequalities. International Journal of Health Services 2010;40(2):223-7. [DOI] [PubMed] [Google Scholar]
Benach 2010b
- Benach J, Solar O, Vergara M, Vanroelen C, Santana V, Castedo A, et al, EMCONET Network.Six employment conditions and health inequalities: a descriptive overview. International Journal of Health Services 2010;40(2):269-80. [DOI] [PubMed] [Google Scholar]
Boccia 2012
- Boccia D, Hargreaves J, Lönnroth K, Jaramillo E, Weiss J, Uplekar M, et al.Cash transfer and microfinance interventions for tuberculosis control: review of the impact evidence and policy implications. International Journal of Tuberculosis and Lung Disease 2011;15(Suppl 2):S37-49. [DOI] [PMC free article] [PubMed] [Google Scholar]
Borjas 2013
- Borjas GJ.Labor Economics. 6th edition. New York (NY): McGraw-Hill Irwin, 2013. [Google Scholar]
Bradley 1977
- Bradley RH, Caldwell BM.Home observation for measurement of the environment: a validation study of screening efficiency. American Journal of Mental Deficiency 1977;81(5):417-20. [PubMed] [Google Scholar]
Cantoni 2020
- Cantoni D, Yuchtman N.Historical natural experiments: bridging economics and economic history. Cambridge, MA: National Bureau of Economic Research; 2020. NBER Working Paper No. 26754.
Centre for Reviews and Dissemination 2009
- Centre for Reviews and Dissemination.Systematic Reviews: CRD's Guidance for Undertaking Reviews in Health Care. York (UK): Centre for Reviews and Dissemination, 2009. [Google Scholar]
Coates 2007
- Coates J, Swindale A, Bilinsky P.Household Food Insecurity Access Scale (HFIAS) for Measurement of Food Access: Indicator Guide. Washington, DC: Food and Nutrition Technical Assistance III Project, 2007. [Google Scholar]
Cochrane EPOC 2012
- Cochrane Effective Practice and Organisation of Care (EPOC).Suggested risk of bias criteria for EPOC reviews. EPOC Resources for review authors, 2017. Available at: epoc.cochrane.org/resources/epoc-resources-review-authors (accessed 15 October 2017).
Cochrane Methods Equity Group 2022
- Cochrane Methods Equity Group.PROGRESS-Plus. Available at methods.cochrane.org/equity/projects/evidence-equity/progress-plus (accessed on 28 February 2022).
Cooper 2020
- Cooper JE, Benmarhnia T, Koski A, King NB.Cash transfer programs have differential effects on health: a review of the literature from low and middle-income countries. Social Science & Medicine 2020;247:112806. [DOI] [PubMed] [Google Scholar]
CPH 2011
- Cochrane Public Health.CPH Guide for Developing a Cochrane Protocol. (No longer available online) 2011.
Craig 2017
- Craig P, Katikireddi SV, Leyland A, Popham F.Natural experiments: an overview of methods, approaches, and contributions to public health intervention research. Annual Revue of Public Health 2017;38:39-56. [DOI: 10.1146/annurev-publhealth-031816-044327] [DOI] [PMC free article] [PubMed] [Google Scholar]
CSDH 2008
- Commission on Social Determinants of Health.Closing the Gap in a Generation: Health Equity Through Action on the Social Determinants of Health. Geneva (Switzerland): World Health Organization, 2008. [DOI] [PubMed] [Google Scholar]
Deeks 2020
- Deeks JJ, Higgins JP, Altman DG.Chapter 10: Analysing data and undertaking meta-analyses. In: Higgins JP, Thomas J, Chandler J, Cumpston M, Li T, Page MJ, et al (editors). Cochrane Handbook for Systematic Reviews of Interventions Version 6.1 (updated September 2020). Cochrane, 2020. Available from www.training.cochrane.org/handbook.
Delany 2008
- Delany A, Ismail Z, Graham L, Ramkissoon Y.Review of the Child Support Grant: Uses, Implementation and Obstacles. Johannesburg, South Africa: United Nations Children's Education Fund, 2008. [Google Scholar]
De Walque 2017
- De Walque D, Fernald L, Gertler P, Hidrobo M.Cash Transfers and Child and Adolescent Development. In: Bundy DA, Silva ND, Horton S, Jamison DT, Patton GC, editors(s). Child and Adolescent Health and Development. 3rd edition. Washintgon, DC: The International Bank for Reconstruction and Development / The World Bank, 2017:Chapter 23. [PubMed] [Google Scholar]
Diez‐Roux 2000
- Diez-Roux AV.Multilevel analysis in public health research. Annual Review of Public Health 2000;21:171-92. [DOI: 10.1146/annurev.publhealth.21.1.171] [DOI] [PubMed] [Google Scholar]
Dimick 2014
- Dimick JB, Ryan AM.Methods for evaluating changes in health care policy: the difference-in-differences approach. Journal of the American Medical Association 2014;312(22):2401-2. [DOI: 10.1001/jama.2014.16153] [DOI] [PubMed] [Google Scholar]
Doocy 2016
- Doocy S, Tappis H.Cash-based approaches in humanitarian emergencies: a systematic review. London (UK): International Initiative for Impact Evaluation (3ie); 2016. 3ie Systematic Review Report 28.
Durão 2020
- Durão S, Visser ME, Ramokolo V, Oliveira JM, Schmidt BM, Balakrishna Y, et al.Community-level interventions for improving access to food in low- and middle-income countries. Cochrane Database of Systematic Reviews 2020, Issue 8. Art. No: CD011504. [DOI: 10.1002/14651858.CD011504.pub3] [DOI] [PMC free article] [PubMed] [Google Scholar]
Eaton 2004
- Eaton WW, Muntaner C, Smith C, Tien A, Ybarra M.Center for Epidemiologic Studies Depression Scale: review and revision (CESD and CESD-R). In: Maruish ME, editors(s). The Use of Psychological Testing for Treatment Planning and Outcomes Assessment. 3rd edition. Mahwah (NJ): Lawrence Erlbaum, 2004:363-77. [Google Scholar]
Ekezie 2017
- Ekezie CC, Lamont K, Bhattacharya S.Are cash transfer programs effective in improving maternal and child health in sub-Saharan Africa? A systematic review of randomized controlled trials. Journal of Global Health 2017;7(1):[no pagination]. [DOI: 10.7916/thejgh.v7i1.5012] [DOI] [Google Scholar]
Filmer 2011
- Filmer D, Schady N.Does more cash in conditional cash transfer programs always lead to larger impacts on school attendance? Journal of Development Economics 2011;96(1):150-7. [DOI: 10.1016/j.jdeveco.2010.05.006] [DOI] [Google Scholar]
Fiszbein 2009
- Fiszbein A, Schady N.Conditional Cash Transfers: Reducing Present and Future Poverty. Washington, DC: World Bank, 2009. [Google Scholar]
Forde 2012
- Forde I, Rasanathan K, Krech R.Cash transfer schemes and the health sector: making the case for greater involvement. Bulletin of the World Health Organization 2012;90(7):551-3. [DOI] [PMC free article] [PubMed] [Google Scholar]
Friedman 2014
- Friedman J (World Bank, Washington, US).[personal communication]. Conversation with: F Pega (University of Otago, Wellington, New Zealand) 25 April 2014.
Gaarder 2010
- Gaarder MM, Glassman A, Todd J.Conditional cash transfers and health: unpacking the causal chain. Journal of Development Effectiveness 2010;2(1):6-50. [Google Scholar]
Gaarder 2012
- Gaarder M.Conditional versus unconditional cash: a commentary. Journal of Development Effectiveness 2012;4(1):130-3. [DOI: 10.1080/19439342.2012.658635] [DOI] [Google Scholar]
Garcia 2012
- Garcia M, Moore CM.The Cash Dividend: The Rise of Cash Transfer Programs in Sub-Saharan Africa. Washington, DC: World Bank, 2012. [Google Scholar]
Gibson 2018
- Gibson M, Thomson H, Banas K, Lutje V, McKee MJ, Martin SP, et al.Welfare-to-work interventions and their effects on the mental and physical health of lone parents and their children. Cochrane Database of Systematic Reviews 2018, Issue 2. Art. No: CD009820. [DOI: 10.1002/14651858.CD009820.pub3] [DOI] [PMC free article] [PubMed] [Google Scholar]
Global Humanitarian Assistance 2012
- Global Humanitarian Assistance.Tracking spending on cash transfer programming in a humanitarian context: briefing; March 2012. Available at: devinit.org/wp-content/uploads/2017/06/cash-transfer-financing-final.pdf.
Gorman 2007
- Gorman M.Defining a minimum income for healthy living (MIHL): older age, England - a comment on implications for application in the developing world. International Journal of Epidemiology 2007;36(6):1307-8. [DOI] [PubMed] [Google Scholar]
GRADEpro GDT [Computer program]
- GRADEpro GDT.Version accessed prior to 26 September 2017. Hamilton (ON): McMaster University (developed by Evidence Prime), 2015. Available at gradepro.org.
Greenland 2000
- Greenland S.An introduction to instrumental variables for epidemiologists. International Journal of Epidemiology 2000;29(4):722–729. [DOI: 10.1093/ije/29.4.722] [DOI] [PubMed] [Google Scholar]
Grosh 2008
- Grosh M, Ninno C, Tesliuc E, Ouerghi A.For Protection & Promotion: The Design and Implementation of Effective Safety Nets. Washington, DC: World Bank, 2008. [Google Scholar]
Hamermesh 2007
- Hamermesh DS.Replication in economics [Réplication en science économique]. Canadian Journal of Economics 2007;40(3):715-33. [DOI: 10.1111/j.1365-2966.2007.00428.x] [DOI] [Google Scholar]
Handa 2014
- Handa S, Park M, Osei-Darko R, Osei-Akoto I, Davis B, Daidone S.Livelihood Empowerment Against Poverty Program Impact Evaluation. Chapel Hill (NC): University of North Carolina, 2014. [Google Scholar]
Haushofer 2016
- Haushofer J, Shapiro J.The short-term impact of unconditional cash transfers to the poor: experimental evidence from Kenya. Quarterly Journal of Economics 2016;131(4):1973-2024. [DOI: 10.1093/qje/qjw025]] [PMID: ] [DOI] [PMC free article] [PubMed] [Google Scholar]
Heise 2013
- Heise L, Lutz B, Ranganathan M, Watts C.Cash transfers for HIV prevention: considering their potential. Journal of the International AIDS Society 2013;16(1):18615. [DOI] [PMC free article] [PubMed] [Google Scholar]
Higgins 2011
- Higgins JP, Deeks JJ, Altman JD.Chapter 16: Special topics in statistics. In: Higgins JP, Green S, editor(s). Cochrane Handbook for Systematic Reviews of Interventions Version 5.1.0 (updated March 2011). The Cochrane Collaboration, 2011. Available from www.handbook.cochrane.org.
Higgins 2020
- Higgins JP, Thomas J, Chandler J, Cumpston M, Li T, Page MJ, et al (editors).Cochrane Handbook for Systematic Reviews of Interventions Version 6.1 (updated September 2020). Cochrane, 2020. Available from www.training.cochrane.org/handbook.
Higgins 2021
- Higgins JP, Eldridge S, Li T.Chapter 23: Including variants on randomized trials. In: Higgins JP, Thomas J, Chandler J, Cumpston M, Li T, Page MJ, et al (editors). Cochrane Handbook for Systematic Reviews of Interventions Version 6.2 (updated February 2021). Cochrane, 2021. Available from www.training.cochrane.org/handbook.
Hjollund 2007
- Hjollund NH, Larsen FB, Andersen JH.Register-based follow-up of social benefits and other transfer payments: accuracy and degree of completeness in a Danish interdepartmental administrative database compared with a population-based survey. Scandinavian Journal of Public Health 2007;35(5):497-502. [DOI: 10.1080/14034940701271882] [DOI] [PubMed] [Google Scholar]
ILO 2013
- International Labour Organization.Programme of Assistance for the Elderly in Rural Zones, 2013. www.ilo.org/dyn/ilossi/ssimain.viewScheme?p_lang=en&p_geoaid=484&p_scheme_id=495 (accessed 8 January 2015).
Joyce 2010
- Joyce K, Pabayo R, Critchley JA, Bambra C.Flexible working conditions and their effects on employee health and wellbeing. Cochrane Database of Systematic Reviews 2010, Issue 2. Art. No: CD008009. [DOI: 10.1002/14651858.CD008009.pub2] [DOI] [PMC free article] [PubMed] [Google Scholar]
Kennedy 2011
- Kennedy G, Ballard T, Dop MC.Guidelines for Measuring Household and Individual Dietary Diversity. Rome: Food and Agriculture Organization of the United Nations, 2011. [Google Scholar]
Lagarde 2009
- Lagarde M, Haines A, Palmer N.The impact of conditional cash transfers on health outcomes and use of health services in low and middle income countries. Cochrane Database of Systematic Reviews 2009, Issue 4. Art. No: CD008137. [DOI: 10.1002/14651858.CD008137] [DOI] [PMC free article] [PubMed] [Google Scholar]
Leite 2019
- Leite TH, Moraes CL, Marques ES, Caetano R, Braga JU, Reichenheim ME.Women economic empowerment via cash transfer and microcredit programs is enough to decrease intimate partner violence? Evidence from a systematic review. Cadernos de Saúde Pública 2019;35(9):e00174818. [DOI] [PubMed] [Google Scholar]
Lundberg 2010
- Lundberg O, Fritzell J, Aberg Yngwe M, Kölgard ML.The potential power of social policy programmes: income redistribution, economic resources and health. International Journal of Social Welfare 2010;19:S2–S13. [Google Scholar]
Manley 2013
- Manley J, Gitter S, Slavchevska V.How effective are cash transfers at improving nutritional status? World Development 2013;48:133-55. [DOI: 10.1016/j.worlddev.2013.03.010] [DOI] [Google Scholar]
Manley 2020
- Manley J, Balarajan Y, Malm S, Harman L, Owens J, Murthy S, et al.Cash transfers and child nutritional outcomes: a systematic review and meta-analysis. BMJ Global Health 2020;5:e003621. [DOI] [PMC free article] [PubMed] [Google Scholar]
Marmot 2010
- Marmot M, Allen J, Goldblatt P, Boyce T, McNeish D, Grady M, et al.Fair Society, Healthy Lives: The Marmot Review. London: The Marmot Review, 2010. [Google Scholar]
Marmot 2012
- Marmot M, Allen J, Bell R, Bloomer E, Goldblatt P, Consortium for the European Review of Social Determinants of Health and the Health Divide.WHO European review of social determinants of health and the health divide. Lancet 2012;380(9846):1011-29. [DOI] [PubMed] [Google Scholar]
McDonough 2005
- McDonough P, Sacker A, Wiggins RD.Time on my side? Life course trajectories of poverty and health. Social Science & Medicine 2005;61(8):1795–808. [DOI] [PubMed] [Google Scholar]
McGuire 2022
- McGuire J, Bach-Mortensen AM, Kaiser C.The impact of cash transfers on subjective well-being and mental health in low- and middle-income countries: a systematic review and meta-analysis. Nature Human Behaviour 2022 Jan 20 [Epub ahead of print]. [DOI: 10.1038/s41562-021-01252-z] [PMID: ] [DOI] [PubMed]
McKenzie 2020
- McKenzie JE, Brennan SE.Chapter 12: Synthesizing and presenting findings using other methods. In: Higgins JP, Thomas J, Chandler J, Cumpston M, Li T, Page MJ, et al (editors). Cochrane Handbook for Systematic Reviews of Interventions Version 6.1 (updated September 2020). Cochrane, 2020. Available from www.training.cochrane.org/handbook.
Morris 2000
- Morris JN, Donkin AJ, Wonderling D, Wilkinson P, Dowler EA.A minimum income for healthy living. Journal of Epidemiology & Community Health 2000;54(12):885-9. [DOI] [PMC free article] [PubMed] [Google Scholar]
Morris 2007
- Morris JN, Wilkinson P, Dangour AD, Deeming C, Fletcher A.Defining a minimum income for healthy living (MIHL): older age, England. International Journal of Epidemiology 2007;36(6):1300-7. [DOI] [PubMed] [Google Scholar]
Ohrnberger 2020
- Ohrnberger J, Fichera E, Sutton M, Anselmi L.The effect of cash transfers on mental health - new evidence from South Africa. BMC Public Health 2020;20(1):436. [PMID: ] [DOI] [PMC free article] [PubMed] [Google Scholar]
Owusu‐Addo 2014
- Owusu-Addo E, Cross R.The impact of conditional cash transfers on child health in low- and middle-income countries: a systematic review. International Journal of Public Health 2014;59(4):609-18. [DOI: 10.1007/s00038-014-0570-x] [DOI] [PubMed] [Google Scholar]
Owusu‐Addo 2019
- Owusu-Addo E, Renzaho AM, Smith BJ.The impact of cash transfers on social determinants of health and health inequalities in sub-Saharan Africa: a systematic review. Health Policy & Planning 2018;33(5):675-96. [DOI] [PMC free article] [PubMed] [Google Scholar]
Painter 2016
- Painter A.A universal basic income: the answer to poverty, insecurity, and health inequality? BMJ 2016;355:i6473. [DOI: 10.1136/bmj.i6473] [DOI] [PubMed] [Google Scholar]
Pega 2012
- Pega F, Blakely T, Carter K, Sjöberg O.The explanation of a paradox? A commentary on Mackenbach with perspectives from research on financial credits and risk factor trends. Social Science & Medicine 2012;75(4):770-3. [DOI] [PubMed] [Google Scholar]
Pega 2013
- Pega F, Carter K, Blakely T, Lucas P.In-work tax credits for families and their impact on health status in adults. Cochrane Database of Systematic Reviews 2013, Issue 8. Art. No: CD009963. [DOI: 10.1002/14651858.CD009963.pub2] [DOI] [PMC free article] [PubMed] [Google Scholar]
Pega 2015a
- Pega F, Liu SY, Walter S, Lhachimi S.Unconditional cash transfers for assistance in humanitarian disasters: effect on use of health services and health outcomes in low- and middle-income countries. Cochrane Database of Systematic Reviews 2015, Issue 9. Art. No: CD011247. [DOI: 10.1002/14651858.CD011247.pub2] [DOI] [PMC free article] [PubMed] [Google Scholar]
Pega 2015b
- Pega F, Shaw C, Rasanathan K, Yablonski J, Kawachi I, Hales S.Climate change, cash transfers and health. Bulletin of the World Health Organization 2015;93(8):559-65. [DOI: 10.2471/BLT.14.150037] [DOI] [PMC free article] [PubMed] [Google Scholar]
Pega 2016a
- Pega F, Blakely T, Glymour MM, Carter KN, Kawachi I.Using marginal structural modeling to estimate the cumulative impact of an unconditional tax credit on self-rated health. American Journal of Epidemiology 2016;183(4):315-24. [DOI: 10.1093/aje/kwv211] [DOI] [PubMed] [Google Scholar]
Pega 2016b
- Pega F.Using financial credits as instrumental variables for estimating the causal relationship between income and health. American Journal of Epidemiology 2016;183(9):785-9. [DOI: 10.1093/aje/kwv312] [DOI] [PubMed] [Google Scholar]
Pettifor 2012
- Pettifor A, MacPhail C, Nguyen N, Rosenberg M.Can money prevent the spread of HIV? A review of cash payments for HIV prevention. AIDS & Behavior 2012;16(7):1729-38. [DOI] [PMC free article] [PubMed] [Google Scholar]
Raudenbush 2001
- Raudenbush SW.Comparing personal trajectories and drawing causal inferences from longitudinal data. Annual Review of Psychology 2001;52:501-25. [DOI: 10.1146/annurev.psych.52.1.501] [DOI] [PubMed] [Google Scholar]
Raudenbush 2002
- Raudenbush SW, Bryk AS.Hierarchical Linear Models: Applications and Data Analysis Methods. 2nd edition. Thousand Oaks (CA): Sage Publications Inc, 2002. [Google Scholar]
RevMan Web 2020 [Computer program]
- Review Manager Web (RevMan Web).Version 1.22.0. The Cochrane Collaboration, 2020. Available at revman.cochrane.org.
Richterman 2018
- Richterman A, Steer-Massaro J, Jarolimova J, Luong Nguyen LB, Werdenberg J, Ivers LC.Cash interventions to improve clinical outcomes for pulmonary tuberculosis: systematic review and meta-analysis. Bulletin of the World Health Organization 2018;96(7):471-83. [DOI] [PMC free article] [PubMed] [Google Scholar]
Robertson 2013
- Robertson L, Mushati P, Eaton JW, Dumba L, Mavise G, Makoni J, et al.Effects of unconditional and conditional cash transfers on child health and development in Zimbabwe: a cluster-randomised trial. Lancet 2013;381(9874):1283-92. [DOI] [PMC free article] [PubMed] [Google Scholar]
Schubert 2006
- Schubert B, Slater R.Social cash transfers in low-income African countries: conditional or unconditional? Development Policy Review 2006;24(5):571-8. [Google Scholar]
Scientific Software International 2015 [Computer program]
- Hierarchical Linear Modeling Software.Scientific Software International. Skokie (IL): Scientific Software International, 2015.
Shemilt 2011
- Shemilt I, Mugford M, Byford S, Drummond M, Eisenstein E, Knapp M, on behalf of the Campbell and Cochrane Economics Methods Group.Chapter 15: Incorporating economics evidence. In: Higgins JP, Green S (editors). Cochrane Handbook for Systematic Reviews of Interventions Version 5.1.0 (updated March 2011). The Cochrane Collaboration, 2011. Available from www.handbook.cochrane.org.
Siddiqi 2018
- Siddiqi A, Rajaram A, Miller SP.Do cash transfer programmes yield better health in the first year of life? A systematic review linking low-income/middle-income and high-income contexts. Archives of Disease in Childhood 2018;103(10):920-6. [DOI] [PubMed] [Google Scholar]
Sjöberg 2010
- Sjöberg O.Social insurance as a collective resource: unemployment benefits, job insecurity and subjective wellbeing in a comparative perspective. Social Forces 2010;88(3):1281–304. [Google Scholar]
Sridhar 2006
- Sridhar D, Duffield A.A review of the impact of cash transfer programmes on child nutrition status and some implications for Save the Children UK programmes. London: Save The Children, 2006. [Google Scholar]
StataCorp 2015 [Computer program]
- Stata.StataCorp, Version 14. College Station (TX): StataCorp, 2015. Available at www.stata.com.
Stover 2007
- Stover J, Bollinger L, Walker N, Monasch R.Resource needs to support orphans and vulnerable children in sub-Saharan Africa. Health Policy and Planning 2007;22(1):21-7. [DOI] [PubMed] [Google Scholar]
Ueffing 2012
- Ueffing E, Tugwell P, Welch V, Petticrew M, Kristjansson E, on behalf of the Campbell and Cochrane Equity Methods Group.Equity Checklist for Systematic Review Authors. Version 2012-10-02. equity.cochrane.org/sites/equity.cochrane.org/files/uploads/EquityChecklist2012.pdf (accessed 5 May 2014).
UNGA 2015
- United Nations General Assembly.Transforming Our World: The 2030 Agenda for Sustainable Development (A/RES/70/1). New York, NY: United Nations, 2015. [Google Scholar]
UNICEF 2015
- United Nations Children's Fund.Nutrition: definitions of the indicators. UNICEF, 2015. www.unicef.org/infobycountry/stats_popup2.html (accessed prior to 26 September 2017).
UNRISD 2010
- United Nations Research Institute for Social Development.Combating Poverty and Inequality: Structural Change, Social Policy and Politics. Geneva, Switzerland: United Nations Research Institute for Social Development, 2010. [Google Scholar]
VanderWeele 2009
- VanderWeele TJ.Concerning the consistency assumption in causal inference. Epidemiology 2009;20(6):880-3. [DOI: 10.1097/EDE.0b013e3181bd5638] [DOI] [PubMed] [Google Scholar]
Wang 2019
- Wang H, Qiu F, Luo J.Impact of unconditional cash transfers: a replication study of the short-term effects in Kenya. Washington, DC: International Initiative for Impact Evaluation (3ie), 2018. 3ie Replication Paper 20.
Whiting 2016
- Whiting P, Savović J, Higgins JP, Caldwell DM, Reeves BC, Shea B, et al.ROBIS: A new tool to assess risk of bias in systematic reviews was developed. Journal of Clinical Epidemiology 2016;69:225-34. [DOI: 10.1016/j.jclinepi.2015.06.005] [DOI] [PMC free article] [PubMed] [Google Scholar]
WHO 2011
- World Health Organization.Closing the Gap: Policy into Practice on Social Determinants of Health: Discussion Paper. Geneva, Switzerland: World Health Organization, 2011. [Google Scholar]
WHO 2016
- World Health Organization.Nutrition: moderate malnutrition. www.who.int/nutrition/topics/moderate_malnutrition/en/ (accessed 14 July 2016).
WHO 2021
- WHO.Global Health Estimates: Life expectancy and leading causes of death and disability. www.who.int/data/gho/data/themes/mortality-and-global-health-estimates (accessed prior to 22 February 2022).
Wing 2018
- Wing C, Simon K, Bello-Gomez RA.Designing difference in difference studies: best practices for public health policy research. Annual Review of Public Health 2018;39:453-469. [DOI: 10.1146/annurev-publhealth-040617-013507] [DOI] [PubMed] [Google Scholar]
Wooldridge 2010
- Wooldridge JM.Econometric Analysis of Cross Section and Panel Data. 2nd edition. Cambridge, MA: MIT Press, 2010. [Google Scholar]
World Bank 2006
- World Bank.Ecuador - Bono de Desarrollo Humano Project. World Bank, 2006. www.documents.worldbank.org/curated/en/2006/04/6704730/ecuador-bono-de-desarrollo-humano-project (accessed 8 July 2015).
World Bank 2012
- World Bank.A ten-year strategy to support the development of social protection systems in Sub-Saharan Africa. World Bank, 2012. www.worldbank.org/en/news/feature/2012/12/18/a-ten-year-strategy-to-support-the-development-of-social-protection-systems-in-sub-saharan-africa (accessed 27 May 2014).
World Bank 2020a
- World Bank.Poverty and Shared Prosperity 2020: Reversals of Fortune. Washington, DC: World Bank, 2020. [DOI: 10.1596/978-1-4648-1602-4] [DOI] [Google Scholar]
World Bank 2020b
- World Bank.Country and lending groups. datahelpdesk.worldbank.org/knowledgebase/articles/906519-world-bank-country-and-lending-groups (accessed 28 February 2021).
Yesavage 1982
- Yesavage JA, Brink TL, Rose TL, Lum O, Huang V, Adey M, et al.Development and validation of a geriatric depression screening scale: a preliminary report. Journal of Psychiatric Research 1982;17(1):37-49. [DOI] [PubMed] [Google Scholar]
Zimmerman 2021
- Zimmerman A, Garman E, Avendano M, Araya R, Evans-Lacko S, McDaid D, et al.The impact of cash transfers on mental health in children and young people in low- and middle-income countries: a systematic review and meta-analysis. BMJ Global Health 2021;6(4):e004661. [DOI: 10.1136/bmjgh-2020-004661] [PMID: ] [DOI] [PMC free article] [PubMed] [Google Scholar]
References to other published versions of this review
Pega 2014
- Pega F, Walter S, Liu SY, Pababyo R, Lhachimi SK, Saith R.Unconditional cash transfers for reducing poverty and vulnerabilities: effect on use of health services and health outcomes in low- and middle-income countries. Cochrane Database of Systematic Reviews 2014, Issue 6. Art. No: CD011135. [DOI: 10.1002/14651858.CD011135] [DOI] [PMC free article] [PubMed] [Google Scholar]
Pega 2017
- Pega F, Liu SY, Walter S, Pabayo R, Saith R, Lhachimi SK.Unconditional cash transfers for reducing poverty and vulnerabilities: effect on use of health services and health outcomes in low- and middle-income countries. Cochrane Database of Systematic Reviews 2017, Issue 11. Art. No: CD011135. [DOI: 10.1002/14651858.CD011135.pub2] [DOI] [PMC free article] [PubMed] [Google Scholar]