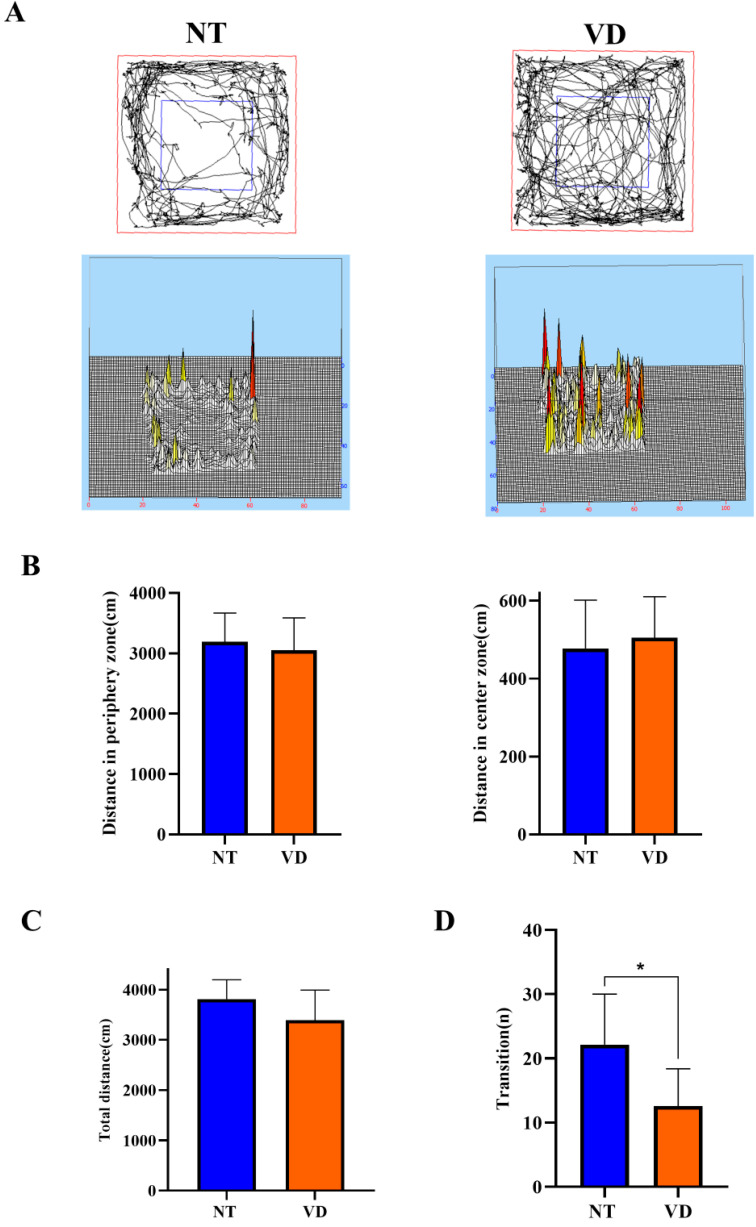
Figure 5.
A depiction of the open field test and the light and dark test (NT [normal type]: control group, VD [vascular dementia]: BCAS [bilateral carotid artery stenosis] model group). (A) Smart 3.0 analysis program data (left: NT, right: VD). (B) Differences in the distance moved between the peripheral zone (NT, 3192.1 cm; VD, 3050.2 cm) and the central zone (NT, 483 cm; VD, 521.8 cm) (C) Differences between groups in the total distance moved in the open field test. (D) Differences between groups in the number of transitions in the light/dark transition test, * p < 0.05. Data are expressed as means ± standard deviations (SD).

