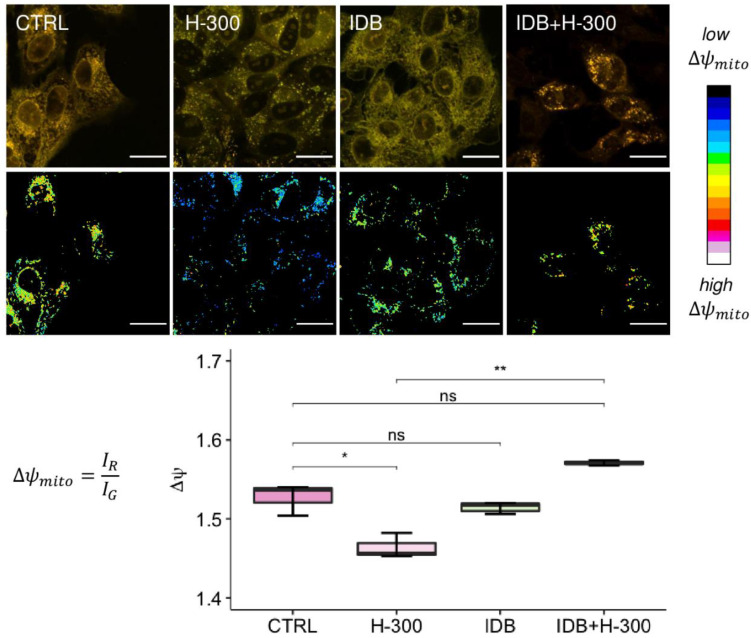
Figure 4.
The role of idebenone against H2O2-induced mitochondrial depolarization. The panel shows, in the first row, representative images of ARPE-19 cells stained with JC-1 under different conditions (untreated, CTRL; 300 µM H2O2, H-300; Idebenone, IDB; and pre-treated with idebenone 24 h before H2O2, IDB + H-300), together with the ratio maps of mitochondrial membrane potential, in the second row. In the composite confocal images, the fluorescence signal from monomers is represented in green (emission: 525/50 nm), while the red channel (emission: 595/50 nm) collects the signal from aggregates. In the mitochondrial membrane potential maps, each pixel is colored according to the red/green fluorescence intensity ratio, with black pixels representing low R/G values (i.e., mitochondrial depolarization) and white pixels representing high values of the R/G ratio (i.e., mitochondrial hyperpolarization). The scale bar is 20 µm. The distribution of the R/G values, corresponding to the mitochondrial membrane potential, are reported in the box plot (y-axis) for each sample (x-axis). One-way ANOVA analysis was carried out with post hoc Tukey’s test for multiple group comparisons (* p < 0.05; ** p < 0.01; ns = not statistically significant).

