

Abstract
Background
Artificial intelligence (AI) applications for cancer imaging conceptually begin with automated tumor detection, which can provide the foundation for downstream AI tasks. However, supervised training requires many image annotations, and performing dedicated post hoc image labeling is burdensome and costly.
Purpose
To investigate whether clinically generated image annotations can be data mined from the picture archiving and communication system (PACS), automatically curated, and used for semisupervised training of a brain MRI tumor detection model.
Materials and Methods
In this retrospective study, the cancer center PACS was mined for brain MRI scans acquired between January 2012 and December 2017 and included all annotated axial T1 postcontrast images. Line annotations were converted to boxes, excluding boxes shorter than 1 cm or longer than 7 cm. The resulting boxes were used for supervised training of object detection models using RetinaNet and Mask region-based convolutional neural network (R-CNN) architectures. The best-performing model trained from the mined data set was used to detect unannotated tumors on training images themselves (self-labeling), automatically correcting many of the missing labels. After self-labeling, new models were trained using this expanded data set. Models were scored for precision, recall, and F1 using a held-out test data set comprising 754 manually labeled images from 100 patients (403 intra-axial and 56 extra-axial enhancing tumors). Model F1 scores were compared using bootstrap resampling.
Results
The PACS query extracted 31 150 line annotations, yielding 11 880 boxes that met inclusion criteria. This mined data set was used to train models, yielding F1 scores of 0.886 for RetinaNet and 0.908 for Mask R-CNN. Self-labeling added 18 562 training boxes, improving model F1 scores to 0.935 (P < .001) and 0.954 (P < .001), respectively.
Conclusion
The application of semisupervised learning to mined image annotations significantly improved tumor detection performance, achieving an excellent F1 score of 0.954. This development pipeline can be extended for other imaging modalities, repurposing unused data silos to potentially enable automated tumor detection across radiologic modalities.
© RSNA, 2022

Summary
Semisupervised training using existing tumor annotations drawn by radiologists during their routine clinical work yielded tumor detection models achieving excellent performance (maximum precision, 96.0% [431 of 449]; recall, 93.7% [431 of 460]; F1 score, 0.954).
Key Results
■ Data mining our picture archiving and communication system yielded a T1-weighted postcontrast axial image data set containing 11 880 bounding boxes for model training and testing.
■ Baseline tumor detection models achieved F1 scores of 0.886 (RetinaNet) and 0.908 (Mask region-based convolutional neural network) on a held-out test data set.
■ A self-labeling method for correcting unlabeled tumors in the training data set yielded an additional 18 562 bounding boxes, improving model F1 scores to 0.935 (P < .001) and 0.954 (P < .001), respectively.
Introduction
Artificial intelligence (AI) applications for cancer imaging conceptually begin with automated tumor detection, which provides the foundation for downstream AI tasks (1). For example, a detected tumor can provide the input for a classifier model to predict mutation status or facilitate instance segmentation (2) using a segment proposal convolutional neural network (CNN) architecture like Mask region-based CNN (R-CNN) (3). Object detection is also a prerequisite for object tracking (4), a deep learning method potentially adaptable to automate longitudinal tumor tracking for treatment response assessment.
Thus, achieving machine awareness of a tumor location in radiologic imaging has value well beyond potential computer-aided detection applications. However, multiple challenges remain in developing robust tumor detection models, including the wide variation in tumor appearance on radiologic images and the confounding results of scanner and protocol variability. Although Food and Drug Administration–approved tumor detection tools have entered the marketplace, the generalizability limitations of externally trained models are well known (5–8), presenting a roadblock to realizing the transformative power of AI in radiology.
In seeking to address generalizability challenges, several efforts are under way in the radiology AI community to encourage large, multi-institutional image training data sets, including open AI challenges leveraging public data sets (9,10), interinstitutional data sharing initiatives (11), and federated deep learning platforms (12). A simpler approach is to leverage internal training data to develop in-house models or fine tune external models (13); however, the time and effort required to perform ad hoc image labeling are often prohibitive.
Harnessing image annotations continuously generated within an existing workflow, such as tumor line measurements, presents a potentially superior solution. Previously, efforts have focused on leveraging either two-dimensional response evaluation criteria in solid tumor annotations generated within formal clinical trials (which may remain the intellectual property of the external trial sponsor) (14) or small manually segmented tumor data sets created for radiation therapy planning (15). Data mining existing tumor line annotations residing within a clinical picture archiving and communication system (PACS) can expose large annotation data sets, but this introduces challenges of data noise, incomplete image labeling, and the unfeasibility of performing comprehensive manual quality assurance of the mined data. These challenges potentially could be addressed with, respectively, the use of fully automated data curation, semisupervised learning to perform automated annotation correction, and model scoring using smaller manually verified test data sets.
The purpose of our study was to investigate whether clinically generated image annotations can be data mined from the PACS, automatically curated, and used for semisupervised training of a brain MRI tumor detection model.
Materials and Methods
This retrospective study was approved by the local institutional review board, and the need for written informed consent was waived. All data storage and handling were performed in compliance with Health Insurance Portability and Accountability Act regulations.
PACS Data Mining
The PACS (Centricity PACS, version 6.0; GE Healthcare) at our institution was mined to identify all brain MRI scans acquired at our center from January 2012 to December 2017 that contained at least one line annotation. All Digital Imaging and Communications in Medicine (DICOM) files corresponding with these scans were extracted, deidentified, stored in our XNAT research server (https://www.xnat.org) (16), and mounted to our research computing platform. An in-house software tool extracted the line annotation data from the DICOM gray-scale presentation state objects (17).
Automated Data Curation and Bounding Box Generation
An automated data curation pipeline was constructed to isolate line annotation data referencing axial T1-weighted postcontrast images, geometrically square the lines to generate bounding boxes, and merge overlapping boxes. Resulting boxes that were less than 1 cm in length were excluded, as most of our center’s brain MRI scans have a section thickness of 0.5 cm, and very small lesions would likely require the use of a three-dimensional object detection model. Furthermore, subcentimeter lesions were considered likely too small for accurate downstream AI tasks like classification. Bounding boxes longer than 7 cm were also excluded, as very long lines are often drawn at the expected midline to measure brain midline shift instead of to directly measure tumor size.
Because of the fully automated scalable design of this data mining and curation pipeline, all annotations meeting the inclusion criteria (referencing axial T1-weighted postcontrast images and bounding box length ≥1 cm and ≤7 cm) were used regardless of the clinical indication for the examination or the patient’s treatment status.
Mined Annotation Subset Visual Inspection
Given the unfeasibility of performing comprehensive manual inspection of the large mined data set and corresponding generated bounding boxes, 500 images were randomly selected from the data set for formal manual review. All line and bounding box annotations were visually inspected by an author (N.C.S., 7 years of neuroradiology experience) and were categorized as follows: intraparenchymal lesion, leptomeningeal lesion, extra-axial lesion, nontumor disease, or artifact or spurious annotation.
Data Set Balancing and Splitting
To mitigate model bias and improve detection performance, the annotated training image set was augmented with non–tumor-containing images to balance the data set. Augmentation was performed automatically as follows: Because in most cases a given tumor’s line measurements are drawn by the radiologist through the maximum plane of the tumor on one section, image sections through adjacent portions of the tumor are typically unlabeled. We assumed that the length of a tumor’s bounding box approximated the missing out-of-plane z size of the tumor and extrapolated the bounding boxes superiorly and inferiorly to adjacent axial image sections.
For each annotated image from the original mined data set, one image from the same series was randomly selected, excluding images with either mined or extrapolated bounding boxes, and labeled as non–tumor containing. This balanced data set was then randomly split by patient into training (n = 3303, 80%), validation (n = 413, 10%), and held-out initial test (n = 412, 10%) data sets.
Establishing a Reference Standard Test Data Set
Because of the incomplete tumor labeling inherent in clinically derived image annotations, test images were manually corrected to establish a true reference standard with which to assess model performance. A subset of 100 patients from the initial test data set was randomly selected. All corresponding images for these selected patients were imported into the Visual Geometry Group Image Annotator (18), and all enhancing tumors were manually annotated with line measurements (N.C.S.). Non–tumor-containing images were manually verified as containing no tumors. These manually corrected label data were then processed using the previously mentioned automated data curation and bounding box generation pipeline, creating the reference standard test data set.
Tumor Detection Model Training and Testing
Two two-dimensional object detection artificial neural network architectures were compared: a single-shot detector, RetinaNet (19), and a two-shot detector, Mask R-CNN (3). In general, as compared with two-shot detection architectures, single-shot architectures achieve faster training and inference speeds at the potential cost of lower detection performance (20). Additional training details are included in Appendix E1 (online).
All trained models were evaluated using the held-out test data set. A minimum intersection-over-union (IoU) threshold of 0.4 was required for a detection to count as a match with respect to the ground truth bounding boxes. This IoU threshold was chosen to balance a rigorous bar of assessment with the high sensitivity of IoU to very small deviations in box overlap. As an example, for a hypothetical 1-cm-diameter spherical tumor represented in cross section by a 1 cm × 1 cm (10 × 10 pixel) square ground truth bounding box, a predicted box offset by only two pixels in each direction versus the reference box would achieve an IoU of 0.47; a predicted box offset by three pixels would achieve an IoU of just 0.32.
Performance metrics collected were precision, recall, and F1 score; all were calculated on a per-lesion basis. For each model, the confidence threshold yielding the highest F1 score was selected. Differences in F1 scores across the four models were compared using bootstrap resampling (Appendix E1 [online]).
Training Data Self-Labeling
To contend with the incomplete labeling of tumors in our training data set, the best-performing model trained from our mined data set was then used to detect unannotated tumors on the full axial image stacks, including the training images themselves (self-labeling), automatically correcting a subset of the missing labels on these images. A relatively high minimum confidence threshold of 0.5 was used to minimize the risk of false-positive boxes contaminating the training data set at the expense of more false-negative results. An IoU of less than 0.4 as compared with existing training set bounding boxes was required to avoid duplicating labels. After each self-labeling cycle, a new model of each architecture was trained from scratch using this newly expanded training data set. These models were also scored using the held-out test data set.
As with the baseline-mined annotated image data set, interrogation of the final self-labeled image set was performed by randomly selecting 500 images and visually inspecting and categorizing all image annotations generated by the self-labeling process.
Bounding Box Pooling
A final postprocessing step was added to enable machine understanding of tumors in three dimensions and to facilitate subsequent AI tasks. This step converts the individual two-dimensional tumor bounding boxes predicted by the detection models into three-dimensional bounding cubes containing the entire tumor volume. This was achieved by linking boxes on adjacent images that overlapped in their x and y image coordinates (IoU ≥ 0.2, selected empirically to balance lesion continuity with avoiding linkage of adjacent but noncontiguous lesions) and automatically applying lesion identifications for internal tracking. These volumetric tumor detections could then serve as input for AI models performing further processing, including three-dimensional segmentation and treatment response assessment.
Results
The PACS query extracted 31 150 individual axial postcontrast T1-weighted image line annotations from 9797 individual MRI brain scans, yielding 11 880 boxes meeting inclusion criteria (Fig 1). A representative transformation of mined image line annotations into a bounding box is shown in Figure 2. The combined training and testing data sets included images from 3816 patients (mean age, 58 years ± 17 [standard deviation]; 2157 [57%] women, 1659 [43%] men). Patients’ primary malignancies varied widely, with lung adenocarcinoma, glioblastoma, and breast ductal carcinoma being the most common solitary cancer diagnoses. The mean bounding box length in the mined annotation data set was 2.00 cm ± 1.20. Patient characteristics are shown in Table 1. Manual inspection of the randomly selected mined image subset demonstrated that most annotations represented intraparenchymal (357 of 542 [65.9%]) or extra-axial (172 of 542 [31.7%]) tumors (Table 2).
Figure 1:

Flow diagram shows data inclusion and exclusion criteria for the baseline training and test data sets. Additional image annotations were subsequently added to the training data set via the self-labeling method, as described. T1C+ = postcontrast T1-weighted images.
Figure 2:

Example of the automated line annotation to bounding box transformation. (A) The cystic and solid high-grade glioma is annotated with two line measurements mined from the picture archiving and communication system. (B) The curation pipeline geometrically squares the line annotations to generate two overlapping bounding boxes. (C) These, in turn, are converted to a single bounding box encompassing the entire lesion.
Table 1:
Patient Characteristics
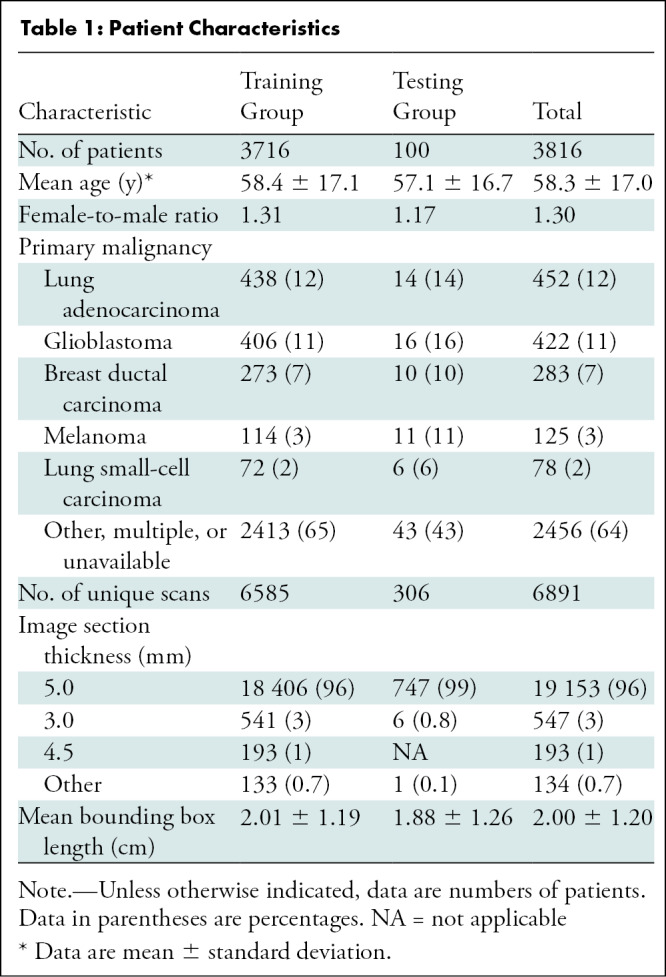
Table 2:
Bounding Box Subset Manual Review

The mined training data set included 10 623 bounding boxes (on 9891 tumor-containing images) and 9382 nontumor-containing images from 3716 unique patients. The reference standard test data set consisted of 967 line annotations yielding 459 bounding boxes (403 intra-axial lesions and 56 extra-axial lesions on 378 tumor-containing images) and 376 non–tumor-containing images from 100 unique patients. No patient overlap existed between the test data set and either the mined or self-labeling expanded training data sets.
The mined data set was used to train baseline models attaining F1 scores of 0.886 (RetinaNet) and 0.908 (Mask R-CNN) (Table 3). The Mask R-CNN model was selected for self-labeling and identified an additional 18 562 boxes on 213 652 total axial postcontrast T1-weighted images over 12 self-labeling cycles (Fig 3). Manual inspection of the randomly selected self-labeled image subset demonstrated most annotations corresponded with intraparenchymal (446 of 571 [78.1%]) and extra-axial (86 of 571 [15.1%]) tumors, with few (32 of 571 [5.6%]) false-positive findings.
Table 3:
Tumor Detection Performance Results

Figure 3:

(A) Schematic drawing of the semisupervised learning (self-labeling) approach to automated tumor detection. The baseline model trained from noisy incompletely labeled mined images is used to identify unlabeled tumors on an expanded training image set containing 213 652 axial postcontrast T1-weighted images. After this cycle, a new detection model is trained from scratch using the expanded bounding box training data set, which is used to identify additional unlabeled tumors on the training image set. Twelve self-labeling cycles were completed, increasing the number of training bounding boxes from 10 623 to 29 185. (B) Example training bounding boxes added during self-labeling process. Blue boxes represent new lesion annotations added during self-labeling. Green boxes are baseline training annotations automatically generated from line annotations mined from the picture archiving and communication system.
The expanded training data set formed by combining the original mined training set with the self-labeled image set (29 185 total bounding boxes) yielded models with F1 scores of 0.935 (RetinaNet) and 0.954 (Mask R-CNN). Precision-recall and free-response receiver operating characteristic curves for each model are included in Figure 4. Pairwise comparisons of model F1 scores are included in Table 4.
Figure 4:

(A) Precision-recall and (B) free-response receiver operating characteristic curves for each detection model. AUC = area under the receiver operating characteristic curve, R-CNN = region-based convolutional neural network.
Table 4:
Pairwise Comparison of Model F1 Scores Using Bootstrap Resampling

Representative true- and false-positive predictions for the best-performing model, Mask R-CNN trained with the self-labeling expanded data set, are shown in Figure 5. The 29 false-negative findings consisted of 16 intraparenchymal (including seven ill-defined heterogeneously enhancing lesions and five faintly enhancing lesions), nine extra-axial, and four leptomeningeal lesions. The 18 false-positive findings included four detections corresponding with choroid plexus, two corresponding with venous sinuses in cross section, and two corresponding with looping small vessels.
Figure 5:

Representative false-positive and false-negative predictions from the best-performing Mask region-based convolutional neural network detection model trained using the self-labeling expanded training data set. (A) False-positive predictions included choroid plexus (top left and top right), superior sagittal sinus imaged in cross section (bottom right), small vessel loops (top middle), petrous apex (bottom left), and apparent artifact within the mobile tongue (bottom middle). (B) False-negative predictions included extra-axial tumors (top right, bottom left, and bottom middle), probably reflecting a relatively limited representation of these types of lesions within the training data set, and faintly enhancing (top left) and leptomeningeal (top middle and bottom right) lesions. Solid boxes represent ground truth, and dashed boxes represent model predictions. White solid boxes are correctly detected ground truth boxes. Red solid boxes are for false-negative predictions. Red dashed boxes are for false-positive predictions. Dashed blue boxes are for true-positive predictions.
Average inference time on a central processing unit by the Mask R-CNN detection model trained on the expanded data set was 1.08 msec for one image. An example of three-dimensional lesion detections generated automatically by the bounding box pooling postprocessing step is shown in Figure 6.
Figure 6:

Example of three-dimensional lesion identifications after automatic linking of adjacent two-dimensional boxes. Several consecutive held-out test images from one MRI series are shown through the posterior fossa, simulating model performance on a full stack of contiguous axial postcontrast T1-weighted images. Yellow boxes denote the predictions of the Mask region-based convolutional neural network model after self-labeling. Each prediction box includes an automatically generated lesion identification and confidence score. Green boxes denote ground truth annotations generated from mined tumor line annotations.
Discussion
In this investigation, we achieved excellent performance in automated tumor detection using only mined historical image annotations as training data. The use of mined training data alone yielded highly accurate baseline detection models despite the noise and incomplete labeling typical of clinically derived data. Subsequent self-labeling to automatically correct missing lesion annotations translated into a significant performance boost over the baseline models, with a maximum F1 score of 0.954. For both the mined and the self-labeling expanded training data sets, the Mask region-based convolutional neural network significantly outperformed RetinaNet.
Although previous radiologic applications of semisupervised learning for detection and segmentation have typically used highly curated public (21,22) or ad hoc manually labeled (23) training sets, we investigated the viability of mining clinically generated annotations for semisupervised learning. The limitations inherent in using noisy image labels without manual curation were largely overcome by the automated scalable curation pipeline, which captured a large initial training data set, and the subsequent use of self-labeling to automatically clean and expand the training set. Visual inspection of self-labeled annotations demonstrated an excellent 94.4% (539 of 571) positive predictive value while more than doubling the size of the initial training set. The use of semisupervised learning to clean noisily labeled data is a valuable potential solution for big data initiatives leveraging radiologic data.
The ability to harness weak image labels generated within a routine clinical radiology workflow has several important advantages over ad hoc efforts to generate model training data sets. Foremost, because radiologists routinely use standard PACS line measurement during their daily clinical work, there is a high likelihood of large annotation repositories residing within legacy PACS, which can be tapped to enable the quick development of institution-specific tumor detection models. Although our immediate project addresses enhancing tumor detection on brain MRI scans, our pipeline could be easily extended to other imaging modalities, potentially enabling the rapid development of automated tumor detection capabilities across a radiology department.
There is no incremental cost in time and effort for radiologists to generate the image label substrate that powers this semisupervised learning approach. Tumor line measurements are drawn quickly and yield critical size information needed for the radiology report. This persistent source of new training data can address the deleterious impacts of target data shift—the likelihood that a static trained model will degrade in performance as the data it is analyzing changes in characteristics. Potential causes of data shift in oncologic imaging include the acquisition of new scanners (24,25), modifications to imaging protocols, changing patient demographics, and the evolution of cancer therapies. The ability of our pipeline to establish a wellspring of new training data offers a potential solution to these inevitable data shifts.
There are several potential limitations to this investigation. First, sufficient quantities of historical tumor annotations must exist in PACS to train the baseline detection models and enable semisupervised learning. Although this may not be the case for radiology practices lacking robust oncology programs, such practices would also benefit less from this use case. Furthermore, the automated saving of image annotations in PACS typically depends on individual user or site level settings and is otherwise a manual process performed inconsistently by the radiologist, potentially limiting the yield of PACS data mining, even in large legacy archives. Second, our pipeline assumes that most line measurements extracted from PACS are drawn to measure tumors. This may not be the case outside of dedicated cancer centers, where line annotations drawn on brain images may be more commonly performed to measure acute abnormalities, such as infarcts or hematomas, and resultant trained models would instead learn to identify these acute findings. In these cases, an initial image classifier model could be trained to first automatically curate mined annotations, isolating the subset of tumor annotations for training (26). Next-generation PACS solutions could obviate this classifier by enabling the radiologist to assign simple categorizations at the time of image annotation, underscoring the important role vendors will play in the maturation of radiology AI. Third, the method used to automatically balance the proportions of tumor-containing and non–tumor-containing images resulted in training and test data sets containing only images from scans that had at least one line annotation meeting the inclusion criteria, with an estimated 98.9% (536 of 542) of these annotations representing tumors. The non–tumor-containing images included a combination of relatively normal-appearing and posttreatment (chemotherapy, radiation therapy, and surgery) brain images. Although this approach was chosen to lower the likelihood of the models being biased by background treatment changes, performance on completely normal brain MRI scans requires further investigation. Fourth, the exclusion of subcentimeter tumors from the training and test data sets limits the potential role of the model purely as a computer-aided detection tool because radiologists are much more likely to miss small tumors than large tumors. A separate model dedicated to small-lesion detection could be developed using these methods and deployed in parallel with the current model.
Although our development pipeline is fully automated and requires no new image labeling for model training, some manual labeling is required to establish the test data set. In our experience, this image labeling process required approximately 1 day of effort for one individual, although the time required may vary by imaging modality, tumor class, and overall imaging complexity. The establishment of a high-quality ground truth data set through this process, as opposed to relying on mined data for testing, is critical to guide model optimization and ensure the accurate assessment of model performance.
In conclusion, this investigation shows that noisy clinical image annotations mined from a picture archiving and communication system can be used for semisupervised training of a brain MRI tumor detection model that achieves excellent performance. The development pipeline established in this effort will be used in future investigations. The machine awareness of tumors in three dimensions achieved by the final postprocessing step will be leveraged for downstream artificial intelligence tasks, including tumor segmentation, classification, and treatment response assessment. In addition, this semisupervised learning method will be applied to other radiologic imaging modalities to formally evaluate its extendibility across modalities and its potential for department-wide tumor detection capabilities.
Acknowledgments
Acknowledgment
The authors thank Zhigang Zhang, PhD (Department of Epidemiology and Biostatistics, Memorial Sloan Kettering Cancer Center) for statistics consultation.
MSK MIND is supported by Cycle for Survival. This project is supported by the National Institutes of Health and National Cancer Institute (P30 CA008748). A.I.H. is supporrted by the National Institutes of Health and National Institute of Biomedical Imaging and Bioengineering (R01 EB022720) and the National Institutes of Health and National Cancer Institute (R21 CA220144, U54 CA137788).
N.C.S. and V.Y. contributed equally to this work.
Members of the MSK MIND Consortium are listed at the end of this article.
MSK MIND Consortium Members: Sohrab Shah, PhD; Jianjiong Gao, PhD; Paul Sabbatini, MD; Peter D. Stetson, MD; Nathaniel Swinburne, MD; Nikolaus Schultz, PhD; Matthew Hellmann, MD; Yulia Lakhman, MD; Mithat Gonen, PhD; Pedram Razavi, MD, PhD; Elizabeth Sutton, MD; Pegah Khosravi, PhD; Kevin Boehm, PhD; Rami Vanguri, PhD; Justin Jee, MD, PhD; Karl Pichotta, PhD; Christopher Fong, PhD; Arfath Pasha; Doori Rose; Essam Elsherif; Andrew Aukerman; Druv Patel; Anika Begum; Elizabeth Zakszewski, PhD; Benjamin Gross, MS; John Philip, MS; Luke Geneslaw; Robert Pimienta; and Surya Narayana Rangavajhala.
Disclosures of conflicts of interest: N.C.S. chair of the Radiology Data Governance Committee at Memorial Sloan Kettering Cancer Center. V.Y. no relevant relationships. J.K. no relevant relationships. Y.R.C. no relevant relationships. D.C.G. no relevant relationships. J.T.Y. no relevant relationships. N.M. grant from GT Medical Technologies, consulting fees from AstraZeneca. J.S. no relevant relationships. J.T. no relevant relationships. V.H. no relevant relationships. S.S.H. no relevant relationships. S.K. no relevant relationships. J.L. no relevant relationships. K.J. no relevant relationships. K.P. no relevant relationships. J.G. no relevant relationships. S.P.S. consulting fees from and stock options in Canexia Health. A.I.H. owner and president of fMRI Consultants. R.J.Y. grants from Agios; consulting fees from Agios, Puma, NordicNeuroLab, and ICON.
Abbreviations:
- AI
- artificial intelligence
- CNN
- convolutional neural network
- IoU
- intersection over union
- PACS
- picture archiving and communication system
- R-CNN
- region-based CNN
Contributor Information
Nathaniel C. Swinburne, Email: swinburn@mskcc.org.
Collaborators: sSohrab Shah, Jianjiong Gao, Paul Sabbatini, Peter D. Stetson, Nathaniel Swinburne, Nikolaus Schultz, Matthew Hellmann, Yulia Lakhman, Mithat Gonen, Pedram Razavi, Elizabeth Sutton, Pegah Khosravi, Kevin Boehm, Rami Vanguri, Justin Jee, Karl Pichotta, Christopher Fong, Arfath Pasha, Doori Rose, Essam Elsherif, Andrew Aukerman, Druv Patel, Anika Begum, Elizabeth Zakszewski, Benjamin Gross, John Philip, Luke Geneslaw, Robert Pimienta, and Surya Narayana Rangavajhala
References
- 1. Bi WL , Hosny A , Schabath MB , et al . Artificial intelligence in cancer imaging: Clinical challenges and applications . CA Cancer J Clin 2019. ; 69 ( 2 ): 127 – 157 . [DOI] [PMC free article] [PubMed] [Google Scholar]
- 2. Tajbakhsh N , Jeyaseelan L , Li Q , Chiang J , Wu Z , Ding X . Embracing Imperfect Datasets: A Review of Deep Learning Solutions for Medical Image Segmentation . Arxiv 1908.10454 [preprint] http://arxiv.org/abs/1908.10454. Posted February 11, 2020. Accessed November 17, 2020 . [DOI] [PubMed]
- 3. He K , Gkioxari G , Dollár P , Girshick R . Mask R-CNN . Arxiv 1703.06870 [preprint] http://arxiv.org/abs/1703.06870. Posted January 24, 2018. Accessed November 5, 2019 . [DOI] [PubMed]
- 4. Naphade M , Chang MC , Sharma A , et al . The 2018 NVIDIA AI City Challenge. 53–60 . Paper presented at: IEEE Conference on Computer Vision and Pattern Recognition (CVPR) Workshops ; 2018 ; Salt Lake City, Utah . https://openaccess.thecvf.com/content_cvpr_2018_workshops/w3/html/Naphade_The_2018_NVIDIA_CVPR_2018_paper.html Published 2018. Accessed November 12, 2020 . [Google Scholar]
- 5. AlBadawy EA , Saha A , Mazurowski MA . Deep learning for segmentation of brain tumors: Impact of cross-institutional training and testing . Med Phys 2018. ; 45 ( 3 ): 1150 – 1158 . [DOI] [PubMed] [Google Scholar]
- 6. Zech JR , Badgeley MA , Liu M , Costa AB , Titano JJ , Oermann EK . Variable generalization performance of a deep learning model to detect pneumonia in chest radiographs: A cross-sectional study . PLoS Med 2018. ; 15 ( 11 ): e1002683 . [DOI] [PMC free article] [PubMed] [Google Scholar]
- 7. Park JE , Park SY , Kim HJ , Kim HS . Reproducibility and Generalizability in Radiomics Modeling: Possible Strategies in Radiologic and Statistical Perspectives . Korean J Radiol 2019. ; 20 ( 7 ): 1124 – 1137 . [DOI] [PMC free article] [PubMed] [Google Scholar]
- 8. Voter AF , Meram E , Garrett JW , Yu JJ . Diagnostic Accuracy and Failure Mode Analysis of a Deep Learning Algorithm for the Detection of Intracranial Hemorrhage . J Am Coll Radiol 2021. ; 18 ( 8 ): 1143 – 1152 . [DOI] [PMC free article] [PubMed] [Google Scholar]
- 9. Clark K , Vendt B , Smith K , et al . The Cancer Imaging Archive (TCIA): maintaining and operating a public information repository . J Digit Imaging 2013. ; 26 ( 6 ): 1045 – 1057 . [DOI] [PMC free article] [PubMed] [Google Scholar]
- 10. Menze BH , Jakab A , Bauer S , et al . The Multimodal Brain Tumor Image Segmentation Benchmark (BRATS) . IEEE Trans Med Imaging 2015. ; 34 ( 10 ): 1993 – 2024 . [DOI] [PMC free article] [PubMed] [Google Scholar]
- 11. Larson DB , Magnus DC , Lungren MP , Shah NH , Langlotz CP . Ethics of Using and Sharing Clinical Imaging Data for Artificial Intelligence: A Proposed Framework . Radiology 2020. ; 295 ( 3 ): 675 – 682 . [DOI] [PubMed] [Google Scholar]
- 12. Kaissis GA , Makowski MR , Rückert D , Braren RF . Secure, privacy-preserving and federated machine learning in medical imaging . Nat Mach Intell 2020. ; 2 ( 6 ): 305 – 311 . [Google Scholar]
- 13. Sanford TH , Zhang L , Harmon SA , et al . Data Augmentation and Transfer Learning to Improve Generalizability of an Automated Prostate Segmentation Model . AJR Am J Roentgenol 2020. ; 215 ( 6 ): 1403 – 1410 . [DOI] [PMC free article] [PubMed] [Google Scholar]
- 14. Yan K , Wang X , Lu L , Summers RM . DeepLesion: automated mining of large-scale lesion annotations and universal lesion detection with deep learning . J Med Imaging (Bellingham) 2018. ; 5 ( 3 ): 036501 . [DOI] [PMC free article] [PubMed] [Google Scholar]
- 15. Zhou Z , Sanders JW , Johnson JM , et al . Computer-aided Detection of Brain Metastases in T1-weighted MRI for Stereotactic Radiosurgery Using Deep Learning Single-Shot Detectors . Radiology 2020. ; 295 ( 2 ): 407 – 415 . [DOI] [PMC free article] [PubMed] [Google Scholar]
- 16. Marcus DS , Olsen TR , Ramaratnam M , Buckner RL . The Extensible Neuroimaging Archive Toolkit: an informatics platform for managing, exploring, and sharing neuroimaging data . Neuroinformatics 2007. ; 5 ( 1 ): 11 – 34 . [DOI] [PubMed] [Google Scholar]
- 17. Swinburne NC , Mendelson D , Rubin DL . Advancing Semantic Interoperability of Image Annotations: Automated Conversion of Non-standard Image Annotations in a Commercial PACS to the Annotation and Image Markup . J Digit Imaging 2020. ; 33 ( 1 ): 49 – 53 . [DOI] [PMC free article] [PubMed] [Google Scholar]
- 18. Dutta A , Zisserman A . The VIA Annotation Software for Images, Audio and Video . Paper presented at: MM ’19: Proceedings of the 27th ACM International Conference on Multimedia ; October 2019 ; Nice, France . [Google Scholar]
- 19. Lin T , Goyal P , Girshick R , He K , Dollár P . Focal Loss for Dense Object Detection . Paper presented at: 2017 IEEE International Conference on Computer Vision (ICCV) ; October 22–29, 2017 ; Venice, Italy . [Google Scholar]
- 20. Soviany P , Ionescu RT . Optimizing the Trade-off between Single-Stage and Two-Stage Object Detectors using Image Difficulty Prediction . Arxiv 1803.08707 [preprint] http://arxiv.org/abs/1803.08707. Posted August 31, 2018. Accessed March 10, 2021 .
- 21. Wang D , Zhang Y , Zhang K , Wang L . FocalMix: Semi-Supervised Learning for 3D Medical Image Detection . Paper presented at: IEEE/CVF Conference on Computer Vision and Pattern Recognition; 2020; teleconference . https://openaccess.thecvf.com/content_CVPR_2020/html/Wang_FocalMix_Semi-Supervised_Learning_for_3D_Medical_Image_Detection_CVPR_2020_paper.html. Published 2020. Accessed August 5, 2021 . [Google Scholar]
- 22. Zhou HY , Wang C , Li H , et al . SSMD: Semi-Supervised medical image detection with adaptive consistency and heterogeneous perturbation . Med Image Anal 2021. ; 72 102117 . [DOI] [PubMed] [Google Scholar]
- 23. Tang Y , Cao Z , Zhang Y , et al . Leveraging Large-Scale Weakly Labeled Data for Semi-Supervised Mass Detection in Mammograms . Paper presented at: IEEE/CVF Conference on Computer Vision and Pattern Recognition; 2021; teleconference . https://openaccess.thecvf.com/content/CVPR2021/html/Tang_Leveraging_Large-Scale_Weakly_Labeled_Data_for_Semi-Supervised_Mass_Detection_in_CVPR_2021_paper.html. Published 2021. Accessed August 5, 2021 . [Google Scholar]
- 24. Yan W , Huang L , Xia L , et al . MRI Manufacturer Shift and Adaptation: Increasing the Generalizability of Deep Learning Segmentation for MR Images Acquired with Different Scanners . Radiol Artif Intell 2020. ; 2 ( 4 ): e190195 . [DOI] [PMC free article] [PubMed] [Google Scholar]
- 25. Kondrateva E , Pominova M , Popova E , Sharaev M , Bernstein A , Burnaev E . Domain Shift in Computer Vision models for MRI data analysis: An Overview . Arxiv 2010.07222 [preprint] http://arxiv.org/abs/2010.07222. Posted October 14, 2020. Accessed November 13, 2020 .
- 26. Yan K , Wang X , Lu L , et al . Deep Lesion Graphs in the Wild: Relationship Learning and Organization of Significant Radiology Image Findings in a Diverse Large-scale Lesion Database . Arxiv 1711.10535 [preprint] http://arxiv.org/abs/1711.10535. Posted July 28, 2018. Accessed November 16, 2020 .