

Abstract
Objective:
To evaluate: (1) the accuracy of the International Organization for Standardization (ISO) standard ISO 1999 [(2013), International Organization for Standardization, Geneva, Switzerland] predictions of noise-induced permanent threshold shift (NIPTS) in workers exposed to various types of high-intensity noise levels, and (2) the role of the kurtosis metric in evaluating noise-induced hearing loss (NIHL).
Methods:
Audiometric and shift-long noise exposure data were acquired on a population (N=2,333) of screened workers from 34 industries in China. The entire cohort was exclusively divided into sub-groups based on four noise exposure levels (85≤LAeq.8h<88, 88≤LAeq.8h<91, 91≤LAeq.8h<94, and 94≤LAeq.8h≤100 dBA), two exposure durations (D≤10 years, and D>10 years), and four kurtosis categories (Gaussian, Low-, Medium-, and High-kurtosis). Predicted NIPTS was calculated using the ISO 1999 model for each participant and the actual measured hearing threshold level was corrected for age and gender also using ISO 1999. The prediction accuracy of the ISO 1999 model was evaluated by comparing the NIPTS predicted by ISO 1999 with the actual NIPTS. The relation between kurtosis and NIPTS was also investigated.
Results:
Overall, using the average NIPTS value across the four audiometric test frequencies (2, 3, 4, and 6 kHz), the ISO 1999 predictions significantly (p<0.001) underestimated the NIPTS by 7.5 dB on average in participants exposed to Gaussian noise and by 13.6 dB on average in participants exposed to non-Gaussian noise with high kurtosis. The extent of the underestimation of NIPTS by ISO 1999 increased with an increase of noise kurtosis value. For a fixed range of noise exposure level and duration, the actual measured NIPTS increased as the kurtosis of the noise increased. The noise with kurtosis greater than 75 was found to be particularly hazardous to hearing.
Conclusions:
The applicability of the ISO 1999 prediction model to different types of noise exposures needs to be carefully re-examined. A better understanding of the role of the kurtosis metric in NIHL may lead to its incorporation into a new and more accurate model of hearing loss due to noise exposure.
Keywords: occupational noise exposure, ISO 1999 model, Gaussian noise, Non-Gaussian noise, kurtosis, noise-induced permanent threshold shift
Introduction
The equal energy hypothesis (EEH), that has been used to establish and implement noise guidelines (e.g. ISO 1999), assumes that the cochlear impact of noise exposure is proportional to the duration of exposure multiplied by the energy intensity of the exposure. The EEH is the basis for the 3-dB exchange rate, i.e. equivalent effects for a 3-dB increase or decrease in exposure level with a halving or doubling of the exposure duration, respectively. The EEH thus implies that hearing loss is independent of how the acoustic energy is distributed in the time (i.e. the temporal characteristics of the noise). This approach is generally considered appropriate for continuous or steady-state noise but not for complex noise (Ahroon et al. 1993; Zhao et al., 2010). Steady-state noise exposure has a normal or Gaussian amplitude distribution. Therefore, the temporal characteristics of steady-state noise do not change over time. A complex noise is a non-Gaussian noise consisting of a Gaussian background noise that is punctuated by a temporally complex series of randomly occurring high-level noise transients. These transients can be brief high-level noise bursts or impacts. Jobs involving maintenance work, metalwork, and power tools, such as impact wrenches and nail guns, provide examples of complex noise environments. Industrial workers are often exposed to complex noise environments. Noises of the same or similar energies and spectra can have very different effects on hearing as a result of their different temporal structures.
The ISO 1999 (2013) document is currently the most accepted model of noise-induced hearing loss. Research has shown it to be inadequate (e.g. Lempert, 2019; Zhao et al., 2010; Thiery and Meyer-Bisch,1988). Controversy exists over the accuracy of the ISO model in representing the epidemiological data referenced in ISO 1999 and its ability to accurately predict noise-induced hearing loss in individuals. The variability in the ISO 1999 curves relating noise-induced permanent threshold shift (NIPTS) to years of exposure at various exposure levels can exceed 70 dB (Mills et al., 1996; Lutman and Davis, 1996). The fundamental problem with the ISO 1999 is its reliance on an acoustic energy metric to quantify an exposure. An acoustic energy metric completely ignores the effects of temporal variables known to be important in affecting complex noise-induced hearing loss (Canlon et al., 1988; Hamernik et al., 2003; Clark 1991; Ward, 1991). The National Institute for Occupational Safety and Health (NIOSH) criteria document (1998) emphasized the paucity of data on the effects of temporal variables especially when the noise environments contain high-level transients, either impacts or noise bursts, i.e. when it is impulsive or complex (non-Gaussian). Noises of the same or similar energies and spectra can have very different effects on hearing as a result of their different temporal structures. Animal model research (Hamernik and Qiu, 2001; Hamernik et. al., 2003; Qiu et al., 2013) has shown that in order to fully evaluate the effect of complex noise on hearing, the temporal distribution of noise waveforms need to be considered.
High-level complex noise exposures are very common in industrial environments and pose a hazard to hearing for large numbers of exposed workers. Over the past several decades, a number of published papers have shown, in animal models, that exposure to non-Gaussian complex noise produces more hearing loss and sensory cell loss than does an equivalent energy exposure to continuous Gaussian noise (e.g., Dunn et al., 1991; Lei et al., 1994; Lataye and Campo, 1996; Hamernik and Qiu, 2001; Hamernik et al., 2003; Qiu et al., 2006, 2007 and 2013). These results along with similar findings from limited human demographic data (Sulkowski et al., 1983; Taylor et al., 1984; Thiery and Meyer-Bisch, 1988, Zhao et al., 2010; Davis et al., 2012; Xie et al., 2016) challenge the use of the EEH that forms the basis of current criteria for human exposure to noise (e.g., ISO 1999). Lempert (2019) rechecked the prediction formula for hearing threshold levels (HTLs) in the versions of ISO 1999:1990 and ISO 1999:2013 by using the data from Burns and Robinson (1970) and Passchier-Vermeer (1977), which provided the basis of ISO 1999:1990. He found that the mathematical formulation in ISO 1999 did not closely predict the observed distribution of HTLs in these two databases. As a result, lower predictions of the risk of noise-induced hearing impairment were found using ISO 1999:2013.
Because the temporal distribution of noise waveforms is not taken into account when using an acoustic energy metric and because many diverse noise environments could be characterized by the same energy and spectrum, it seems reasonable that a metric that would incorporate and reflect the temporal structure of an exposure might be a useful adjunct to the equivalent sound pressure level (Leq) metric. One such metric is the kurtosis of a sample distribution. The statistical metric kurtosis (β), an index of the extent to which the distribution of a variable deviates from the Gaussian, is defined as the ratio of the fourth-order central moment to the squared second-order central moment of a distribution. It’s worth noting that Gaussian noise has a kurtosis of β=3. A non-Gaussian noise, as defined above implies β > 3, can be effectively modeled as a combination of Gaussian noise with a variety of high-level transients superimposed. The transients may be impacts or noise bursts of varying peak intensities, inter-transient intervals, and durations. The distribution of the high-level transient peaks, inter-transient intervals, and transient durations are all known to affect the outcome of exposure. One way of quantifying the complex temporal structure of a non-Gaussian noise is to measure the peak, interval, and duration histograms of the transients in the noise signal. The kurtosis value is sensitive to, and to a large extent is determined by these three primary variables. It also has the advantage that the temporal structure of a complex noise can be incorporated into a single easily computed number, i.e. kurtosis (Erdreich, 1986). It can be seen from the above statement that kurtosis is a description of the “impulsiveness” of noise exposure. For a given length of noise exposure, the higher the kurtosis of the noise, the higher the impulsiveness of the noise.
Results from animal experiments (Hamernik et al., 2003; Qiu et. al., 2006, 2007, and 2013) have shown that: (a) The kurtosis may be a reasonable candidate to assess the extent of hearing loss from complex noise; (b) The kurtosis, for a fixed energy level, ordered the extent of hearing and sensory cell loss from a variety of complex noise exposures, i.e., noise-induced hearing loss increased as the kurtosis increased. For human subjects, two questions need to be answered: (1) How accurately does the ISO 1999 standard, developed from the results of steady-state (Gaussian) noise exposures, and quantified by A-weighted energy alone, predict NIHL from non-Gaussian complex noise environments? (2) Does the kurtosis value of the noise exposure help predict the extent of hearing trauma as it does in the animal (chinchilla) model?
In this study, a large human database (N=2,333), consisting of full work-shift noise recordings and pre-work-shift hearing levels was acquired from workers in multiple industries in China. The noise environments in these industries had a variety of noise levels and kurtosis values that allowed for a comprehensive evaluation of the applicability of the ISO 1999:2013 prediction model and the role of kurtosis in assessing NIHL.
Methods
Study design
Audiometric and shift-long noise exposure data were collected on 2,333 workers from 34 industries in China. The entire cohort was exclusively divided based on four noise exposure levels (85≤LAeq.8h<88, 88≤LAeq.8h<91, 91≤LAeq.8h<94, and 94≤LAeq.8h≤100 dBA), two exposure durations (D≤10 years, and D>10 years), and four kurtosis categories (Gaussian, Low-, Medium-, and High-kurtosis).
A cross-sectional approach was used in this study. The main study elements were: (1) workplace selection based upon noise and employment characteristics; (2) recruitment of participants; (3) questionnaire survey; (4) collection of full-shift noise waveforms; (5) calculation of noise metrics; (6) audiometric evaluation; (7) evaluation of ISO 1999 NIPTS predictions. (8) statistical analysis design. The details of each element are addressed below.
Workplace selection
Workplace selection for this study was based upon criteria designed to assure necessary Gaussian and non-Gaussian noise exposure and a sufficient participant pool. Each workplace included in the study had: (1) a workforce that was stable over a number of years; (2) work processes and machinery that were stable for a number of years; (3) sufficiently high Gaussian and non-Gaussian noise exposure work areas. Before the data collection, a hygienist interviewed the administrators of the investigated factories to verify that the working environment remained constant. The members of the research team conducted field observations to preliminarily evaluate the noise levels and noise types of in the selected workplaces. A total of 98 workplaces from 34 factories were investigated.
Recruitment of participants
Industrial workers were recruited from 34 factories in the Zhejiang province of China between 2010 and 2018. Participants (N=3,244) were introduced to the study purpose and design by occupational physicians and invited to participate. Those who agreed to participate were asked to sign an informed consent form. The Zhejiang Provincial Center for Disease Control and Prevention (ZJCDC) institutional committee for the protection of human subjects approved the study protocol (approval reference number: ZJCDC-T-043-R).
For inclusion in the study, participants had to satisfy the following four criteria: (1) consistently worked in the same job category and at the same worksite (noise exposure area) for the period from the beginning of a worker’s career to the date of the investigation; (2) a minimum of at least one year of employment in their current position; (3) no history of genetic or drug-related hearing loss, head wounds or ear diseases, and (4) no history of military service or shooting and setting off firecrackers activities. As a result, a total of 2,333 participants were included from the original pool of 3,244 subjects.
Most participants still did not use a hearing protection device (HPD) despite the implementation of hearing conservation programs on a wide scale in China starting in 2012. The use of HPDs, usually earplugs, both on and off the job was assessed through field observations by the researchers and in the questionnaire and reported to be low and infrequent. At high noise exposure levels, i.e. ~95 dBA and above, the use of HPDs was observed to be sporadic. The inclusion of these participants would, to some extent, have an effect on the relation between noise level and NIPTS. We expected this effect to occur primarily in the participants exposed to noise above 95 dBA. For those participants who have never used HPDs, the members of the research team recommended the use of appropriate HPDs after data collection. During this study, workers in the investigated factories received training on how to properly use HPDs; in a few cases, training included fit testing using the 3M™ E-A-Rfit Dual-Ear Validation System.
Questionnaire survey
An occupational hygienist from ZJCDC administered a questionnaire to each participant in order to collect the following information: general demographic information (age, sex, etc.); occupational history (factory, worksite, job description, length of employment, duration of daily noise exposure, and history of using hearing protection); and overall health status (including the history of ear disease and use of ototoxic drugs). An occupational physician entered all information into a database.
Noise data collection
Shift-long noise recordings were obtained for each noise-exposed participant at the 34 factories using an ASV5910-R digital recorder (Hangzhou Aihua Instruments Co., Hangzhou, China). The ASV5910-R digital recorder is a specialized sound recording device that can be used for precision measurements and analysis of personal noise exposure. The instrument uses a ¼-inch pre-polarized condenser microphone characterized by good stability, high upper measurement limit, and wide frequency response (20 Hz – 20 kHz). The sensitivity level of the microphone is −53 dBV, and the measurement range is 40–141 dBA. One full-shift recording of each participant’s noise exposure was captured by the ASV5910-R at 32-bit resolution with a 48-kHz sampling rate and saved in a raw audio format (WAV file). The noise record was saved on a 32GB micro SD card and transferred to a portable hard disk for subsequent analysis. Before recording, the hygienist confirmed with the manager of the workplace, and each participant that this was the noise they were typically exposed to on an average working day. The members of the research team monitored the noise collection of individual participants in the workplace.
Calculation of noise metrics
Two noise metrics were used in this study: (1) A-weighted noise exposure level normalized to a nominal 8-hour working day (LAeq,8h); (2) kurtosis of noise exposure (β). A program using MATLAB (The MathWorks, R2017) software was developed for analyzing the full-shift noise waveforms that were collected on each participant. The program was designed to extract the LAeq,8h, and kurtosis, i.e.,
- LAeq,8h level, in decibels, is given by the formula (ISO 1999, 2013):
where LAeq,Te is the A-weighted equivalent continuous sound pressure level for Te; Te is the effective duration of the working day in hours, and T0 is the reference duration (T0 = 8 h).(1) - The kurtosis of the recorded noise signal was computed over consecutive 40-second time windows without overlap over the shift-long noise record using a sampling rate of 48 kHz. For a sample of n values, the kurtosis is calculated as:
where xi is the ith value and is the sample mean. Because the kurtosis value is dependent on the length of the window over which the calculation is made, and its calculation is limited by the computer’s processing capabilities, a compromise was made to use a 40-second time window which, based on previous animal data (Hamernik et al., 2003), was found to be sufficient to establish an acceptable measure of the kurtosis metric. The mean of the measured kurtosis values was calculated and used as the kurtosis metric.(2)
Audiometric evaluation
Each participant underwent a general physical and otologic examination. Otoscopy was carried out initially to ensure participants present with no visible issues with the external ear canal and tympanic membrane. Air-conduction pure tone hearing threshold levels (HTLs) were tested at 0.5, 1, 2, 3, 4, 6 and 8 kHz in each ear by a certified audiologist. The tests were conducted manually. Each participant’s hearing data was recorded on a separate audiogram form and all the data were entered into a computer after the daily test was completed. The testing was conducted in an audiometric booth using an audiometer (Madsen, OB40) calibrated according to the Chinese national standard (GB4854–84). The noise floor of the booth was compliant with ANSI S3.1–1999 specifications from 125 to 8000 Hz (ANSI, 2003). Audiograms were measured at least 16 hours after the participants’ last occupational noise exposure.
Evaluation of ISO 1999 median NIPTS predictions
A database composed of the participant’s shift-long temporal noise waveform and the associated audiometric results was developed and compared to the ISO 1999 predictions for median NIPTS. The ISO 1999 median NIPTS prediction for each participant was determined using the equations described in the ISO 1999 document as follows:
| (3) |
where LAeq,8h is the noise exposure level normalized to a nominal 8 hour working day; t is noise exposure duration in years, t0 = 1; L0 is the reference sound pressure level in Table I of ISO 1999 (2013); u, and v are coefficients given as a function of audiometric test frequency in Table I of ISO 1999 (2013).
The analysis focused on the frequency range of 2–6 kHz because noise-induced hearing loss occurs predominantly in this range. The NIPTS predictions for each participant at test frequencies (2, 3, 4 and 6 kHz) were obtained by subtracting normal median hearing threshold levels by age and gender matched populations adapted from the ISO 1999 (2013) Table B.3 (derived from an audiometric survey of the US population in 1960 to 2006). The thresholds of the better ear were determined for all participants across the test frequencies. The better ear was used because this was the criteria for Table B.3 of the ISO 1999 (Hoffman et al., 2010). Since the participants were exposed to only one occupational high-level noise throughout their working life and since their working environments were never changed, the observed hearing loss estimates were likely attributable to the measured industrial noise exposures.
The above approach allowed us to compare the ISO 1999 NIPTS predictions for each exposure condition to the actual NIPTS incurred by the participant under the same exposure condition. Three noise-related metrics (i.e. noise level, duration, and kurtosis) were used to evaluate noise-induced hearing loss in this study. In order to evaluate the effect of noise level on NIPTS, participants were classified into the following four exposure groups:
L1: 85 ≤ LAeq.8h < 88 dBA;
L2: 88 ≤ LAeq.8h < 91dBA;
L3: 91 ≤ LAeq.8h < 94 dBA;
L4: 94 ≤ LAeq.8h ≤100 dBA.
NIHL develops most rapidly during the first 10 years of noise exposure and then slows with additional noise exposure (ISO 1999, 2013; NIOSH, 1998; Dobie, 2001). Davis et al. (2012) supported this observation. In order to evaluate the effect of exposure duration on NIPTS the entire cohort was classified into two subgroups based on the duration (D) of noise exposure:
D1: 1 ≤ D ≤ 10 years (denoted by D≤10);
D2: 10 < D ≤ 35 years (denoted by D>10).
To evaluate the effect of kurtosis on NIPTS, participants were partitioned into one of four groups based on the kurtosis value of noise exposure. The selection of the partitioning bins for the kurtosis metric was based on previous animal (chinchilla) experiments where the noise-induced sensory cell loss was documented by noises with kurtosis β = 3, 25, 50, or 100 at 97 dB SPL. The results showed that cochlear sensory cell loss increased with increasing β(t) (Qiu et al., 2013). Thus, the grouping strategy of this study was as follows:
K1: Gaussian/quasi-Gaussian group [mean β(t)≤10];
K2: Low kurtosis group [10<mean β(t)≤30];
K3: Medium kurtosis group [30<mean β(t)≤75];
K4: High kurtosis group [mean β(t)>75].
A quasi-Gaussian noise was defined as noise whose amplitude distribution was close to the Gaussian distribution. In this study, noise with kurtosis range of 2.8 to 3.9 was considered as Gaussian noise, and noise with kurtosis range of 4 to 10 was considered as quasi-Gaussian noise.
Statistical analysis
Noise exposure level (LAeq.8h), duration of exposure, kurtosis, age, and gender were summarized as count, mean and standard deviation or range (minimum to maximum). The actual measured NIPTS and the difference between the actual NIPTS and the ISO 1999 predicted NIPTS were analyzed using a mixed model where the NIPTS or the NIPTS difference served as the dependent variable, while noise level (LAeq.8h), exposure duration, kurtosis as well as their interaction served as independent variables. The group means for level, duration, and kurtosis, and their 95% confidence interval (CI) were calculated. The estimated marginal means and standard errors of NIPTS difference and the actual measured NIPTS are plotted in Figures 2 and 3. A significance level of p<0.05 was applied to the overall test for all factors and their interaction. Pairwise comparisons were processed among noise level, duration, and kurtosis groups. For all pairwise comparisons, Bonferroni adjustment was applied in claiming significance. The analyses were performed using IBM® SPSS Statistics (version 22).
Figure 2.
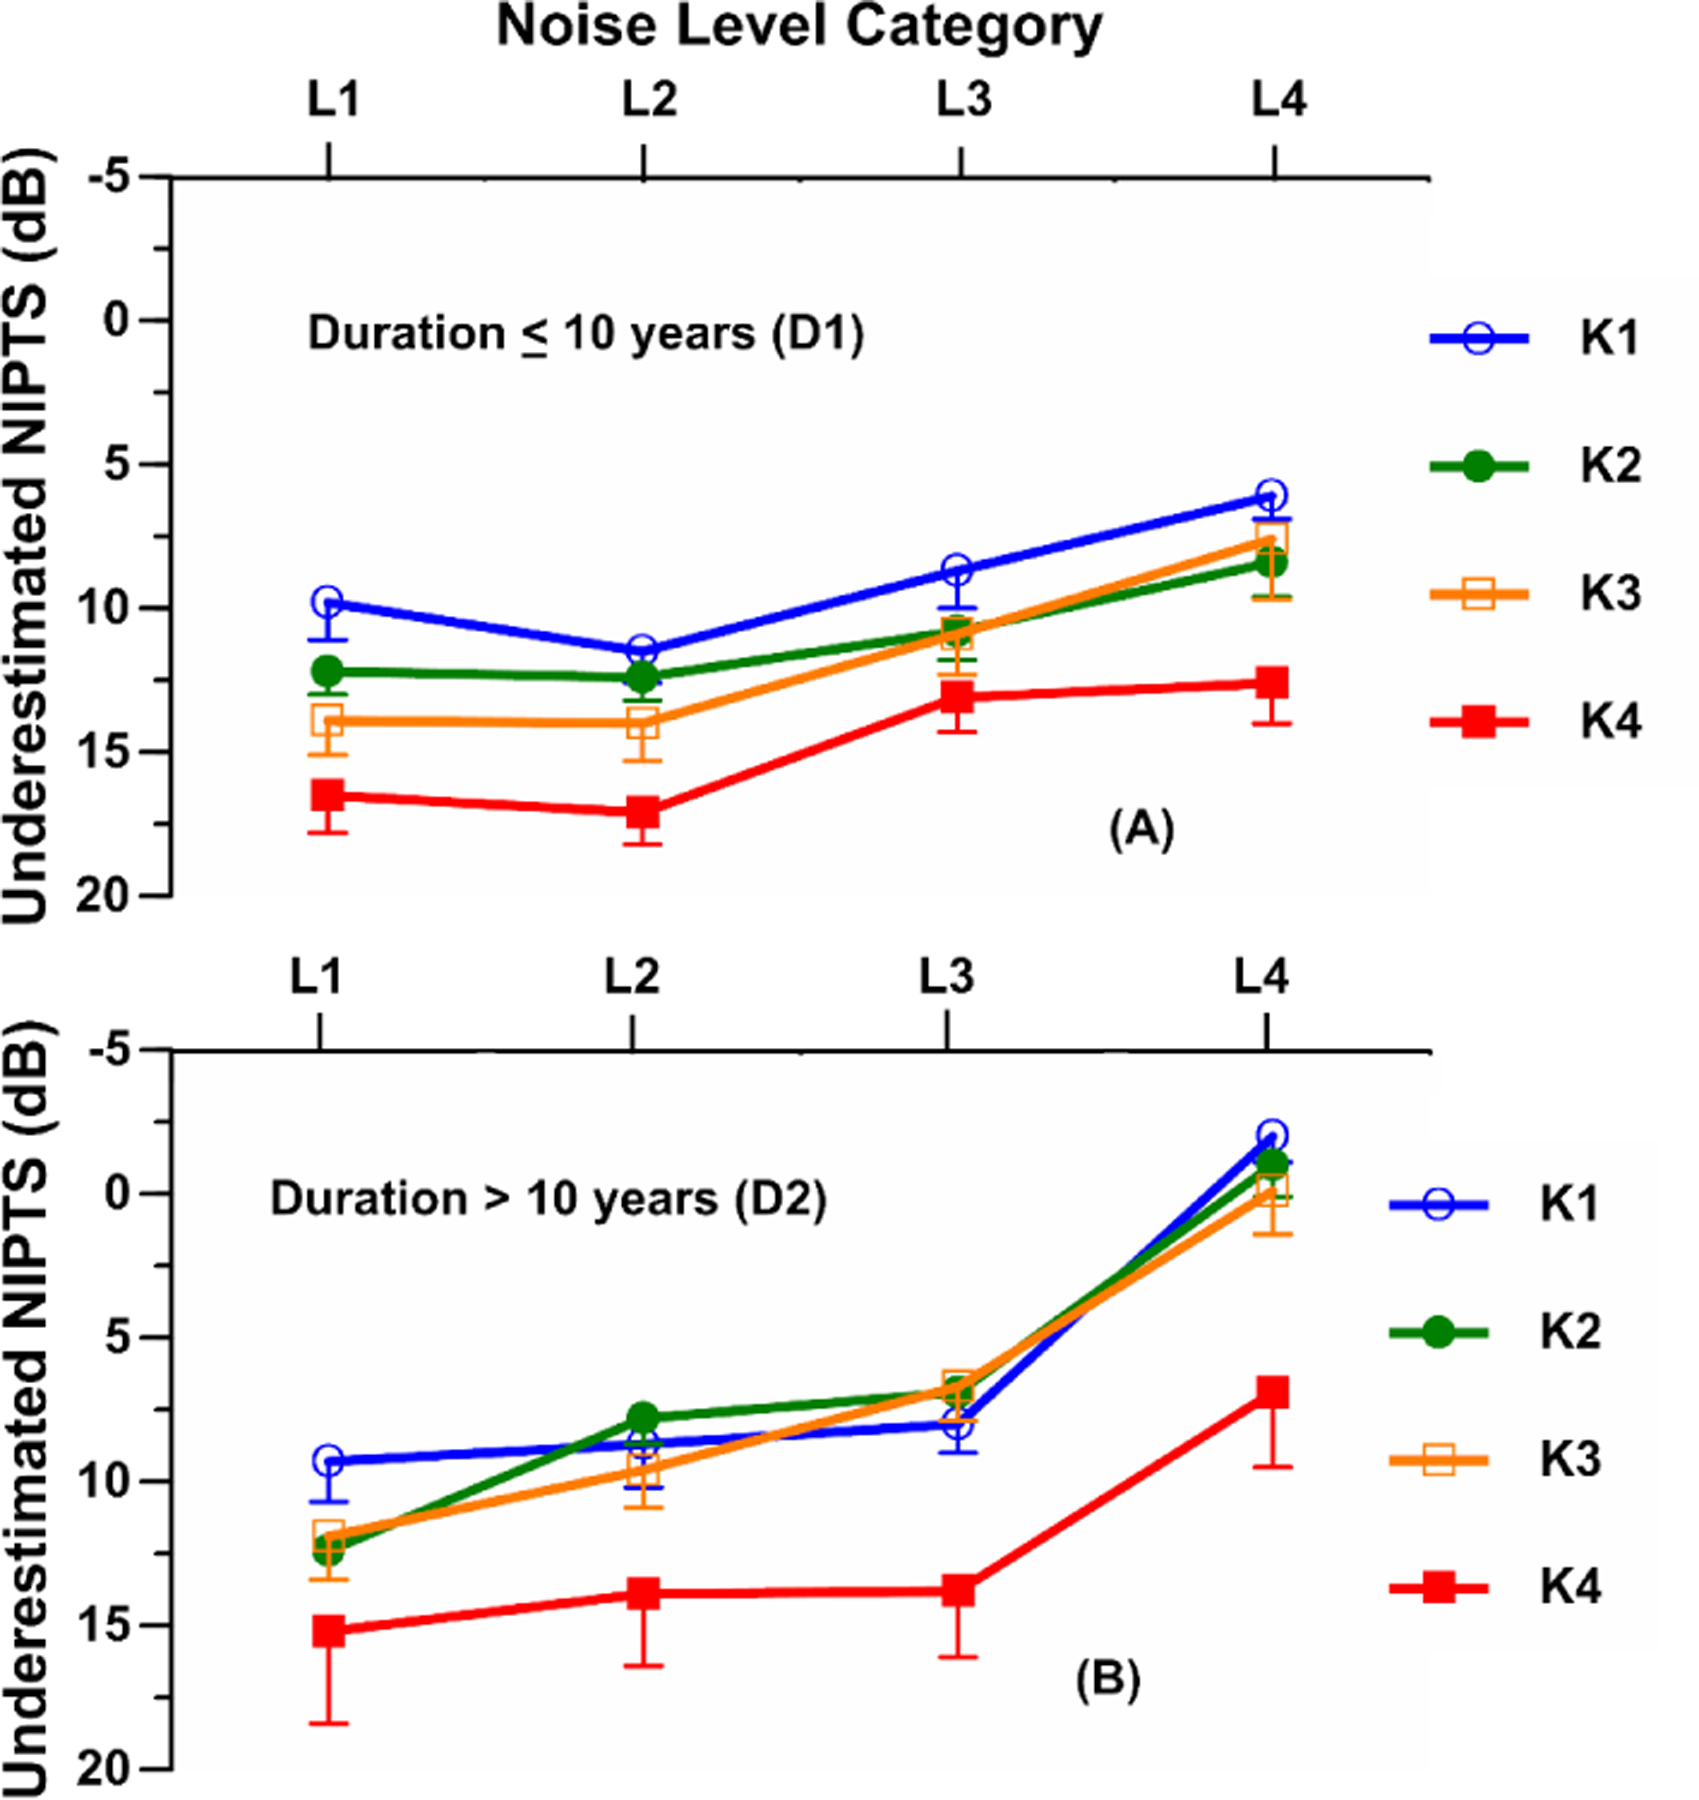
The estimated marginal means (EMM) of underestimated NIPTS by ISO 1999 model at each kurtosis value across test frequencies for four noise level bins in two different exposure durations. (A) The EMM of NIPTS underestimation at each kurtosis value for our noise level bins in duration D≤ 10 years. (B) The EMM of NIPTS underestimation at each kurtosis value for four noise level bins in duration D> 10 years. Error bars indicate the standard error of the EMM.
Figure 3.
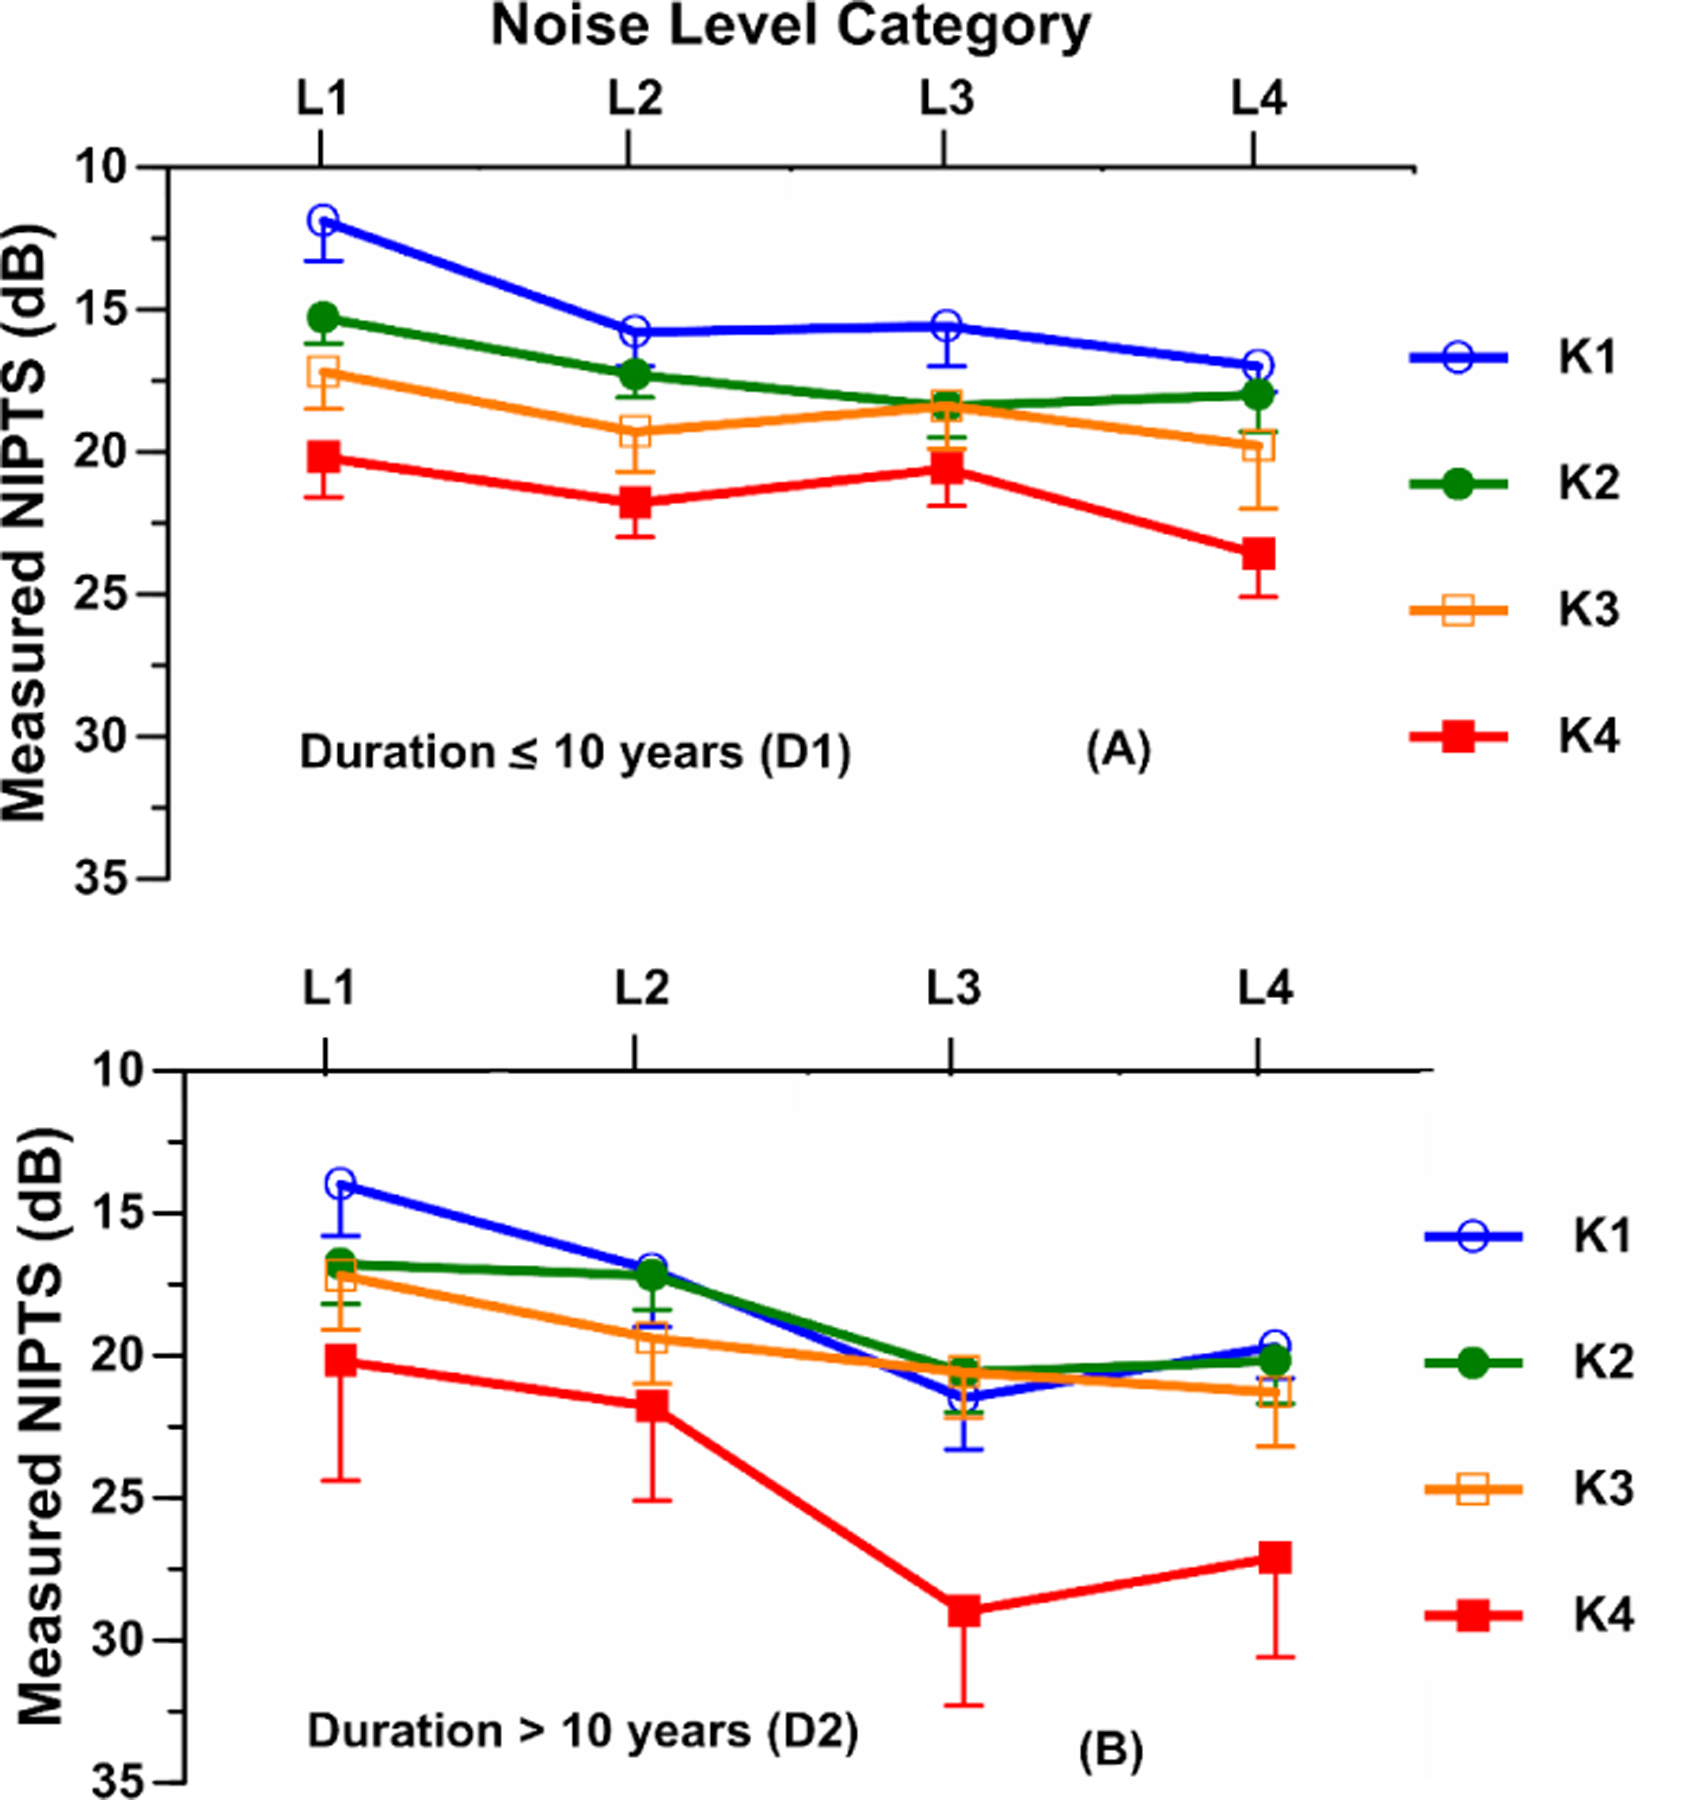
The estimated marginal means (EMM) of the actual measured NIPTS at each kurtosis value across test frequencies for four noise level bins in two different exposure durations. (A) The EMM of the actual measured NIPTS at each kurtosis value for our noise level bins in duration D≤10 years. (B) The EMM of the actual measured NIPTS at each kurtosis value for four noise level bins in duration D> 10 years. Error bars indicate the standard error of the EMM.
Results
Data were collected on 2,333 workers exposed to a variety of industrial noises. Table 1 provides a breakdown by the factory of the average noise exposure level, duration of exposure, kurtosis, age, and sex, corresponding to the number of participants exposed. The distributions of participant age, exposure duration, and noise exposure level (LAeq) in the 2,333 noise-exposed participants are presented in Fig. 1. It can be seen from Fig. 1A that most of the participants were between 22 and 48 years old (88.6%). The median age of the group was 36 years, the mean was 36.1 years. The exposure duration for the 2,333 participants ranged from 1 to 35 years as shown in Fig. 1B. The median duration was 7 years, the mean was 9.5 years, and 42.6% had more than 10 years. Fig. 1C shows that about 24% of the participants were exposed to levels between 85–87 dBA; 28% of participants to levels between 88 and 90 dBA; 23% participants to levels between 91 and 93 dBA; and 25% of participants to levels between 94 and 100 dBA. The median level was 90.8 dBA; the mean was 91.3 dBA. Fig. 1D shows that about 28% of participants were exposed to a Gaussian/quasi-Gaussian noise; 38% to Low-kurtosis noise; 19% to Medium-kurtosis noise; and 15% to High-kurtosis noise. The median kurtosis value was 18.2, the mean value was 48.
Table 1.
A breakdown of the average noise exposure level, duration of exposure, kurtosis, age, and sex, corresponding to the number of subjects exposed by categories of industry (n, number of subjects in each group; ±, plus/minus 1 standard deviation; –, minimum to maximum).
| Industry category | Main productions | Number of factories | Typical noise sources | Participants | LAeq.8h (dBA) | Mean kurtosis | |||
|---|---|---|---|---|---|---|---|---|---|
| Male (n) | Female (n) | Age (year) | Duration (year) | ||||||
| Textile | Spandex, woven bag, and cotton textile | 4 | Spinning, weaving | 127 | 174 | 33.0±8.4 (17–58) |
8.2±6.3 (1–35) |
95.3±3.6 (85–100) |
9.0±11.8 (3–139) |
| Paper | Paper | 2 | Pulping | 55 | 30 | 46.8±10.2 (20–65) |
11.6±8.4 (1–35) |
89.8±3.0 (85–97) |
9.9. ±8.1 (3–52) |
| Furniture | Furniture | 6 | Gunning, nailing | 297 | 37 | 34.7±9.7 (18–63) |
5.0±4.7 (1–31) |
90.1±3.0 (85–99) |
188.2±161.4 (13–925) |
| Vehicle | Car parts, brake pad, wheel, suspension spring, and vehicle engine | 7 | Cold heading, machining, stamping | 770 | 200 | 35.3±7.5 (19–59) |
11.2±8.0 (1–35) |
90.2±3.4 (85–100) |
26.5±36.4 (3–647) |
| Hardware | Hardware tools and components | 2 | Drilling, blast sand, forging, polishing | 65 | 39 | 41.0±8.7 (19–59) |
13.1±8.8 (1–35) |
93.7±4.1 (85–100) |
12.9±12.1 (3–52) |
| Electrical equipment | Electrical equipment, washing machine | 2 | Polishing, Stamping, assembling, sanding | 50 | 9 | 26.8±4.7 (19–39) |
3.9±4.3 (1–19) |
90.0±3.2 (85–100) |
18.8±12.0 (4–77) |
| Pipe | Oil pipeline | 2 | Cutting, mending, polishing | 49 | 3 | 31.2±9.4 (20–55) |
5.6±6.4 (1–35) |
90.5±3.0 (85–98) |
34.7±16.8 (8–76) |
| Machinery | Mechanical products, tool and mold, hydroelectric equipment | 6 | Metal processing, cutting, welding, casting,grinding | 165 | 114 | 40.1±9.8 (20–65) |
8.6±6.6 (1–35) |
90.8±4.0 (85–100) |
34.0±32.8 (4–241) |
| Steel | Iron and steel products, steel frame structure | 3 | Steel rolling, and finishing, welding, drilling, assembling | 148 | 0 | 38.9±7.1 (20–53) |
13.3±8.2 (1–33) |
93.8±3.5 (86–100) |
41.2±55.3 (5–316) |
| Summary | 34 | 1,727 | 606 | 36.1±9.1 (17–65) |
9.5±7.7 (1–35) |
91.3±3.9 (85–100) |
48.0±89.4 (3–925) |
||
Figure 1.
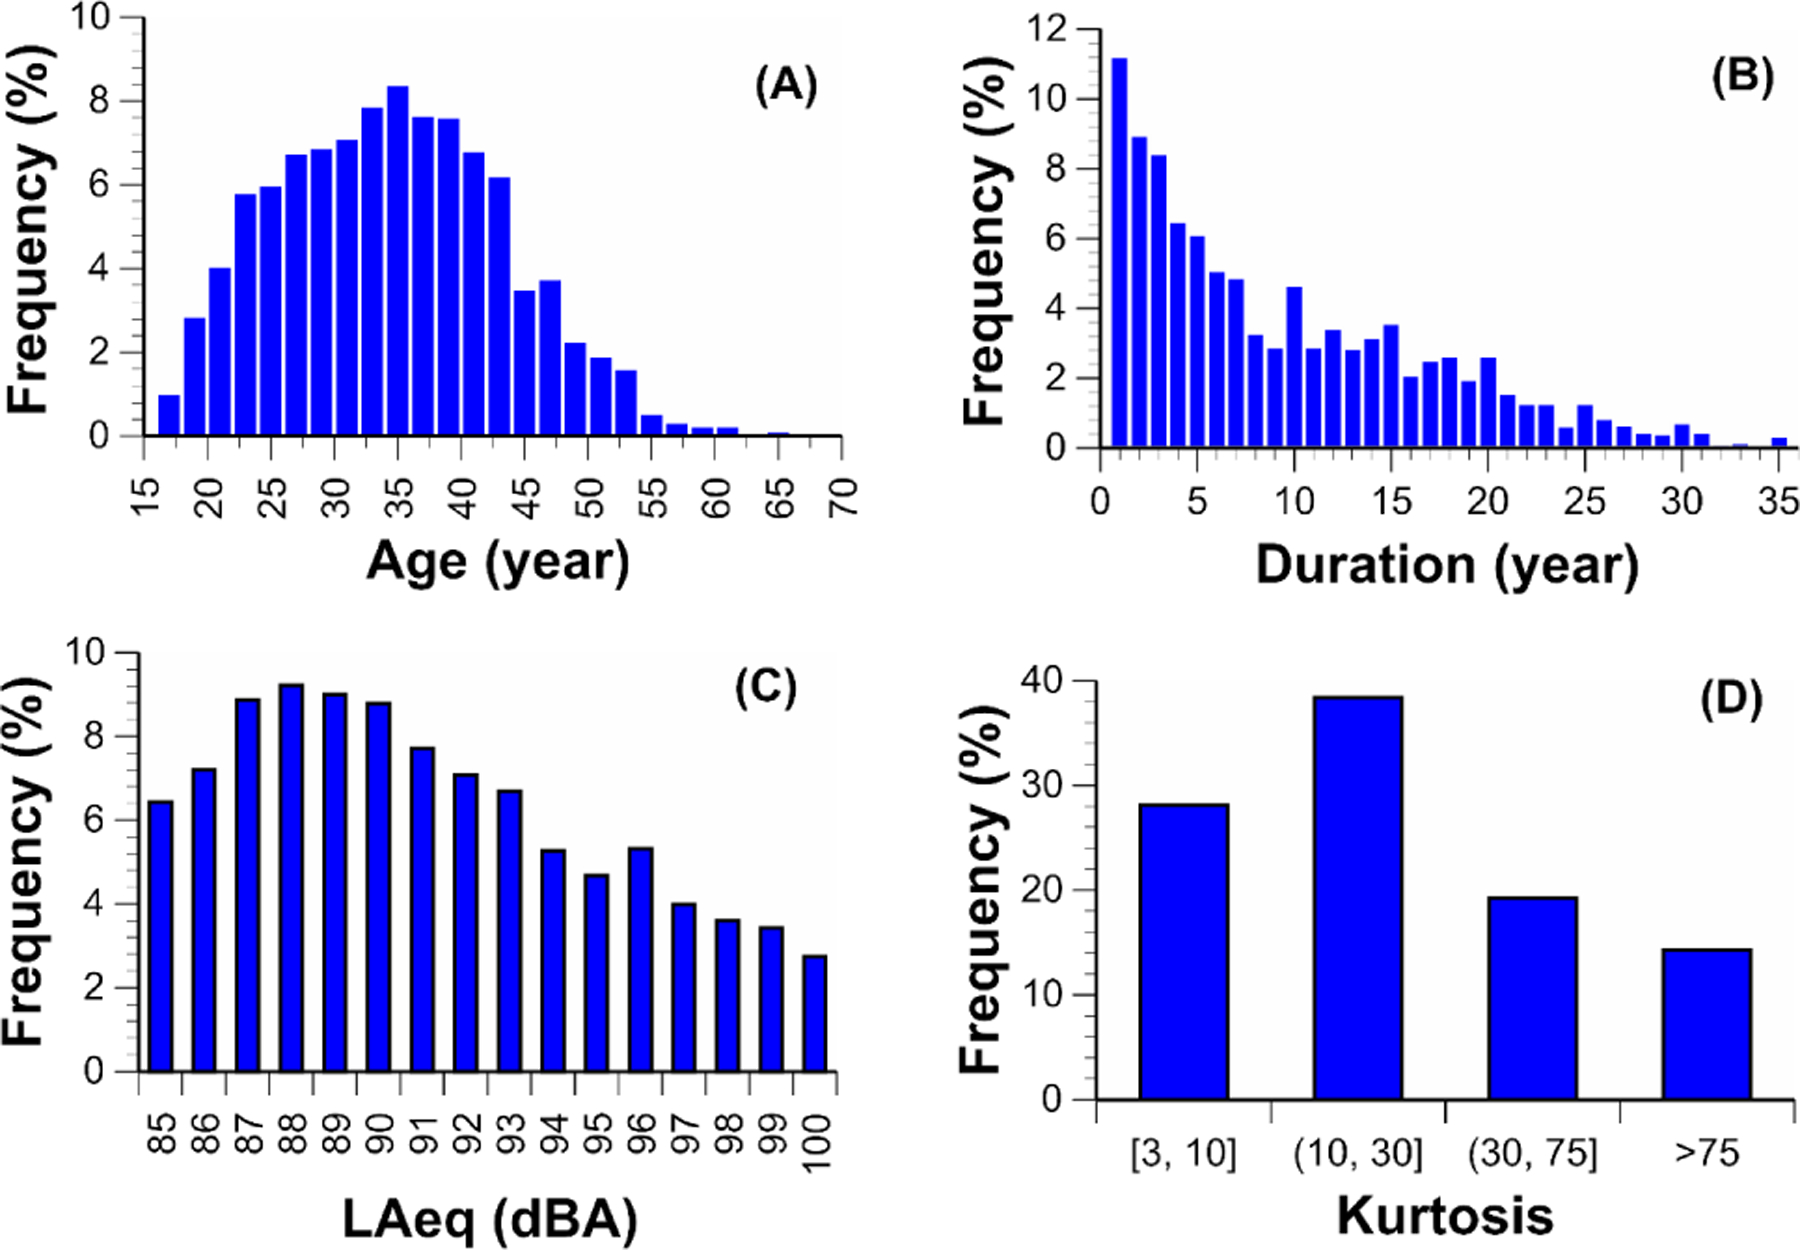
Distributions of (A): age; (B) exposure duration; (C) A-weighted equivalent sound pressure levels (LAeq.8h); and (D) kurtosis value of the 2,333 noise-exposed workers.
Evaluation of the ISO 1999 NIPTS predictions
A. Overall Difference between the ISO 1999 predicted NIPTS and the actual measured NIPTS
To evaluate the difference between the ISO 1999 predicted NIPTS and the actual measured NIPTS, the average of the actual measured NIPTS over 2, 3, 4, and 6 kHz for each participant was used to compare with the ISO 1999 predicted NIPTS. The overall NIPTS difference was 9.2 dB (95% CI:8.8, 9.7) with p<0.001 where the ISO 1999 predicted NIPTS was 8.0 dB and the measured NIPTS was 17.2 dB. Overall, the ISO 1999 prediction model significantly underestimated the NIPTS by 9.2 dB on average.
B. Evaluation of the ISO 1999 NIPTS prediction
The mixed model analysis showed that there was a significant kurtosis effect (F=17.1, p<0.001), duration effect (F=40.9, p<0.001), level effect (F=44.8, p<0.001), and duration by level interaction effect (F=5.9, p=0.001) on the NIPTS difference. The estimated marginal mean for each group is summarized in Table 2. Although there is a significant duration by level interaction, the increasing trend of the NIPTS difference with the noise level is consistent between the two duration groups making the evaluation of marginal mean of duration or level meaningful.
Table 2.
Estimated marginal means and standard errors of NIPTS difference between the actual measured NIPTS and the ISO 1999 predicted NIPTS for level, duration, kurtosis, and level by duration groups.
| Effect | Group | Estimated Mean | Standard Error | 95% CI |
|---|---|---|---|---|
| LAeq a | L1 | 12.6 | 0.6 | 11.5–13.7 |
| L2 | 11.9 | 0.5 | 10. 9–12.8 | |
| L3 | 9.8 | 0.5 | 8. 8–10.8 | |
| L4 | 4.4 | 0.5 | 3.4–5.5 | |
| Duration b | D1 | 11.4 | 0.3 | 10.8–12.0 |
| D2 | 8.0 | 0.4 | 7.1–8.8 | |
| Duration*LAeq | D1*L1 | 13.1 | 0.5 | 12.0–14.1 |
| D1*L2 | 13.7 | 0.5 | 12.8–14.7 | |
| D1*L3 | 10.7 | 0.6 | 9.6–11.8 | |
| D1*L4 | 8.0 | 0.7 | 6.7–9.3 | |
| D2*L1 | 12.1 | 1.1 | 9.9–14.3 | |
| D2*L2 | 10.0 | 0.9 | 8.2–11.8 | |
| D2*L3 | 8.8 | 0.9 | 7.1–10.6 | |
| D2*L4 | 0.9 | 0.9 | −0.9–2.8 | |
| Kurtosis c | K1 | 7.5 | 0.4 | 6.6–8.3 |
| K2 | 8.7 | 0.4 | 8.0–9.4 | |
| K3 | 8.9 | 0.5 | 7.8–9.8 | |
| K4 | 13.6 | 0.7 | 12.2–15.1 |
NOTE. CI, confidence interval.
The p values for difference between level group pair are as follows: 1.0 for L1-L2 pair; 0.001* for L1-L3 pair; <0.001* for L1-L4 pair; 0.017* for L2-L3 pair; <0.001* for L2-L4 pair; <0.001* for L3-L4 pair.
The p value for difference between D1 and D2 is <0.001*.
The p values for difference between kurtosis group pair are as follows: 0.162 for K1-K2 pair; 0.259 for K1-K3 pair; <0.001* for K1-K4 pair; 1.0 for K2-K3 pair; <0.001* for K2-K4 pair; <0.001* for K3-K4 pair.
Statistically significant. Bonferroni adjustment was applied for multiple comparisons.
B1. The effect of exposure duration on NIPTS underestimation
The ISO 1999 prediction model underestimated NIPTS by 11.4 dB in participants having an exposure duration D≤10 years, while the NIPTS underestimation was 8.0 dB in participants with duration D>10 years. The degree of underestimation in NIPTS between two duration groups was significantly different (p<0.001).
B2. The effect of noise level on NIPTS underestimation
The ISO 1999 model underestimated NIPTS by 12.6 dB, 11.9 dB, 9.8 dB, and 4.4 dB in participants exposed to noise with levels of 85≤LAeq.8h < 88 dBA (group L1), 88≤LAeq.8h < 91dBA (group L2), 91≤ LAeq.8h < 94 dBA (group L3) and 94≤LAeq.8h≤100 dBA (group L4), respectively. The extent by which the ISO prediction model underestimated the NIPTS decreased with the increase of noise level. The degree of NIPTS underestimation was significantly smaller in the L4 level group than in the other three level groups (p<0.001 for all 3 comparisons). The degree of NIPTS underestimation in the L3 level group was significantly less than in the L1 and L2 groups (p=0.001 and 0.017, respectively). There was no significant difference between L1 and L2 level groups in NIPTS underestimation.
B3. Interaction effect of duration by level on NIPTS underestimation
The results showed that there was a significant interaction effect in the noise level by exposure duration on NIPTS underestimation by the ISO 1999 prediction model. From Table 2 it can be seen that different combinations of noise level and exposure duration produced different amounts of NIPTS underestimation. For exposure duration D≤10 years, the ISO 1999 prediction model underestimated NIPTS by 8.0 to 13.7 dB on average across different noise levels. For exposure duration D>10 years, the ISO 1999 model underestimated NIPTS by 0.9 to 12.1 dB on average across different noise levels. For a fixed duration, the degree of NIPTS underestimation decreased as the noise level increased.
B4. The effect of kurtosis on NIPTS underestimation
The ISO 1999 model underestimated NIPTS by 7.5 dB for the Gaussian/quasi-Gaussian kurtosis group (K1); by 8.7 dB for the Low kurtosis group (K2); by 8.9 dB for the Medium kurtosis group (K3); and by 13.6 dB for the High kurtosis group (K4). The extent of NIPTS underestimation increased with the increase of kurtosis value. The underestimated NIPTS by the ISO 1999 model for the K4 kurtosis group was significantly larger than that of the other three kurtosis groups (p<0.001 for all 3 comparisons).
C. The effects of noise level and kurtosis on NIPTS underestimation for two exposure durations
The effects of noise level and kurtosis on NIPTS differences were analyzed for the D1 duration group (N=1,340) and the D2 group (N=993). The mixed model analysis showed that: (1) there was a significant kurtosis effect (F=19.7, p<0.001) and level effect (F=19.6, p<0.001) on the NIPTS difference in D1 group; (2) there was a significant kurtosis effect (F=5.2, p=0.001) and level effect (F=25.6, p<0.001) on the NIPTS difference in D2 group. The estimated marginal means for the D1 and D2 groups are summarized in Tables 3. The effects of noise level and kurtosis on underestimated NIPTS by ISO 1999 for these two exposure durations are shown in Fig. 2. For the D≤10-year group (Fig. 2A), the ISO 1999 model underestimated NIPTS by 6.1 to 11.5 dB in participants exposed to Gaussian (K1) noise and 7.6 to 17.1 dB in participants exposed to non-Gaussian (K2, K3, and K4) noise at all four noise levels (L1 to L4). For a fixed noise level, the amount by which the ISO 1999 model underestimated NIPTS increased as the kurtosis value increased in the order K1, K2, K3, and K4. Except for the K2-K3 group pair, the underestimated NIPTS by the ISO 1999 model for all other kurtosis group pairs was significantly different (p<0.001 to 0.027, Table 3). Also evident from these data is that for a fixed kurtosis value, the extent of NIPTS underestimation deceased as the noise level increased. The degree of NIPTS underestimation at the L4 level was significantly less than that of the other three levels (p<0.001 to 0.009, Table 3). The amount of NIPTS underestimation at the L3 level was also significantly less than that of the L2 and L1 levels (p<0.001 and p=0.013, Table 3).
Table 3.
Estimated marginal means and standard errors of NIPTS difference for level and kurtosis groups at duration D≤10 years and D>10 years.
| Duration | Effect | Group | Estimated Mean | Standard Error | 95% CI |
|---|---|---|---|---|---|
| D≤10 years | LAeq a | L1 | 13.1 | 0.5 | 12.0–14.1 |
| L2 | 13.7 | 0.5 | 12.8–14.7 | ||
| L3 | 10.7 | 0.6 | 9.6–11.8 | ||
| L4 | 8.0 | 0.7 | 6.7–9.3 | ||
| Kurtosis b | K1 | 9.0 | 0.5 | 8.0–10.0 | |
| K2 | 10.9 | 0.4 | 10.1–11.8 | ||
| K3 | 11.2 | 0.7 | 9.8–12.5 | ||
| K4 | 14.8 | 0.6 | 13.7–15.9 | ||
|
| |||||
| D>10 years | LAeq c | L1 | 12.1 | 1.1 | 9.9–14.3 |
| L2 | 10.0 | 0.9 | 8.2–11.8 | ||
| L3 | 8.8 | 0.9 | 7.1–10.6 | ||
| L4 | 0.9 | 0.9 | −0.9–2.8 | ||
| Kurtosis d | K1 | 6.0 | 0.7 | 4.5–7.4 | |
| K2 | 6.5 | 0.6 | 5.4–7.7 | ||
| K3 | 6.9 | 0.7 | 5.5–8.4 | ||
| K4 | 12.4 | 1.5 | 9.5–15.4 | ||
NOTE. CI, confidence interval.
For Duration D≤10 years:
The p values for difference between level group pair are as follows: 1.0 for L1-L2 pair; 0.013* for L1-L3 pair; <0.001* for L1-L4 pair; <0.001* for L2-L3 pair; <0.001* for L2-L4 pair; 0.009* for L3-L4 pair.
The p values for difference between kurtosis group pair are as follows: 0.027* for K1-K2 pair; 0.012* for K1-K3 pair; <0.001* for K1-K4 pair; 1.0 for K2-K3 pair; <0.001* for K2-K4 pair; <0.001* for K3-K4 pair.
For Duration D>10 years:
The p values for difference between level group pair are as follows: 0.889 for L1-L2 pair; 0.128 for L1-L3 pair; <0.001* for L1-L4 pair; 1.0 for L2-L3 pair; <0.001* for L2-L4 pair; <0.001* for L3-L4 pair.
The p values for difference between kurtosis group pair are as follows: 1.0 for K1-K2 pair; 1.0 for K1-K3 pair; 0.001* for K1-K4 pair; 1.0 for K2-K3 pair; 0.001* for K2-K4 pair; 0.007* for K3-K4 pair.
Statistically significant. Bonferroni adjustment was applied for multiple comparisons.
For the D>10-year group (Fig. 2B), the extent of NIPTS difference continued to increase as the kurtosis value increased. However, only the NIPTS difference of the K4 kurtosis group was significantly larger than that of the other three kurtosis groups (p=0.001 to 0.007, Table 3). Meanwhile, the degree of NIPTS differences continued to decrease with the increase in noise level, and only the L4 level group had significantly lower NIPTS differences than the other three level groups (p<0.001 for all 3 comparisons, Table 3).
Evaluation of the effects of level, duration, and kurtosis on the actual measured NIPTS
A. The effects of noise level, exposure duration, and kurtosis on the actual measured NIPTS
The average of the actual measured NIPTS over 2, 3, 4, and 6 kHz for each participant was used in the study. The mixed model analysis showed that there was a significant duration effect (F=14.0, p<0.001), level effect (F=7.5, p<0.001), and kurtosis effect (F=13.8, p<0.001) on the actual measured NIPTS. The estimated marginal mean for each group is summarized in Table 4.
Table 4.
Estimated marginal means and standard errors of the actual measured NIPTS for level, duration, kurtosis groups.
| Effect | Group | Estimated Mean | Standard Error | 95% CI |
|---|---|---|---|---|
| LAeq a | L1 | 16.9 | 0.7 | 15.5–18.2 |
| L2 | 18.7 | 0.6 | 17.6–19.9 | |
| L3 | 20.6 | 0.6 | 19.4–21.7 | |
| L4 | 20.8 | 0.7 | 19.3–22.1 | |
| Duration b | D1 | 18.0 | 0.4 | 17.3–18.7 |
| D2 | 20.4 | 0.5 | 19.4–21.4 | |
| Kurtosis c | K1 | 16.6 | 0.5 | 15.5–17.6 |
| K2 | 18.2 | 0.4 | 17.4–19.1 | |
| K3 | 18.9 | 0.6 | 17.7–20.0 | |
| K4 | 23.1 | 0.9 | 21.3–24.8 |
NOTE. CI, confidence interval.
The p values for difference between level group pair are as follows: 0.238 for L1-L2 pair; <0.001* for L1-L3 pair; <0.001* for L1-L4 pair; 0.15 for L2-L3 pair; 0.195 for L2-L4 pair; 1.0 for L3-L4 pair.
The p value for difference between D1 and D2 is <0.001*.
The p values for difference between kurtosis group pair are as follows: 0.076 for K1-K2 pair; 0.024* for K1-K3 pair; <0.001* for K1-K4 pair; 0.832 for K2-K3 pair; <0.001* for K2-K4 pair; 0.001* for K3-K4 pair.
Statistically significant. Bonferroni adjustment was applied for multiple comparisons.
A1. The effect of exposure duration on the actual measured NIPTS
The actual measured NIPTS was 18.0 dB in participants having an exposure duration D≤10 years, while the measured NIPTS was 20.4 dB in participants with duration D>10 years. The difference in NIPTS between two duration groups was significantly different (p<0.001).
A2. The effect of noise level on the actual measured NIPTS
The actual measured NIPTS were 16.9 dB, 18.7dB, 20.6 dB, and 20.8 dB for level groups L1 to L4, respectively. The measured NIPTS increased with an increase in noise level. However, only the measured NIPTS in the L1 level group was significantly less than that in the L3 and L4 level groups (p<0.001 for both comparisons).
A3. The effect of kurtosis on NIPTS underestimation
The actual measured NIPTS was 16.6 dB for the Gaussian kurtosis group (K1); 18.2 dB for Low kurtosis group (K2); 18.9 dB for Medium kurtosis group (K3); and 23.1 dB for High kurtosis group (K4). The NIPTS increased with the increase of kurtosis value in the order K1, K2, K3, and K4. Except for the K1-K2 and K2-K3 group pairs, the measured NIPTS for all other kurtosis group pairs was significantly different (p<0.001 to 0.024, Table 4).
B. The effects of noise level and kurtosis on the actual measured NIPTS for two exposure durations
The effects of noise level and kurtosis on the actual measured NIPTS were analyzed for the D1 and D2 duration groups. The mixed model analysis showed that: (1) there was a significant kurtosis effect (F=17.3, p<0.001) and level effect (F=3.9, p=0.009) on measured NIPTS in the D1 group; (2) there was a significant kurtosis effect (F=3.7, p=0.012) and duration effect (F=4.9, p=0.002) on measured NIPTS in the D2 group. The estimated marginal means for the D1 and D2 groups are summarized in Tables 5. The effects of noise level and kurtosis on the actual measured NIPTS for these two exposure durations are shown in Fig. 3. For the D≤10-year group (Fig. 3A), the effect of kurtosis on the measured NIPTS is obvious, i.e. for a fixed noise level, the measured NIPTS increased as the kurtosis increased. Except for the K2-K3 group pair, the measured NIPTS for all other kurtosis group pairs was significantly different (p<0.001 to 0.04, Table 5). On the other hand, for a fixed kurtosis value, the measured NIPTS increased as the noise level increased except for the L3 level group. The measured NIPTS of the L1 level group was significantly less than that of the other three level groups (p=0.019 to 0.028, Table 5). For the D>10-year group (Fig. 3B), the effect of kurtosis on measured NIPTS was no longer as clear as that measured in the first decade of exposure. The differences in NIPTS between Gaussian (K1), Low (K2), and Medium (K3) kurtosis groups were not significant. However, the measured NIPTS of the High (K4) kurtosis group was still significantly larger than that of the other three lower kurtosis groups (p=0.003 to 0.025, Table 5).
Table 5.
Estimated marginal means and standard errors of the actual measured NIPTS for level and kurtosis groups at duration D≤10 years and D>10 years.
| Duration | Effect | Group | Estimated Mean | Standard Error | 95% CI |
|---|---|---|---|---|---|
| D≤10 years | LAeq a | L1 | 16.1 | 0.6 | 14.9–17.4 |
| L2 | 18.6 | 0.6 | 17.4–19.7 | ||
| L3 | 18.4 | 0.7 | 17.0–19.6 | ||
| L4 | 19.1 | 0.8 | 17.6–20.6 | ||
| Kurtosis b | K1 | 15.1 | 0.6 | 13.9–16.3 | |
| K2 | 17.3 | 0.5 | 16.2–18.3 | ||
| K3 | 18.1 | 0.8 | 16.5–19.7 | ||
| K4 | 21.6 | 0.7 | 20.2–22.9 | ||
|
| |||||
| D>10 years | LAeq c | L1 | 17.6 | 1.3 | 15.0–20.1 |
| L2 | 18.9 | 1.1 | 16.7–21.0 | ||
| L3 | 22.9 | 1.0 | 20.9–24.9 | ||
| L4 | 22.1 | 1.1 | 19.9–24.2 | ||
| Kurtosis d | K1 | 18.1 | 0.9 | 16.3–19.8 | |
| K2 | 19.2 | 0.7 | 17.9–20.5 | ||
| K3 | 19.6 | 0.9 | 17.8–21.3 | ||
| K4 | 24.5 | 1.8 | 21.1–28.0 | ||
NOTE. CI, confidence interval.
For duration D≤10 years:
The p values for difference between level group pair are as follows: 0.025* for L1-L2 pair; 0.028* for L1-L3 pair; 0.019* for L1-L4 pair; 1.0 for L2-L3 pair; 1.0 for L2-L4 pair; 1.0 for L3-L4 pair.
The p values for difference between kurtosis group pair are as follows: 0.04* for K1-K2 pair; 0.017* for K1-K3 pair; <0.001* for K1-K4 pair; 1.0 for K2-K3 pair; <0.001* for K2-K4 pair; 0.008* for K3-K4 pair.
For duration D>10 years:
The p values for difference between level group pair are as follows: 0.586 for L1-L2 pair; 0.008* for L1-L3 pair; 0.047* for L1-L4 pair; 0.043* for L2-L3 pair; 0.218 for L2-L4 pair; 0.875 for L3-L4 pair.
The p values for difference between kurtosis group pair are as follows: 1.0 for K1-K2 pair; 1.0 for K1-K3 pair; 0.003* for K1-K4 pair; 1.0 for K2-K3 pair; 0.005* for K2-K4 pair; 0.025* for K3-K4 pair.
Statistically significant. Bonferroni adjustment was applied for multiple comparisons.
Discussion
The performance of the ISO 1999 NIPTS prediction model
The epidemiological data that formed the ISO 1999 standard was derived from steady or quasi-steady industrial noises and these data were collected over 50 years ago (Thiery and Meyer-Bisch, 1988; Lempert, 2019). The results of this study indicate that: (1) ISO 1999 underestimated NIPTS for noise exposure durations less than or equal to 10 years, (2) When the noise level was lower than 94 dBA, the ISO 1999 model underestimated NIPTS for noise exposure durations longer than 10 years. However, when the noise level was higher than 94 dBA and the kurtosis was less than 75, the NIPTS predicted by ISO 1999 was roughly consistent with the actual NIPTS measured, (3) The ISO 1999 model always underestimated noise-induced hearing loss for noise exposures having a kurtosis value over 75, and (4) For the duration D≤10 years, the amount by which NIPTS was underestimated by the ISO 1999 increased with an increase in kurtosis.
The role of kurtosis in evaluating the NIHL
In the present study, the results from a database collected from 2,333 participants exposed to various industrial noises are in general agreement with animal (chinchilla) model experiments (Lei et al., 1994; Hamernik et al., 2003; Qiu et al., 2006, 2007, 2013) showing that: (1) an acoustic energy metric is necessary but not sufficient to evaluate the hazard of noise to hearing; (2) The temporal distribution of energy of noise (i.e. kurtosis) is an important factor in assessing noise-induced hearing loss; (3) For a fixed energy level, the noise-induced hearing loss increased as the kurtosis of the noise increased. (4) non-Gaussian complex noises are more hazardous than Gaussian noise exposures of equivalent energy and the hazard is identified by the kurtosis value of the noise. In addition to the above-mentioned conclusions, human data, however, show some peculiarities:
For exposure durations less than or equal to 10 years, the relation between hearing loss (i.e. measured NIPTS) and kurtosis value is clear, i.e. for a fixed noise level, noise-induced hearing loss increased as the kurtosis value of the noise increased (as shown in Fig. 3A). In the first decade of exposure to high-level noise, complex noise with a kurtosis β(t)>10 was more hazardous than steady-state (Gaussian) noise.
It has been reported that NIHL develops most rapidly in the first 10 years and then slows with additional exposure to noise (NIOSH, 1998; Dobie, 2001). The results in the present study also show a similar pattern for the development of NIHL over time. Moreover, as the exposure duration increased beyond 10 years the difference in NIPTS between the Gaussian, the Low, and the Medium kurtosis groups [β(t)≤75] tended to fade away (as shown in Fig. 3B). However, the NIPTS in the High kurtosis group [β(t)>75] was still significantly larger than that of other groups. This suggests that the presence of impact noise as indicated by these high kurtosis values can cause hearing damage faster and continue over a longer exposure time than predicted by the ISO 1999. The ISO 1999 model most significantly underestimated the degree of hearing loss caused by non-Gaussian noise. The results also suggests that the kurtosis value plays a more important role in assessing NIHL of workers whose exposure time is less than or equal to 10 years, compared with that of workers whose exposure time is more than 10 years.
The measured NIPTS in participants exposed to the lowest level range (85 ≤LAeq.8h<88 dBA) and for exposure durations D≤10 years, showed a significant trend to increase as kurtosis value increased (Fig. 3A). This result shows that the effect of kurtosis is particularly important near the permissible exposure level (PEL) of noise, i.e., 85 dBA. As shown in Fig. 3A, the average measured NIPTS increased from an average of 11.9 dB for the Gaussian level kurtosis to an average of 20.2 dB for the High-level kurtosis at an average rate of 2.8 dB per increment in kurtosis value. The NIPTS difference between Gaussian and High kurtosis was as much as 8.3 dB. Therefore, current exposure limits for non-Gaussian complex noise should be re-examined, especially for non-Gaussian complex noise with high kurtosis value.
For noise levels in the range 94≤LAeq.8h≤100 dBA (L4) and exposure durations D>10 years, most participants exposed to the high levels of noise wore earplugs sporadically. This may explain why the NIPTS in participants exposed to noises with medium or lower kurtosis values showed little difference in NIPTS when compared to ISO 1999 (Fig. 2B). However, despite HPDs, participants exposed to high kurtosis noise still suffered severe hearing loss. This result may suggest that it is necessary to carefully evaluate the protective function of HPDs against impulsive noise, especially when the kurtosis value is larger than 75. When evaluating the hearing protection efficiency of HPDs, in addition to the noise energy attenuation index, it may be necessary to evaluate the attenuation with respect to noise impulsiveness (i.e., kurtosis).
Considering that many industrial noise environments are non-Gaussian and that sound energy metrics (e.g., Leq) are suitable for Gaussian noise, there is a need to implement alternative metrics or a combination of metrics for assessing non-Gaussian noise environments. Results from the present study have shown that the kurtosis measurement is a more precise metric for assessment of hearing loss from complex noise.
In this study, only the data with noise exposure levels between 85 and 100 dBA were used for the NIPTS analysis. The lower limit of applicability of the ISO standard, an LAeq.8h of 75 dBA, is implicit in the NIPTS calculation method. NIPTS analysis of non-Gaussian noise exposure at LAeq.8h of 75–85 dBA will help us establish an appropriate noise exposure limit that does not under- or over-estimate noise-induced hearing loss. To do this, a large dataset from workers exposed to a variety of industrial noise exposures with LAeq.8h of 75–85 dBA needs to be collected.
Evidence shows that ethnicity could be one of the factors that may affect the expected distribution of pure-tone hearing thresholds. This dependence on ethnicity has prompted the development of national or regional datasets (Johansson and Arlinger, 2004; Tambs et al., 2006; Flamme, Deiters and Needham, 2011; Jun et al. 2015; Rodriguez Valiente et al, 2015; Flamme et al. 2020). Korea recently conducted the Korean National Health and Nutrition Examination Survey (KNHANES) 2010–2012 (Park et al., 2016). Median hearing thresholds between the KNHANES 2010–2012 and the USA National Health and Nutrition Examination Survey 1999–2004 were compared across age and gender, and no significant ethnic difference in hearing thresholds between the USA population and Korean population was found. Such a population-based dataset is not yet available for the Chinese population. Future studies would benefit from the inclusion of unexposed comparison groups on the examination of hearing thresholds.
Conclusion
The above data show that ISO 1999 underestimated NIPTS for both Gaussian and non-Gaussian noise exposure. The applicability of the ISO 1999 prediction model to different types of noise exposures needs to be reconsidered. Second, the kurtosis of noise plays an important role in evaluating the risk of NIHL. For a fixed energy level and exposure duration range, the noise-induced hearing loss increased as the kurtosis value of the noise increased. Finally, although acoustic energy is a necessary metric for the evaluation of noise environments for hearing conservation purposes, it may not be sufficient to characterize the risk to hearing. Energy and kurtosis may represent a necessary and sufficient set of metrics for such an evaluation. A better understanding of the role of the kurtosis metric in NIHL should lead to its incorporation into a new and more accurate method of noise exposure measurement and hearing risk assessment.
Acknowledgments:
M.B.Z. designed and performed investigation, analyzed data, and wrote original draft; H.W.X., J.N.Z., L.F.Z., and M.Z. conducted field investigation, subject selection and interview, data evaluation, and quality control; X.S. and W.J.H. designed investigation and provided the discussion; H.Z. was responsible for project administration, data analysis, and manuscript review; J.S.L. conducted project supervision and data analysis; C.A.K., T.C.M., and W.J.M. designed the project, validated the data and methodology, reviewed and edited the manuscript; H.Y.Z analyzed the data and statistically interpreted the results; W.Q. designed and supervised the project, analyzed data, wrote and edited the paper. All authors discussed the results and implications and commented on the manuscript at all stages.
The authors wish to thank those who agreed to participate in the study for their time, interest, and cooperation. Dr. Roger Hamernik from SUNY Plattsburgh, Drs. Robert Park and Edward Zechmann from the National Institute for Occupational Safety and Health provided helpful critiques of the manuscript. This work was sponsored by Grant 200–2015-M-63857, 200–2016-M-91922 from the National Institute for Occupational Safety and Health, USA; Grant N00014–17-1–2198 from Office of Naval Research, USA; Zhejiang province key research and development project (2015C03039), China; Zhejiang Provincial Program for the Cultivation of High-level Innovative Health Talents, China; and Health Commission of Zhejiang Province (2019KY057), China. Grant No. 81771936 from National Natural Science Foundation, China. The findings and conclusions in this report are those of the author(s) and do not necessarily represent the official position of the National Institute for Occupational Safety and Health, Centers for Disease Control and Prevention.
Footnotes
The authors declare they have no actual or potential competing financial interests.
References
- American National Standards Institute (2003). Maximum permissible ambient noise levels for audiometric test rooms ANSI S3.1.−1999. New York. [Google Scholar]
- Burns W, and Robinson DW (1970). Hearing and Noise in Industry (Her Majesty’s Stationery Office, London: ). [Google Scholar]
- Canlon B, Borg E, and Flock A (1988). Protection against noise trauma by pre-exposure to a low-level acoustic stimulus. Hearing Res 34:197–200. [DOI] [PubMed] [Google Scholar]
- Clark WW (1991). Recent studies of temporary threshold shift (TTS) and permanent threshold shift (PTS) in animals. J. Acosut. Soc. Am 90:1, 155–163. [DOI] [PubMed] [Google Scholar]
- Davis RI, Qiu W, Heyer NJ, Zhao YM, Yang QL, Li N, Tao LY, Zhu LL, Zeng L, and Yao DH (2012). The use of the kurtosis metric in the evaluation of occupational hearing loss in workers in China: Implications for hearing risk assessment. Noise Health 14(61),330–342. [DOI] [PubMed] [Google Scholar]
- Dobie RA Medical-Legal Evaluation of Hearing Loss 2nd ed. San Diego CA: Singular; 2001. p. 270–277. [Google Scholar]
- Dunn DE, Davis RR, Merry CJ, and Franks JR (1991). Hearing-loss in the chinchilla from impact and continuous noise exposure. J. Acoust. Soc. Am 90(4),1979–1985. [DOI] [PubMed] [Google Scholar]
- Earshen JJ (1980). Noise dosimeters: on measurement reliability and instrument accuracy. J Acoust Soc Am, 68, S21. [Google Scholar]
- Earshen JJ (1994). On comparing noise metrics applied to hearing conservation. J Acoust Soc Am, 96, 3272–3272. [Google Scholar]
- Erdreich J (1986). A distribution based definition of impulse noise. J Acoust Soc Am, 79, 990–998. [DOI] [PubMed] [Google Scholar]
- Flamme GA, Deiters K, Needham T (2011). Distributions of pure-tone hearing threshold levels among adolescents and adults in the United States by gender, ethnicity, and age: Results from the US National Health and Nutrition Examination Survey. Int J Audiol 50 Suppl 1:S11–20. doi: 10.3109/14992027.2010.540582. [DOI] [PubMed] [Google Scholar]
- Flamme GA, Deiters KK, Stephenson MR, Themann CL, Murphy WJ, Byrne DC, Goldfarb DG, Zeig-Owens R, Hall C, Prezant DJ, and Cone JE (2019): Population-based age adjustment tables for use in occupational hearing conservation programs, International Journal of Audiology, DOI: 10.1080/14992027.2019.1698068 [DOI] [PMC free article] [PubMed] [Google Scholar]
- Hamernik RP, and Qui W (2001). Energy-independent factors influencing noise-induced hearing loss in the chinchilla model. J. Acoust. Soc. Am 110:3163–3168. [DOI] [PubMed] [Google Scholar]
- Hamernik RP, Qiu W and Davis R (2003). The effects of the amplitude distribution of equal energy exposures on noise-induced hearing loss: The kurtosis metric. J. Acoust. Soc. Am 114:386–395. [DOI] [PubMed] [Google Scholar]
- Hoffman HJ, Dobie RA, Ko CW, Themann CL, and Murphy WJ (2010). Americans hear as well or better today compared with 40 years ago: hearing threshold levels in the unscreened adult population of the United States, 1959–1962 and 1999–2004. Ear & Hearing, 31(6):725–34. doi: 10.1097/AUD.0b013e3181e9770e. [DOI] [PubMed] [Google Scholar]
- ISO 1999 (2013). Acoustics—Estimation of noise induced hearing loss International Organization for Standardization, Geneva, Switzerland. [Google Scholar]
- Johansson M, Arlinger S. (2004). Reference data for evaluation of occupationally noise-induced hearing loss. Noise Health 6(24):35–41. [PubMed] [Google Scholar]
- Jun HJ, Hwang SY, Lee SH, Lee JE, Song JJ, Chae S (2015). The prevalence of hearing loss in South Korea: data from a population-based study. Laryngoscope 125(3):690–4. doi: 10.1002/lary.24913. Epub 2014 Sep 12. [DOI] [PubMed] [Google Scholar]
- Lataye R, Campo P (1996). Applicability of the Leq as a damage-risk criterion: An animal experiment. J. Acost. Soc Am 99:1621–1632. [DOI] [PubMed] [Google Scholar]
- Lei SF, Ahroon WA, and Hamernik RP (1994). The application of frequency and time-domain kurtosis to the assessment of hazardous noise exposures. J. Acoust. Soc. Am 96(3),1435–1444. [DOI] [PubMed] [Google Scholar]
- Lempert B (2019). ISO Estimates of Noise-induced Hearing Impairment. J. Acoust. Soc. Am 145(6): 3640–3646. [DOI] [PubMed] [Google Scholar]
- Lutman ME and Davis AC (1996). Distributions of hearing threshold levels in populations exposed to noise. in Scientific Bases of Noise-Induced Hearing Loss, (eds) Axelsson A, Borchgrevink H, Hamernik RP, Hellstrom P, Henderson D, and Salvi.Thieme R, New York. pp. 378–396. [Google Scholar]
- Mills JH, Lee F, Dubno JR, and Boettcher FA (1996). Interactions between age-related and noise-induced hearing loss: in Scientific Bases of Noise-Induced Hearing Loss, (eds) Axelsson A, Borchgrevink H, Hamernik RP, Hellstrom P, Henderson D, and Salvi.Thieme R, New York. pp. 193–212. [Google Scholar]
- NIOSH (1998). Criteria for a Recommended Standard: Occupational Noise Exposure-Revised Criteria U.S. Department of Health, Education, and Welfare, National Institute for Occupational Safety and Health, Publication no. 98–126 Cincinnati, OH. [Google Scholar]
- Park YH, Shin SH, Byun SW, and Kim JY (2016). Age- and gender-related mean hearing threshold in a highly-screened population: The Korean National Health and Nutrition Examination Survey 2010–2012. PLOS ONE | DOI: 10.1371/journal.pone.0150783. [DOI] [PMC free article] [PubMed] [Google Scholar]
- Passchier-Vermeer W (1977). Hearing levels of non-noise exposed subjects and of subjects exposed to constant noise during working hours, Report No. B-367 (Research Institute for Environmental Hygiene, the Netherlands: ). [Google Scholar]
- Qiu W, Hamernik RP, and Davis B (2006). The kurtosis metric as an adjunct to energy in the prediction of trauma from continuous, nonGaussian noise exposures. J. Acoust. Soc. Am 120(6),3901–3906. [DOI] [PubMed] [Google Scholar]
- Qiu W, Davis B, and Hamernik RP (2007). Hearing loss from interrupted, intermittent, and time varying Gaussian noise, exposures: The applicability of the equal energy hypothesis. J. Acoust. Soc. Am 121(3),1613–1620. [DOI] [PubMed] [Google Scholar]
- Qiu W, Hamernik RP, and Davis RI (2013). The value of a kurtosis metric in estimating the hazard to hearing of complex industrial noise exposures. J. Acoust. Soc. Am 133(5),2856–2866. [DOI] [PMC free article] [PubMed] [Google Scholar]
- Rodríguez VA, Roldán FA, García BJR, Ramírez CR (2015) Hearing threshold levels for an otologically screened population in Spain. Int J Audiol 54(8):499–506. doi: 10.3109/14992027.2015.1009643. [DOI] [PubMed] [Google Scholar]
- Sulkowski WJ, Kowalska S, and Lipowczan A (1983). Hearing loss in weavers and drop-forge hammermen: Comparative study on the effects of steady-state and impulse noise. In: Proceedings of the 4th International Congress - Noise as a Public Health Problem, ed. Rossi G, Turin, Italy, pp. 171–184. [Google Scholar]
- Tambs K, Hoffman HJ, Borchgrevink HM, Holmen J, Engdahl B (2006). Hearing loss induced by occupational and impulse noise: results on threshold shifts by frequencies, age and gender from the Nord-Trøndelag Hearing Loss Study. Int J Audiol 45(5):309–17. [DOI] [PubMed] [Google Scholar]
- Taylor W, Lempert B, Pelmear P, Hemstock I, and Kershaw J (1984). Noise levels and hearing thresholds in the drop forging industry. J. Acoust. Soc. Am,76:807–819. [DOI] [PubMed] [Google Scholar]
- Thiery L and Meyer-Bisch C (1988). Hearing loss due to partly impulsive industrial noise exposure at levels between 87 and 90 dB. J. Acoust. Soc. Am 84:651–659. [DOI] [PubMed] [Google Scholar]
- Ward WD (1991). The role of intermittence in PTS. J. Acoust. Soc. Am 90:164–169. [DOI] [PubMed] [Google Scholar]
- Xie HW, Qiu W, Heyer NJ, et al. (2016). The use of the kurtosis-adjusted cumulative noise exposure metric in evaluating the hearing loss risk for complex noise. Ear & Hearing, 37(3):312–323. [DOI] [PMC free article] [PubMed] [Google Scholar]
- Zhao YM, Qiu W, Zeng L, Chen SS, Cheng XR, Davis RI, and Hamernik RP (2010). Application of the kurtosis statistic to the evaluation of the risk of hearing loss in workers exposed to high-level complex noise”. Ear & Hearing 31(4):527–532. [DOI] [PubMed] [Google Scholar]