

Abstract
Diamond-backed Terrapins inhabit coastal salt marshes along the eastern and Gulf coasts of North America. Terrapins are adapted to intermediate salinities yet frequently face saltwater-inundated marsh habitat exceeding 25 ppt (or grams/kilogram). We investigated the effect of salinity on the growth of hatchling terrapins and on their compensatory responses to salinity stress. We randomly assigned 30 terrapin hatchlings each to one of five salinity treatments (1, 5, 10, 20, or 35 ppt). Over 75 d, we regularly monitored behavior, appetite, and changes in growth; and calculated ratios of heterophils to lymphocytes (H:L ratio) to assess responses to prolonged salinity stress. Consistent with prior studies, chronic exposure to high salinity significantly reduced hatchling growth. Hatchlings in 20-ppt and 35-ppt salinities exhibited appetite suppression and saltwater avoidance and were more likely to show freshwater-seeking behaviors. H:L ratios were higher among hatchlings in 20-and 35-ppt salinities, consistent with a corticosterone-driven stress response to sustained high-salinity exposure, which may play a role in limiting growth. Our findings suggest hatchling growth and distribution among local habitats will vary spatially depending on habitat salinity and freshwater accessibility. The growth-limiting effects of chronically high salinity or limited access to freshwater could therefore increase hatchling mortality and be an important driver of spatial variation in terrapin demography and abundance. However, when freshwater sources are available, compensatory behaviors might reduce growth-limiting effects. Terrapin recruitment is likely to be impacted as rising sea levels, increased human water use, land development, and other anthropogenic changes alter freshwater inputs to coastal marshes.
Keywords: Climate change, H:L ratio, Salt marsh, Sea level rise
Coastal salt marshes are physically challenging environments for the terrestrial and semiaquatic animals that inhabit them, largely because of daily tidal cycles and salinity fluctuations. Salinity across a salt marsh ranges spatially and temporally from mildly brackish (1–10 g/kg, or parts per thousand [ppt]) to seawater (35 ppt), and the availability of freshwater for animals is often limited to episodic rainfall, groundwater sources, freshwater surface inflow, or preformed water (Dunson 1970; Davenport and Macedo 1990; Więski et al. 2010). As a result of this instability, few terrestrial vertebrate species have successfully colonized tidal marshes, despite the system’s high productivity and resource availability (Greenberg et al. 2006).
Vertebrates inhabiting salt marshes or other freshwater-limited environments have evolved various allostatic processes to maintain hydration levels sufficient for metabolic processes. Allostasis refers to the suite of morphological, behavioral, and physiological adjustments an organism undergoes in response to a stressor in order to regain homeostasis (McEwen and Wingfield 2010). For vertebrates encountering increased salinity in estuarine habitats, allostasis is facilitated by skin barriers, postrenal water reabsorption, urine concentration, and specialized salt glands (Bentley et al. 1967; Pidcock et al. 1997; Marom et al. 2006; Elgot et al. 2017), as well as behavioral strategies like altering prey selection, reducing activity, inducing torpor, actively seeking freshwater sources, or using terrestrial retreats (Lillywhite et al. 1973; Dunson 1981; Lillywhite and Navas 2004; Nagy 2004). Understanding an organism’s complex suite of responses to stressors that alter hydromineral balance (e.g., interactions between physiological and behavioral adjustments) can provide insight into how their populations might respond to environmental change.
The Diamond-backed Terrapin (Malaclemys terrapin) is the only turtle endemic to salt marshes along the South Atlantic and Gulf coasts of the United States (Hart and Lee 2006). Terrapins use both low and upland marsh habitat for feeding, basking, and overwintering. They are among a select number of terrestrial or semiaquatic vertebrates—and among very few reptiles—that have evolved to exploit brackish water habitat (Greenberg et al. 2006; Rasmussen et al. 2011). Several studies have aimed to understand salt tolerance in terrapins by focusing on a specific morphological, behavioral, or physiological aspect of osmoregulation (see Harden and Williard 2018, for review). Briefly, Diamond-backed Terrapins cannot concentrate salts in urine; therefore, to regulate body fluid composition, they must integrate unique physiological capabilities with adaptive behavioral strategies (Hildebrandt 2001; Harden et al. 2015). Terrapin integument is less salt permeable than that of freshwater turtles (Robinson and Dunson 1976). Terrapins can accumulate osmolytes (e.g., Na+, Cl−) and urea to raise their internal osmotic pressure in desiccating conditions (Gilles-Baillien 1973), and they possess large, complex lachrymal salt glands to expel salt (Bentley et al. 1967; Dunson 1970; Cowan 1981; Dunson and Travis 1994; Belfry and Cowan 1995). These adaptations allow them to maintain an internal ion balance across a range of environmental salinities. However, osmoregulation—particularly salt expulsion—is energetically costly. Occupying chronically hypersaline environments likely causes a shift in energy allocation from growth to osmoregulation (Dunson 1985; Holliday et al. 2009). The stress response might play an important role in mediating this shift from growth to essential functions; in other vertebrates, glucocorticoid secretion triggered by environmental perturbation interrupts normal life-history stages, redirecting behavior and physiology to cope with stressors (see Wingfield 2013, for review).
Like adult terrapins, hatchlings and juveniles are observed across a broad range of salt marsh environments, including areas routinely exposed to salinities at or exceeding that of seawater (Dunson 1985; Rowe 2018). Because hatchling growth affects predation rates and time to first maturity in turtles (Congdon et al. 2018), the trade-off between growth and osmoregulation in juveniles may have substantial fitness and population consequences. Hatchling terrapins possess numerous mechanisms for allostasis in response to high salinity exposure; they can discriminate freshwater from saltwater, exploit rainfall as an episodic freshwater source, increase time basking, bury in mud, and cease feeding to minimize salt intake in hyperosmotic environments (Dunson 1985; Davenport and Macedo 1990; Davenport and Ward 1993; Davenport and Magill 1996; Harden et al. 2007; Holliday et al. 2009). These behavioral adjustments likely serve as a first response against water loss before energy-intensive physiological mechanisms are required (Williard et al. 2019). The biochemical mediators of a stress reaction (e.g., corticosterone in terrapins) influence metabolism, energetics, and water and ion balance in vertebrates (Peaker and Linzell 1975; Fontaínhas-Fernandes et al. 2003; McEwen and Wingfield 2010; Wack et al. 2012; Thierry et al. 2013). The stress response, through prioritizing behavioral and physiological functions immediately necessary for survival (Wingfield and Romero 2001), might be a key allostatic mechanism by which salinity affects hatchling and juvenile terrapin growth. Although prior studies provide insights into isolated responses of terrapins to high salinities, we aimed to examine longer-term behavioral and physiological responses of hatchling terrapins to a range of salinities simultaneously.
The objectives of this study were to quantify growth, physiological stress responses, and behavioral responses of hatchling Diamond-backed Terrapins from Georgia during a 75-d exposure to a range of ecologically relevant salinities. Assessing responses to high salinity may improve future habitat management strategies for this species in the face of anthropogenic changes to salt marsh hydrology. We hypothesized that hatchling growth rates would be negatively correlated with salinity and that hatchlings in higher salinities would show progressive loss of appetite, increased freshwater-seeking behaviors, and increased time drinking periodically available freshwater. We also hypothesized that hatchling heterophil–lymphocyte (H:L) ratios, an indirect indicator of physiological stress (Davis et al. 2008), would be positively correlated with salinity.
Materials and Methods
All methods described were approved by the University of Georgia Institutional Animal Care and Use Committee (AUP-2017 11-006-Y1-A0), and wildlife collections were permitted by the Georgia Department of Natural Resources (1000602439).
Animal Collection and Husbandry
In October 2017, we acquired 30 Diamond-backed Terrapin hatchlings from Skidaway Island, Georgia. Hatchlings were incubated in an outdoor nest box used to relocate nests laid on a golf course bordered by salt marsh. The nest box was designed to maximize incubation temperatures to produce female hatchlings. Hatchlings were from multiple clutches, but as the relationships among individuals were not known, we could not directly account for sibship or maternal effects in our design. Rowe et al. (2017) and Rowe (2018) found that initial terrapin hatchling size varied among clutches but found no clutch (maternal) effect on hatchling metabolic rate or growth after any transient effects during yolk dependence. Therefore, to reduce potential bias due to potential maternal or sibship effects, we used a stratified random assignment of hatchlings among treatments based on initial size.
We transferred hatchlings to our laboratory in Athens, Georgia and held them in standard 21-L aquaria with 5 L of tap water. We used Instant Ocean® Sea Salt (SS15–10, Instant Ocean, Spectrum Brands) to raise the salinity of the tap water to 5 ppt during a 4-wk holding phase. This salinity was chosen based on prior literature indicating that water salinity between 1 and 10 ppt is optimal for terrapins (Holliday et al. 2009). Each aquarium had a ramp to an above-water platform positioned under a 45-W incandescent halogen bulb to provide light and heat (Fig. 1). Lights were set on a 12:12-h light:dark cycle. Aquaria were raised 3.1 cm at one end to create a gradient of shallow to deep water, with the ramp and platform located at the shallower end. We drew a line in permanent marker at the 5-L water mark of each aquarium and added tap water daily to maintain a constant water volume and salinity. We fed hatchlings raw Gulf shrimp (stored frozen and thawed in tap water) every 3 d.
Fig. 1.—

Illustration of experimental aquarium. A 21-L aquarium, elevated 3.1 cm at one end, was filled with 5 L of saline water. A suspended platform below a light contained a petri dish where fresh water was provided episodically. A mesh ramp allowed hatchling terrapins to leave the saline water and climb to the platform and dish.
Experimental Design
At the start of the experiment, we blotted each terrapin dry with a small towel and weighed it on an electronic balance to the nearest 0.1 g. We used digital calipers to measure straight-line carapace length and plastron length to the nearest 0.1 mm. We then assigned each of 30 hatchlings to one of five salinity treatments (1, 5, 10, 20, or 35 ppt; n = 6 per treatment) chosen based on ecological relevance; salt marshes on barrier islands along the Georgia coast exhibit tidal salinity fluctuations ranging from <1 ppt to 38 ppt (Blanton 2007a–h; Di Iorio 2016a–i). As justified previously, we used a stratified random assignment of hatchlings among treatments based on initial size to limit potential bias due to sibship effects and to ensure similar variation in initial hatchling size among treatments. We held terrapins individually in 30 standard 21-L aquaria (n = 6 per salinity treatment; 1 turtle per aquarium) identical to the ones described previously but with a 10-cm petri dish added to each platform (Fig. 1). Aquaria were organized using a shelving system with six rows of five aquaria per row. Water temperatures varied among aquaria depending on their position in the shelving system, with interior aquaria and aquaria on higher shelves being slightly warmer. To account for this, we placed one replicate of each salinity treatment on each of the six shelves and randomly determined the position of each treatment on a shelf (e.g., each 5-ppt aquarium was on a different shelf, each in a random row position within the shelf). Every 10 d, we drained, cleaned, and replaced the saltwater in each aquarium. Every other water change, we rotated all aquaria to a new shelf. Therefore, over the course of the experiment, all aquaria were distributed for similar amounts of time among all shelves. We measured water temperature and salinity every 3 d in all aquaria using a calibrated waterproof multiparameter meter (Oakton WD-35425–60, Cole-Parmer LLC). Water temperatures averaged 24.7°C (SD = 2.7), and salinities averaged within 1 ppt of the target salinity of each treatment.
We recorded behavioral observations daily. Observers entered the room silently, without turning on overhead lights, and recorded observations out of the view of the terrapins, behind a wide wall beam approximately 5 ft away from the terrapin aquaria. We recorded whether each animal was in the water, on the ramp, on the platform, or in the petri dish (Fig. 1) and noted if the turtle was inactive (not moving) or active (swimming or crawling). Every 3 d, we fed each turtle 1.0 g of diced, thawed shrimp, which we increased to 1.5 g after 48 d. After 24–48 h any shrimp not consumed was removed and weighed to determine the amount eaten. On five occasions, shrimp consumption was not measured because of constraints on our husbandry personnel and availability to complete this time-intensive task. Every 5 d, we added tap water (hereafter “fresh water”) to the petri dishes on platforms and placed each hatchling in its dish. Hatchlings were able to leave the dish immediately or remain there. The freshwater evaporated from the dish in under 24 h, simulating rain events by creating brief, episodic freshwater access. On five occasions when we added freshwater, we recorded whether or not and how long each hatchling drank before leaving the dish. We characterized a hatchling as “drinking” if its head was continuously submerged underwater and/or it displayed postures and movements of the neck specific to drinking behaviors (Davenport and Macedo 1990). It was apparent that hatchlings only used the filled dish to drink. Thus, time spent in the dish translated to time spent drinking in all cases. Using methods described above, we measured carapace and plastron length down to the nearest millimeter and weighed hatchlings (dry) every 14 d.
We used leukocyte (white blood cell) ratios to assess whether chronic stress responses differed among hatchling terrapins in response to salinity exposure. When vertebrates experience acute stress, plasma corticosteroid concentrations rise within minutes and return to baseline within a few hours (Cockrem and Silverin 2002; Davis and Maney 2018). During chronic stress extending over weeks or months, blood corticosteroid levels can attenuate, making the direct, hormonal measurement of stress difficult (Goessling et al. 2015). There is consistent evidence from both veterinary medicine and ecological studies that increased endogenous or exogenous corticosteroids triggers a relative increase in the proportion of neutrophils (in mammals, amphibians, and fish) or heterophils (in birds and reptiles) in circulation, whereas the proportion of lymphocytes declines or remains unaffected. This pattern is known as the stress leukogram and is commonly observed in animals with chronic illness. Under chronic stress, heterophil-to-lymphocyte (H:L) ratios appear to remain high despite recovered plasma corticosteroid concentrations (Goessling et al. 2015). Therefore, leukocyte ratios are useful to detect chronic stress reactions and are widely used in wildlife management and in studies assessing the impact of environmental stressors (Davis et al. 2008; Davis and Maney 2018). On Day 60, following methods described previously by Mans (2008), we collected one drop (approximately 0.05 mL) of blood from the subcarapacial venous sinus of each hatchling using a 21 gauge × 33 mm hypodermic needle. We then prepared a single blood film per terrapin using the standard slide method, or push technique, in which blood is spread between two microscope slides. Films were air dried and stained with Wright-Giemsa. Slides were labeled with hatchling ID number but not salinity treatment. We placed each blood film under the 100× oil immersion lens of a standard light microscope and examined leukocytes in a zigzag pattern starting in a monolayer area just behind the feathered edge. Following published morphological descriptions of blood cells in reptiles (Stacy et al. 2011), we counted lymphocytes and heterophils until a combination of 50 was reached and then calculated H:L ratios.
Ethical Considerations
For the general welfare of the terrapins, we soaked all hatchlings in freshwater for 30 min and provided them with Reptomin® pellets (Tetra, Spectrum Brands) ad libitum while we conducted water changes (every 10 d). We also closely monitored each terrapin for abnormal behavior. If a hatchling appeared abnormally lethargic or dry, we immediately added tap water to its dish and placed it inside. This occurred three times: twice with one hatchling in the 35-ppt treatment, and once with one hatchling in the 20-ppt treatment. In each case, the hatchling began drinking immediately when placed in tap water. After watching the hatchling closely for 40–60 min, we removed it from the water to examine its condition. In all cases, providing a freshwater soak restored normal behavior.
Before drawing blood from a hatchling, the puncture site was cleaned with alcohol. After drawing blood, we applied pressure to the site with gauze for 30 s and cleaned it again with alcohol. We closely monitored the hatchlings for 48 h and observed no mortality or ill effects.
After 75 d, all terrapins were returned to a standard salinity of 9 ppt for 2 wk. We continued to monitor them daily and provide freshwater soaks during water changes. Terrapins were fed Reptomin® pellets ad libitum and Zoo Med® dried red shrimp (Zoo Med Laboratories) on occasion. All hatchlings appeared active and healthy. We released all 30 terrapins to their natal marsh on Skidaway Island, Georgia on 16 March 2018.
Statistical Analyses
At the conclusion of the experiment, we determined that one hatchling in the 1-ppt treatment was a male based on morphology (a proportionately longer tail with the cloaca extending well beyond the plastron); therefore, we eliminated this individual from analyses. To examine the effects of salinity on hatchling change in mass, change in carapace length, or H:L ratio, we used generalized linear models with salinity as a continuous fixed effect. For models of change in mass or length, we also included initial mass or carapace length as fixed effects. We modeled both change in mass and change in carapace length as measures of growth because changes in mass can be confounded by dehydration (Robinson and Dunson 1976). We also modeled growth rates in millimeters per day (mm/d) and grams per day (g/d). Because growth was linear among treatments (see Supplemental Material, available online), we obtained the slope of the linear trendline for measurements (in grams or millimeters) vs. day of measurement as the growth rate of each terrapin. We then used a generalized linear model with salinity as a fixed effect to examine the relationship between salinity and growth rate. Rather than assume linear responses, we fit all models using linear, gamma, and second- and third-order polynomials and then selected the best model fit using small sample size-corrected Akaike information criterion (AICc) with the package AICcmodavg (Mazerolle 2019) to determine which curve was best for modeling the response variable. To model effects of salinity on feeding behavior, we used a linear mixed-effect model in the nlme package (Pinheiro et al. 2018) to perform a repeated-measures analysis of cumulative wet mass of food consumed, with salinity as a continuous fixed effect and turtle identity as a random effect. We used logistic regression to model the probability of a hatchling being out of water or exhibiting water-seeking behavior (voluntarily sitting in the water dish while it was empty) as a function of salinity. All analyses were performed in R v3.6.1 (R Core Team 2019).
Results
Growth
Terrapin growth over the duration of the study was positive and generally linear among all treatments (see Supplemental Material, available online). The gamma model was the best fit for modeling salinity effects on the change in mass and H:L ratio, and the linear model was the best fit for modeling salinity effects on the change in carapace length. After 75 d, all terrapin hatchlings had grown; however, changes in mass and length varied as a function of salinity (Table 1; Fig. 2A,C). Growth declined with increasing salinity, such that hatchlings held between 20 and 35 ppt showed a 50% decline in growth on average over 75 d. Change in mass was also positively correlated with initial hatchling mass; however, this effect was small relative to the effect of salinity (Table 1; Fig. 2A,B). Initial carapace length was not a predictor of change in carapace length. Growth rates also declined with increasing salinity; a gamma distribution was the best fit for modeling effects of salinity on growth rates in both millimeters per day (carapace length) and grams per day (Table 1; Fig. 3A,B).
Table 1.—
Generalized linear models of effects of salinity on the change in mass, change in carapace length, growth rate in millimeters per day and grams per day, and heterophil–lymphocyte ratio in hatchling Diamond-backed Terrapins (Malaclemys terrapin).
| Variable | Beta | SE | t | P |
|---|---|---|---|---|
| Change in mass (family = gamma) | ||||
| Intercept | 0.251 | 0.058 | 4.33 | <0.001 |
| Salinity | 0.006 | 0.001 | 5.73 | <0.001 |
| Initial mass | −0.012 | 0.005 | −2.19 | 0.038 |
| Growth rate in grams per day (family = gamma) | ||||
| Intercept | 10.6 | 1.10 | 9.62 | <0.001 |
| Salinity | 0.43 | 0.08 | 4.85 | <0.001 |
| Change in carapace length (family = linear) | ||||
| Intercept | 17.4 | 5.21 | 3.35 | 0.003 |
| Salinity | −0.17 | 0.02 | −7.16 | <0.001 |
| Initial CL | −0.23 | 0.14 | −1.64 | 0.112 |
| Carapace growth rate in millimeters per day (family = gamma) | ||||
| Intercept | 7.89 | 0.866 | 9.11 | <0.001 |
| Salinity | 0.377 | 0.073 | 5.15 | <0.001 |
| Heterophil–lymphocyte ratio (family = gamma) | ||||
| Intercept | 3.65 | 0.539 | 6.75 | <0.001 |
| Salinity | −0.067 | 0.019 | −3.46 | 0.002 |
Fig. 2.—

Between Day 1 and Day 77 of the experiment, the change in mass as a function of (A) salinity and (B) initial mass, (C) the change in carapace length as a function of salinity, and (D) heterophil–lymphocyte ratio (blood drawn on Day 60) as a function of salinity in hatchling Diamond-backed Terrapins (Malaclemys terrapin). Shaded portions are 95% confidence bands.
Fig. 3.—
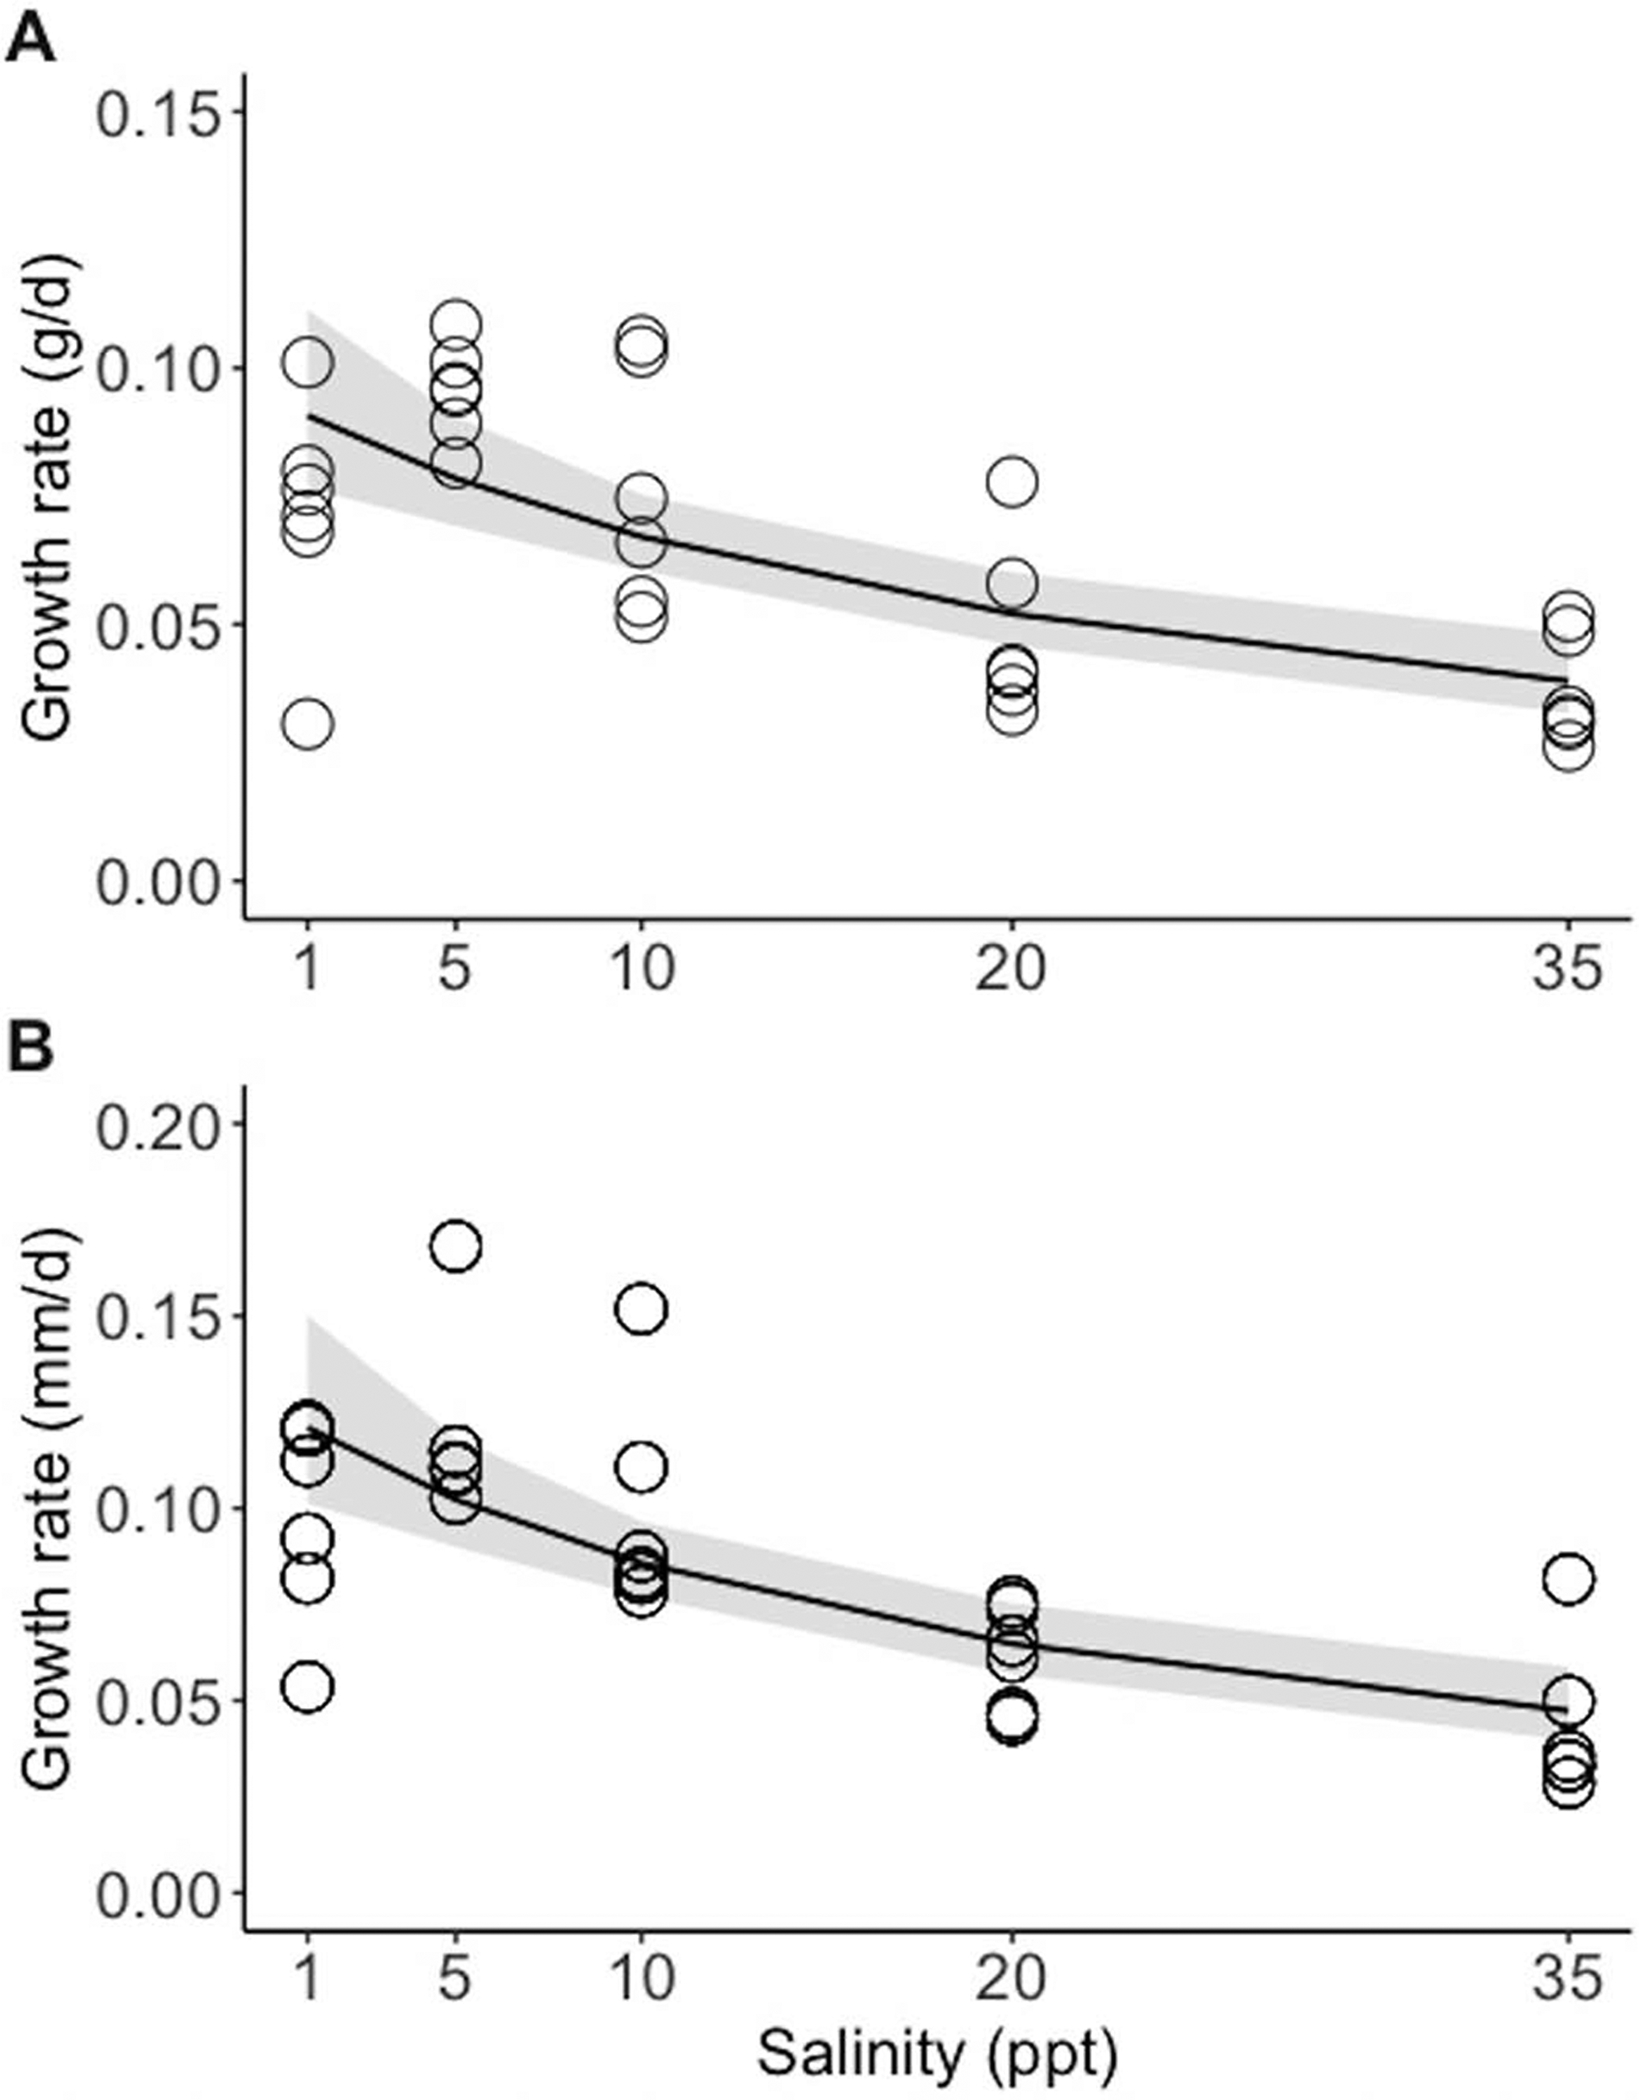
Between Day 1 and Day 77 of the experiment, the (A) growth rate in grams per day (g/d) and (B) carapace growth rate in millimeters per day (mm/d) as a function of salinity in hatchling Diamond-backed Terrapins (Malaclemys terrapin). Shaded portions are 95% confidence bands.
Behavior
Drinking, saltwater avoidance, and freshwater-seeking behavior were all positively correlated with salinity. Apart from one individual on one occasion, all hatchlings in the 1-, 5-, and 10-ppt treatments immediately left the freshwater dish upon placement there and returned to the main (saline) water. In contrast, only once did a hatchling in the 35-ppt treatment immediately leave the freshwater dish. Hatchlings in the 35-ppt treatment drank for a mean time of 30 min (SD = 16), and hatchlings in the 20-ppt treatment drank for a mean time of 16 min (SD = 15). Towards the latter half of the study, however, we observed the hatchlings in the 20-ppt treatment drinking for >30 min. It was apparent during the trial that hatchlings in high-salinity treatments were behaviorally conditioning to freshwater sources quickly. On days when freshwater was not provided, the probability that a hatchling was observed out of water (exhibiting saltwater avoidance) or was voluntarily sitting in the dry, freshwater dish (exhibiting water-seeking behavior) increased with increasing salinity (probability of being out of water, Beta = 0.054, SE = 0.006, z = 7.98, P < 0.001; probability of being in empty freshwater dish, Beta = 0.043, SE = 0.016, z = 2.67, P < 0.001). Hatchlings held in 20 or 35 ppt demonstrated a 167% (CI = 128–213%) or 448% (CI = 344–569%) increase in probability of exhibiting saltwater avoidance compared to hatchlings held in 1 ppt (Fig. 4). Hatchlings held in 20 or 35 ppt had a 126% (CI = 50–239%) or 327% (CI = 136–673%) increase in probability of being in an empty freshwater dish compared to hatchlings held in 1 ppt (Fig. 4).
Fig. 4.—

The probability of a Diamond-backed Terrapin (Malaclemys terrapin) hatchling being observed (A) out of the saline water (on the ramp or platform) and (B) in an empty freshwater dish as functions of salinity treatment. Shaded areas represent confidence intervals.
Feeding
Cumulative food intake over 75 d differed significantly by treatment group (significant salinity × day interaction; Table 2; Fig. 5). Reduced food consumption was evident among hatchlings in the 35-ppt treatment within 2 wk, and those hatchlings consumed the least shrimp out of all the treatment groups. On two separate occasions, a hatchling in the 35-ppt treatment was observed dragging shrimp out of the water before consuming it. Hatchlings in the 20-ppt treatment had similar consumption rates until about Day 40, when reduced appetite became more apparent. This was consistent with the timing of increased freshwater drinking reported above.
Table 2.—
Repeated-measures analysis of cumulative food intake as a function of salinity, day of study, and their interaction in hatching Diamond-backed Terrapins (Malaclemys terrapin). Salinity is a fixed effect and turtle ID is a random effect.
| Factor | Beta | SE | df | t | P |
|---|---|---|---|---|---|
| Intercept | 0.087 | 0.39 | 718 | 0.22 | 0.82 |
| Salinity | 0.016 | 0.02 | 28 | 0.81 | 0.42 |
| Day | 0.035 | 0.002 | 718 | 149.2 | <0.001 |
| Salinity × Day | −0.001 | 0.0001 | 718 | −10.1 | <0.001 |
Fig. 5.—

Mean (±95% confidence index) cumulative food intake (g wet mass) for hatchling Diamond-backed Terrapins (Malaclemys terrapin) as a function of salinity treatment.
Stress
Hatchling H:L ratios at 60 d were positively correlated with salinity (Table 1; Fig. 2D). No hatchling held in a 5- or 10-ppt treatment had an H:L ratio exceeding 0.5. One hatchling held at 1-ppt salinity had an H:L ratio slightly above 0.5; otherwise, ratios were similar to hatchlings in the 5- and 10-ppt treatments. Hatchlings in 20- and 35-ppt treatments had more variable ratios that were on average higher than those of hatchlings in the 1-, 5-, and 10-ppt treatments.
Discussion
Consistent with our hypotheses and prior literature, increasing salinity substantially reduced the growth rate of hatchling Diamond-backed Terrapins. The underlying physiology of growth differences is thought to be due primarily to the redirection of energy from growth to osmoregulation (Harden and Williard 2018; Williard et al. 2019). Based on the positive relationship we observed between salinity and H:L ratio, we suggest that chronic stress also contributes to growth effects. In addition, we found longer-term behavioral changes in hatchling terrapins. We observed progressive saltwater avoidance, increased freshwater-seeking behavior, and reduced appetite with increased time of exposure to elevated salinity. These behaviors were consistent with findings of prior experimental studies of terrapins (Davenport and Macedo 1990; Davenport and Ward 1993; Davenport and Magill 1996; Williard et al. 2019), and demonstrate allostatic responses to reduce exposure to, or limit the effects of, a hypersaline environment. Spending time out of saltwater may allow hatchlings to rehydrate in humid air or simply avoid saltwater uptake (Harden et al. 2015). Appetite suppression reduces saltwater intake through decreasing daily water flux (Williard et al. 2019); in other vertebrate species, feeding is inhibited during advanced stages of dehydration because it increases requirements for water (Watts and Boyle 2010; Wright et al. 2013; Lillywhite 2017).
A potential limitation of our study was our inability to address maternal or sibship effects, as it is possible that nonrandom distribution of hatchlings among treatments would create biased growth rates among treatments. Maternal influences on offspring traits have been demonstrated among turtle species (Steyermark and Spotila 2000; Páez et al. 2009; Mitchell et al. 2015), and we did find that initial hatchling mass was correlated with change in mass (though not change in carapace length) over the 75-d experimental period (Table 1; Fig. 2B). However, it is unlikely that hatchlings in our study were distributed among treatments in a manner that would randomly lead to an apparent progressive effect of salinity on growth. Our results are highly consistent in both pattern and effect sizes with the results of two other studies of terrapin hatchling growth in relation to salinity (Dunson 1985; Holliday et al. 2009) and a study on salinity effects on hatchling terrapin metabolic rate (Rowe 2018). Additionally, two recent studies found no evidence of maternal or clutch effects on growth or metabolic rate in yolk-independent Diamond-backed Terrapin hatchlings (Rowe et al. 2017; Rowe 2018). Therefore, the strong agreement among independent studies is robust evidence for salinity as a major driver of variation in terrapin hatchling growth.
Comparisons among our study and similar studies support the inference that increased freshwater-seeking and saltwater-avoidance behaviors are compensatory reactions to reduce the effects of salinity on terrapin growth. Our observed negative effects of high salinity on hatchling terrapin growth were not as large as those reported by Dunson (1985) and Holliday et al. (2009), where the ability to leave the water or have periodic access to fresh water was not afforded. Dunson held hatchlings from Chincoteague, Virginia, and Florida Bay at constant salinities and did not report providing fresh water during his experiment. Hatchlings in his study lost mass at 25-ppt salinity and could not survive long periods at 35 ppt. In contrast, hatchlings held above 20 ppt in our study and in a study of Chesapeake Bay (Patuxent River) hatchlings by Holliday et al. (2009) all survived and continued to grow. Compared to hatchlings held at 10 ppt, growth was reduced among hatchlings held at 30 or 35 ppt by 43% in our study and 56% in Holliday et al. (2009). Unlike our study, Holliday et al. (2009) did not provide fresh water, but rotated hatchlings between 20 d at 0, 10, 20, or 30 ppt and 10 d at 10 ppt. Collectively, these studies demonstrate that exposure to high salinity reduces hatchling terrapin growth and suggest that periodic access to freshwater or declines in salinity attenuate negative growth effects. Increasing time out of saltwater, conditioning to seek freshwater sources (even episodic ones), and drinking freshwater are behaviors that help to reduce the consequences of chronic exposure to high salinity. However, these behaviors do not eliminate adverse effects.
Our findings suggest that terrapins, when exposed to a high-salinity environment, learn to utilize a spatially explicit, periodically available source of fresh water. Hatchlings in all low- and brackish salinity treatments showed little use of the platform and spent nearly all of their time in the main (saline) water. In contrast, hatchlings in the high-salinity treatments frequented the platform and increasingly spent time in the freshwater dish even when it was dry (Fig. 4B). This indicated that terrapins showed increasing water-seeking behavior and associated the dish as the freshwater source. Little is known about the natural terrestrial habits of hatchling and small juvenile terrapins, but prior studies show that individuals at some sites prefer to burrow in high marsh vegetation (see Maerz et al. 2019, for review). Our results suggest that areas with permanent or episodic low-salinity (<10 ppt) water may be important for wild terrapin growth and survival, and that terrapins may learn to use these areas early in life. Fresh groundwater outflows into tidal creeks can be heterogeneous within salt marshes but may be important drivers of hatchling terrapin performance and abundance. Manmade freshwater sources or hard depressions that collect rain may also create attractive high marsh habitat for young terrapins.
Though increasing salinity limits hatchling terrapin growth in a broad sense, several studies demonstrate that low to moderate salinity, not fresh water, is optimal for hatchling terrapin growth. Two independent studies found that hatchling growth was highest at salinities in the range of 8–10 ppt (Dunson 1985), Holliday et al. (2009), and Rowe (2018) found standard metabolic rates of hatchling terrapins was highest at 8 ppt, consistent with anabolism associated with juvenile growth. Davenport and Ward (1993) reported peak hatchling appetite at 10-ppt salinity. Our results generally support these observations. Terrapin growth, growth rates, and appetite visually appeared higher at 5 and 10 ppt than at 1, 20, or 35 ppt, although the best fit gamma or linear distributions of growth over the range of salinities did not reflect this. Together, all research demonstrates that salinity is related to hatchling terrapin appetite and that hatchling terrapins require moderate salinity intake to maximize growth. This is also consistent with some freshwater turtle populations (e.g., Chelydra serpentina, Dunson 1986; Trachemys decussata, Dunson and Seidel 1986) that are locally adapted to salinity, with hatchlings exhibiting accelerated growth in saltwater compared to fresh water. Applications of our results and the results of other studies to terrapin ecology and management should attempt to integrate the increased performance of terrapins at low–moderate salinities into models.
Ectotherms have been shown to exhibit increased plasma corticosterone concentrations in response to elevated salinity, dehydration, or altered ion balance (Chambers 2011; Hopkins et al. 2016; Brusch et al. 2020), and there is a growing body of evidence emphasizing the role of corticosteroids in regulating salt and water balance (see Vera et al. 2017, for review). Corticosteroids often mediate allostatic responses (physiological and behavioral) to a stressor. (Romero et al. 2009; McEwen and Wingfield 2010). Acute corticosteroid responses to stressors are considered adaptive, spurring physiological and behavioral changes that allow an individual to prioritize essential functions for survival (Wingfield 2013). Over the long term, however, sustained corticosteroid release and associated downstream effects can create allostatic overload, reducing fitness by influencing energy intake, dampening immune function, and inhibiting growth and development (Guillette et al. 1995; Sapolsky et al. 2000; Moore and Jessop 2003; Ledon-Rettig et al. 2009; Braun and Marks 2015; Fonner et al. 2017).
In many vertebrates, including reptiles (see Davis et al. 2008, for review), the corticosteroid stress response induces a relative increase in circulating heterophils (granular, phagocytic leukocytes active during inflammation) and decrease in circulating lymphocytes (mononuclear leukocytes integral to adaptive immunity). This shift favoring the circulation of heterophils occurs within hours but remains over long timescales, even after blood corticosteroid levels attenuate (Davis et al. 2008; Goessling et al. 2015). Thus, instead of directly measuring blood corticosterone in our terrapins, we used H:L ratios as a marker of chronic stress after 60 d of ongoing exposure to treatment salinities. We observed higher H:L ratios among hatchlings at high salinities, supportive of a corticosterone-driven stress response. Though we cannot estimate the exact duration of the stress reaction (i.e., days or weeks), we know H:L ratios are often better suited to capture the effects of longer-term stressors and are not altered by acute corticosterone release during handling and venipuncture (Goessling et al. 2015; Davis and Maney 2018). Therefore, the positive relationship observed between environmental salinity and H:L ratio supports a chronic stress response because of prolonged high-salinity exposure. Subsequent studies might consider investigating the mechanisms and timeline by which chronic stress influences terrapin growth, either directly or indirectly through modulating the redirection of energy from growth to osmoregulation.
It is worth noting that some animals adapted to osmotically challenging environments, namely, xeric habitat-adapted squamates (Dupoué et al. 2014; Brusch et al. 2017; Moeller et al. 2017), do not exhibit the typical pattern of a dehydration-induced glucocorticoid response and the associated adverse effects of sustained physiological stress (e.g., immunosuppression). Based on the stress leukogram we observed, we hypothesize the stress response associated with dehydration would be negatively associated with immune reactivity among hatchling Diamond-backed Terrapins. Generally speaking, an increase in the circulating pool of heterophils relative to the marginal pool would reduce the ability of these innate immune cells to egress into tissues during acute infection, and the decreased proliferation, activation, or efflux of lymphocytes from lymphoid tissues would weaken the adaptive immune response. Subsequent studies might aim to investigate this hypothesis and the interplay between dehydration, the stress response, and immune function to characterize the threat of changing salt marsh hydrology to terrapin health better.
The effects of salinity on the growth of hatchling terrapins may have important demographic implications. Small turtles are disproportionately vulnerable to predation and environmental extremes, and early growth is a large determinant of time to and age at first maturity among turtles (Congdon et al. 2018). Further, moving into open areas to seek freshwater or avoid saltwater increases predation risk. We would therefore predict that hatchling mortality rates would be higher and population abundances lower in areas of high salinity (≥20 ppt) or where freshwater sources are scarce. Little attention has been given to spatial variation in terrapin demography or abundance; terrapin abundance is known to vary spatially in relation to anthropogenic threats, but those studies also suggest significant unexplained variation in terrapin abundance (Grosse et al. 2011; Isdell et al. 2015). In Maryland, terrapins inhabiting inland marsh areas appear larger than terrapins from sites closer to open ocean (W.M. Roosenburg, personal observation). We hypothesize that this observation and other unexplained variation in terrapin abundance may reflect the effects of salinity on hatchling and juvenile terrapin growth. This explanation would contrast with observations of freshwater turtles, for which larger conspecifics are often observed in brackish water (see Agha et al. 2018, for review), consistent with the notion that net water loss is inversely proportional to body size (Dunson 1985). Thus, future studies should aim to test this hypothesis and to estimate how salinity may interact with other factors, such as anthropogenic threats, to influence terrapin demography.
Understanding how salinity drives variation in terrapin demography will be important for predicting how terrapin populations will function in future environments and whether specific management actions will be effective. Climate change is predicted to cause droughts of increasing frequency and severity, which will reduce freshwater inputs to marshes (Greenberg et al. 2006), and projected sea-level rise during this century is predicted to affect over 30% of the current range of Diamond-backed Terrapins (Agha et al. 2018). Additionally, coastal development and tidal restriction from land development and road construction can disrupt natural marsh hydrology and divert freshwater inputs. As a result of these disturbances, the total area of high-salinity salt marsh is expected to increase. Therefore, coastal development and climate change could have indirect effects on terrapin populations through alterations of marsh salinity and of the distribution and abundance of freshwater sources within salt marshes. Predicting changes in terrapin habitat selection and use amid increased salinities can inform conservation and management practices. For example, identifying key freshwater sources or lower-salinity areas could improve efforts to protect critical nesting areas or reduce overlap between terrapins and sources of mortality, such as fisheries with high terrapin bycatch (Grosse et al. 2009; Harden and Williard 2012).
Summary
Our study shows that Diamond-backed Terrapin hatchlings cope with chronically high-salinity environments by altering aspects of their behavior and physiology. Allostatic responses to high salinity likely include both physiological and behavioral changes to limit exposure. When chronically exposed to high salinity, allostatic overload may be induced and play a role in the negative growth effects of a hypersaline environment. Behaviors such as increased time out of the water or basking and freshwater seeking demonstrate how hatchling terrapins have the ability to learn and use terrestrial and freshwater habitats as part of their response to chronic exposure to high salinity (≥20 ppt). These behaviors likely contribute to the observed capacity for terrapin populations to persist in hypersaline marsh environments (Dunson 1985; Rowe 2018). We propose that the ability to access ephemeral freshwater sources is a key factor in whether terrapin hatchlings can grow and survive in salt marshes. The importance of freshwater to hatchling and juvenile terrapins is a potentially important but unstudied component of juvenile terrapin ecology that may have significant demographic implications. Knowledge of the negative impacts of increasingly high-salinity habitat and reduced freshwater availability, and of how terrapins respond behaviorally to these stressors, may be important to understanding and managing the response of terrapin populations to changing salt marsh ecosystems.
Supplementary Material
Acknowledgments.—
Funding was provided by the Maerz Laboratory and through a scholarship awarded to E. Ashley by the University of Georgia Center for Undergraduate Research Opportunities. Our deepest appreciation to C. McInerney and the Skidaway Audubon Terrapin Turtle Rescue team for providing hatchlings and assisting with their release. All regulations pertaining to the collection and care of these animals were followed and approved by IACUC (AUP-2017 11-006-Y1-A0) and the Georgia Department of Natural Resources (1000602439).
Footnotes
Supplemental Material
Supplemental material associated with this article can be found online at https://doi.org/10.1655/Herpetologica-D-20-00028.S1.
Literature Cited
- Agha M, Ennen JR, Bower DS, Nowakowski AJ, Sweat SC, and Todd BD. 2018. Salinity tolerances and use of saline environments by freshwater turtles: Implications of sea level rise. Biological Reviews 93:1634–1648. [DOI] [PubMed] [Google Scholar]
- Belfry CS, and Cowan FBM. 1995. Peptidergic and adrenergic innervation of the lachrymal gland in the euryhaline turtle, Malaclemys terrapin. Journal of Experimental Zoology 273:363–375. [DOI] [PubMed] [Google Scholar]
- Bentley P, Bretz W, and Schmidt-Nielsen K. 1967. Osmoregulation in the diamondback terrapin, Malaclemys terrapin centrata. Journal of Experimental Biology 46:161–167. [DOI] [PubMed] [Google Scholar]
- Blanton JO 2007a. Continuous salinity, temperature and depth measurements from moored hydrographic data loggers deployed at GCE1_Hydro (Sapelo River near Eulonia, Georgia) from 1 January 2003 through 31 December 2006 (Data sets PHY-GCEM-0403a–0701a). Georgia Coastal Ecosystems LTER Project, USA. Available at http://gce-lter.marsci.uga.edu/public/app/data_catalog.asp. Accessed on 26 November 2017.
- Blanton JO 2007b. Continuous salinity, temperature and depth measurements from moored hydrographic data loggers deployed at GCE2_Hydro (Four Mile Island, Georgia) from 1 January 2003 through 31 December 2006 (Data sets PHY-GCEM-0403b–0701b). Georgia Coastal Ecosystems LTER Project, USA. Available at http://gce-lter.marsci.uga.edu/public/app/data_catalog.asp.Accessed on 26 November 2017.
- Blanton JO 2007c. Continuous salinity, temperature and depth measurements from moored hydrographic data loggers deployed at GCE3_Hydro (Sapelo Sound north of Sapelo Island, Georgia) from 1 January 2003 through 31 December 2006 (Data sets PHY-GCEM-0403c–0701c). Georgia Coastal Ecosystems LTER Project, USA. Available at http://gce-lter.marsci.uga.edu/public/app/data_catalog.asp. Accessed on 26 November 2017.
- Blanton JO 2007d. Continuous salinity, temperature and depth measurements from moored hydrographic data loggers deployed at GCE6_Hydro (Doboy Sound south of Sapelo Island, Georgia) from 1 January 2003 through 31 December 2006 (Data sets PHY-GCEM-0303d–0701d). Georgia Coastal Ecosystems LTER Project, USA. Available at http://gce-lter.marsci.uga.edu/public/app/data_catalog.asp. Accessed on 26 November 2017.
- Blanton JO 2007e. Continuous salinity, temperature and depth measurements from moored hydrographic data loggers deployed at GCE7_Hydro (Altamaha River near Carrs Island, Georgia) from 1 January 2003 through 31 December 2006 (Data sets PHY-GCEM-0403e–0701e). Georgia Coastal Ecosystems LTER Project, USA. Available at http://gce-lter.marsci.uga.edu/public/app/data_catalog.asp. Accessed on 26 November 2017.
- Blanton JO 2007f. Continuous salinity, temperature and depth measurements from moored hydrographic data loggers deployed at GCE8_Hydro (Altamaha River near Aligator Creek, Georgia) from 1 January 2003 through 31 December 2006 (Data sets PHY-GCEM-0403f–0701f). Georgia Coastal Ecosystems LTER Project, USA. Available at http://gce-lter.marsci.uga.edu/public/app/data_catalog.asp. Accessed on 26 November 2017.
- Blanton JO 2007g. Continuous salinity, temperature and depth measurements from moored hydrographic data loggers deployed at GCE9_Hydro (Altamaha River near Rockdedundy Island, Georgia) from 1 January 2003 through 31 December 2006 (Data sets PHY-GCEM-0403g–0701g). Georgia Coastal Ecosystems LTER Project, USA. Available at http://gce-lter.marsci.uga.edu/public/app/data_catalog.asp. Accessed on 26 November 2017.
- Blanton JO 2007h. Continuous salinity, temperature and depth measurements from moored hydrographic data loggers deployed at GCE10_Hydro (Duplin River west of Sapelo Island, Georgia) from 1 January 2003 through 31 December 2006 (Data sets PHY-GCEM-0403h–0701h). Georgia Coastal Ecosystems LTER Project, USA. Available at http://gce-lter.marsci.uga.edu/public/app/data_catalog.asp. Accessed on 26 November 2017.
- Braun TP, and Marks DL. 2015. The regulation of muscle mass by endogenous glucocorticoids. Frontiers in Physiology 6:12. [DOI] [PMC free article] [PubMed] [Google Scholar]
- Brusch GA, Billy G, Blattman JN, and DeNardo DF. 2017. Reproduction alters hydration state but does not impact the positive effects of dehydration on innate immune function in Children’s pythons (Antaresia childreni). Physiological and Biochemical Zoology PBZ 90:646–654. [DOI] [PubMed] [Google Scholar]
- Brusch GA, DeNardo DF, and Lourdais O. 2020. Reproductive state and water deprivation increase plasma corticosterone in a capital breeder. General and Comparative Endocrinology 288:113375. [DOI] [PubMed] [Google Scholar]
- Cockrem JF, and Silverin B. 2002. Sight of a predator can stimulate a corticosterone response in the Great Tit (Parus major). General and Comparative Endocrinology 125:248–255. [DOI] [PubMed] [Google Scholar]
- Congdon JD, Nagle RD, and Kinney OM. 2018. Front-loading life histories: The enduring influence of juvenile growth on age, size, and reproduction of primiparous female freshwater turtles. Evolutionary Ecology Research 19:353–364. [Google Scholar]
- Cowan FBM 1981. Effects of salt loading on salt gland function in the euryhaline turtle, Malaclemys terrapin. Journal of Comparative Physiology 145:101–108. [Google Scholar]
- Chambers DL 2011. Increased conductivity affects corticosterone levels and prey consumption in larval amphibians. Journal of Herpetology 45:219–223. [Google Scholar]
- Davenport J, and Macedo EA. 1990. Behavioural osmotic control in the euryhaline diamond-back terrapin: Responses to low salinity and rainfall. Zoological Society of London 220:487–496. [Google Scholar]
- Davenport J, and Magill SH. 1996. Thermoregulation or osmotic control? Some preliminary observations on the function of emersion in the diamondback terrapin Malaclemys terrapin (latrielle). Herpetological Journal 6:26–29. [Google Scholar]
- Davenport J, and Ward J. 1993. The effects of salinity and temperature on appetite in the diamondback terrapin Malaclemys terrapin latrielle. Herpetological Journal 3:95–98. [Google Scholar]
- Davis AK, and Maney DL. 2018. The use of glucocorticoid hormones or leukocyte profiles to measure stress in vertebrates: What’s the difference? Methods in Ecology & Evolution 9:1556–1568. [Google Scholar]
- Davis AK, Maney DL, and Maerz JC. 2008. The use of leukocyte profiles to measure stress in vertebrates: A review for ecologists. Functional Ecology 22:760–772. [Google Scholar]
- Di Iorio D 2016a. Continuous salinity, temperature and depth measurements from moored hydrographic data loggers deployed at GCE1_Hydro (Sapelo River near Eulonia, Georgia) from 1 January 2007 through 31 December 2015 (Data sets PHY-GCEM-0801a–1607a). Georgia Coastal Ecosystems LTER Project, USA. Available at http://gce-lter.marsci.uga.edu/public/app/data_catalog.asp. Accessed on 26 November 2017.
- Di Iorio D 2016b. Continuous salinity, temperature and depth measurements from moored hydrographic data loggers deployed at GCE2_Hydro (Four Mile Island, Georgia) from 1 January 2007 through 31 December 2015 (Data sets PHY-GCEM-0801b–1607b). Georgia Coastal Ecosystems LTER Project, USA. Available at http://gce-lter.marsci.uga.edu/public/app/data_catalog.asp. Accessed on 26 November 2017.
- Di Iorio D 2016c. Continuous salinity, temperature and depth measurements from moored hydrographic data loggers deployed at GCE3_Hydro (Sapelo Sound north of Sapelo Island, Georgia) from 1 January 2007 through 31 December 2015 (Data sets PHY-GCEM-0801c–1607c). Georgia Coastal Ecosystems LTER Project, USA. Available at http://gce-lter.marsci.uga.edu/public/app/data_catalog.asp. Accessed on 26 November 2017.
- Di Iorio D 2016d. Continuous salinity, temperature and depth measurements from moored hydrographic data loggers deployed at GCE6_Hydro (Doboy Sound south of Sapelo Island, Georgia) from 1 January 2007 through 31 December 2015 (Data sets PHY-GCEM-0801d–1607d). Georgia Coastal Ecosystems LTER Project, USA. Available at http://gce-lter.marsci.uga.edu/public/app/data_catalog.asp. Accessed on 26 November 2017.
- Di Iorio D 2016e. Continuous salinity, temperature and depth measurements from moored hydrographic data loggers deployed at GCE7_Hydro (Altamaha River near Carrs Island, Georgia) from 1 January 2007 through 31 December 2015 (Data sets PHY-GCEM-0801e–1607e). Georgia Coastal Ecosystems LTER Project, USA. Available at http://gce-lter.marsci.uga.edu/public/app/data_catalog.asp. Accessed on 26 November 2017.
- Di Iorio D 2016f. Continuous salinity, temperature and depth measurements from moored hydrographic data loggers deployed at GCE8_Hydro (Altamaha River near Alligator Creek, Georgia) from 1 January 2007 through 31 December 2015 (Data sets PHY-GCEM-0801f–1607f). Georgia Coastal Ecosystems LTER Project, USA. Available at http://gce-lter.marsci.uga.edu/public/app/data_catalog.asp. Accessed on 26 November 2017.
- Di Iorio D 2016g. Continuous salinity, temperature and depth measurements from moored hydrographic data loggers deployed at GCE9_Hydro (Altamaha River near Rockdedundy Island, Georgia) from 1 January 2007 through 31 December 2015 (Data sets PHY-GCEM-0801g–1607g). Georgia Coastal Ecosystems LTER Project, USA. Available at http://gce-lter.marsci.uga.edu/public/app/data_catalog.asp. Accessed on 26 November 2017.
- Di Iorio D 2016h. Continuous salinity, temperature and depth measurements from moored hydrographic data loggers deployed at GCE10_Hydro (Duplin River west of Sapelo Island, Georgia) from 1 January 2007 through 31 December 2015 (Data sets PHY-GCEM-0801h–1607h). Georgia Coastal Ecosystems LTER Project, USA. Available at http://gce-lter.marsci.uga.edu/public/app/data_catalog.asp. Accessed on 26 November 2017.
- Di Iorio D 2016i. Continuous salinity, temperature and depth measurements from moored hydrographic data loggers deployed at GCE11_Hydro (Altamaha River near Lewis Creek, Georgia) from 7 October 2014 through 31 December 2015 (Data sets PHY-GCEM-1501i,1607i). Georgia Coastal Ecosystems LTER Project, USA. Available at http://gce-lter.marsci.uga.edu/public/app/data_catalog.asp. Accessed on 26 November 2017.
- Dunson WA 1970. Some aspects of electrolyte and water balance in three estuarine reptiles, the diamondback terrapin, American and saltwater crocodiles. Comparative Biochemistry and Physiology 32:161–174. [DOI] [PubMed] [Google Scholar]
- Dunson WA 1981. Behavioral osmoregulation in the Key Mud Turtle, Kinosternon b. baurii. Journal of Herpetology 15:163–173. [Google Scholar]
- Dunson WA 1985. Effect of water salinity and food salt content on growth and sodium efflux of hatchling diamondback terrapins. Physiological Zoology 58:736–747. [Google Scholar]
- Dunson WA 1986. Estuarine populations of the Snapping Turtle (Chelydra) as a model for the evolution of marine adaptations in reptiles. Copeia 3:741–756. [Google Scholar]
- Dunson WA, and Seidel ME. 1986. Salinity tolerance of estuarine and insular emydid turtles (Pseudemys nelsoni and Trachemys decussata). Journal of Herpetology 20:237–245. [Google Scholar]
- Dunson WA, and Travis J. 1994. Patterns in the evolution of physiological specialization in salt-marsh animals. Estuaries 17:102–110. [Google Scholar]
- Dupoué A, Angelier F, Lourdais O, Bonnet X, and Brischoux F. 2014. Effect of water deprivation on baseline and stress-induced corticosterone levels in the Children’s python (Antaresia childreni). Comparative Biochemistry and Physiology A, Molecular Integrative Physiology 168:11–16. [DOI] [PubMed] [Google Scholar]
- Elgot A, El Hiba O, Belkouch M, and Gamrani H. 2017. The underlying physiological basis of the desert rodent Meriones shawi’s survival to prolonged water deprivation: Central vasopressin regulation on peripheral kidney water channels AQPs-2. Acta Histochemica 120:65–72. [DOI] [PubMed] [Google Scholar]
- Fonner CW, Patel SA, Boord SM, Venesky MD, and Woodley SK. 2017. Effects of corticosterone on infection and disease in salamanders exposed to amphibian fungal pathogen Batrachochytrium dendrobatids. Diseases of Aquatic Organisms 123:159–171. [DOI] [PubMed] [Google Scholar]
- Fontaínhas-Fernandes A, Gomes EF, Reis-Henriques MA, and Coimbra J. 2003. Effect of cortisol on some osmoregulatory parameters of the teleost Oreochromic niloticus L., after transference from freshwater to seawater. Arquivo Brasileiro de Medicina Veterinária e Zootecnia 55:562–567. [Google Scholar]
- Gilles-Baillien M 1973. Isosmotic regulation in various tissues of the diamondback terrapin Malaclemys centrata centrata (latrielle). Journal of Experimental Biology 59:39–43. [DOI] [PubMed] [Google Scholar]
- Goessling JM, Kennedy H, Mendonca T, and Wilson AE. 2015. A meta-analysis of plasma corticosterone and heterophil:lymphocyte ratios—Is there conservation of physiological stress responses over time? Functional Ecology 29:1189–1196. [Google Scholar]
- Greenberg R, Maldonado J, Droege S, and McDonald MV. 2006. Tidal marshes: A global perspective on the evolution and conservation of their terrestrial vertebrates. Bioscience 56:675–685. [Google Scholar]
- Grosse AM, Dijk JD, Holcomb KL, and Maerz JC. 2009. Diamond-back terrapin mortality in crab pots in a Georgia salt marsh. Chelonian Conservation and Biology 8:98–100. [Google Scholar]
- Grosse AM, Maerz JC, Hepinstall-Cymerman J, and Dorcas ME. 2011. Effects of roads and crabbing pressures on diamondback terrapin populations in coastal Georgia. Journal of Wildlife Management 75:762–770. [Google Scholar]
- Guillette LJ, Cree A, and Rooney AA. 1995. Biology of stress: Interactions with reproduction, immunology and intermediary metabolism. Pp. 32–81 in Health and Welfare of Captive Reptiles (Warwick C, Frye FL, and Murphy JB, eds.). Springer, Netherlands. [Google Scholar]
- Harden LA, and Williard AS. 2012. Using spatial and behavioral data to evaluate the seasonal bycatch risk of diamondback terrapins Malaclemys terrapin in crab pots. Marine Ecology Progress Series 467:207–217. [Google Scholar]
- Harden LA, and Williard AS. 2018. Osmoregulation. Pp. 111–125 in Ecology and Conservation of the Diamond-backed Terrapin (Roosenburg WM and Kennedy VS, eds.). Johns Hopkins University Press, USA. [Google Scholar]
- Harden LA, Diluzio NA, Gibbons JW, and Dorcas ME. 2007. Spatial and thermal ecology of diamondback terrapins (Malaclemys terrapin) in a South Carolina marsh. Journal of the North Carolina Academy of Science 123:154–162. [Google Scholar]
- Harden LA, Midway SR, and Williard AS. 2015. The blood biochemistry of overwintering diamondback terrapins (Malaclemys terrapin). Journal of Experimental Marine Biology and Ecology 466:34–41. [Google Scholar]
- Hart KM, and Lee DS. 2006. The diamondback terrapin: The biology, ecology, cultural history, and conservation status of an obligate estuarine turtle. Studies in Avian Biology 32:206–213. [Google Scholar]
- Hildebrandt JP 2001. Coping with excess salt: Adaptive functions of extrarenal osmoregulatory organs in vertebrates. Zoology 104:209–220. [DOI] [PubMed] [Google Scholar]
- Holliday D, Elskus A, and Roosenburg WM. 2009. Effects of multiple stressors on growth and metabolic rate of Malaclemys terrapin. Environmental Toxicology and Chemistry 28:338–345. [DOI] [PubMed] [Google Scholar]
- Hopkins GR, Brodie ED, Neuman-Lee LA, Mohammadi S, Brusch GA, Hopkins ZM, and French SS. 2016. Physiological responses to salinity vary with proximity to the ocean in a coastal amphibian. Physiological and Biochemical Zoology 89:322–330. [DOI] [PubMed] [Google Scholar]
- Isdell RE, Chambers RM, Bilkovic DM, and Leu M. 2015. Effects of terrestrial-aquatic connectivity on an estuarine turtle. Diversity and Distributions 21:643–653. [Google Scholar]
- Ledon-Rettig CC, Pfenning DW, and Crespi EJ. 2009. Stress hormones and the fitness consequences associated with the transition to a novel diet in larval amphibians. Journal of Experimental Biology 212:3743–3750. [DOI] [PubMed] [Google Scholar]
- Lillywhite HB 2017. Feeding begets drinking: Insights from intermittent feeding in snakes. Journal of Experimental Biology 220:3565–3570. [DOI] [PubMed] [Google Scholar]
- Lillywhite HB, and Navas CA. 2004. Animals in extreme environments. Physiological and Biochemical Zoology 79:265–273. [DOI] [PubMed] [Google Scholar]
- Lillywhite HB, Licht P, and Chelgren P. 1973. The role of behavioral thermoregulation in the growth energetics of the toad, Bufo boreas. Ecology 54:375–383. [Google Scholar]
- Maerz JC, Seigel RA, and Crawford BA. 2019. Terrapin conservation: Mitigating habitat loss, road mortality, and subsidized predators. Pp. 201–220 in Ecology and Conservation of the Diamond-backed Terrapin (Roosenburg WM and Kennedy VS, eds.). Johns Hopkins University Press, USA. [Google Scholar]
- Mans C 2008. Venipuncture techniques in chelonian species. Lab Animal 37:303–304. [DOI] [PubMed] [Google Scholar]
- Marom S, Korine C, Wojciechowski MS, Tracy CR, and Pinshow B. 2006. Energy metabolism and evaporative water loss in the European free-tailed bat and Hemprich’s long-eared bat (Microchiroptera): Species sympatric in the Negev Desert. Physiological and Biochemical Zoology 79:944–956. [DOI] [PubMed] [Google Scholar]
- Mazerolle MJ 2019. AICcmodavg: Model Selection and Multimodel Inference Based on (Q)AIC(c), R package Version 2.2–2. R Foundation for Statistical Computing, Austria. Available at https://cran.r-project.org/package=AICcmodavg. [Google Scholar]
- McEwen BS, and Wingfield JC. 2010. What is in a name? Integrating homeostasis, allostasis, and stress. Hormones and Behavior 57:105–111. [DOI] [PMC free article] [PubMed] [Google Scholar]
- Mitchell TS, Maciel JA, and Janzen FJ. 2015. Maternal effects influence phenotypes and survival during early life stages in an aquatic turtle. Functional Ecology 29:268–276. [Google Scholar]
- Moeller KT, Demare G, Davies S, and DeNardo DF. 2017. Dehydration enhances multiple physiological defense mechanisms in a desert lizard, Heloderma suspectum. Journal of Experimental Biology 220:2166–2174. [DOI] [PubMed] [Google Scholar]
- Moore IT, and Jessop TS. 2003. Stress, reproduction, and adrenocortical modulation in amphibians and reptiles. Hormones and Behavior 43:39–47. [DOI] [PubMed] [Google Scholar]
- Nagy KA 2004. Water economy of free-living desert animals. International Congress Series 1275:291–297. [Google Scholar]
- Páez VP, Correa JC, Cano AM, and Bock BC. 2009. A comparison of maternal and temperature effects on sex, size, and growth of hatchlings of the Magdalena river turtle (Podocnemis lewyana) incubated under field and controlled laboratory conditions. Copeia 4:698–704. [Google Scholar]
- Peaker M, and Linzell JL. 1975. Salt Glands in Birds and Reptiles. Cambridge University Press, UK. [PubMed] [Google Scholar]
- Pidcock S, Taplin LE, and Grigg GC. 1997. Differences in renal-cloacal function between Crocodylus porosus and Alligator mississippiensis have implications for crocodilian evolution. Journal of Comparative Physiology B 167:153–158. [Google Scholar]
- Pinheiro J, Bates D, DebRoy S, Sarkar D, and R Core Team. 2018. nlme: Linear and Nonlinear Mixed Effects Models, R package Version 3.1–137. R Foundation for Statistical Computing, Austria. Available at https://CRAN.R-project.org/package=nlme. [Google Scholar]
- R Core Team. 2019. R: A Language and Environment for Statistical Computing, Version 3.6.1. Available at http://www.R-project.org. R Foundation for Statistical Computing, Austria. [Google Scholar]
- Rasmussen AR, Murphy JC, Ompi M, Gibbons JW, and Uetz P. 2011. Marine reptiles. PLoS One 6:e27373. [DOI] [PMC free article] [PubMed] [Google Scholar]
- Robinson GD, and Dunson WA. 1976. Water and sodium balance in the estuarine diamondback terrapin (Malaclemys). Journal of Comparative Physiology 105:129–152. [Google Scholar]
- Romero LM, Dickens MJ, and Cyr NE. 2009. The reactive scope model—A new model integrating homeostasis, allostasis, and stress. Hormones and Behavior 55:375–389. [DOI] [PubMed] [Google Scholar]
- Rowe CL 2018. Maximum standard metabolic rate corresponds with the salinity of maximum growth in hatchlings of the estuarine northern diamondback terrapin (Malaclemys terrapin terrapin): Implications for habitat conservation. Acta Oecologica 86:79–83. [Google Scholar]
- Rowe CL, Woodland RJ, and Funck SA. 2017. Metabolic rates are elevated and influenced by maternal identity during the early, yolk-dependent, post-hatching period in an estuarine turtle, the diamondback terrapin (Malaclemys terrapin). Comparative Biochemistry and Physiology A: Molecular Integrative Physiology 204:137–145. [DOI] [PubMed] [Google Scholar]
- Sapolsky RM, Romero LM, and Munck AU. 2000. How do glucocorticoids influence stress responses? Integrating permissive, suppressive, stimulatory, and preparative actions. Endocrinology Reviews 21:55–89. [DOI] [PubMed] [Google Scholar]
- Stacy NI, Alleman AR, and Sayler KA. 2011. Diagnostic hematology of reptiles. Clinics in Laboratory Medicine 31:87–108. [DOI] [PubMed] [Google Scholar]
- Steyermark AC, and Spotila JR. 2000. Effects of maternal identity and incubation temperature on snapping turtle (Chelydra serpentine) metabolism. Physiological Biochemistry and Zoology 73:298–306. [DOI] [PubMed] [Google Scholar]
- Thierry AM, Ropert-Coudert Y, and Raclot T. 2013. Elevated corticosterone levels decrease reproductive output of chick-rearing Adélie penguins but do not affect chick mass at fledging. Conservation Physiology 1:cot007. [DOI] [PMC free article] [PubMed] [Google Scholar]
- Vera F, Zenuto R, and Antenucci CD. 2017. Expanding the actions of cortisol and corticosterone in wild vertebrates: A necessary step to overcome the emerging challenges. General and Comparative Endocrinology 246:337–353. [DOI] [PubMed] [Google Scholar]
- Wack CL, DuRant SE, Hopkins WA, Lovern MB, Feldhoff RC, and Woodley SK. 2012. Elevated plasma corticosterone increases metabolic rate in a terrestrial salamander. Comparative Biochemistry and Physiology Part A: Molecular & Integrative Physiology 161:153–158. [DOI] [PubMed] [Google Scholar]
- Watts AG, and Boyle CN. 2010. The functional architecture of dehydration–anorexia. Physiology and Behavior 100:472–477. [DOI] [PMC free article] [PubMed] [Google Scholar]
- Więski K, Guo H, Craft CB, and Pennings SC. 2010. Ecosystem functions of tidal fresh, brackish, and salt marshes on the Georgia coast. Estuaries and Coasts 33:161–169. [Google Scholar]
- Williard AS, Harden LA, Jones TT, and Midway SR. 2019. Effects of temperature and salinity on body fluid dynamics and metabolism in the estuarine diamondback terrapin (Malaclemys terrapin). Journal of Experimental Biology 222:jeb.202390. [DOI] [PubMed] [Google Scholar]
- Wingfield JC 2013. Ecological processes and the ecology of stress: The impacts of abiotic environmental factors. Functional Ecology 27:37–44. [Google Scholar]
- Wingfield JC, and Romero LM. 2001. Adrenocortical responses to stress and their modulation in free-living vertebrates. Pp. 211–226 in Handbook of Physiology: The Endocrine System (Kostyo JL and Goodman HM, eds.). Oxford University Press, UK. [Google Scholar]
- Wright CD, Jackson ML, and DeNardo DF. 2013. Meal consumption is ineffective at maintaining or correcting water balance in a desert lizard, Heloderma suspectum. Journal of Experimental Biology 216:1439–1447. [DOI] [PubMed] [Google Scholar]
Associated Data
This section collects any data citations, data availability statements, or supplementary materials included in this article.