Abstract
Motivation
Short-read whole-genome sequencing (WGS) is a vital tool for clinical applications and basic research. Genetic divergence from the reference genome, repetitive sequences and sequencing bias reduces the performance of variant calling using short-read alignment, but the loss in recall and specificity has not been adequately characterized. To benchmark short-read variant calling, we used 36 diverse clinical Mycobacterium tuberculosis (Mtb) isolates dually sequenced with Illumina short-reads and PacBio long-reads. We systematically studied the short-read variant calling accuracy and the influence of sequence uniqueness, reference bias and GC content.
Results
Reference-based Illumina variant calling demonstrated a maximum recall of 89.0% and minimum precision of 98.5% across parameters evaluated. The approach that maximized variant recall while still maintaining high precision (<99%) was tuning the mapping quality filtering threshold, i.e. confidence of the read mapping (recall = 85.8%, precision = 99.1%, MQ ≥ 40). Additional masking of repetitive sequence content is an alternative conservative approach to variant calling that increases precision at cost to recall (recall = 70.2%, precision = 99.6%, MQ ≥ 40). Of the genomic positions typically excluded for Mtb, 68% are accurately called using Illumina WGS including 52/168 PE/PPE genes (34.5%). From these results, we present a refined list of low confidence regions across the Mtb genome, which we found to frequently overlap with regions with structural variation, low sequence uniqueness and low sequencing coverage. Our benchmarking results have broad implications for the use of WGS in the study of Mtb biology, inference of transmission in public health surveillance systems and more generally for WGS applications in other organisms.
Availability and implementation
All relevant code is available at https://github.com/farhat-lab/mtb-illumina-wgs-evaluation.
Supplementary information
Supplementary data are available at Bioinformatics online.
1 Introduction
Illumina short-read whole-genome sequencing (WGS) followed by alignment to a reference genome is a widely used first analysis in the identification of genetic variants. Illumina sequencing and alignment can confidently detect single-nucleotide substitutions (SNSs) and small insertions or deletions (INDELs) but is limited in several ways by its short ∼100 bp read lengths and other biases. First, short query sequences are challenging to uniquely align to repetitive or homologous reference regions (Li et al., 2008; Li, 2014). Second, experimental parameters related to genomic DNA extraction, sequencing chemistry and library preparation can introduce biases and systematic errors in certain sequence contexts (Barbitoff et al., 2020; Goig et al., 2020; Nakamura et al., 2011; Modlin et al., 2021; Ross et al., 2013; Stoler and Nekrutenko, 2021). For example, regions with high GC content and/or low sequence complexity may be particularly prone to PCR-dropout and reduced sequencing coverage (Aird et al., 2011; Benjamini and Speed, 2012; Modlin et al., 2021). Third, the use of a single reference genome introduces bias, especially when the genome being analyzed differs substantially from the reference sequence (Garrison et al., 2018; Paten et al., 2017). As the sequenced genome diverges from the reference genome, short-read alignment becomes increasingly inaccurate and regions absent from the reference genome are missed or poorly reconstructed.
In contrast, long-read sequencing can generate high confidence complete genome assemblies, which can also be used to benchmark Illumina WGS. For example, long-reads generated by PacBio sequencing (with lengths on the order of ∼10 kb) are ideal for assembling complete bacterial genomes and identifying variants in repetitive regions (Schmid et al., 2018). Although individual PacBio reads have a considerably higher per base error rate (10–15%) than Illumina, the randomly distributed nature of the errors allows for high coverage sequencing runs to converge to a high accuracy consensus (Rhoads and Au, 2015). More recently, circular consensus sequencing has further improved PacBio long-read per base accuracy to levels on par with Illumina (Wenger et al., 2019). Alternatively, hybrid strategies that combine less accurate long-reads and short Illumina reads can offer both high base-level accuracy and continuity of the final assembly (De Maio et al., 2019; Schmid et al., 2018).
Mycobacterium tuberculosis (Mtb) is a globally prevalent pathogenic bacterium with a ∼4.4 Mbp genome known for high GC content, large repetitive regions and an overall low mutation rate. Owing to the clonality and stability of the Mtb genome, this organism is particularly well suited for systematically identifying the sources of error that arise when short-read data are used for variant detection. Approximately 10% of the Mtb reference genome (H37Rv) is regularly excluded from genomic analysis because it is purported to be more error prone and enriched for repetitive sequence content (Meehan et al., 2019). This 10% of the Mtb genome, hitherto regions of putative low confidence (PLC), span the following genes/families: (i) PE/PPE genes (N = 168), (ii) mobile genetic elements (MGEs) (N = 147) and (iii) 69 additional genes with identified homology elsewhere in the genome (Coscolla and Gagneux, 2014). The PE/PPE gene families, named after their conserved proline–glutamate (PE) or proline–proline–glutamate (PPE) motifs in their N-terminal domains, have been suggested to play important roles in virulence and immune modulation but uncertainty regarding their analysis with short-read sequencing has limited their study (Ates, 2019).
Due to their systematic exclusion from most Mtb genomic analyses (Coscolla and Gagneux, 2014; Hicks et al., 2018; Holt et al., 2018), PLC regions are yet to be evaluated systematically for short-read variant calling accuracy. Here, we use long-read sequencing data from 36 phylogenetically diverse Mtb isolates to benchmark short-read variant detection accuracy and study genome characteristics that associate with erroneous variant calls.
2 Results
2.1 High confidence MTB assemblies with hybrid short- and long-read sequencing
For this study, PacBio long-read and Illumina sequencing was performed for 31 clinical Mtb isolates. The resultant data were combined with publicly available paired PacBio and Illumina genome sequencing of 18 Mtb isolates from two previously published studies (Chiner-Oms et al., 2019; Ngabonziza et al., 2020). From these datasets, a total of 38 clinical isolates were selected for having (i) paired end Illumina WGS with median depth of coverage ≥40× across the Mtb reference genome and (ii) no evidence of mixed infections or sample swaps (Supplementary File S2). We performed de novo genome assembly and iteratively polished each assembly with the PacBio and Illumina reads generating a complete circular assembly for 36/38 isolates. To evaluate the accuracy of the final assemblies, we examined the corrections made during the Illumina polishing step (Supplementary Results). We found that 98% corrections made through short-read polishing pertained to erroneous 1 bp INDELs, which is in line with the expected error profile of PacBio. Only 2% of the corrections were SNVs (median of 0 SNV corrections, interquartile range: 0–2, across the 36 assemblies). The final set of 36 high confidence completed genome assemblies spanned the Mtb global phylogeny (Fig. 1 and Supplementary Fig. S2).
Fig. 1.
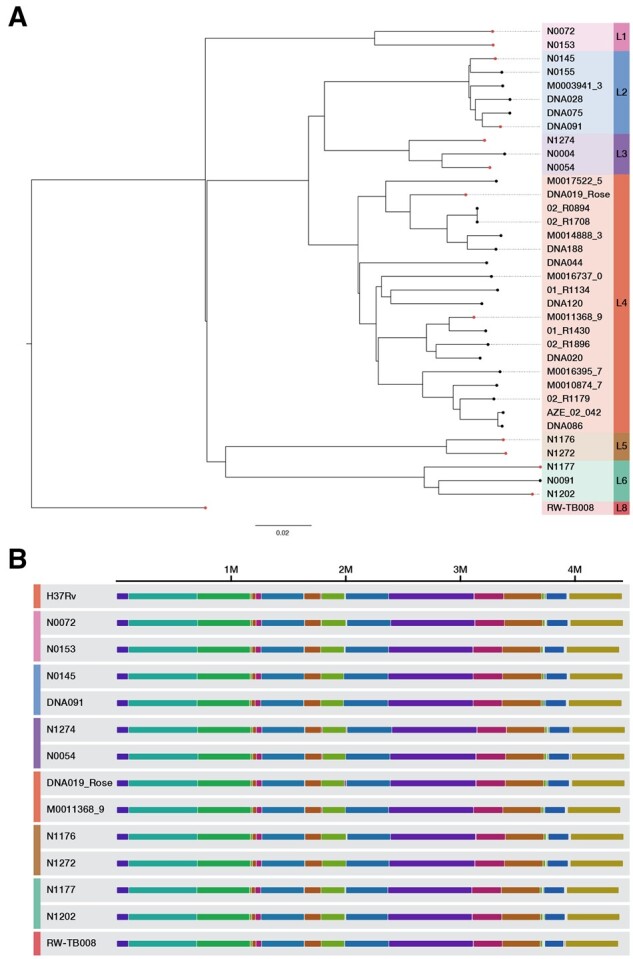
Overview of 36 clinical Mtb isolates with completed genome assemblies. (A) Maximum likelihood phylogeny of Mtb isolates with PacBio complete genome assemblies. (B) Representative isolates from each lineage sampled from the whole-genome sequence alignment between the H37Rv reference genome and all completed circular Mtb genome assemblies. The complete alignment is visualized in Supplementary Fig. S2. The whole-genome multiple sequence alignment was performed using the progressiveMauve (Darling et al., 2010) algorithm. Each contiguously colored region is a locally collinear block (LCB), a region without rearrangement of homologous backbone sequence
2.2 Empirical base-level performance of Illumina
To measure the consistency and accuracy of Illumina genotyping across the Mtb genome, we defined the empirical base-level recall (EBR) metric for each position of the H37Rv reference genome (4.4 Mb, Supplementary File S6). EBR was calculated as the proportion of isolates for which Illumina variant calling made a confident variant call that agreed with the ground truth, hence a site with a perfect (1.0) EBR score requires Illumina read data to pass the default quality criteria (Section 4), and then agree with the PacBio defined ground truth for 100% of the isolates (Examples in Fig. 2).
Fig. 2.
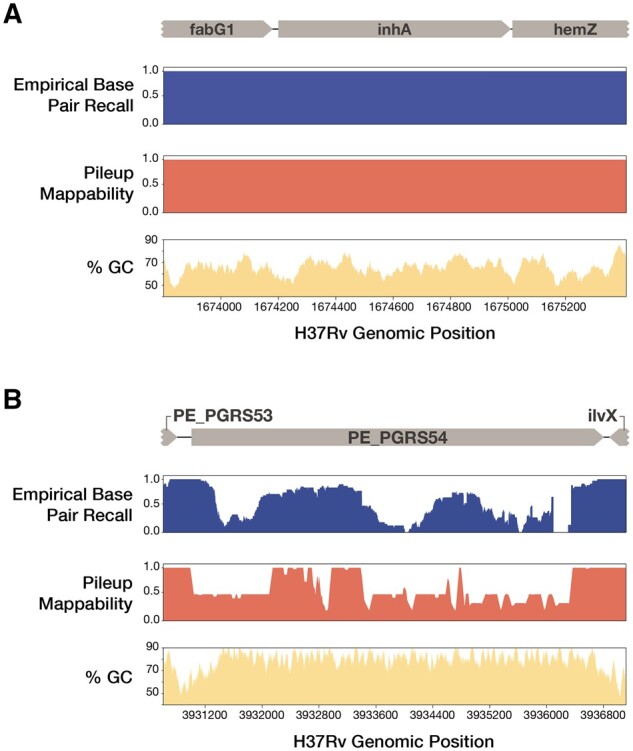
EBR, pileup mappability and GC content across two example regions of the H37Rv genome. EBR, pileup mappability (K = 50 bp, e = 4 mismatches) and GC% (100 bp window) values are plotted across all base pair positions of two regions of interest. (A) InhA, an antibiotic resistance gene, shows perfect EBR across the entire gene body. (B) In contrast, PE_PGRS54, a known highly repetitive gene with high GC content, has extremely low EBR across the entire gene body. Browser tracks of EBR and pileup mappability in BEDGRAPH format are made available as supplementary Files 17 and 18
To evaluate EBR within our dataset, we used a variant calling pipeline consisting of BWA-mem for alignment and Pilon for variant calling. This decision was based on the published performance of Pilon compared with other tools applied to Mtb genomes (Walker et al., 2014). To further confirm the generalizability of our findings using the chosen pipeline, we benchmarked 15 combinations of 3 aligners and 5 variant callers (Koboldt et al., 2012; Li, 2011, 2013, 2018; Langmead and Salzberg, 2012; Poplin et al., 2018; Walker et al., 2014; Fig. 3 and Supplementary Figs 9 and 10). We found that using the BWA-mem aligner and the Pilon variant caller (BWA-Pilon) demonstrated the highest overall recall of SNSs and small INDELs while maintaining precision above 99%. Complete benchmarking results for all 15 tested pipelines can be found in Supplementary Results.
Fig. 3.
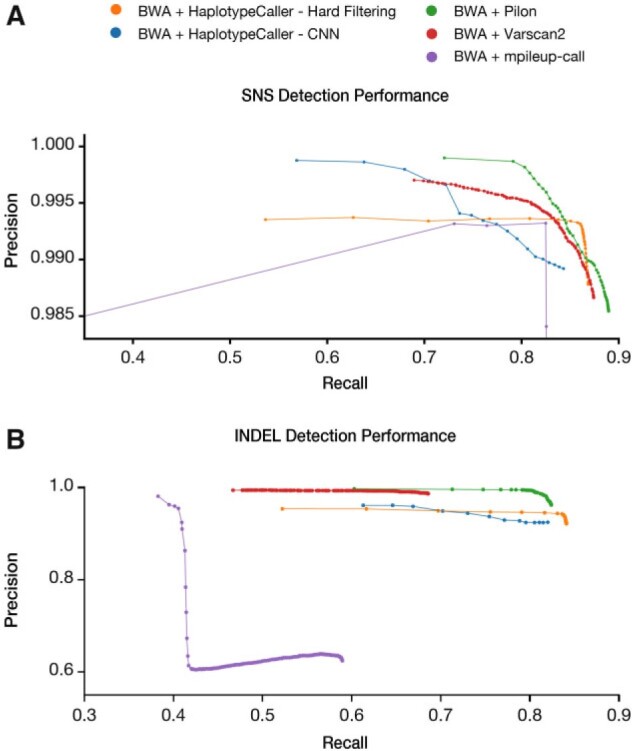
Variant calling performance across five variant calling pipelines using the BWA-mem aligner. (A) SNS variant calling performance was evaluated when using the BWA-mem aligner with the following variant calling pipelines: Pilon, mpileup-call, Varscan2, GATK-HaplotypeCaller-HardFiltering, and GATK-HaplotypeCaller-CNN. (B) INDEL (1–15 bp) variant calling performance was evaluated when using the BWA-mem aligner with the five variant calling pipelines listed above. The mean precision and recall across all 36 isolates were calculated for each set of filtering parameters evaluated. All benchmarking results at the aggregate and individual sample level can be found in Supplementary File S24
EBR was significantly lower within PLC regions (mean EBR = 0.905, N = 469 501 bp) than the rest of the genome (mean EBR = 0.998, N = 3 942 031 bp, Mann–Whitney U-test, P < 2.225e−308) (Fig. 4A and Supplementary Table S1). But EBR was not consistently low across PLC regions, with 67% of PLC base positions having EBR ≥ 0.97. EBR averaged by gene (gene-level EBR) also showed heterogeneity across PLC regions with 62.6%, 61.3% and 82.6%, respectively, of the MGEs, PE/PPE and previously classified repetitive genes having gene-level EBR ≥0.97 (Fig. 4B, Supplementary Fig. S3, Supplementary Tables S2 and S3 and Supplementary File S7). Across all non-PLC genes (N = 3695) the mean gene-level EBR was 0.999, and among these only 14 non-PLC genes had a gene-level EBR < 0.97. The top five lowest EBR non-PLC genes are cysA2, cysA3, Rv0071, Rv0072 and Rv0073, representing genes which have typically been included in analysis despite inconsistent variant calling evaluation.
Fig. 4.
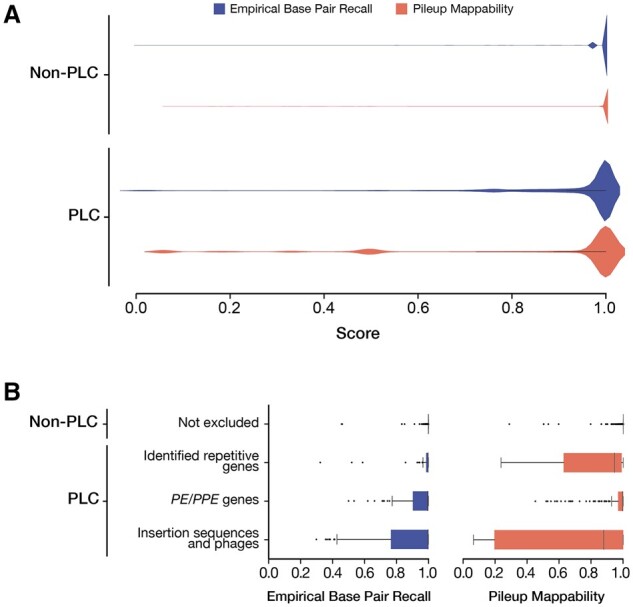
Distribution of EBR and pileup mappability scores in PLC and non-PLC regions. (A) Comparison of the base-level distribution of EBR and pileup mappability (P-Map, K = 50, E = 4) scores of PLC and non-PLC regions. (B) The distribution of gene-level mean EBR and P-Map (K = 50, E = 4) between PLC and non-PLC regions. The pe and ppe gene families (PE/PPEs) and MGEs, which make up 82% of PLC genes, demonstrated significantly lower mean EBR and pileup mappability than other non-PLC genes
2.3 Characteristics of regions with low empirical performance
Across all 36 isolates evaluated, we observed 1 825 385 sites where Illumina failed to confidently agree with the inferred ground truth. These low recall sites were spread across 267 471 unique positions of the H37Rv reference genome with EBR < 1. Of these low EBR positions, 5962 positions (2.2%) were poorly recalled in nearly all isolates (EBR < 0.05). We explored the underlying factors associated with low recall at these positions using the associated filter and quality tags provided by the variant caller, Pilon (Section 4 and Supplementary Table S4). Across the 1 829 181 low recall sites, the distribution of outcomes included: (i) 62.78% low coverage (LowCov), (ii) 30.74% falsely called as deleted (Del) with or without low coverage or other tags, (iii) 6.24% were missed deletions tagged as PASS, (iv) 0.03% (669 sites) were false base calls (reference or alternate) tagged as PASS and (v) 0.25% remaining positions were labeled as ambiguous (Amb) due to evidence for two or more alleles at a frequency ≥25%.
Among all low recall sites annotated with a low coverage tag: (i) 45.8% were due to insufficient total coverage of aligned reads (sequencing bias or extreme sequence divergence, total depth < 5), (ii) 27.6% lacked uniquely aligning reads [repetitive sequence content, mapping quality (MQ) = 0] and (iii) 26.6% were due to low confidence paired-end alignments that did not pass Pilon’s heuristics [likely structural variation (SV) causing improper paired-alignment orientation].
2.4 Repetitive sequence content
We identified repetitive regions in H37Rv and evaluated their relationship with low EBR using the pileup mappability metric (Section 4). Pileup mappability scores range from 0 to 1, where 1 represents a genomic position where all overlapping sequence K-mers are unique in the genome of interest within a similarity threshold of E mismatches. We calculated pileup mappability conservatively with a K-mer size of 50 base pairs and up to 4 mismatches (P-Map-K50E4, Supplementary File S6). P-Map-K50E4 is lower in PLC regions (mean = 0.856) than non-PLC regions (mean = 0.997) (Mann–Whitney U-Test, P < 0.001) (Fig. 4A). Yet, 69.7% of positions in PLC regions had P-Map-K50E4 scores of 1, indicating uniquely alignable sequence content even with sequence lengths as short as 50 bp (Supplementary Table S5). At the gene level, PE/PPEs and MGEs had lower P-Map-K50E4 than the rest of the genome (Wilcoxon, P < 2e−308) (Fig. 4B, Supplementary Table S6 and Supplementary File S7) but 34.5% and 32.7% of these genes, respectively, had perfect (1.0) P-Map-K50E4 across the entire gene body. Previously identified repetitive genes (N = 69) had a gene-level P-Map-K50 below 1, which is expected given that this was their defining feature (Coscolla et al., 2015), but for the majority (51 of 69), median mappability was greater than 0.99, indicating that a high proportion of their sequence content was actually unique. Non-PLC functional categories had a median gene level P-Map-K50E4 = 1.0 (Supplementary Fig. S4 and Supplementary Table S7). Genome-wide P-Map-K50E4 and EBR scores were moderately correlated (Spearman’s ρ = 0.47, P < 2e−308). Thirty percent of all genome positions with EBR < 1.0 also had a P-Map-K50E4 score below 1.0.
2.5 Sequencing bias in high GC-content regions
Across several sequencing platforms, high-GC content associates with low sequencing depth due to low sequence complexity, PCR biases in the library preparation and sequencing chemistry (Barbitoff et al., 2020; Goig et al., 2020; Nakamura et al., 2011; Ross et al., 2013). We assessed the sequencing bias of Illumina and PacBio across each individual genome assembly using the relative depth metric (Ross et al., 2013) (the depth per site divided by average depth across the entire assembly) to control for varying depth between isolates. On average with Illumina, 1.2% of the genome had low relative depth (<0.25), while for PacBio sequencing the average proportion of the genome with low relative depth was 0.0058% (Mann–Whitney U-test, P < 0.001). Both sequencing technologies demonstrated coverage bias against high-GC regions, with more extreme bias for Illumina than PacBio (Supplementary Fig. S5 and Supplementary File S8). Across all base pair positions with local GC% ≥80%, using a window size of 100 bp, the mean relative depth was 0.79 for PacBio and 0.35 for Illumina. Genome-wide, EBR was significantly negatively correlated with GC content (Spearman’s ρ = −0.12, P < 2e−308), but this correlation was weaker than that observed with sequence uniqueness (P-Map-K50E4, as above Spearman’s ρ = 0.47).
2.6 False positive SNS variant calls
Next, we focused specifically on regions with high numbers of false positive SNSs identified through comparison with the ground-truth variant calls. We examined the distribution of false positive SNS calls across the H37Rv reference genome using a realistic intermediate variant filtering threshold of mean MQ at the variant site (MQ ≥ 30, Fig. 5 and Supplementary File S9). The top 30 regions ranked by the number of false positives (23 genes and 7 intergenic regions) contained 89.4% (490/548) of the total false positive calls and spanned 65 kb, 1.5% of the H37Rv genome. Of these 30 false positive hotspot regions, 29 were either a PLC gene or an intergenic region adjacent to a PLC gene: 17 PE/PPE genes, 3 MGEs, 2 were previously identified repetitive genes (Coscolla et al., 2015) and 7 PLC-adjacent intergenic regions. Across all false positives, the PE-PGRS and PPE-MPTR sub-families of the PE/PPE genes were responsible for a large proportion (45.4%) of total false positive variant calls. Of all the 556 false positives SNSs evaluated (MQ ≥ 30), only 14 were detected across 4 non-PLC genes: Rv3785 (9 FPs), Rv2823c (1 FP), plsB2 (2 FPs) and Rv1435c (2 FPs).
Fig. 5.
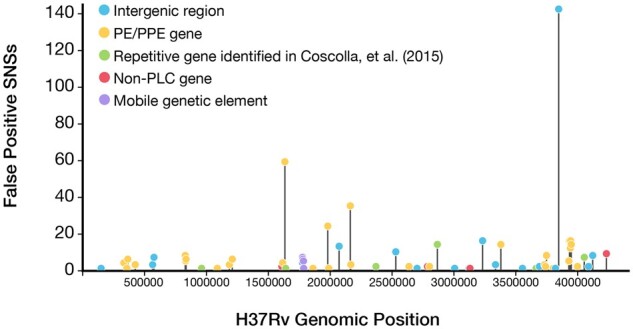
The distribution of potential false positive SNS calls across all genomic regions of the H37Rv genome. The frequency of false positive SNS calls detected (MQ ≥ 30) across all 36 isolates evaluated was plotted for all regions of the H37Rv genome (gene or intergenic regions). The top 30 regions ranked by the number of total false positives contained 89.4% (490/548) of the total false positive SNSs and spanned only 65 kb of the H37Rv genome. Full results for all annotated genomic regions (gene or intergenic) can be found in Supplementary File S9
2.7 Masking to balance precision and recall
A common approach for reducing Mtb false positive variant calls is to mask/exclude all PLC regions from variant calling. Here, we investigated two variations on this that utilize directly reference sequence uniqueness and variant quality metrics. We compared: (i) masking of regions with non-unique sequence, defined as positions with P-Map-K50E4 < 1, (ii) No a priori masking of any regions and (iii) masking of all PLC genes (the current standard practice). We then filtered potential variant calls by whether the variant passed all internal heuristics of the BWA-Pilon-based variant calling pipeline (Section 4) and studied the effect of varying the mean MQ filtering threshold from 1 to 60 (Fig. 6). We computed the F1-score, precision and recall of detection of SNSs and small indels (≤15 bp) for each masking schema and MQ threshold across all 36 clinical isolates (Section 4 and Supplementary File S10).
Fig. 6.
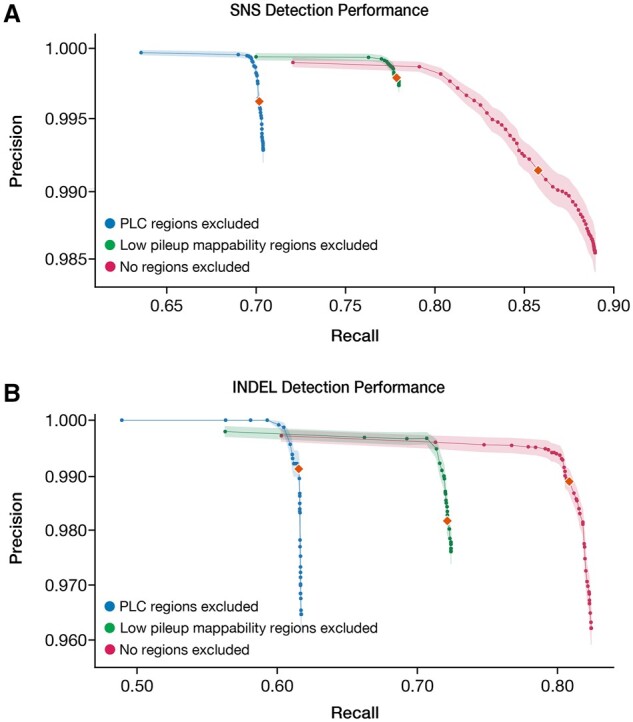
Mean SNV and INDEL variant calling performance across different masking approaches. (A) SNS variant calling performance was evaluated across the following three schemas: (1) masking of regions with non-unique sequence, as defined as positions with P-Map-K50E4 < 1, (2) no a priori masking of any regions, and compared with (3) masking of all PLC genes (the current standard practice). (B) short INDEL (1–15 bp) variant calling performance was evaluated across the same schemas. The orange diamonds represent the mean precision and recall using a MQ threshold of 40 for both (A) and (B). Shaded regions represent the SEM of precision across all 36 isolates evaluated. For all masking approaches evaluated, the MQ thresholds evaluated ranged from 1 to 60. Complete benchmarking results can be found for each individual isolate in Supplementary File S10
For SNSs, mean recall ranged from 63.6% to 89.0% and precision ranged from 98.5% to 99.97% across the three schemas (Fig. 6A). At a threshold of MQ ≥ 40, we observed the following mean SNS performances: (i) Masking non-unique regions, F1 = 0.87 (precision = 99.8%, recall = 77.9%), (ii) no masking of the genome, F1 = 0.92 (precision = 99.1%, recall = 85.8%) and (iii) masking PLC genes, F1 = 0.82 (precision = 99.6%, recall = 70.2%). Based on F1 score, no masking of the genome had the highest overall performance, but masking non-unique regions had the highest precision. Decreasing the MQ threshold to an optimal value for F1 score resulted in similar performance for Schema-1 and -3, but a balance of lower precision and higher recall for schema-2. Increasing the MQ threshold to 60 optimized precision but at considerable loss of recall for all three schemas (Supplementary Table S8). Performance was most sensitive to the MQ threshold under schema 2 (no masking).
For INDELs (1–15 bp), precision was comparable to SNSs (96.2–100%, Fig. 6B), while recall was lower (48.9–82.4%). At a threshold of MQ ≥ 40, we observed the following mean INDEL performances: (i) masking non-unique regions, F1 = 0.83 (precision = 98.2, recall = 72.1%), (ii) no masking of the genome, F1 = 0.89 (precision = 98.9, recall = 80.8%) and (iii) masking PLC genes, F1 = 0.76 (precision = 99.1%, recall = 61.5%). Variant calling performance of short (1–5 bp) INDELs was comparable to SNSs and the limited performance for INDELs was largely driven by low recall of longer (6–15 bp) INDELs (Supplementary Fig. S6 and Supplementary File S11).
2.8 Structural variation
We assessed the effect of SV, of length ≥50 bp, a common source of reference bias, on variant calling performance (Section 4). Detected SVs included the known regions of difference associated with Mtb lineages 1, 2 and 3 (RD239, RD181 and RD750, respectively) (Sharifipour et al., 2016; Thomas et al., 2011; Supplementary Fig. S7). Across all 36 isolate assemblies, we observed a strong negative correlation between average nucleotide identity to the H37Rv reference and the number of SVs detected (Spearman’s R = −0.899, p < 1.1e−13, Supplementary Fig. S8). Additionally, we observe that 70% of detected SVs overlapped with regions with low pileup mappability (P-Map-K50E4 < 1.0).
We compared SNS variant calling performance by proximity to an SV and sequence uniqueness (Fig. 7 and Supplementary File S12), dividing variants into four groups: (1) SNSs in regions with perfect mappability (Pmap-K50E4 = 1) with no identified SV (87.3% of total 47 412 SNSs), (2) SNSs in regions with low mappability (Pmap-K50E4 < 1) with no identified SV (10.9% of SNSs), (3) SNSs in regions with perfect mappability within 100 bp of any identified SV (0.8% of SNSs) and (4) SNSs in regions with low mappability within 100 bp of any identified SV (1.0% of SNSs). Variant calling performance decreased most sharply in regions with evidence for SV, especially when sequence content is also non-unique (Region types 3 and 4, respectively). Additionally, region type (2), or low mappability sequence content with no nearby SV, demonstrated reduced performance.
Fig. 7.
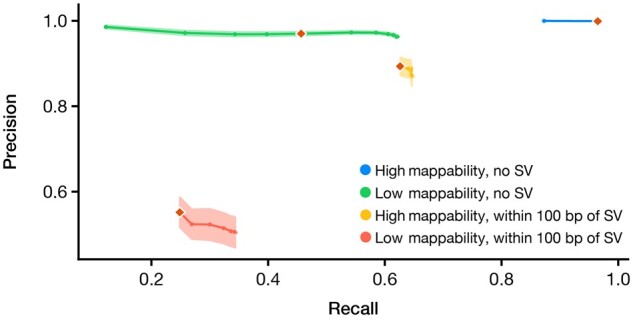
SNS variant calling performance stratified by proximity to structural variants and low pileup mappability sequence. Mappability is dichotomized at Pmap-K50E4 = 100% or <100%. Regions within 100 bp of a SV categorized as ‘with SV’. Mean precision and recall of SNS detection is plotted for the following genomic contexts: (1) regions with high mappability with no SV (blue), (2) regions with low mappability and no SV (green), (3) regions with high mappability with SV (orange) and (4) regions with low mappability and with SV (red) The standard error of the mean (SEM) for precision is shaded for each curve. Orange diamonds represent the precision and recall using the same MQ threshold of 40
2.9 Refined regions of low confidence
Based on the presented analysis, we define a set of refined low confidence (RLC) regions of the Mtb reference genome. The RLC regions are defined to account for the largest sources of error and uncertainty in analysis of Illumina WGS, and is defined as the union of (A) The 30 false positive hot spot regions identified (65 kb), (B) low recall genomic regions with EBR < 0.9 (142 kb with 30 kb overlap with (A)) and (C) regions ambiguously defined by long-read sequencing (Section 4, 16 kb). We additionally evaluated the overlap between all detected SVs and the three RLC categories: RLC subset (A) overlapped 28% of SVs, RLC subset (B) overlapped with 65% of SVs and RLC subset (C) overlapped with 14% of SVs.
In total, the proposed RLC regions account for 177 kb (4.0%) of the total H37Rv genome (Supplementary File S13) and their masking represents a conservative approach to variant filtering. Across the 36 isolates evaluated, masking of the RLC regions with filtering threshold of MQ ≥ 40 for BWA-Pilon’s SNS variant calling would produce a mean F1-score of 0.882, with a mean precision of 99.9% and a mean recall of 78.9%.
3 Discussion
The analysis and interpretation of Illumina WGS is critical for both research and clinical applications. Here, we study the ‘blindspots’ of paired-end Illumina WGS by benchmarking reference-based variant calling accuracy using 36 Mtb isolates with high confidence complete genome assemblies. Overall, our results improve our general understanding of the factors that affect Illumina WGS performance. In particular, we systematically quantify variant calling accuracy and the effect of sequence uniqueness, GC-content, coverage bias and SV. For Mtb, we demonstrate that a much greater proportion of the genome can be analyzed with Illumina WGS than previously thought and provide a systematically defined set of low confidence/troublesome regions for future studies.
Approaches to benchmarking variant calling from Illumina WGS vary by field and species of interest and more standardization is needed (Walter et al., 2020). Variant calling accuracy is usually benchmarked through in silico variant introduction with read simulation or otherwise using a small number of reference genomes that seldom capture the full range of diversity within a particular species. Our benchmarking exercise is unique in using a large and diverse set of high-quality genome assemblies that are built using a hybrid long- and short-read approach. Our results further support existing evidence that PacBio long-read sequencing is much less prone to coverage bias and can generate complete circular bacterial assemblies bridging repetitive regions in the majority of isolates with a median depth >180×. The assemblies we generate will be an important community resource for benchmarking future variant calling or other WGS-based bioinformatics tools.
The benchmarking results clearly demonstrate that low variant recall is a major limitation of reference-based Illumina variant calling, which achieved at most 89% recall at the optimal F1 score. Precision of variant calling using Illumina on the other hand was very high, with the small number of false variant calls concentrated in repetitive and structurally variable regions. We find that the best balance between precision and recall is achieved by tuning the variant mean MQ threshold, i.e. confidence of the read mapping. The specific MQ threshold will likely vary by species. For a GC-rich organism with highly repetitive sequence content like Mtb, a MQ threshold of 40 achieved 85.8% recall and 99.1% precision.
Studying specific sources of low recall from Illumina, we identified insufficient read coverage to be the major driver, due not only to repetitive sequence content but also due to high-GC content and other sources of coverage bias. We further identified regions near SV to be particularly prone to low recall and precision. Of the variants we study, longer INDELs were recalled at lower rates than SNSs or INDELs <6 bp in length. These observations support ongoing efforts by the bioinformatics research community to build graph-reference genomes and align short reads to these graphs. Using a graph pan-genome built with a diverse set of Mtb reference genomes, there is great potential to both increase recall and precision of variant calling in structurally divergent regions of the genome.
An alternative and generalizable approach to maximize precision of reference-based Illumina variant calling is to mask repetitive (low mappability) regions. This simple approach does not require tuning filtering thresholds against a ground truth set of assemblies and relies instead on computing the pileup mappability metric across the reference sequence. This fills a gap for variant calling in other organisms using short-read mapping where low confidence regions may not already be defined. Compared with tuning against a ground-truth set of assemblies, this masking approach is conservative: for Mtb and filtering by MQ ≥ 40 with the BWA-Pilon variant calling pipeline, precision is slightly higher at 99.8% versus 99.1%, respectively, and recall is lower at 77.9% versus 85.8%, respectively.
Given Mtb’s genomic stability and clonality, this organism is particularly well suited for systematically identifying the sources of variant calling error from short-read data. Although 10.7% of the Mtb reference sequence is commonly excluded from genomic analysis, our results demonstrate that more than half of these regions are accurately called using Illumina WGS. For the PE/PPE family, of highest concern for sequencing error, nearly one-third (52/168) had perfect mappability and near perfect gene-level EBR (≥0.99). The PE/PPE genes with poor performance were largely the PE_PGRS and PPE_MPTR sub-families. Only 65 kb (1.5%) of the reference genome H37Rv were responsible for the majority of false positives (89.2% of false positives across 36 isolates).
We present a set of RLC regions of the Mtb genome, designed to account for the largest sources of error and uncertainty in analysis of Illumina WGS (Supplementary File S13). Long-read data can allow RLC regions to be defined for other species to improve accuracy of Illumina WGS. The Mtb RLC regions span 4.0% of the reference genome and their masking provides a conservative approach to variant calling, appropriate for applications where precision is prioritized over recall. At the same time, RLC region masking offers higher recall than the current field standard where more than 10% of the Mtb reference genome is masked. One limitation is that RLC regions were largely defined based on EBR of Illumina sequencing in our dataset that was restricted by design to 100+ bp paired-end sequencing. We do not recommend the use of these RLC regions for Illumina sequencing at shorter read lengths or single-end reads. Instead we make available a more appropriate masking scheme of RLC regions + low pileup mappability (Supplementary File S14). Another limitation is that we defined RLC regions using the same set of high confidence assemblies evaluated. The reported precision and recall with RLC region masking are thus likely overestimates. On the other hand, we expect precision and recall estimates of the alternative approaches of masking low mappability regions or filtering at MQ ≥ 40 to be more robust.
In summary, we show that Illumina WGS has high precision but limited recall in repetitive and structurally variable regions when benchmarked against a diverse set of complete assemblies. We demonstrate that filtering variants based on variant quality annotations, such as mean MQ, allows for a greater range of precision and recall than masking of specific low confidence regions of the genome. Masking repetitive sequence content is a second generalizable solution, albeit a more conservative one, that maintains high precision. For Mtb, these two approaches increase recall of variants by 15.6% and 7.7%, respectively, with a minimal change in precision (−0.5% and +0.1%, respectively, at MQ ≥ 40), allowing high variant recall in >50% of regions previously considered by the field to be error-prone. Our results improve variant recall from Illumina data with broad implications for clinical and research applications of sequencing. Improving Illumina variant recall has significant implications. For clonal Mtb, for example transmission inference using genomic data often relies on a very small number of SNS or INDEL differences between genome pairs. The observed large increase in recall we observe has the potential to substantially improve transmission inference (Jajou et al., 2019) and/or our understanding of genome stability and adaptation.
4 Materials and methods
4.1 Summary of sequencing data
From a combination of newly sequenced clinical isolates and publicly available data (Supplementary Methods), 38 Mtb isolates were selected for having (i) Illumina WGS with paired-end reads with a depth of coverage ≥40× across the Mtb reference genome (H37Rv). All aggregated metadata and SRA/ENA accessions for PacBio and Illumina sequencing data associated with this analysis can be found in Supplementary File S15. DNA extraction, sequencing, assembly and variant calling methods are further detailed in Supplementary Methods.
4.2 Calculation of EBR of Illumina variant calling
The goal of the EBR for score is to summarize the consistency by which Illumina WGS correctly evaluated any given genomic position. The EBR for a genomic position was defined as the proportion isolates where Illumina WGS confidently and correctly agreed with the PacBio defined ground truth. The details of the EBR calculation are described in Supplementary Methods. The base-level EBR scores are available in TSV and BEDGRAPH format for easy visualization in a genome browser (Supplementary Files S6 and S18).
Supplementary Material
Acknowledgements
We are grateful to Natalia Quiñones and Karel Brinda for their helpful discussions and advise throughout the project. We are also grateful to Melissa Smith and Irina Oussenko for their assistance in PacBio (RS II) long-read sequencing of the Mtb genomic DNA. We acknowledge NIH Intramural Sequencing Center (NISC) for the PacBio (Sequel II) long-read sequencing of the Mtb genomic DNA; Critical Path Institute (C-Path) and Translational Genomics Research Institute (T-Gen) for the Illumina sequencing of the Mtb DNAs and for the mTB DNA long-term storage; the International Science and Technology Center for their support in establishing the TB Portal agreement with Georgia and CRDF Global for their support in establishing the TB Portal agreements with Azerbaijan and Moldova.
Data availability and materials
All new sequencing data generated for this study were submitted to the NCBI SRA database under BioProject accessions PRJNA719670, PRJNA480888, PRJNA436997 and PRJNA421446. The publicly available PacBio and Illumina data from two previously published studies (Borrell et al., 2019; Chiner-Oms et al., 2019; Ngabonziza et al., 2020) are available under BioProject accessions PRJEB8783, PRJEB31443, PRJEB27802 and PRJNA598991. SRA/ENA accessions and related sequencing metadata for all data can be found in Supplementary File S15. All code for data processing and analysis in this study is available from the following GitHub repository, https://github.com/farhat-lab/mtb-illumina-wgs-evaluation. The repository README provides instructions to run each part of the analysis using the Snakemake (Köster and Rahmann, 2012) workflow engine and using Python-based Jupyter notebooks.
Funding
This work was supported in part by the Office of Science Management and Operations of the National Institute of Allergy and Infectious Diseases (NIAID) and by the National Institutes of Health [AI55765 and ES026835].
Conflict of Interest: none declared.
References
- Aird D. et al. (2011) Analyzing and minimizing PCR amplification bias in Illumina sequencing libraries. Genome Biol., 12, R18. [DOI] [PMC free article] [PubMed] [Google Scholar]
- Ates L.S. (2019) New insights into the mycobacterial PE and PPE proteins provide a framework for future research. Mol. Microbiol., 113, 4–21. [DOI] [PMC free article] [PubMed] [Google Scholar]
- Barbitoff Y.A. et al. (2020) Systematic dissection of biases in whole-exome and whole-genome sequencing reveals major determinants of coding sequence coverage. Sci. Rep., 10, 2057. [DOI] [PMC free article] [PubMed] [Google Scholar]
- Benjamini Y., Speed T.P. (2012) Summarizing and correcting the GC content bias in high-throughput sequencing. Nucleic Acids Res., 40, e72. [DOI] [PMC free article] [PubMed] [Google Scholar]
- Borrell S. et al. (2019) Reference set of Mycobacterium tuberculosis clinical strains: a tool for research and product development. PLoS ONE, 14, e0214088. [DOI] [PMC free article] [PubMed] [Google Scholar]
- Chiner-Oms Á. et al. (2019) Genome-wide mutational biases fuel transcriptional diversity in the Mycobacterium tuberculosis complex. Nat. Commun., 10, 3994. [DOI] [PMC free article] [PubMed] [Google Scholar]
- Coscolla M. et al. (2015) M. tuberculosis T cell epitope analysis reveals paucity of antigenic variation and identifies rare variable TB antigens. Cell Host Microbe, 18, 538–548. [DOI] [PMC free article] [PubMed] [Google Scholar]
- Coscolla M., Gagneux S. (2014) Consequences of genomic diversity in Mycobacterium tuberculosis. Semin. Immunol., 26, 431–444. [DOI] [PMC free article] [PubMed] [Google Scholar]
- Darling A.E. et al. (2010) progressiveMauve: Multiple genome alignment with gene gain, loss and rearrangement. PLoS ONE, 5, e11147. [DOI] [PMC free article] [PubMed] [Google Scholar]
- De Maio N. et al. (2019) Comparison of long-read sequencing technologies in the hybrid assembly of complex bacterial genomes. Microb. Genom., 5, e000294. [DOI] [PMC free article] [PubMed] [Google Scholar]
- Garrison E. et al. (2018) Variation graph toolkit improves read mapping by representing genetic variation in the reference. Nat. Biotechnol., 36, 875–879. [DOI] [PMC free article] [PubMed] [Google Scholar]
- Goig G.A. et al. (2020) Contaminant DNA in bacterial sequencing experiments is a major source of false genetic variability. BMC Biol., 18, 24. [DOI] [PMC free article] [PubMed] [Google Scholar]
- Hicks N.D. et al. (2018) Clinically prevalent mutations in Mycobacterium tuberculosis alter propionate metabolism and mediate multidrug tolerance. Nat. Microbiol., 3, 1032–1042. [DOI] [PMC free article] [PubMed] [Google Scholar]
- Holt K.E. et al. (2018) Frequent transmission of the Mycobacterium tuberculosis Beijing lineage and positive selection for the EsxW Beijing variant in Vietnam. Nat. Genet., 50, 849–856. [DOI] [PMC free article] [PubMed] [Google Scholar]
- Jajou R. et al. (2019) Towards standardisation: Comparison of five whole genome sequencing (WGS) analysis pipelines for detection of epidemiologically linked tuberculosis cases. Euro Surveill., 24, 1900130. [DOI] [PMC free article] [PubMed] [Google Scholar]
- Koboldt D.C. et al. (2012) VarScan 2: Somatic mutation and copy number alteration discovery in cancer by exome sequencing. Genome Res., 22, 568–576. [DOI] [PMC free article] [PubMed] [Google Scholar]
- Köster J., Rahmann S. (2012) Snakemake—a scalable bioinformatics workflow engine. Bioinformatics, 28, 2520–2522. [DOI] [PubMed] [Google Scholar]
- Langmead B., Salzberg S.L. (2012) Fast gapped-read alignment with Bowtie 2. Nat. Methods, 9, 357–359. [DOI] [PMC free article] [PubMed] [Google Scholar]
- Li H. (2011) A statistical framework for SNP calling, mutation discovery, association mapping and population genetical parameter estimation from sequencing data. Bioinformatics, 27, 2987–2993. [DOI] [PMC free article] [PubMed] [Google Scholar]
- Li H. (2013) Aligning sequence reads, clone sequences and assembly contigs with BWA-MEM. arXiv [q-bio.GN].
- Li H. et al. (2008) Mapping short DNA sequencing reads and calling variants using mapping quality scores. Genome Res., 18, 1851–1858. [DOI] [PMC free article] [PubMed] [Google Scholar]
- Li H. (2018) Minimap2: Pairwise alignment for nucleotide sequences. Bioinformatics, 34, 3094–3100. [DOI] [PMC free article] [PubMed] [Google Scholar]
- Li H. (2014) Toward better understanding of artifacts in variant calling from high-coverage samples. Bioinformatics, 30, 2843–2851. [DOI] [PMC free article] [PubMed] [Google Scholar]
- Meehan C.J. et al. (2019) Whole genome sequencing of Mycobacterium tuberculosis: Current standards and open issues. Nat. Rev. Microbiol., 17, 533–545. [DOI] [PubMed] [Google Scholar]
- Modlin S.J. et al. (2021) Exact mapping of Illumina blind spots in the Mycobacterium tuberculosis genome reveals platform-wide and workflow-specific biases. Microb. Genom., 7, mgen000465. [DOI] [PMC free article] [PubMed] [Google Scholar]
- Nakamura K. et al. (2011) Sequence-specific error profile of Illumina sequencers. Nucleic Acids Res., 39, e90. [DOI] [PMC free article] [PubMed] [Google Scholar]
- Ngabonziza J.C.S. et al. (2020) A sister lineage of the Mycobacterium tuberculosis complex discovered in the African Great Lakes region. Nat. Commun., 11, 2917. [DOI] [PMC free article] [PubMed] [Google Scholar]
- Paten B. et al. (2017) Genome graphs and the evolution of genome inference. Genome Res., 27, 665–676. [DOI] [PMC free article] [PubMed] [Google Scholar]
- Poplin R. et al. (2018) Scaling accurate genetic variant discovery to tens of thousands of samples. bioRxiv, 201178.
- Rhoads A., Au K.F. (2015) PacBio sequencing and its applications. Genom. Proteom. Bioinform., 13, 278–289. [DOI] [PMC free article] [PubMed] [Google Scholar]
- Ross M.G. et al. (2013) Characterizing and measuring bias in sequence data. Genome Biol., 14, R51. [DOI] [PMC free article] [PubMed] [Google Scholar]
- Schmid M. et al. (2018) Pushing the limits of de novo genome assembly for complex prokaryotic genomes harboring very long, near identical repeats. Nucleic Acids Res., 46, 8953–8965. [DOI] [PMC free article] [PubMed] [Google Scholar]
- Sharifipour E. et al. (2016) Deletion of region of difference 181 in Mycobacterium tuberculosis Beijing strains. Int. J. Mycobacteriol., 5(Suppl. 1), S238–S239. [DOI] [PubMed] [Google Scholar]
- Stoler N., Nekrutenko A. (2021) Sequencing error profiles of Illumina sequencing instruments. NAR Genom. Bioinform., 3, lqab019. [DOI] [PMC free article] [PubMed] [Google Scholar]
- Thomas S.K. et al. (2011) Modern and ancestral genotypes of Mycobacterium tuberculosis from Andhra Pradesh, India. PLoS ONE, 6, e27584. [DOI] [PMC free article] [PubMed] [Google Scholar]
- Walker B.J. et al. (2014) Pilon: An integrated tool for comprehensive microbial variant detection and genome assembly improvement. PLoS ONE, 9, e112963. [DOI] [PMC free article] [PubMed] [Google Scholar]
- Walter K.S. et al. (2020) Genomic variant-identification methods may alter Mycobacterium tuberculosis transmission inferences. Microb Genom, 6, mgen000418. [DOI] [PMC free article] [PubMed] [Google Scholar]
- Wenger A.M. et al. (2019) Accurate circular consensus long-read sequencing improves variant detection and assembly of a human genome. Nat. Biotechnol., 37, 1155–1162. [DOI] [PMC free article] [PubMed] [Google Scholar]
Associated Data
This section collects any data citations, data availability statements, or supplementary materials included in this article.
Supplementary Materials
Data Availability Statement
All new sequencing data generated for this study were submitted to the NCBI SRA database under BioProject accessions PRJNA719670, PRJNA480888, PRJNA436997 and PRJNA421446. The publicly available PacBio and Illumina data from two previously published studies (Borrell et al., 2019; Chiner-Oms et al., 2019; Ngabonziza et al., 2020) are available under BioProject accessions PRJEB8783, PRJEB31443, PRJEB27802 and PRJNA598991. SRA/ENA accessions and related sequencing metadata for all data can be found in Supplementary File S15. All code for data processing and analysis in this study is available from the following GitHub repository, https://github.com/farhat-lab/mtb-illumina-wgs-evaluation. The repository README provides instructions to run each part of the analysis using the Snakemake (Köster and Rahmann, 2012) workflow engine and using Python-based Jupyter notebooks.


