

Abstract
Motivation
Omics data are broadly used to get a snapshot of the molecular status of cells. In particular, changes in omics can be used to estimate the activity of pathways, transcription factors and kinases based on known regulated targets, that we call footprints. Then the molecular paths driving these activities can be estimated using causal reasoning on large signalling networks.
Results
We have developed FUNKI, a FUNctional toolKIt for footprint analysis. It provides a user-friendly interface for an easy and fast analysis of transcriptomics, phosphoproteomics and metabolomics data, either from bulk or single-cell experiments. FUNKI also features different options to visualize the results and run post-analyses, and is mirrored as a scripted version in R.
Availability and implementation
FUNKI is a free and open-source application built on R and Shiny, available at https://github.com/saezlab/ShinyFUNKI and https://saezlab.shinyapps.io/funki/.
Supplementary information
Supplementary data are available at Bioinformatics online.
1 Introduction
Multiple methods are conceived to infer the activities of specific processes or molecules using the abundance of known targets from omic data (Supplementary Table S1). We call them footprint-based methods (Dugourd and Saez-Rodriguez, 2019), and we have developed such tools for transcription factor (TF) from transcripts of target genes (Garcia-Alonso et al., 2019), kinases from phosphorylated sites (Wirbel et al., 2018) and pathways from transcripts of downstream responsive genes (Schubert et al., 2018). These activities can then be used to contextualize large signalling networks by identifying paths that can explain the changes in activities via reverse causal reasoning (Dugourd et al., 2021; Liu et al., 2019), and be further linked to changes observed at the level of metabolite abundances (Dugourd et al., 2021; Liu et al., 2019).
FUNKI (FUNctional analysis toolKIt) is an user-friendly interface developed in R (Team, 2020), and designed using Shiny (Chang et al., 2020), to analyze omics data using footprint methods. This application provides an interface for the R implementations (Bioconductor packages) for the aforementioned tools. All methods run on bulk data, and we have shown that they can also be applied to single-cell transcriptomics (Holland et al., 2020a), not only for humans but also for mouse samples (Holland et al., 2020b).
2 Features
The footprint methods implemented in FUNKI allow users to recover functional insight from several omics data without notions of programming. This application also enhances the analysis with an extended graphic visualization of the results. Thus, the typical FUNKI pipeline comprises three steps: (i) import the user’s omic data, (ii) select the analysis tool according to the data and question and (iii) visualize the results in tables and graphical representations (Fig. 1).
Fig. 1.
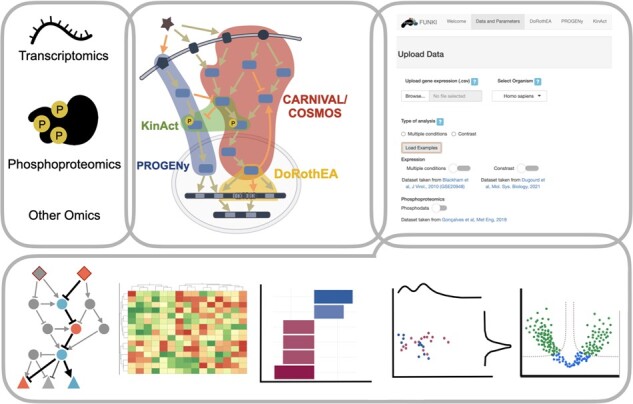
Graphical overview of analysis and visualization features provided by FUNKI. FUNKI provides a user interface to upload omics data, and then run DoRothEA, PROGENy, KinAct, CARNIVAL and COSMOS to estimate the activity of pathways, TFs and kinases. The results are visualized in diverse forms
Currently, the following tools are implemented:
2.1 DoRothEA
DoRothEA (Discriminant Regulon Expression Analysis) is a resource that links TFs with their downstream targets (Garcia-Alonso et al., 2019). TF activities are computed from gene expression where the regulons (the collection of transcriptional targets for each TF) are the underlying gene sets.
2.2 PROGENy
PROGENy (Pathway RespOnsive GENes) is a footprint method developed to infer pathway activity from gene expression data (Schubert et al., 2018). The scores are calculated using a linear model with weights based on consensus gene signatures obtained from publicly available perturbation experiments.
2.3 KinAct
KinAct estimates kinase activities based on abundance changes measures in target phosphorylation sites (Wirbel et al., 2018) using the same algorithm as DoRothEA. Instead of TF-target interactions, KinAct uses collections of kinase–substrate interactions via OmniPath (Türei et al., 2016) and phosphoproteomic data instead of transcriptomic data.
2.4 CARNIVAL and COSMOS
CARNIVAL (CAusal Reasoning for Network identification using Integer VALue programming) reconstructs signalling networks from downstream TF activities by finding the upstream regulators (Dugourd et al., 2021; Liu et al., 2019). COSMOS is an extension of CARNIVAL that provides a multiomic network to connect different types of omic data together, including transcriptomics, metabolomics and phosphoproteomics (Dugourd et al., 2021; Liu et al., 2019). Both methods identify coherent mechanistic hypotheses (subnetworks) that explain how the measured deregulation may be reached.
3 Implementation
FUNKI is a Shiny application developed using R programming language under version 4.0.2 and upgraded to run for 4.1.1 (Chang et al., 2020; Team, 2020). It is directly accessible in the cloud through https://saezlab.shinyapps.io/funki/. The source code is freely available at https://github.com/saezlab/ShinyFUNKI, and it can be run locally in any platform (Windows, macOS and Linux) either downloading the repository or running it directly from GitHub (see https://saezlab.github.io/ShinyFUNKI/ for details).
4 Conclusion
FUNKI provides an intuitive user-friendly interface to run footprint methods from different omics. Together with the analysis implementation, FUNKI also incorporates several graphical representations to explore the results from different perspectives. Users with programming skills can take advantage of an extended script-based version of FUNKI for transcriptomic data (https://github.com/saezlab/transcriptutorial).
We plan to include further tools, such as oCEan, a method to explore unbalanced metabolic enzyme activity profiles (Sciacovelli et al., 2021); and we also welcome contributions from other groups.
Supplementary Material
Acknowledgements
Thanks to the members of Bender’s group and Nicolas Palacio for testing the beta version and feedback to improve FUNKI.
Funding
This work was supported by the European Union’s Horizon 2020 Research and Innovation Programme H2020-ICT-2018-2 project iPC—individualized Paediatric Cure [Grant 826121] and the German Federal Ministry of Education and Research (Bundesministerium für Bildung und Forschung BMBF) MSCoreSys research initiative research core SMART-CARE [031L0212A].
Conflict of Interest: J.S.R. has received funding from GSK and Sanofi and fees from Travere Therapeutics. R.H.B. has received consultant fees from QuantBio.
Contributor Information
Rosa Hernansaiz-Ballesteros, Institute for Computational Biomedicine, Heidelberg University, Heidelberg University Hospital, Faculty of Medicine, Bioquant, Heidelberg 69120, Germany.
Christian H Holland, Institute for Computational Biomedicine, Heidelberg University, Heidelberg University Hospital, Faculty of Medicine, Bioquant, Heidelberg 69120, Germany; Faculty of Biosciences, Heidelberg University, Heidelberg 69120, Germany.
Aurelien Dugourd, Institute for Computational Biomedicine, Heidelberg University, Heidelberg University Hospital, Faculty of Medicine, Bioquant, Heidelberg 69120, Germany; Faculty of Biosciences, Heidelberg University, Heidelberg 69120, Germany.
Julio Saez-Rodriguez, Institute for Computational Biomedicine, Heidelberg University, Heidelberg University Hospital, Faculty of Medicine, Bioquant, Heidelberg 69120, Germany.
References
- Chang W. et al. (2020) Shiny: web application framework for R.
- Dugourd A., Saez-Rodriguez J. (2019) Footprint-based functional analysis of multiomic data. Curr. Opin. Syst. Biol., 15, 82–90. [DOI] [PMC free article] [PubMed] [Google Scholar]
- Dugourd A. et al. (2021) Causal integration of multi-omics data with prior knowledge to generate mechanistic hypotheses. Mol. Syst. Biol., 17, e9730. [DOI] [PMC free article] [PubMed] [Google Scholar]
- Garcia-Alonso L. et al. (2019) Benchmark and integration of resources for the estimation of human transcription factor activities. Genome Res., 29, 1363–1375. [DOI] [PMC free article] [PubMed] [Google Scholar]
- Holland C.H. et al. (2020a) Robustness and applicability of transcription factor and pathway analysis tools on single-cell RNA-seq data. Genome Biol., 21, 36. [DOI] [PMC free article] [PubMed] [Google Scholar]
- Holland C.H. et al. (2020b) Transfer of regulatory knowledge from human to mouse for functional genomics analysis. Biochim. Biophys. Acta, 1863, 194431. [DOI] [PubMed] [Google Scholar]
- Liu A. et al. (2019) From expression footprints to causal pathways: contextualizing large signaling networks with CARNIVAL. NPJ Syst. Biol. Appl., 5, 40. [DOI] [PMC free article] [PubMed] [Google Scholar]
- Schubert M. et al. (2018) Perturbation-response genes reveal signaling footprints in cancer gene expression. Nat. Commun., 9, 20. [DOI] [PMC free article] [PubMed] [Google Scholar]
- Sciacovelli M. et al. (2021) Nitrogen partitioning between branched-chain amino acids and urea cycle enzymes sustains renal cancer progression. BioRxiv.
- Team, R.C. (2020) R: A Language and Environment for Statistical Computing.
- Türei D. et al. (2016) OmniPath: guidelines and gateway for literature-curated signaling pathway resources. Nat. Methods, 13, 966–967. [DOI] [PubMed] [Google Scholar]
- Wirbel J. et al. (2018) Phosphoproteomics-based profiling of kinase activities in cancer cells. Methods Mol. Biol., 1711, 103–132. [DOI] [PMC free article] [PubMed] [Google Scholar]
Associated Data
This section collects any data citations, data availability statements, or supplementary materials included in this article.