Abstract
Box representation has been extensively used for object detection in computer vision. Such representation is efficacious but not necessarily optimized for biomedical objects (e.g., glomeruli), which play an essential role in renal pathology. In this paper, we propose a simple circle representation for medical object detection and introduce CircleNet, an anchor-free detection framework. Compared with the conventional bounding box representation, the proposed bounding circle representation innovates in three-fold: (1) it is optimized for ball-shaped biomedical objects; (2) The circle representation reduced the degree of freedom compared with box representation; (3) It is naturally more rotation invariant. When detecting glomeruli and nuclei on pathological images, the proposed circle representation achieved superior detection performance and be more rotation-invariant, compared with the bounding box. The code has been made publicly available: https://github.com/hrlblab/CircleNet.
Keywords: anchor-free, CircleNet, detection, image analysis, pathology
I. Introduction
GLOMERULAR detection is widely used in renal pathology research for efficient and quantitative glomerular phenotyping [1]. The glomerulus is the basic functional unit of the kidney to filter excess fluid and waste products from blood into urine. Therefore, precisely detecting and phenotyping glomeruli is critical for investigating various kidney diseases [2].
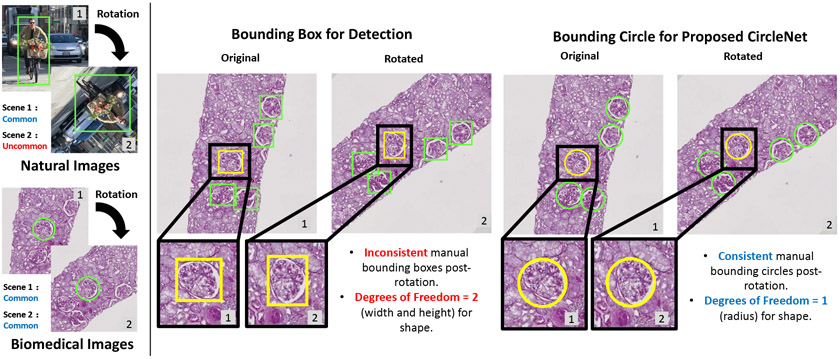
While bounding box representation from the computer vision community is commonly utilized for detecting ball-shaped biomedical objects such as glomeruli [3]-[6], such representation is not necessarily optimized (Fig. 1). Certain biomedical images (e.g., microscopy imaging), unlike natural images, can be obtained and displayed at any angle of rotation of the same tissue. As a result, the traditional bounding box might yield inferior performance for representing such ball-shaped biomedical objects.
Fig. 1.
This figure showcases a comparison of the rectangular bounding box and CircleNet. The left panel shows how, unlike natural images, biomedical images can be commonly obtained with any angle of rotation. The right panel displays how the bounding box is not optimized for ball-shaped biomedical objects. The proposed CircleNet method produces a more consistent representation while requiring fewer degrees of freedom.
In this paper, we propose a simple circle representation for medical object detection and introduce CircleNet, an anchor-free detection framework based on the circle representation. After detecting the center location of the glomerulus, the proposed “bounding circle” requires one (radius) degree of freedom (DoF), while the bounding box needs two (height and width) DoF. The contributions of this study are in three key areas:
Circle Representation We propose a simple circle representation for medical object detection that requires less DoF than the bounding box. We also introduce circle intersection over union (cIOU) as a metric for circle representation.
Optimized Medical Object Detection To the best of our knowledge, CircleNet is the first anchor-free approach with optimized circle representation for detecting ball-shaped biomedical objects.
Superior Detection and Rotation Consistency Our proposed method, CircleNet, achieves superior detection performance and better rotation consistency compared to the bounding box. As demonstrated in Fig. 1, the tissue samples can be scanned with any arbitrary angles using WSI. Therefore, the better rotation consistency might lead to higher robustness for detecting the same objects from the same tissue, which would eventually improve the reproducibility of the image analytics.
To evaluate the performance of the proposed CircleNet, three experiments were conducted. The first experiment measured its performance in detecting glomeruli on renal biopsies. The second experiment evaluated its performance in detecting nuclei on tissue samples. Lastly, the third experiment demonstrated the rotation consistency of the proposed CircleNet.
Difference from Conference Version:
This work extends our previous conference paper [7] with the following new efforts: A more comprehensive introduction, related works, and detailed data description are provided in this manuscript. The methodology is presented with more detailed mathematical derivations, experimental design, and hyper-parameter settings. To evaluate the generalizability of the proposed CircleNet beyond the glomerular detection, a new experiment on a different application (detection of nuclei) using a publicly available dataset [8], [9] is provided.
II. Related Works
A. Object Detection
Recent object detection methods based on convolutional neural networks (CNN) are divided into anchor-based and anchor-free object detectors.
1). Anchor-Based Methods:
Anchor-based object detection can be further categorized to two-stage [10], [11] and one-stage methods [12], [13].
Two-stage methods usually perform detection in two steps: (i) region proposal and (ii) object classification and bounding box regression. Faster-RCNN [11] lays the groundwork for two-stage anchor-based detectors. Faster-RCNN [11] consists of a region proposal network (RPN) and a prediction network (R-CNN) [14], [15] that detects objects within each region. To tackle the challenge of proposing regions for objects of varying size and aspect ratios within the RPN, reference boxes called anchors were associated with a scale and aspect ratio. As the RPN checked each sliding window location, k proposals were parameterized corresponding to the k anchors. After Faster-RCNN, many algorithms were proposed to improve its performance, including different architectures [10], [16]-[18], attention and context mechanism [19]-[22], different training strategy and loss function [23]-[26], better proposal and balance [27], [28], feature fusion [29], and multi-scale training and testing [30], [31]. While these two-stage detectors produce state-of-the-art results, they are often structurally complex and slower to inference.
One-stage methods eliminate the region proposal step and encapsulate all computations in a single network. With the introduction of SSD [12], these types of methods have attracted academic attention for their high computational efficiency. SSD directly predicts object category and bounding box offsets by distributing the anchor boxes on multi-scale layers within a CNN. After SSD, various improvements have been suggested including redesigning the architecture [32], [33], combining context from different layers [34], [35], training from scratch [36], [37], introducing different loss functions [13], [38], anchor matching and refinement [39], [40], and feature enrichment and alignment [39], [41], [42]. Currently, one-stage anchor-based object detectors obtain performance very close to two-stage anchor-based detectors but at faster inference speeds.
2). Anchor-Free Methods:
Anchor-free methods remove the need for preset anchors. One approach to anchor-free detection is to localize several pre-defined or self-learned keypoints which generates the bounding boxes to detect objects (keypoint detection). CornerNet [43] detects a pair of keypoints using a single convolutional neural network: the top-left corner and bottom-right corner of a bounding box. By detecting the keypoints of the bounding box, the need for anchor boxes is eliminated. ExtremeNet [44] improves on CornerNet by detecting five keypoints: the four corners of the bounding box and the center point of the object. However, CornerNet and ExtremeNet both require a computationally combinatorial grouping stage after keypoint detection which slows down each approach. So, CenterNet [45] approaches object detection by only extracting the center point of an object, removing the need for a grouping stage.
B. Medical Object Detection
In the past, there have been many image processing methods proposed to detect biomedical objects. Historically, these methods strongly rely on human-designed imaging features such as edge detection [46]-[49], median filtering [50], Histogram of Gradients (HOG) [51]-[53], shape features [54], color-based and texture-based [55]. However, these methods are limited by the lack of completeness of these hand-crafted features and their inability to generalize.
In the last decade, deep convolutional neural network (CNN) based methods that rely on data-driven features have produced superior performance on detecting biomedical objects. Cirean et al. [56] conducted mitosis detection in breast histology images by utilizing deep max-pooling convolutional neural networks. Temerinac-Ott et al. [57] conducted glomerulus detection by integrating CNN performance on different stains. Gallego et al. [58] proposed combining detection and classification, and other researchers [59]-[63] integrated segmentation and classification.
1). Anchor-Based Methods:
Anchor-based methods, namely Faster-RCNN [11], have shown superior performance in computer vision tasks. Lo et al. [3] and Kawazoe et al. [4] applied the Faster-RCNN method to glomerulus detection which achieved state-of-the-art performance on the detection task. Mask-RCNN [64] was also adapted to detect the location of nuclei within a mask [65]. However, anchor-based methods such as Faster-RCNN [11] require anchors to be preset and refined throughout training, which typically yields lower flexibility and higher model complexity. Thus, detection methods without preset anchors resulting in simpler network design, fewer hyperparameters, and even superior performance have been the target of recent academic attention [43]-[45].
2). Anchor-Free Methods:
Anchor-free methods such as CenterNet [45] have the potential to be faster and simpler. Feng et al. [66] adapts ideas from CenterNet [45] and RetinaNet [13] to nuclei detection which achieves superior performance. However, such a method utilizes the traditional bounding box representation which is not necessarily optimized for circular biomedical objects.
III. Methods
A. Anchor Free Backbone
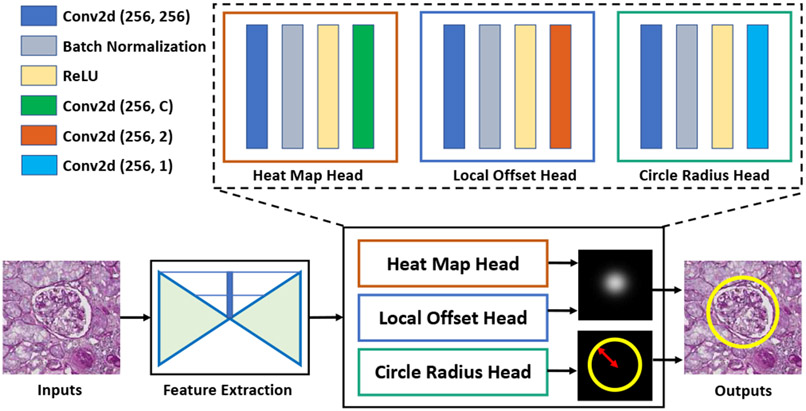
The overall framework of the proposed CircleNet is presented in Fig. 2. The network backbone is designed based on the anchor-free CenterNet implementation [45] for its high performance and simplicity. In addition, CenterNet is one of the most validated anchor-free methods. Many existing works are built upon CenterNet [67]-[69].
Fig. 2.
Overview of CircleNet. A backbone network serves as a feature extracter for the resulting three head networks. The heatmap and local offset head determines the center point of the circle while the circle radius head determines the radius of the circle.
We follow Zhou et al. to define the key variables [45]. Let I be the input image where I ∈ RW×H×3 with width W and height H. From the network, the output is a heatmap containing the center point localization of each object where C is the number of candidate classes and R is the downsampling factor of the prediction. The heatmap is expected to be 1 at the center of an object and 0 otherwise. Per convention [43], [45], ground truth of each object’s center point is splat onto a heatmap using a 2D Gaussian kernel:
| (1) |
where the x and y are the center point of the ground truth, and are the downsampled ground truth center point, and σp is the kernel standard deviation. The training loss is Lk penalty-reduced pixel-wise logistic regression with focal loss [13]:
| (2) |
where α and β are hyper-parameters to the focal loss and N is the number of keypoints [13]. We empirically set α = 2 and β = 4 experiments, following Law and Deng [43].
B. Center Point to Bounding Circle
The top n peaks are extracted from the heatmaps such that each peak’s value is greater than or equal to its 8-connected neighbors. Let be the set of n detected center points where . The keypoint location of each object are given by integer coordinates (xi, yi) from and Lk. Then, the offset is obtained from Loff. With center point and radius , the bounding circle is defined as:
| (3) |
where is the prediction of the radius for each pixel location, optimized by
| (4) |
where rk is the ground truth of the radius for each circle object k. Finally, the overall objective is
| (5) |
Referring from [45], we fix λradius = 0.1 and λoff = 1.
C. Circle IOU
To measure the similarity between two bounding boxes, () is the most popular evaluation metric in canonical object detection. The is defined as the ratio between the area of intersection and area of union. Analogously, to measure the similarity between two bounding circles, we introduce () as:
| (6) |
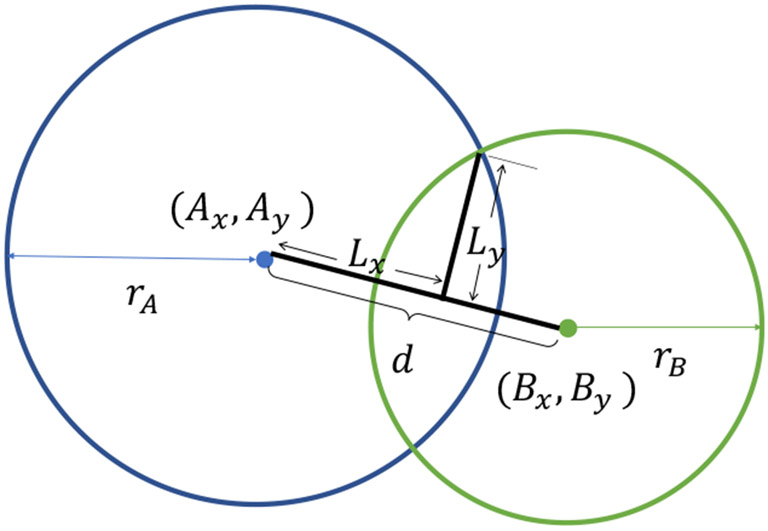
where A and B represent the two circles in Fig. 3. The center coordinates of A and B are defined as (Ax, Ay) and (Bx, By) which are calculated as:
| (7) |
| (8) |
Fig. 3.
This figure showcases the parameters used to calculate circle IOU (cIOU).
Then, the distance between the center coordinates d is defined as:
| (9) |
| (10) |
Finally, the cIOU can be calculated from the following:
| (11) |
| (12) |
IV. Experimental Design
A. Data
To obtain examples of glomeruli, whole slide images were captured from renal biopsies and annotated. The kidney tissue was routinely processed, paraffin-embedded, and 3μm thickness sections cut and stained with hematoxylin and eosin (HE), periodic acid–Schiff (PAS) or Jones. The samples were deindentified, and the studies were approved by the Institutional Review Board (IRB). 42 biopsy samples containing 704 glomeruli were used for training data, 7 biopsy samples containing 98 glomeruli for validation data, and 7 biopsy samples containing 147 glomeruli for testing data. Considering the ratio and size of a glomerulus with a patch [70], the original high-resolution (0.25 μm per pixel) whole scan images were downsampled to a lower resolution (4 μm per pixel). Then, 10 random 512 × 512 patches per glomerulus image (original image contains at least one glomerulus as determined by the ground truth) were obtained as input images. Due to the foreground-background class imbalance, at least one positive object exists in all training patches following [13]. Another rationale is from the widely used COCO dataset [71], in which only around 20 images do not have any objects given the total 328,000 images. Finally, these data formed a cohort containing 7040 training, 980 validation, and 1470 testing images.
B. Experimental Design
The implementation of CircleNet’s detection and backbone networks followed the CenterNet’s official PyTorch implementations. The COCO pre-trained model [71] was used to initialize all models. All experiments were conducted on the same workstation with an 11 GB Nvidia 1080 Ti, Ubuntu 18.04, PyTorch 0.4.1, CUDA 9.0, and CUDNN 7.1. For data augmentation, random flip, cropping, and color jitter were used. The hyperparameters were 50 epochs, a learning rate of 2.5e − 4, and an Adam optimizer to adaptively alter the learning rate. Due to memory constraints, we set the batch size to 4.
As baseline methods, Faster-RCNN [11], CornerNet [43], ExtremeNet [44], CenterNet [45] were chosen for their superior object detection performance. ResNet-50 [72], stacked Hourglass-104 [73] network and deep layer aggregation (DLA) network [74] were used as backbone networks for these different detection methods. For CircleNet, we followed the original implementation [7] and use Hourglass-104 and DLA for the backbone networks.
C. Evaluation Metrics
Mean average precision was the primary metric used to evaluate detection performance. For a given threshold IOU, average precision was obtained by calculating the area under the 101-point interpolated precision-recall curve. Then, the mean average precision (AP) is the mean of the average precision for IOU thresholds from 0.5 to 0.95 with a step size of 0.05. AP50 is the average precision with an IOU threshold at 0.5. AP75 is the average precision with an IOU threshold at 0.75. APS is the mean average precision for small objects (area less than 322). APM is the mean average precision for medium objects (area between 322 and 962). Since no objects contained an area greater than 962, the large mean average precision (APL) was not utilized.
V. Results
A. Glomerular Detection Performance
As seen in Table I, the proposed CircleNet method using the deep layer network (DLA) as a backbone outperforms the baseline methods on glomerular detection with a significant margin in all metrics except for APM. However, the proposed method still achieves the second-best performance for APM. In addition, when comparing CenterNet and CircleNet using the hourglass network (HG), the proposed CircleNet also performs better. Thus, across both backbone networks, CircleNet produces superior performance for glomerular detection.
TABLE I.
CircleNet Glomeruli Detection Performance
| Methods | Backbone | AP | AP (50) | AP (75) | AP (S) | AP (M) |
|---|---|---|---|---|---|---|
| Faster-RCNN [11] | ResNet-50 | 0.584 | 0.866 | 0.730 | 0.478 | 0.648 |
| Faster-RCNN [11] | ResNet-101 | 0.568 | 0.867 | 0.694 | 0.460 | 0.633 |
| CornerNet [43] | Hourglass-104 | 0.595 | 0.818 | 0.732 | 0.524 | 0.695 |
| ExtremeNet [44] | Hourglass-104 | 0.597 | 0.864 | 0.749 | 0.493 | 0.658 |
| CenterNet-HG [45] | Hourglass-104 | 0.574 | 0.853 | 0.708 | 0.442 | 0.649 |
| CenterNet-DLA [45] | DLA | 0.598 | 0.902 | 0.735 | 0.513 | 0.648 |
| CircleNet-HG (Ours) | Hourglass-104 | 0.615 | 0.853 | 0.750 | 0.586 | 0.656 |
| CircleNet-DLA (Ours) | DLA | 0.647 | 0.907 | 0.787 | 0.597 | 0.685 |
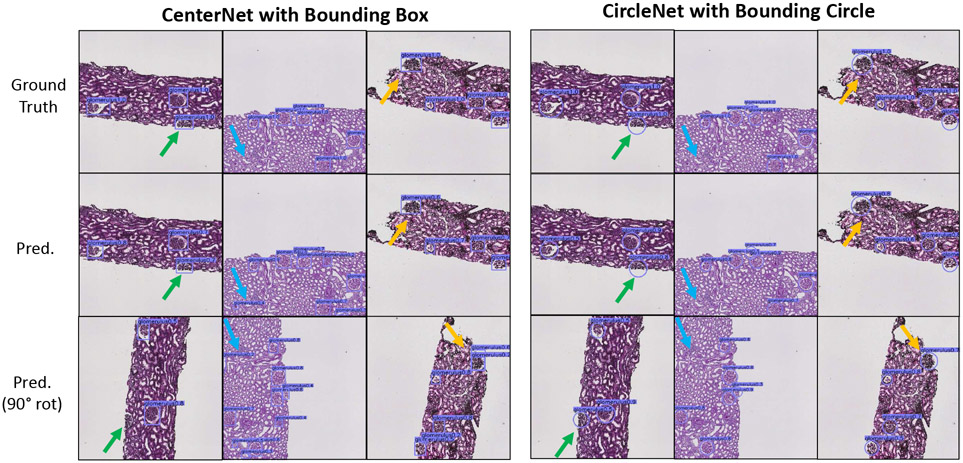
A qualitative comparison between CenterNet and CircleNet can be seen in (Fig. 4). As indicated by the arrows, CircleNet generally produces a representation more robust to rotation.
Fig. 4.
Qualitative comparison of glomerular detection results with confidence score ≥ 0.2. The confidence score was empirically selected for all experiments to balance the sensitivity and specificity.
B. Circle Representation and cIOU
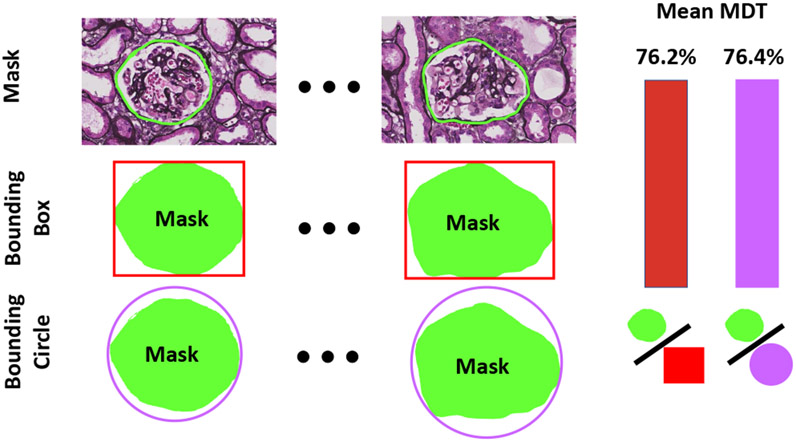
It was also investigated if the improved detection results of the bounding circle sacrificed its effectiveness for detection representation. To accomplish this, 50 glomeruli from the test dataset were manually annotated to obtain segmentation masks. Subsequently, the ratio between the mask area and bound box/circle area, called Mask Detection Ratio (MDT), were calculated for each glomerulus. As presented in the right panel of Fig. 5, the box and circle representations both have comparable mean MDT, which demonstrates the bounding circle does not sacrifice effective detection representation and contributes to the improved detection performance.
Fig. 5.
This figure showcases how the mean mask detection ratio (MDT) was calculated. The mask was originally traced on 50 randomly selected glomerulus from the testing dataset. The mean Mask Detection Ratio (MDT) was calculated from the average ratio between the mask area and bounding box/circle area. The mean MDT for both the rectangular box and circle representations were close.
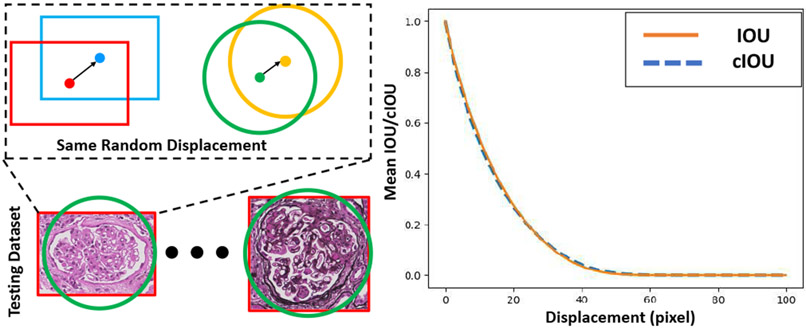
Next, we compared the performance of the IOU and cIOU as metrics for similarity since metrics were used as overlap metrics for evaluating detection performance (e.g. AP(50) and AP(75)). To measure their performance as similarity metrics, we simulated different detection results by adding random translations varying from 0 to 100 on the glomeruli in the testing dataset. To ensure a fair comparison, the same displacements were applied to each glomerulus (with bounding box and bounding circle representation). The results demonstrated in Fig. 6 show that cIOU behaves nearly the same as IOU, which validates cIOU as an overlap metric for the detection of glomeruli with the same random displacements.
Fig. 6.
A comparison of IOU and cIOU. The bounding box/circle for every glomerulus in the testing dataset was shifted a random displacement (left panel). Then, the IOU and cIOU metrics were calculated to measure the similarity between the original and shifted bounding boxes/circles (right panel).
C. Rotation Consistency
An additional advantage of the bounding circle compared to the bounding box is better rotation consistency. We evaluated the consistency of the bounding box/circle by rotating the original test images by 90 degrees rather than an arbitrary angle to avoid the impact of intensity interpolation. Through this approach, the detected box/circle on rotated images were able to be converted to the original space. Furthermore, the rotation was only applied during testing and was not used as a data augmentation technique for training all methods. We calculated the rotation consistency by dividing the number of overlapped bounding boxes/circles (IOU or cIOU > 0.5 before and after rotation) by the average number of total detected bounding boxes/circles (before and after rotation). This percentage of overlapped detection is named the “rotation consistency” ratio, where 1 means all boxes/circles overlapped while 0 means no boxes/circles overlapped. As seen in Table II, the proposed CircleNet-DLA approach achieved better rotation consistency.
TABLE II.
Comparison of the Rotation Consistency between Bounding Box and Bounding Circle on Glomerular Detection
D. Nuclei Detection Performance
To validate our proposed method on another application, CircleNet was evaluated on a dataset from the 2018 Multi-Organ Nuclei Segmentation (MoNuSeg) Challenge [8], [9].
1). Data:
The MoNuSeg challenge training/validation dataset includes 30 1000×1000 tissue images containing 21,623 hand-annotated nuclear boundaries. Each image was sampled from a separate whole slide image of H&E stained tissue at 40× magnification of several organs from The Cancer Genomic Atlas (TCGA). A new testing dataset containing 14 1000×1000 pixel images was also prepared using the same method as the training/validation data. This testing dataset contains lung and brain tissue images exclusive to the test dataset.
From the 30 1000×1000 pixel images in the training/validation dataset, 10 512× 512-pixel patches were randomly sampled from each image, generating 300 images for training/validation. Similarly, from the 14 1000×1000 testing images, 140 images were obtained for testing. These data formed a cohort containing 200 training, 100 validation, and 140 testing images.
While the original MoNuSeg training/validation dataset has relatively few images, those images contain more objects than the glomeruli dataset. Specifically, before data augmentation, the glomeruli dataset contains 802 glomeruli as compared to 21,623 nuclei in the MoNuSeg 2018 dataset. MoNuSeg 2018 is also publicly available.
2). Approach:
The implementation and hyperparameters were the same as for glomerulus detection.
3). Results:
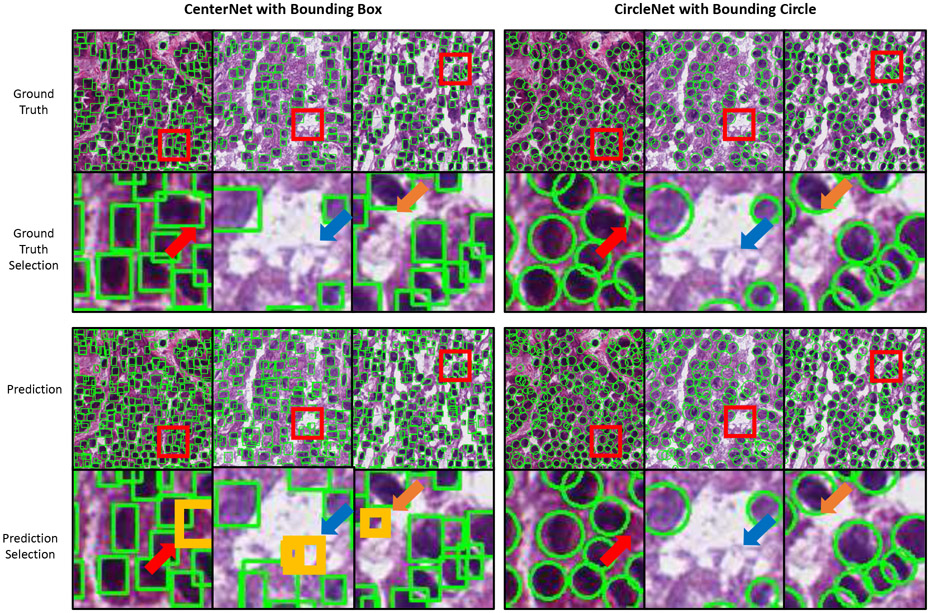
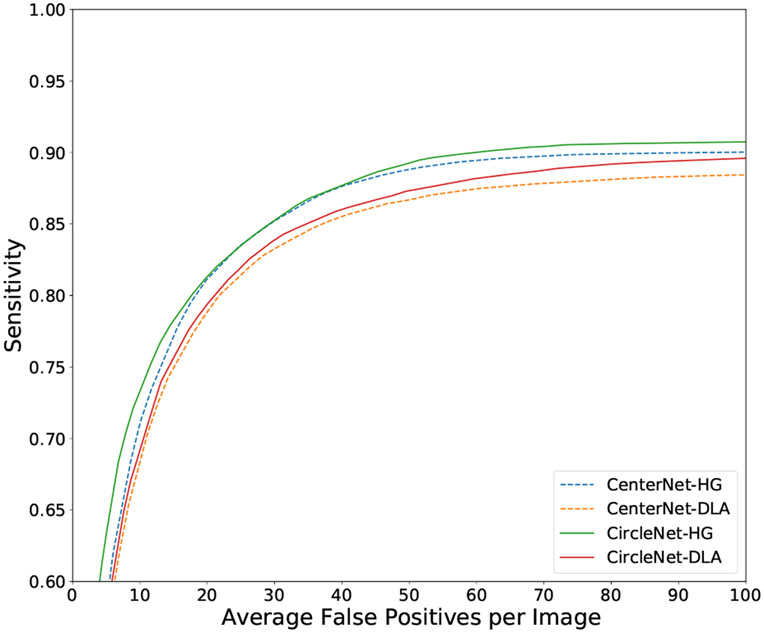
The results were evaluated using mean average precision similar to the metrics for glomerulus detection. As seen in Table III, the proposed CircleNet-HG method outperforms the baseline methods on nuclei detection with a significant margin, except for APM. Additionally, when we compare CircleNet and CenterNet using the DLA network, CircleNet produces better results. A qualitative comparison between CenterNet and CircleNet can be seen in Fig. 7. As displayed in Table IV, the proposed CircleNet-HG approach achieved better rotation consistency. Lastly, the FROC curve can be seen in Fig. 8.
TABLE III.
CircleNet MoNuSeg 2018 Detection Performance
| Methods | Backbone | AP | AP (50) | AP (75) | AP (S) | AP (M) |
|---|---|---|---|---|---|---|
| Faster-RCNN [11] | ResNet-50 | 0.416 | 0.750 | 0.421 | 0.416 | 0.383 |
| Faster-RCNN [11] | ResNet-101 | 0.409 | 0.775 | 0.372 | 0.410 | 0.339 |
| CornerNet [43] | HG-104 | 0.244 | 0.523 | 0.181 | 0.328 | 0.064 |
| CenterNet-HG [45] | HG-104 | 0.447 | 0.846 | 0.427 | 0.451 | 0.395 |
| CenterNet-DLA [45] | DLA | 0.399 | 0.826 | 0.315 | 0.403 | 0.338 |
| CircleNet-HG (Ours) | Hourglass-104 | 0.487 | 0.856 | 0.509 | 0.499 | 0.337 |
| CircleNet-DLA (Ours) | DLA | 0.486 | 0.855 | 0.516 | 0.499 | 0.305 |
Fig. 7.
Qualitative comparison of nuclei detection results with confidence score ≥ 0.5. The confidence score was empirically selected for all experiments to balance the sensitivity and specificity. Within the orginal images, each red box indicates the location of each selection. Within each selection, a yellow box or circle indicates inconsistent detections. Arrows with the same color indicate the area of inconsistent detection across similar images.
TABLE IV.
Comparison of the Rotation Consistency between Bounding Box and Bounding Circle on MoNuSeg 2018
Fig. 8.
FROC curve of various methods on the test set of the nuclei dataset.
VI. Discussion
In this study, we propose an anchor-free method, CircleNet, optimized for the detection of biomedical ball-shaped objects. Instead of using a bounding box representation, CircleNet uses a circle representation which is shown to offer superior detection performance and rotation consistency. The associated cIOU evaluation metric is shown to act similarly to IOU for bounding boxes. Thus, the results support that the circle representation indeed is more effective while requiring fewer degrees of freedom.
As seen in Table II and IV, the proposed circle representation achieved better rotation consistency. one explanation for this result is that while length and width metrics are sensitive to rotation, radii are naturally more spatially invariant metrics.
Although only pathological image analysis is presented, we believe that circle representation is generalizable in radiology. Work by Luo et al. [75] has extended the circle representation into a sphere representation for lung nodule detection in 3D Computer Tomography scans. Compared with existing anchor-based and anchor-free methods, their anchor-free framework achieves superior performance. In addition, the sphere representation is verified to produce higher detection accuracy on long nodules than the traditional bounding box representation. overall, their results support the potential generalizability of the circle representation within medical object detection.
One key limitation is that the circle representation may not be optimal for other types of shapes such as a stick-like shape or oval shape. Specifically, as seen in Table IV, CircleNet performs worse than baseline methods for APM which covers 2% of the objects in the testing dataset. Upon further analysis, larger nuclei tend to be more elongated and elliptical-like, unlike glomeruli which generally remain circular. An interesting potential improvement could be to add a second degree of freedom to the circle, transforming the circle into an ellipse. To define an ellipse representation, the network would predict the length of each axis within the ellipse in addition to the center point. In comparison to the circle representation, the ellipse representation may more effectively represent objects that are stick-like in shape.
While the circle representation achieves superior results within an anchor-free framework, a similar increase in performance may be obtained when adapting circle representation for anchor-based methods. The fact that the circle representation requires fewer degrees of freedom compared to the box representation could reduce the number of anchors are used. Instead of having bounding boxes of varying sizes and aspect ratios, an anchor-based approach with circle representation would only require bounding circles of varying radii. Further, having fewer anchors would reduce runtime and complexity. Overall, anchor-based methods may also benefit from using circle representations.
A promising application of CircleNet is within a detect-then-segment approach for the instance segmentation network of ball-shaped objects for Whole Slide Imaging (WSI). For instance, a single glomerulus from a 40× WSI can have a resolution of more than 1000×1000 pixels. When using a standard segmentation approach like Mask-RCNN [64], the corresponding feature maps are downsampled to 28×28-pixel resolution which loses a substantial amount of information about the object. Therefore, applying CircleNet within a detect-then-segment approach may achieve superior segmentation performance for high-resolution WSI.
VII. Conclusion
In this paper, we propose CircleNet, an anchor-free detection framework. The CircleNet method is optimized for ball-shaped biomedical objects, offering superior glomeruli and nuclei detection performance and rotation consistency. The circle representation and the cIOU evaluation metric were also comprehensively evaluated. The results show that, for detecting glomeruli and nuclei, the circle representation does not sacrifice effectiveness despite having fewer degrees of freedom compared with the traditional bounding box representation.
Acknowledgment
E. H. Nguyen thanks Jonathan Ehrman for hardware support and Rose Rasty for editing and proofreading.
This work was supported in part by NIH NIDDK DK56942(ABF) and NSF CAREER 1452485 (Landman) for support.
Contributor Information
Ethan H. Nguyen, Department of Electrical Engineering and Computer Science, Vanderbilt University, Nashville, TN 37235 USA.
Haichun Yang, Department of Pathology, Vanderbilt University Medical Center, Nashville, TN, 37215, USA..
Ruining Deng, Department of Electrical Engineering and Computer Science, Vanderbilt University, Nashville, TN 37235 USA..
Yuzhe Lu, Department of Electrical Engineering and Computer Science, Vanderbilt University, Nashville, TN 37235 USA..
Zheyu Zhu, Department of Electrical Engineering and Computer Science, Vanderbilt University, Nashville, TN 37235 USA..
Joseph T. Roland, Department of Pathology, Vanderbilt University Medical Center, Nashville, TN, 37215, USA.
Le Lu, PAII Inc., Bethesda MD 20817, USA..
Bennett A. Landman, Department of Electrical Engineering and Computer Science, Vanderbilt University, Nashville, TN 37235 USA..
Agnes B. Fogo, Department of Pathology, Vanderbilt University Medical Center, Nashville, TN, 37215, USA.
Yuankai Huo, Department of Electrical Engineering and Computer Science, Vanderbilt University, Nashville, TN 37235 USA..
References
- [1].Huo Y, Deng R, Liu Q, Fogo AB, and Yang H, “Ai applications in renal pathology,” Kidney International, 2021. [DOI] [PMC free article] [PubMed] [Google Scholar]
- [2].D’Agati VD and Mengel M, “The rise of renal pathology in nephrology: structure illuminates function,” American journal of kidney diseases, vol. 61, no. 6, pp. 1016–1025, 2013. [DOI] [PubMed] [Google Scholar]
- [3].Lo Y-C, Juang C-F, Chung I-F, Guo S-N, Huang M-L, Wen M-C, Lin C-J, and Lin H-Y, “Glomerulus detection on light microscopic images of renal pathology with the faster r-cnn,” in International Conference on Neural Information Processing. Springer, 2018, pp. 369–377. [Google Scholar]
- [4].Kawazoe Y, Shimamoto K, Yamaguchi R, Shintani-Domoto Y, Uozaki H, Fukayama M, and Ohe K, “Faster r-cnn-based glomerular detection in multistained human whole slide images,” Journal of Imaging, vol. 4, no. 7, p. 91, 2018. [Google Scholar]
- [5].Heckenauer R, Weber J, Wemmert C, Feuerhake F, Hassenforder M, Muller P-A, and Forestier G, “Real-time detection of glomeruli in renal pathology,” in 2020 IEEE 33rd International Symposium on Computer-Based Medical Systems (CBMS). IEEE, 2020, pp. 350–355. [Google Scholar]
- [6].Rehem JMC, dos Santos WLC, Duarte AA, de Oliveira LR, and Angelo MF, “Automatic glomerulus detection in renal histological images,” in Medical Imaging 2021: Digital Pathology, vol. 11603. International Society for Optics and Photonics, 2021, p. 116030K. [Google Scholar]
- [7].Yang H, Deng R, Lu Y, Zhu Z, Chen Y, Roland JT, Lu L, Landman BA, Fogo AB, and Huo Y, “Circlenet: Anchor-free glomerulus detection with circle representation,” in International Conference on Medical Image Computing and Computer-Assisted Intervention. Springer, 2020, pp. 35–44. [DOI] [PMC free article] [PubMed] [Google Scholar]
- [8].Kumar N, Verma R, Sharma S, Bhargava S, Vahadane A, and Sethi A, “A dataset and a technique for generalized nuclear segmentation for computational pathology,” IEEE transactions on medical imaging, vol. 36, no. 7, pp. 1550–1560, 2017. [DOI] [PubMed] [Google Scholar]
- [9].Kumar N, Verma R, Anand D, Zhou Y, Onder OF, Tsougenis E, Chen H, Heng P-A, Li J, Hu Z et al. , “A multi-organ nucleus segmentation challenge,” IEEE transactions on medical imaging, vol. 39, no. 5, pp. 1380–1391, 2019. [DOI] [PMC free article] [PubMed] [Google Scholar]
- [10].Dai J, Li Y, He K, and Sun J, “R-fcn: Object detection via region-based fully convolutional networks,” arXiv preprint arXiv:1605.06409, 2016. [Google Scholar]
- [11].Ren S, He K, Girshick R, and Sun J, “Faster r-cnn: Towards real-time object detection with region proposal networks,” in Advances in neural information processing systems, 2015, pp. 91–99. [DOI] [PubMed] [Google Scholar]
- [12].Liu W, Anguelov D, Erhan D, Szegedy C, Reed S, Fu C-Y, and Berg AC, “Ssd: Single shot multibox detector,” in European conference on computer vision. Springer, 2016, pp. 21–37. [Google Scholar]
- [13].Lin T-Y, Goyal P, Girshick R, He K, and Dollár P, “Focal loss for dense object detection,” in Proceedings of the IEEE international conference on computer vision, 2017, pp. 2980–2988. [Google Scholar]
- [14].Girshick R, Donahue J, Darrell T, and Malik J, “Rich feature hierarchies for accurate object detection and semantic segmentation,” in Proceedings of the IEEE conference on computer vision and pattern recognition, 2014, pp. 580–587. [Google Scholar]
- [15].Girshick R, “Fast r-cnn,” in Proceedings of the IEEE international conference on computer vision, 2015, pp. 1440–1448. [Google Scholar]
- [16].Cai Z, Fan Q, Feris RS, and Vasconcelos N, “A unified multi-scale deep convolutional neural network for fast object detection,” in European conference on computer vision. Springer, 2016, pp. 354–370. [Google Scholar]
- [17].Cai Z and Vasconcelos N, “Cascade r-cnn: Delving into high quality object detection,” in Proceedings of the IEEE conference on computer vision and pattern recognition, 2018, pp. 6154–6162. [Google Scholar]
- [18].Lee H, Eum S, and Kwon H, “Me r-cnn: Multi-expert r-cnn for object detection,” IEEE Transactions on Image Processing, vol. 29, pp. 1030–1044, 2019. [DOI] [PubMed] [Google Scholar]
- [19].Bell S, Zitnick CL, Bala K, and Girshick R, “Inside-outside net: Detecting objects in context with skip pooling and recurrent neural networks,” in Proceedings of the IEEE conference on computer vision and pattern recognition, 2016, pp. 2874–2883. [Google Scholar]
- [20].Shrivastava A and Gupta A, “Contextual priming and feedback for faster r-cnn,” in European conference on computer vision. Springer, 2016, pp. 330–348. [Google Scholar]
- [21].Liu Y, Wang R, Shan S, and Chen X, “Structure inference net: Object detection using scene-level context and instance-level relationships,” in Proceedings of the IEEE conference on computer vision and pattern recognition, 2018, pp. 6985–6994. [Google Scholar]
- [22].Chen Z, Huang S, and Tao D, “Context refinement for object detection,” in Proceedings of the European conference on computer vision (ECCV), 2018, pp. 71–86. [Google Scholar]
- [23].Najibi M, Rastegari M, and Davis LS, “G-cnn: an iterative grid based object detector,” in Proceedings of the IEEE conference on computer vision and pattern recognition, 2016, pp. 2369–2377. [Google Scholar]
- [24].Shrivastava A, Gupta A, and Girshick R, “Training region-based object detectors with online hard example mining,” in Proceedings of the IEEE conference on computer vision and pattern recognition, 2016, pp. 761–769. [Google Scholar]
- [25].Wang X, Shrivastava A, and Gupta A, “A-fast-rcnn: Hard positive generation via adversary for object detection,” in Proceedings of the IEEE conference on computer vision and pattern recognition, 2017, pp. 2606–2615. [Google Scholar]
- [26].He Y, Zhu C, Wang J, Savvides M, and Zhang X, “Bounding box regression with uncertainty for accurate object detection,” in Proceedings of the IEEE/CVF Conference on Computer Vision and Pattern Recognition, 2019, pp. 2888–2897. [Google Scholar]
- [27].Tan Z, Nie X, Qian Q, Li N, and Li H, “Learning to rank proposals for object detection,” in Proceedings of the IEEE/CVF International Conference on Computer Vision, 2019, pp. 8273–8281. [Google Scholar]
- [28].Pang J, Chen K, Shi J, Feng H, Ouyang W, and Lin D, “Libra r-cnn: Towards balanced learning for object detection,” in Proceedings of the IEEE/CVF Conference on Computer Vision and Pattern Recognition, 2019, pp. 821–830. [Google Scholar]
- [29].Lin T-Y, Dollár P, Girshick R, He K, Hariharan B, and Belongie S, “Feature pyramid networks for object detection,” in Proceedings of the IEEE conference on computer vision and pattern recognition, 2017, pp. 2117–2125. [Google Scholar]
- [30].Singh B and Davis LS, “An analysis of scale invariance in object detection snip,” in Proceedings of the IEEE conference on computer vision and pattern recognition, 2018, pp. 3578–3587. [Google Scholar]
- [31].Najibi M, Singh B, and Davis LS, “Autofocus: Efficient multi-scale inference,” in Proceedings of the IEEE/CVF International Conference on Computer Vision, 2019, pp. 9745–9755. [Google Scholar]
- [32].Kim S-W, Kook H-K, Sun J-Y, Kang M-C, and Ko S-J, “Parallel feature pyramid network for object detection,” in Proceedings of the European Conference on Computer Vision (ECCV), 2018, pp. 234–250. [Google Scholar]
- [33].Kong T, Sun F, Tan C, Liu H, and Huang W, “Deep feature pyramid reconfiguration for object detection,” in Proceedings of the European conference on computer vision (ECCV), 2018, pp. 169–185. [Google Scholar]
- [34].Kong T, Sun F, Yao A, Liu H, Lu M, and Chen Y, “Ron: Reverse connection with objectness prior networks for object detection,” in Proceedings of the IEEE conference on computer vision and pattern recognition, 2017, pp. 5936–5944. [Google Scholar]
- [35].Fu C-Y, Liu W, Ranga A, Tyagi A, and Berg AC, “Dssd: Deconvolutional single shot detector,” arXiv preprint arXiv:1701.06659, 2017. [Google Scholar]
- [36].Shen Z, Liu Z, Li J, Jiang Y-G, Chen Y, and Xue X, “Dsod: Learning deeply supervised object detectors from scratch,” in Proceedings of the IEEE international conference on computer vision, 2017, pp. 1919–1927. [Google Scholar]
- [37].Zhu R, Zhang S, Wang X, Wen L, Shi H, Bo L, and Mei T, “Scratchdet: Training single-shot object detectors from scratch,” in Proceedings of the IEEE/CVF Conference on Computer Vision and Pattern Recognition, 2019, pp. 2268–2277. [Google Scholar]
- [38].Chen K, Li J, Lin W, See J, Wang J, Duan L, Chen Z, He C, and Zou J, “Towards accurate one-stage object detection with ap-loss,” in Proceedings of the IEEE/CVF Conference on Computer Vision and Pattern Recognition, 2019, pp. 5119–5127. [Google Scholar]
- [39].Zhang Z, Qiao S, Xie C, Shen W, Wang B, and Yuille AL, “Single-shot object detection with enriched semantics,” in Proceedings of the IEEE conference on computer vision and pattern recognition, 2018, pp. 5813–5821. [Google Scholar]
- [40].Zhang S, Chi C, Yao Y, Lei Z, and Li SZ, “Bridging the gap between anchor-based and anchor-free detection via adaptive training sample selection,” in Proceedings of the IEEE/CVF Conference on Computer Vision and Pattern Recognition, 2020, pp. 9759–9768. [Google Scholar]
- [41].Liu S, Huang D et al. , “Receptive field block net for accurate and fast object detection,” in Proceedings of the European Conference on Computer Vision (ECCV), 2018, pp. 385–400. [Google Scholar]
- [42].Wang T, Anwer RM, Cholakkal H, Khan FS, Pang Y, and Shao L, “Learning rich features at high-speed for single-shot object detection,” in Proceedings of the IEEE/CVF International Conference on Computer Vision, 2019, pp. 1971–1980. [Google Scholar]
- [43].Law H and Deng J, “Cornernet: Detecting objects as paired keypoints,” in Proceedings of the European Conference on Computer Vision (ECCV), 2018, pp. 734–750. [Google Scholar]
- [44].Zhou X, Zhuo J, and Krahenbuhl P, “Bottom-up object detection by grouping extreme and center points,” in Proceedings of the IEEE Conference on Computer Vision and Pattern Recognition, 2019, pp. 850–859. [Google Scholar]
- [45].Zhou X, Wang D, and Krähenbühl P, “Objects as points,” arXiv preprint arXiv:1904.07850, 2019. [Google Scholar]
- [46].Ma J, Zhang J, and Hu J, “Glomerulus extraction by using genetic algorithm for edge patching,” in 2009 IEEE Congress on Evolutionary Computation. IEEE, 2009, pp. 2474–2479. [Google Scholar]
- [47].Jung C and Kim C, “Segmenting clustered nuclei using h-minima transform-based marker extraction and contour parameterization,” IEEE transactions on biomedical engineering, vol. 57, no. 10, pp. 2600–2604, 2010. [DOI] [PubMed] [Google Scholar]
- [48].Esmaeilsabzali H, Sakaki K, Dechev N, Burke RD, and Park EJ, “Machine vision-based localization of nucleic and cytoplasmic injection sites on low-contrast adherent cells,” Medical & biological engineering & computing, vol. 50, no. 1, pp. 11–21, 2012. [DOI] [PubMed] [Google Scholar]
- [49].Filipczuk P, Fevens T, Krzyżak A, and Monczak R, “Computer-aided breast cancer diagnosis based on the analysis of cytological images of fine needle biopsies,” IEEE transactions on medical imaging, vol. 32, no. 12, pp. 2169–2178, 2013. [DOI] [PubMed] [Google Scholar]
- [50].Kotyk T, Dey N, Ashour AS, Balas-Timar D, Chakraborty S, Ashour AS, and Tavares JMR, “Measurement of glomerulus diameter and bowman’s space width of renal albino rats,” Computer methods and programs in biomedicine, vol. 126, pp. 143–153, 2016. [DOI] [PubMed] [Google Scholar]
- [51].Kakimoto T, Okada K, Hirohashi Y, Relator R, Kawai M, Iguchi T, Fujitaka K, Nishio M, Kato T, Fukunari A et al. , “Automated image analysis of a glomerular injury marker desmin in spontaneously diabetic torii rats treated with losartan.” The Journal of endocrinology, vol. 222, no. 1, p. 43, 2014. [DOI] [PubMed] [Google Scholar]
- [52].Kakimoto T, Okada K, Fujitaka K, Nishio M, Kato T, Fukunari A, and Utsumi H, “Quantitative analysis of markers of podocyte injury in the rat puromycin aminonucleoside nephropathy model,” Experimental and Toxicologic Pathology, vol. 67, no. 2, pp. 171–177, 2015. [DOI] [PubMed] [Google Scholar]
- [53].Kato T, Relator R, Ngouv H, Hirohashi Y, Takaki O, Kakimoto T, and Okada K, “Segmental hog: new descriptor for glomerulus detection in kidney microscopy image,” Bmc Bioinformatics, vol. 16, no. 1, p. 316, 2015. [DOI] [PMC free article] [PubMed] [Google Scholar]
- [54].Marée R, Dallongeville S, Olivo-Marin J-C, and Meas-Yedid V, “An approach for detection of glomeruli in multisite digital pathology,” in 2016 IEEE 13th International Symposium on Biomedical Imaging (ISBI). IEEE, 2016, pp. 1033–1036. [Google Scholar]
- [55].Ginley B, Tomaszewski JE, Yacoub R, Chen F, and Sarder P, “Unsupervised labeling of glomerular boundaries using gabor filters and statistical testing in renal histology,” Journal of Medical Imaging, vol. 4, no. 2, p. 021102, 2017. [DOI] [PMC free article] [PubMed] [Google Scholar]
- [56].Cireşan DC, Giusti A, Gambardella LM, and Schmidhuber J, “Mitosis detection in breast cancer histology images with deep neural networks,” in International conference on medical image computing and computer-assisted intervention. Springer, 2013, pp. 411–418. [DOI] [PubMed] [Google Scholar]
- [57].Temerinac-Ott M, Forestier G, Schmitz J, Hermsen M, Bräsen J, Feuerhake F, and Wemmert C, “Detection of glomeruli in renal pathology by mutual comparison of multiple staining modalities,” in Proceedings of the 10th International Symposium on Image and Signal Processing and Analysis. IEEE, 2017, pp. 19–24. [Google Scholar]
- [58].Gallego J, Pedraza A, Lopez S, Steiner G, Gonzalez L, Laurinavicius A, and Bueno G, “Glomerulus classification and detection based on convolutional neural networks,” Journal of Imaging, vol. 4, no. 1, p. 20, 2018. [Google Scholar]
- [59].Kannan S, Morgan LA, Liang B, Cheung MG, Lin CQ, Mun D, Nader RG, Belghasem ME, Henderson JM, Francis JM et al. , “Segmentation of glomeruli within trichrome images using deep learning,” Kidney international reports, vol. 4, no. 7, pp. 955–962, 2019. [DOI] [PMC free article] [PubMed] [Google Scholar]
- [60].Gadermayr M, Dombrowski A-K, Klinkhammer BM, Boor P, and Merhof D, “Cnn cascades for segmenting whole slide images of the kidney,” arXiv preprint arXiv:1708.00251, 2017. [Google Scholar]
- [61].Ginley B, Lutnick B, Jen K-Y, Fogo AB, Jain S, Rosenberg A, Walavalkar V, Wilding G, Tomaszewski JE, Yacoub R et al. , “Computational segmentation and classification of diabetic glomerulosclerosis,” Journal of the American Society of Nephrology, vol. 30, no. 10, pp. 1953–1967, 2019. [DOI] [PMC free article] [PubMed] [Google Scholar]
- [62].Bueno G, Fernandez-Carrobles MM, Gonzalez-Lopez L, and Deniz O, “Glomerulosclerosis identification in whole slide images using semantic segmentation,” Computer methods and programs in biomedicine, vol. 184, p. 105273, 2020. [DOI] [PubMed] [Google Scholar]
- [63].Govind D, Ginley B, Lutnick B, Tomaszewski JE, and Sarder P, “Glomerular detection and segmentation from multimodal microscopy images using a butterworth band-pass filter,” in Medical Imaging 2018: Digital Pathology, vol. 10581. International Society for Optics and Photonics, 2018, p. 1058114. [Google Scholar]
- [64].He K, Gkioxari G, Dollár P, and Girshick R, “Mask r-cnn,” in Proceedings of the IEEE international conference on computer vision, 2017, pp. 2961–2969. [Google Scholar]
- [65].Johnson JW, “Adapting mask-rcnn for automatic nucleus segmentation,” arXiv preprint arXiv:1805.00500, 2018. [Google Scholar]
- [66].Feng X, Duan L, and Chen J, “An automated method with anchor-free detection and u-shaped segmentation for nuclei instance segmentation,” in Proceedings of the 2nd ACM International Conference on Multimedia in Asia, 2021, pp. 1–6. [Google Scholar]
- [67].Peng S, Jiang W, Pi H, Li X, Bao H, and Zhou X, “Deep snake for real-time instance segmentation,” in Proceedings of the IEEE/CVF Conference on Computer Vision and Pattern Recognition, 2020, pp. 8533–8542. [Google Scholar]
- [68].Zhou X, Koltun V, and Krähenbühl P, “Tracking objects as points,” in European Conference on Computer Vision. Springer, 2020, pp. 474–490. [Google Scholar]
- [69].Li P, Zhao H, Liu P, and Cao F, “Rtm3d: Real-time monocular 3d detection from object keypoints for autonomous driving,” in Computer Vision–ECCV 2020: 16th European Conference, Glasgow, UK, August 23–28, 2020, Proceedings, Part III 16. Springer, 2020, pp. 644–660. [Google Scholar]
- [70].Puelles VG, Hoy WE, Hughson MD, Diouf B, Douglas-Denton RN, and Bertram JF, “Glomerular number and size variability and risk for kidney disease,” Current opinion in nephrology and hypertension, vol. 20, no. 1, pp. 7–15, 2011. [DOI] [PubMed] [Google Scholar]
- [71].Lin T-Y, Maire M, Belongie S, Hays J, Perona P, Ramanan D, Dollár P, and Zitnick CL, “Microsoft coco: Common objects in context,” in European conference on computer vision. Springer, 2014, pp. 740–755. [Google Scholar]
- [72].He K, Zhang X, Ren S, and Sun J, “Deep residual learning for image recognition,” in Proceedings of the IEEE conference on computer vision and pattern recognition, 2016, pp. 770–778. [Google Scholar]
- [73].Newell A, Yang K, and Deng J, “Stacked hourglass networks for human pose estimation,” in European conference on computer vision. Springer, 2016, pp. 483–499. [Google Scholar]
- [74].Yu F, Wang D, Shelhamer E, and Darrell T, “Deep layer aggregation,” in Proceedings of the IEEE conference on computer vision and pattern recognition, 2018, pp. 2403–2412. [Google Scholar]
- [75].Luo X, Song T, Wang G, Chen J, Chen Y, Li K, Metaxas D, and Zhang S, “Scpm-net: An anchor-free 3d lung nodule detection network using sphere representation and center points matching,” arXiv preprint arXiv:2104.05215, 2021. [DOI] [PubMed] [Google Scholar]


