Abstract
DNA methylation is associated with transcriptional repression, genomic imprinting, stem cell differentiation, embryonic development, and inflammation. Aberrant DNA methylation can indicate disease states, including cancer and neurological disorders. Therefore, the prevalence and location of 5-methylcytosine (5mC) in the human genome is a topic of interest. Whole-genome bisulfite sequencing (WGBS) is a high-throughput method for analyzing DNA methylation. This technique involves library preparation, alignment, and quality control. Advancements in epigenetic technology have led to an increase in DNA methylation studies. This review compares the detailed experimental methodology of WGBS using accessible and up-to-date analysis tools. Practical codes for WGBS data processing are included as a general guide to assist progress in DNA methylation studies through a comprehensive case study.
Keywords: DNA methylation, whole genome bisulfite sequencing, library preparation methods, alignment algorithm comparison, methylation data analysis pipeline
Graphical Abstract
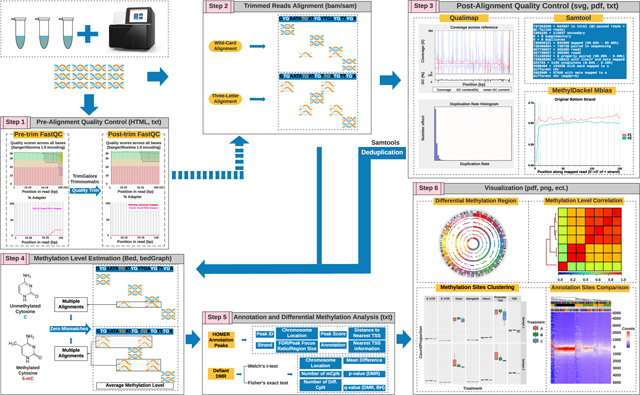
DNA methylation is an epigenetic mechanism controlling gene expression. Aberrant DNA methylation can indicate disease states, including cancer. This review analyzes the common methods used for studying DNA methylation. It compares the detailed experimental methodology of Whole-genome bisulfite sequencing (WGBS) using accessible and up-to-date analysis tools. It provided a step-by-step case study to guide new researchers in chromosomal aberrations research.
1. Introduction
DNA methylation is the classic epigenetic mechanism involving the addition of a methyl group onto a nitrogenous base.[1] While both cytosine and adenine can be targeted, cytosine methylation involving a methyl group binding to the fifth carbon of cytosine to form 5-methylcytosine (5mC) is pervasive in mammalian genomes.[2] It is most often found at symmetrical CpG dinucleotides, and ≈70–80% of CpG sites in the mammalian genome are methylated in most somatic tissues.[3] DNA methylation is closely associated with transcriptional repression, genomic imprinting, stem cell differentiation, embryonic development, and inflammation.[4] Moreover, DNA methylation aberrations are associated with cancers, neurological disorders, and several other diseases leading to extensive studies on the prevalence and location of 5mC in the human genome.[5–7] 5mC analysis may be detected using sodium bisulfite treatment of DNA sequences since this chemical selectively converts unmethylated cytosine to uracil while 5mC is unaffected.[8]
Epigenetics has matured into a rapidly expanding and technologically diverse discipline in recent decades. Moreover, the inception of massively parallel next-generation sequencing (NGS) methods in the early 2000s dramatically increased accessibility and efficiency, which spurred the development of bisulfite-based technologies. Advances in bisulfite sequencing have expanded methylation research from selected regions to whole-genome bisulfite sequencing (WGBS) [9]. Recently, novel sequencing protocols, such as the oxidative bisulfite conversion (TruMethyl oxBS) [10], enzyme-based conversion (EM-seq) [11], and target enrichment-based bisulfite conversion (Illumina EPIC Capture) [12], have further advanced methylation discovery.
WGBS consists of three steps: library preparation, sequencing and alignment, and quality control. The fundamental step is library preparation involving the bisulfite transformation reaction of unmethylated cytosine to uracil. The treated DNA is then sequenced using an NGS platform to produce numerous short reads [13]. The final step involves processing raw reads by various bioinformatics methods to remove poor quality data and downstream analysis to explore the biological processes. This method presents the current gold standard for DNA methylation assessment. However, dissimilar protocols based on different library preparation and sequencing analysis methods introduce biases by causing discrepancies in coverage depth, read quality, duplication rates, mapping efficiency, and methylation estimation [14, 15]. The expansion of available methodologies makes the analysis even less user-friendly for WGBS novices. Consequently, a beginner-friendly WGBS guide and hands-on data analysis guide are necessary. In this review, we highlight the crucial steps in WGBS, summarize the accessible and up-to-date analysis tools, compare the alignment algorithms, and share practical codes for data processing that will benefit studies on DNA methylation.
2. Library Preparation of Whole Genome Bisulfite Sequencing
Sequencing library preparation in WGBS involves attaching adapters to a pool of DNA fragments [16]. The general workflow consists of three essential steps: sodium bisulfite treatment conversion, adapter attachment to the fragment extremities, and sequencing library amplification by PCR-based methods. The library preparation protocols are categorized as pre-bisulfite and post-bisulfite depending on the priority of adapter ligation and indexing. The well-established pre-bisulfite library preparation method was applied to methylome elucidation of species to clarify the evolutionary analysis in diverse branches of the eukaryotic phylogenetic tree [17–20]. Despite the broad and powerful translational application, a crucial drawback of the pre-bisulfite protocols is the large quantity of starting DNA input required (5 mg), which hinders the study of quantity-limited biological samples, such as embryonic stem cells and cancer pathologic tissue. This is mainly due to the pre-bisulfite-mediated effect causing fragmentation leading to significant decreases in the usable full-length sample material. Furthermore, the unmethylated C-rich fragments were selectively excluded from the library and failed to enter the amplification process introducing an uneven representation of the sequence and causing biases in the methylation analysis. In contrast, post-bisulfite library preparation undergoes direct adapter ligation and indexing after bisulfite treatment yielding high molecular weight DNA and protecting it from fragmentation [21–24].
PCR amplification contributes to the over-representation of methylation sequences and artificial bisulfite conversion rate in pre-bisulfite and post-bisulfite approaches. The amplification-free post-bisulfite adapter tagging (PBAT) method circumvents the amplification-related bias by reducing fragmentation and CG-context coverage biases and shows high-level coordination with the methylation (5mC) levels measured by liquid chromatography-mass spectrometry (LC-MS) [23]. It requires a low initial amount of DNA (100 ng for mammalian genomes) ensuring compatibility with most standard applications and has high mapping efficiency. Furthermore, its uniform CG context coverage make this approach suitable for low biomass samples, such as mammalian genomic samples with less than 1,000 cells and highly diverse methylome analyses of microbiome samples [25]. However, the authors state that the drawbacks of the method include site preferences in random priming and discrepancies between methylated and unmethylated alleles. The former issue could be mitigated by increasing priming randomness, and the latter showed a trivial influence on the methylation level estimation accuracy in practice.
Another method to overcome DNA fragmentation related sample loss is Enzymatic Methyl-seq (EM-seq) from New England Biolabs, which utilizes two sets of enzymatic reactions instead of bisulfite treatment [11]. Developers claim that EM-seq outperforms the bisulfite-based method in GC distribution, the correlation across input amounts, the number of CpGs confidently assessed within genomic features, and cytosine methylation call accuracy in non-CpG contexts. EM-seq has more consistent DNA methylation patterns among sample replicates compared to WGBS in Arabidopsis thaliana [26].
A brief introduction to the most widely used post-bisulfite library preparation protocols: Accel-NGS Methyl-Seq (Accel), TruSeq DNA Methylation (TruSeq), and SPlinted ligation adapter tagging (SPLAT) [21] is shown in Figure 1 while the MethylC-seq [27]strategy is briefly explained below.
Figure 1. Post–bisulfite conversion library preparation methods for WGBS.
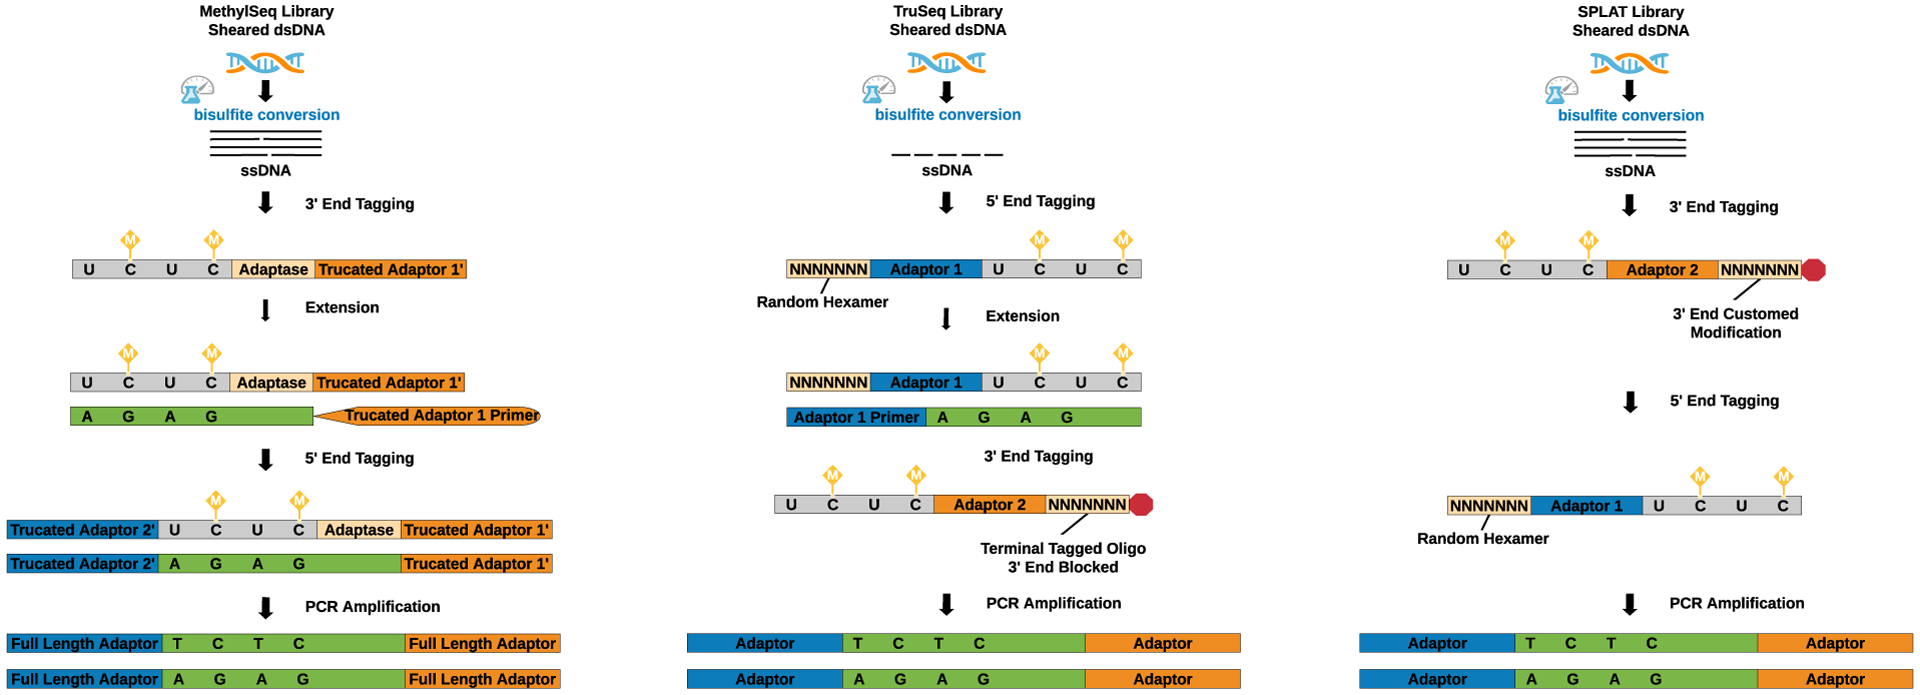
(1) The Accel-NGS® Methyl-Seq kit (Accel) uses pre-sheared bisulfite-treated single-stranded DNA (ssDNA) as a template that is selectively tagged with a low complexity sequence tail and an adapter sequence at the 3’ end with Adaptase™ technology. After extension, a second specific sequence tag with adapters is ligated. The di-tagged DNA is amplified by the polymerase chain reaction (PCR) resulting in double-strand DNA (ds DNA). (2) The TruSeq kit (Illumina) uses ssDNA as a template, which is simultaneously randomly primed and attached with a 5’ end adapter sequence by random hexameric oligonucleotides. Subsequently, a 3’ end adapter is tagged by the random sequence oligonucleotide with the 3’ end blocked to prevent adapter self-ligation. Finally, the di-tagged TruSeq libraries are PCR amplified resulting in dsDNA. (3) The SPLAT (SPlinted ligation adapter tagging) method uses pre-sheared ssDNA as a template that is attached with an adapter sequence and a protruding random hexamer (3’ end blocked) at the 3’ end. Thereafter, an adapter with a random hexamer is annealed to the 5’ end. Finally, the di-tagged SPLAT libraries are PCR amplified to produce dsDNA.
2.1. MethylC-seq
Genomic DNA is fragmented, and end repaired to produce 5’-phosphorylated, 3’-and 5’-blunt-ended DNA. Then, the blunt-ended fragmented DNA is ligated to methylated adapters at both ends and contains a 3’-dAMP overhang. The adapter-ligated fragmented dsDNA is denatured and treated with sodium bisulfite, which transforms the DNA into non-complementary bisulfite single stranded DNA (ssDNA) since uracil is not complementary. The bisulfite-treated ssDNA is enriched by low-cycle PCR amplification.
Data quality, sequence bias, coverage, and mapping efficiency are the main aspects considered when deciding which library preparation method to use [28, 29]. SPLAT and Accel libraries have decreased coverage in CpG islands and CG-rich promoter regions compared with TruSeq. However, they detect the major CpG sites and have the most evenly distributed genome coverage compared with TruSeq, which discards significantly more data resulting in less analyzable CpG sites and lower total CpG site coverage. Accel has 40 times greater genome coverage compared with TruSeq using human whole blood DNA sample [30]. Meanwhile, all three methods demonstrate similar mapping rates of 70%−83% [21]. SPLAT/Accel should be used if a comprehensive genome wide CpG site study is of interest while TruSeq is useful for analyzing one target in the CpG dense region.
3. Building a Whole Genome Bisulfite Sequencing (WGBS) Data-Processing Pipeline
Reproducible workflow with identical outputs is the primary goal of bioinformatics pipelines in raw sequence data processing. Analyzing WGBS datasets is a computational, memory, and storage-space intensive task. Thus, pipeline stability, memory, and time consumption, user-friendly interfaces, and well-demonstrated user manuals are equally valued. Numerous pipelines and components for processing and analyzing WGBS data have emerged and the stepwise interpretation of data processing pipelines is summarized in Figure 2. Analysis of widely used alignment algorithms for speed, mapping efficiency, and influence on downstream processing is compared below.
Figure 2. Outlines and principles of WGBS data processing and analysis pipeline.
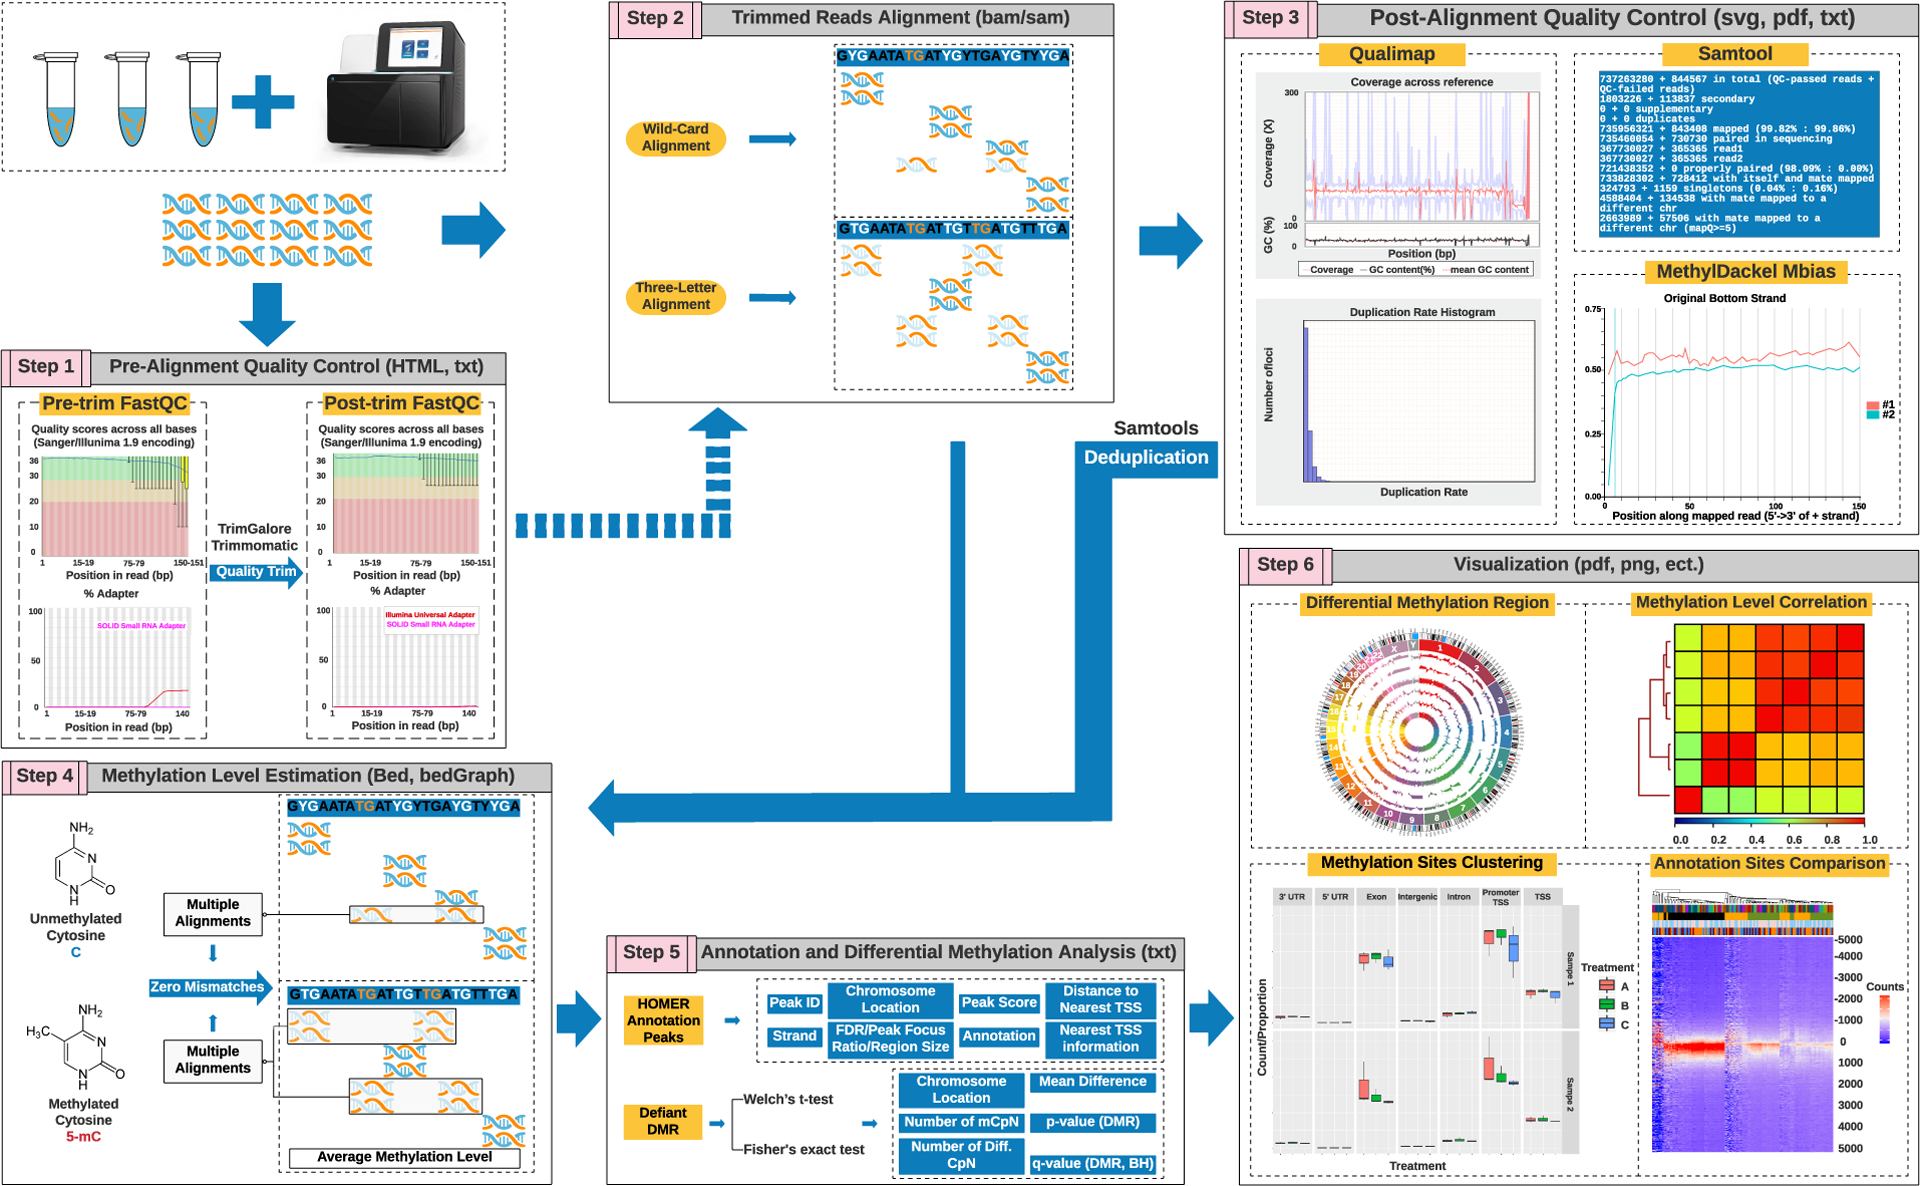
(1) Pre-alignment quality control (QC) is performed to assess sequencing quality, adapter detection, and sequence bias. Then, raw reads are quality-filtered and adapter-trimmed. (2) Processed data are aligned to the indexed reference genome with software designed to generate results in standard SAM/BAM formats. The aligners are altered to account for the changed asymmetric distribution of cytosine and thymine. (3) QC of post-alignment is either obtained from some of the aligners or using external softwares, such as Samtools or Qualimap. The methylation bias (M-bias) plot represents the average methylation level per position in the reads and should be constant. If it is not, the biased reads need to be trimmed in the methylation calling. (4) Methylation calling is straightforward: observation of cytosine votes for a methylated call and observation of unmethylated votes for an unmethylated call. The process iterated across the reference genome generates raw methylation calls for cytosine contexts (CpG, CHG, and CHH). The choice of aligners can influence the methylation estimation results under certain circumstances. The final methylation calling report lists the methylation percentage and the coverage at each position. (5) The methylation calling results can be annotated or undergo differentially methylated region (DMR) detection visualized with multiple programs, such as BedGraph. Processing copious amounts of data, such as the human genome, may require dimensionality reduction to improve the speed and avoid memory “outage”.
3.1. Quality Assessment
The pre-alignment quality assessment ensures the proper input of raw data and improves mappability. The multidimensional evaluation scrutinizes low-quality reads, adapter sequences, contaminated sequences, and duplicated reads. Sequencing by synthesis (increasing the number of bases sequenced) reduces quality especially for the Illumina platform [31]. During sequencing, individual molecules in DNA clusters may fail to be synthesized. The aggregation of erroneously synthesized molecules yields base-calling errors, which are highly positively correlated with fragment length. A higher fraction of long fragments in library constructions results in more calling mistakes, lower Phred scores, and higher mismatch rates especially for pair-end alignment [31]. We recommend keeping the bases with a quality score equal to or greater than 30, indicating a 99.9% confidence in the base calling accuracy. The read length of the DNA sequencing reaction is often longer than the length of the DNA fragments. Thus, the adapter sequences at both ends of the fragments are mistakenly sequenced, which introduces constitutively methylated Cs and causes bias in the methylation calling afterwards. Although a post-alignment intricate trim could mitigate this, we recommend inspecting and trimming the adapters in advance [32]. Data may be contaminated with primers and vector sequences added during the library preparation step, and DNA from Phi X phage added to calibrate the sequence quality in the sequencing reaction. Overrepresented contaminants usually present significantly higher read depths than the nuclear genome leading to a failure during alignment [33]. Duplicate reads (two read pairs with identical coordinates in the gene position) may occur when double counting the same DNA fragments.
Longer inserts may benefit from a higher percentage of high-quality score reads, less adapter contamination, and higher effective read depths (increased genome coverage efficiency). TruSeq library preparation demands extra attention to duplicated reads with the number of PCR amplification cycles approximately double (10–12 cycles) compared with Accel (6–9 cycles).
Quality assessments of raw FASTQ files before and after trimming with FastQC are encouraged. Quality control (QC) results consist of a .HTML format summary and a .zip folder with quality figures. It is worthwhile examining the total number of reads per sample, the per-base sequence quality (mean value of quality score above 20 across read positions), and the adapter detection graphs to ensure good quality alignments and aligned read amounts. WGBS data confound some quality indications compared to sequencing without bisulfite treatment. The per-base content metrics consistently fail with a disproportionately increased percentage of thymine nucleotides. However, the failure of a disproportionate frequency of bases across read positions indicates a specific bisulfite conversion of cytosine to uracil. Furthermore, skewed GC ratios and content distributions are observed during bisulfite conversion. Post-trimming FastQC reports serve as belts and braces ensuring that the total number of reads per sample remains after trimming (removal of adapters) and variability in per-base sequence content introduced by random priming.
3.2. Trimming
Our pipeline uses Trim Galore (https://www.bioinformatics.babraham. Ac. UK/projects/trim_galore/) for its simplified command line and parameter definition although Trimmomatic (http://www.usadellab.org/cms/?page=trimmomatic) is also widely used. WGBS data trimming mainly emphasizes two aspects: quality-based trimming and adapter removal. Quality-based trimming focuses on the quality drops towards the end of the raw reads and bias in sequence composition towards the head and tail of the sequence. Methods in trimming involve clipping regions below a certain quality threshold (Phred default score is 20 indicating that 1/100 bases are incorrect) or trimming a self-defined number of bases from the beginning and end of the reads. Adapter removal for non-bisulfite sequencing relies on the “overrepresented sequences” and “per sequence GC content”. As the CG content is not applicable in WGBS data, the overrepresented sequence serves as an indicator of adapter contamination, which is commonly detected in Trim Galore. Other considerations in the trimming parameters are the library direction and the pair/single-end nature of the input reads. The Trim Galore default setting towards the library is directional, which accommodates most commercial WGBS library preparation methods. The pair-end nature should be specified in Trim Galore to preserve the read pairs for further alignment. Mismatched read numbers and inconsistent read names of the two files raises a warning.
3.3. Alignment
The principle of WGBS is the bisulfite treatment conversion of unmethylated Cs to Ts while retaining methylated Cs [8]. Ideally, unmethylated Cs are identified when the reads are aligned to the reference genomes. However, bisulfite conversion raises two major computational challenges of data alignment: asymmetrical C-T alignment and reduced sequence complexity. Asymmetrical C-T alignment refers to the possibility of T alignment in sequencing reads to C in reference genomes and not vice versa [34]. Reduced sequence complexity makes it difficult to distinguish converted Ts from system errors, which exaggerates the inexact alignments [35–37]. The regular seed-and-extend strategy in WGBS data must cope with identifying the dramatic increase in seed position [36]. The computational time is unacceptably long with extended candidate occurrence positions in a large human reference genome [38].
Two mapping approaches were developed for bisulfite sequencing alignment: three-letter and wild card. The three-letter approach simplifies the four-letter-based genome to a three-letter-based genome by converting all Cs to Ts in the reference genome and sequence reads [29]. Thereafter, the reads are processed with standard aligners, such as Bowtie1 or 2 [39–41], BWA mem [42, 43], and GEM3 [44, 45], mainly employing the Burrows-Wheeler Transform (BWT) backtracking algorithm. In comparison, the wildcard approach replaces Cs in the reference genome with a Y, which can align to Cs and Ts in the read sequence [15, 38, 46]. The alignment then uses the seed-and-extend strategy based on the hash table algorithm [38]. Alignment accuracy and computational time are the main concerns in the choice of aligners. Bock (2012) suggested that wildcard aligners achieve higher genomic coverage but have an increased chance of introducing bias towards higher methylation estimates, while the three-letter aligners have the opposite effect [29]. Their basic alignment strategies are responsible for these features. Namely, the wildcard aligners keep Cs in BS-converted reads and raise the sequence complexity to the level that secures unique alignments to reference genomes, while the three-letter aligners remove the Cs in BS-converted reads and decrease the sequence complexity, which increases the chance of ambiguous alignment positions. However, the coverage difference and M-bias are only exhibited in highly similar regions in the genome. Hence, they are less relevant in longer sequence read alignments, such as the human genome [29]. Consequently, computational speed and memory consumption are prioritized in aligner selection. Studies that propose three-letter aligners, such as Bismark [47] and BWA-METH [42], outperformed command wildcard aligners, such as BRAT_BW [48, 49], BSMAP [50], and GSnap [51], in running time and peak memory usage [37, 52].
The BWT-based-indexed three-letter aligners enable rapid read searching by loading the entire suffix of the referenced genome on the representations of data structures mainly with the Burrows-Wheeler index based on the full-text minute-space (FM) index [41]. The FM index has a small memory footprint of approximately 1.3 gigabytes (GB), which is more efficient at identifying duplicated alignments to the reference genome compared with the hash table [53]. Some aligners make customized versions of the fundamental four-letter FM index to deal with the time-consuming counting and location operations in the FM-index process [45]. BitMapperBS is less time-consuming than the other aligners mainly because of its fixed index method targeted at the two operations mentioned above. It reorganizes the BWT by adopting a compressed three-letter FM-index, which omits the encoding of Cs resulting in higher efficiency short seed searching and counting. It has a redesigned FMtree algorithm in the locating procedure, which recovers numerous unsampled seed positions caused by the low sequence complexity WGBS block-by-block [54]. Moreover, the FMtree has a ternary-tree-designed search space for location operation instead of a quadtree-designed search space, which shortens the time required for traversing.
However, a 6–7-fold decrease in computational time on 1,000,000 bp reads of pair-end simulated data compared with other aligners, including Bismark, BWA-METH, and gemBS, is not observed. A decrease from approximately 24 hours to 7–8 hours could be convincing especially for those dealing with a sizeable mammalian sequencing project although a trade-off for speed could sacrifice the mapping quality. BitMapperBS may not guarantee the highest quality alignment for cases with multiple mismatches since the algorithm discards reads with an inexact best match making the methylation level biased towards under-estimation.
The algorithms available for bisulfite-treated read mapping have differences influencing running time, mapping quality, which affects downstream methylation calls. The widely applied aligners Bismark, BitMapperBS, BWA-METH, and gemBS were assessed on directional, quality and adapter-trimmed human sample data that were sequenced via WGBS protocols (Accel-NGS MethylSeq, SPLAT, and TruSeq) and oxidative bisulfite sequencing (TrueMethyl and EMSeq), which served as validations. The speed was compared by subtracting 1,000,000 bp paired end reads from the sample data measured by the five library preparation methods using the same seeding of Seqtk. BitMapperBS had the highest alignment speed with a stable average of approximately 550–650 read pairs per CPU core per second (Table 1). Bismark, BWA-METH, and gemBS showed equal alignment speeds (approximately 200–300 read pairs per CPU core per second); however, Bismark was the least stable.
Table 1.
WGBS alignment algorithms comparison in speed.
| Library | Pipeline | Average Running Time (s) | Standard Deviation | Read Pairs/core/sec. |
|---|---|---|---|---|
| EMSeq | Bismark | 331 | 79.25 | 216 |
| BitMapperBS | 126.39 | 3.75 | 565 | |
| BWA-Meth | 357.16 | 21.13 | 200 | |
| gemBS | 291.6 | 32.27 | 245 | |
| MethylSeq | Bismark | 343.1 | 81.51 | 208 |
| BitMapperBS | 133.13 | 3.85 | 537 | |
| BWA-Meth | 330.69 | 3.51 | 216 | |
| gemBS | 286.9 | 10.15 | 249 | |
| SPLAT | Bismark | 334.3 | 96.11 | 214 |
| BitMapperBS | 119.96 | 7.83 | 595 | |
| BWA-Meth | 305.37 | 2.56 | 234 | |
| gemBS | 275 | 12.86 | 260 | |
| TrueMethyl | Bismark | 309.3 | 85.14 | 231 |
| BitMapperBS | 114.14 | 9.44 | 626 | |
| BWA-Meth | 305.93 | 2.83 | 233 | |
| gemBS | 273.7 | 6.65 | 261 | |
| TruSeq | Bismark | 306.5 | 87.79 | 233 |
| BitMapperBS | 113.83 | 1.69 | 628 | |
| BWA-Meth | 295.18 | 2.96 | 242 | |
| gemBS | 286.5 | 14.67 | 249 |
The post-mapping quality in the methylation calls of the four aligners showed that BWA-METH and gemBS generated the highest uniquely mapped read rates and the lowest unmapped reads (Figure 3A). There were minor differences at ≤ ×10 average CpG coverage for each chromosome and a slightly better coverage of BWA-METH against the other methods at ≥ ×20 coverage (Figure 3B). The magnitude of unmethylated Cs at both ends of the DNA fragments is crucial for obtaining qualified DNA methylation calls from the alignment results. The effect scale using the M-bias plot for the alignment results of each pipeline were very similar among the four aligners, although there were large discrepancies across different libraries (Figure 3C). The concordance of CpGs called across the genome using aligners showed comparable genomic enrichment distribution at each annotation region and mean methylation levels around transcription start sites (TSSs) (Figure 3D–E). Meanwhile, the downstream methylation extraction level was unaffected by aligner choice according to the similar correlation coefficients of methylation calls with Bismark showing only a slightly lower correlation against the three other aligners (Figure 4).
Figure 3. Mapping quality comparison across four alignment algorithms.
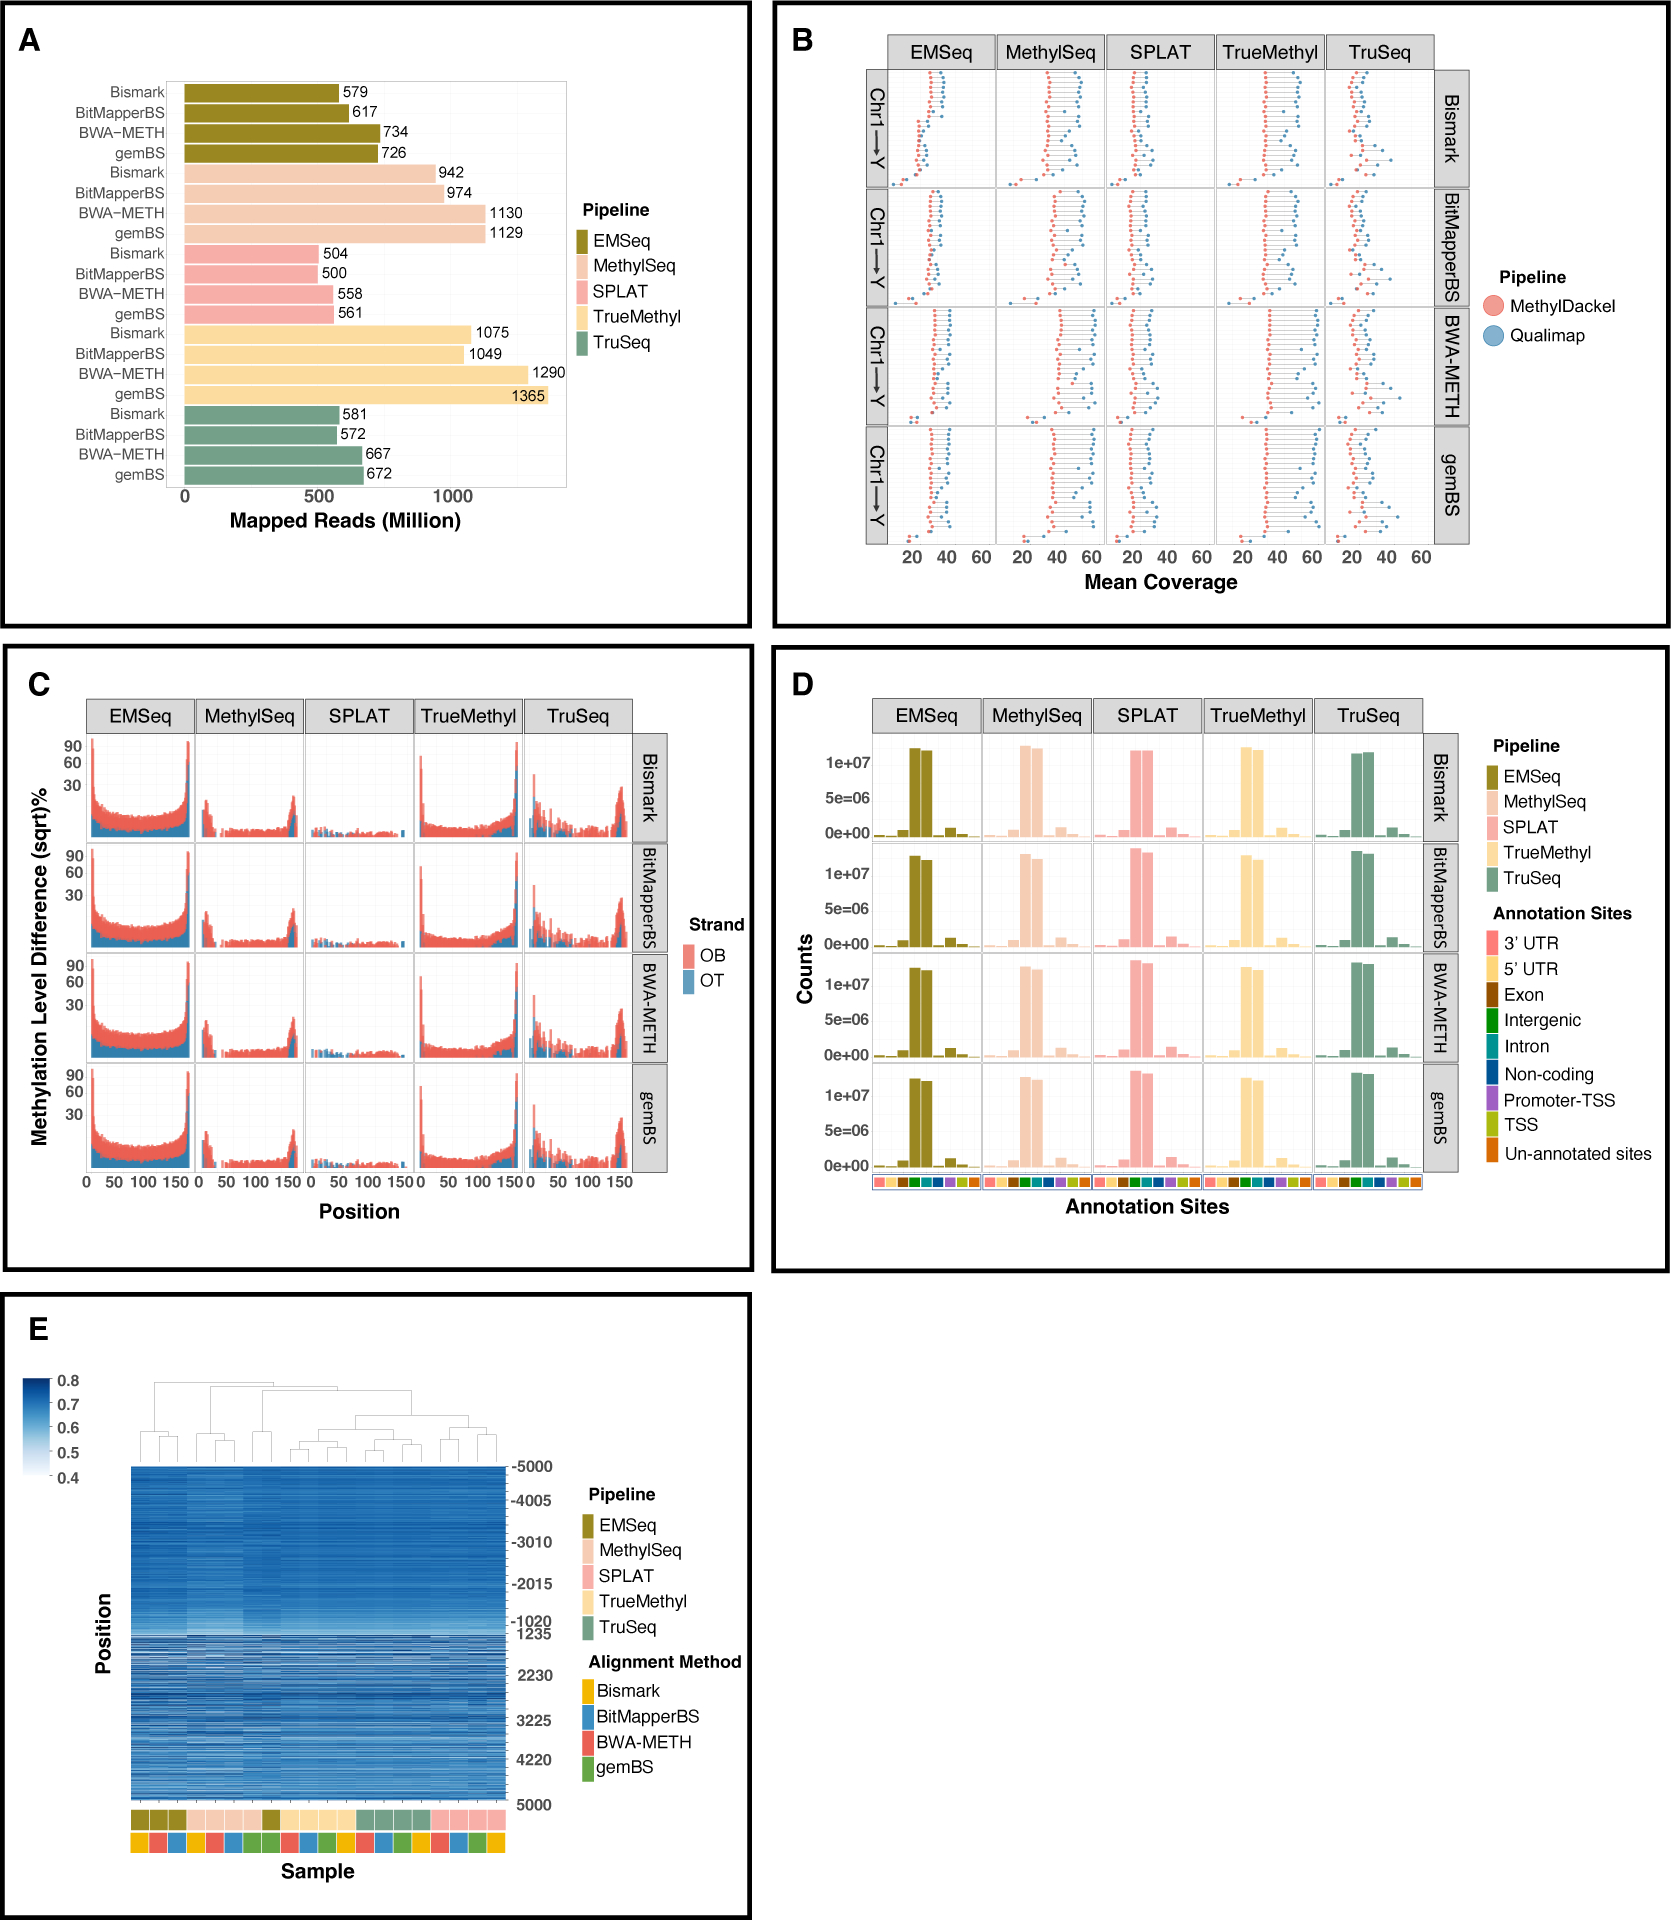
A. Mapping rates of four alignment methods throughout five library preparations. B. Post-alignment quality control measured by Qualimap and MethylDackel. C. Methylation bias (M-bias) plots of original top and bottom strands. D. Annotated regions across the reference genome generated from each alignment algorithm. E. Heatmap displaying the mean methylation percentage levels 5 kb upstream/downstream of transcription start sites (TSS).
Figure 4. Correlation matrix of genome-wide methylation levels for all CpG sites.
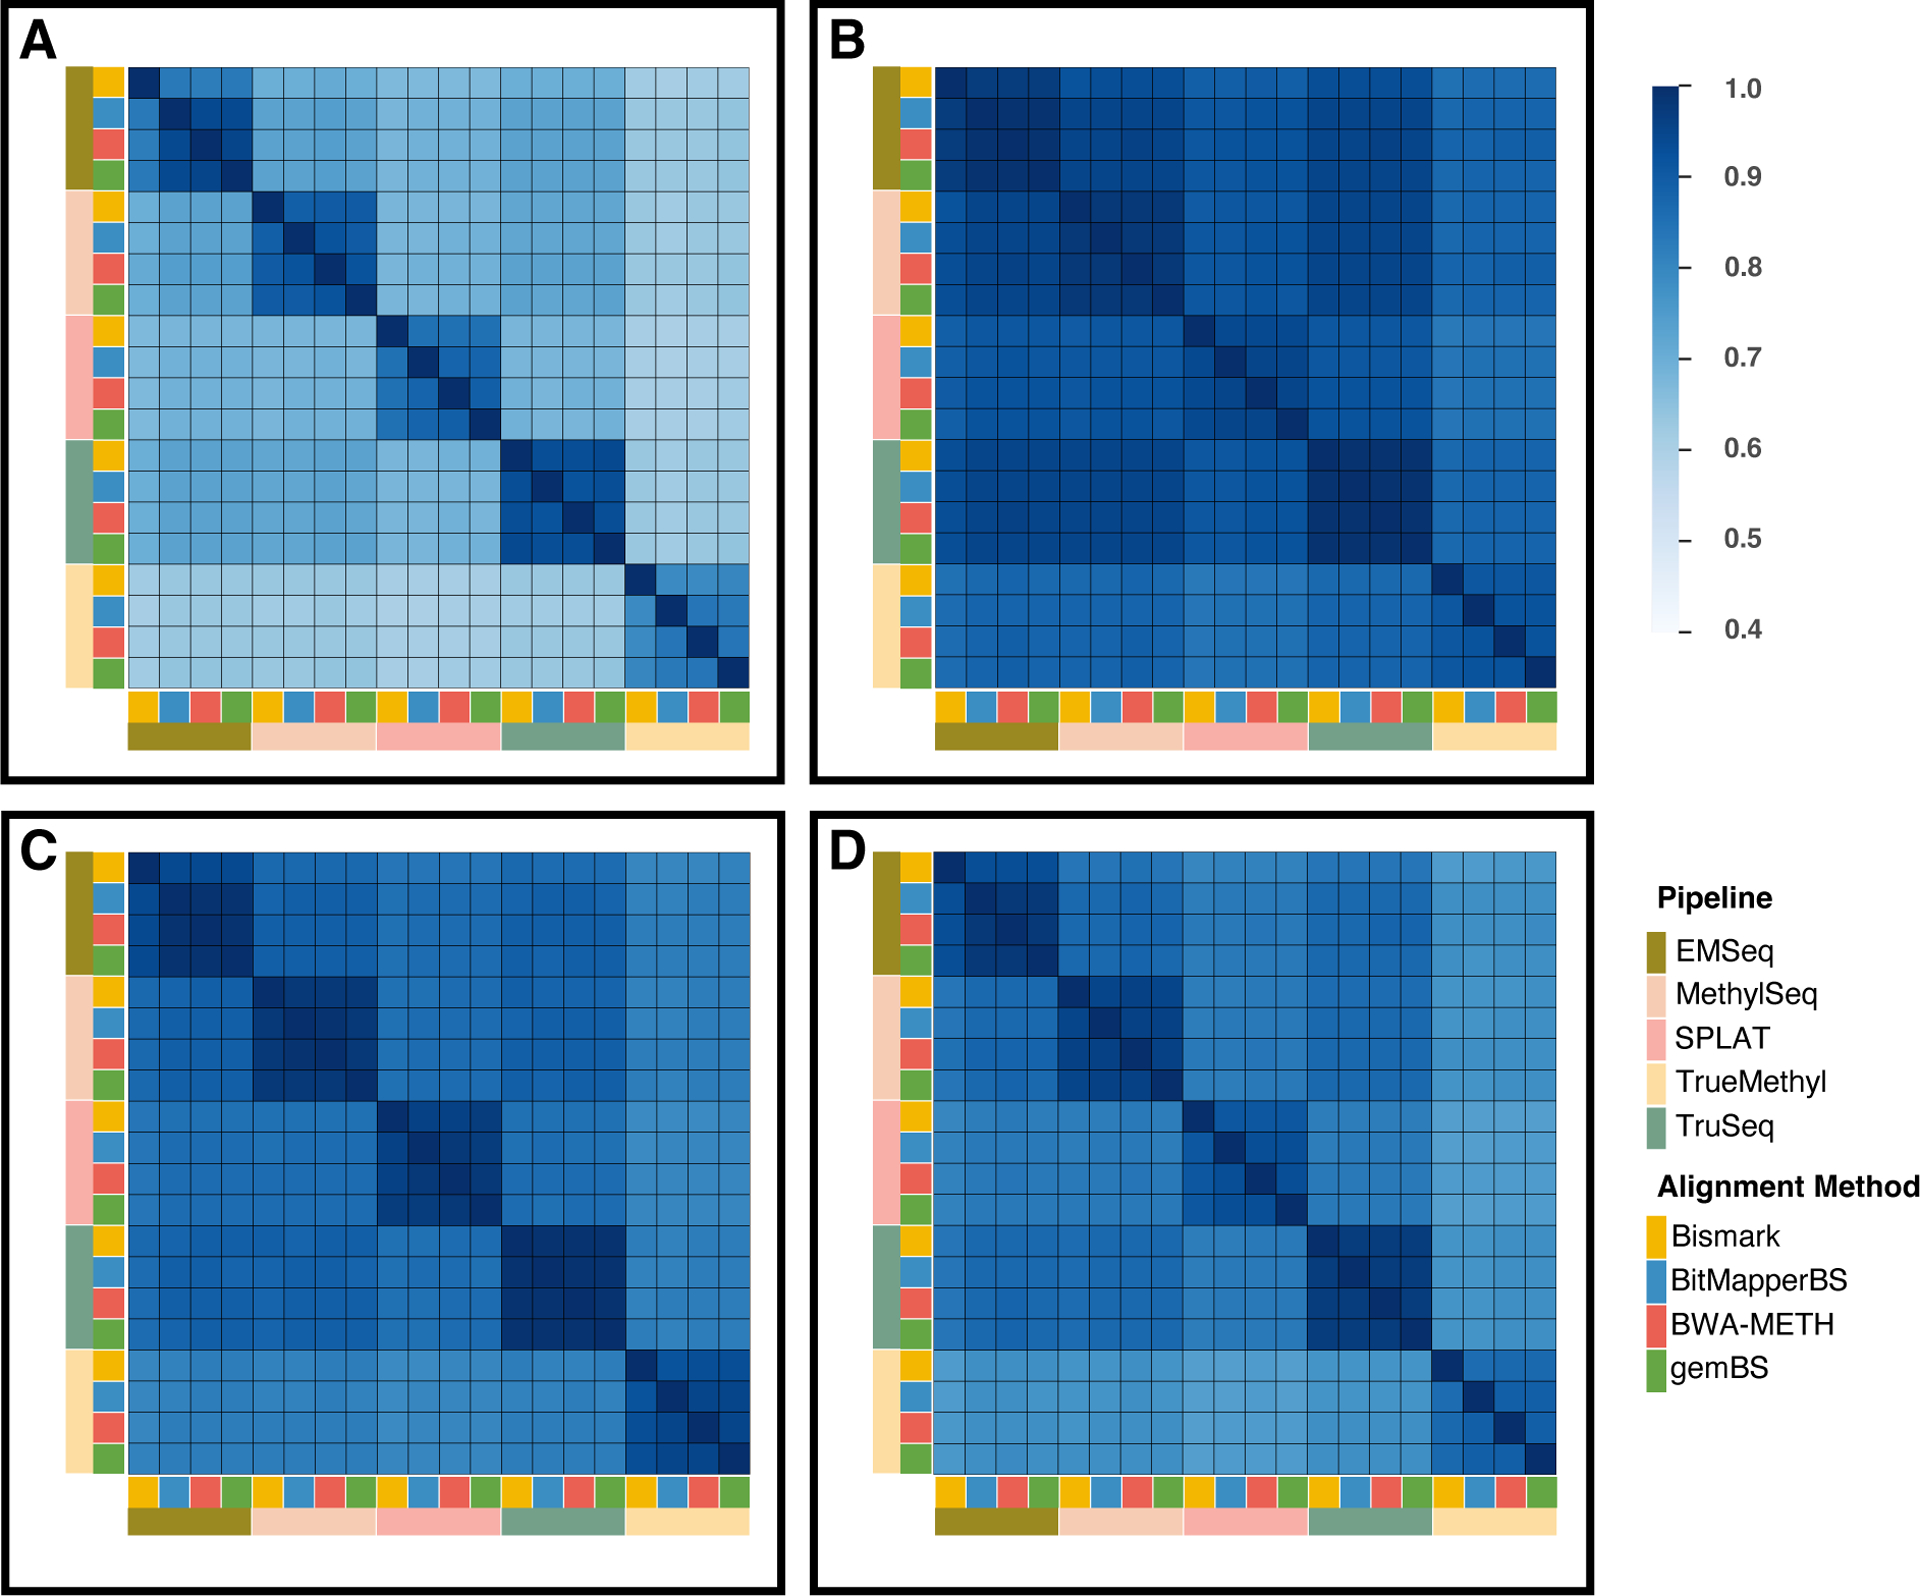
A-D represents Kendall rank correlation, Pearson correlation, Sheppard’s correction, and Spearman’s rank correlation, respectively. The overall correlation trends among the four statistical methods was similar; however, Kendall correlations showed notably lower correlation levels than the other three methods. The widely used Pearson correlation displayed higher correlation levels than Spearman’s method, which may be due to the inclusion of potential outliers.
3.4. Alignment quality control
Post-alignment quality control is essential because of the asymmetrical alignment and non-complementarity of WGBS [32, 46]. The intrinsic confounding variables of WGBS skewed the methylation estimation to either over-estimation or under-estimation, which is primarily inspected by an M-bias plot. Partial (incomplete) methylation can occur during bisulfite treatment where both C- and T- peaks are observed, which typically leads to over-estimation. Rates higher than 98.5% ensures the absence of bias. Spike-in sequences with unmethylated Cs may be added to methylated samples in all contexts (CpG, CHG, and CHH) followed by counting the number of Ts for unmethylated Cs and calculating the conversion rate of the added sequences. However, this could introduce contaminants previously mentioned in quality assessment.
Meanwhile, the bias resulting from underestimation captures false-negative methylation sites. For example, enzymatically mediated end restoration of fragmented dsDNA introduces un-methylated Cs at both ends of the fragments inaugurating artificially underestimated methylation levels [29]. This reflects a sharp drop in the average methylation level at the problematic ends in the M-bias plot, which should be discarded before methylation extraction. Bisulfite-mediated degradation is the main source of bias in WGBS because degradation is non-random and occurs at unmethylated cytosines, which are depleted from the library [14]. This leads to many subsequent sequence biases and global methylation overestimation. Therefore, the EM-seq method was developed to replace the non-random degradation leading to coverage and M-biases in classical BS-seq [11, 14]. This degradation reflects the low unique mapping rates in post-alignment quality assessment [55, 56].
3.5. Methylation extraction
MethylDackel is recommended for methylation extraction using standalone aligners, such as BitMapperBS and BWA-METH [57]. Meanwhile, it is convenient and consistent to apply the extractor of the program in comprehensive aligners, including Bismark and GemBS. MethylDackel was used for methylation extraction in the pipeline as an example to accommodate BitMapperBS in the alignment section. Methylation estimation is based on the comparing the sequenced reads and the reference genome as methylated cytosines remain unchanged Cs and unmethylated cytosines are converted to Ts. If a position shows C in the reference genome, 100% methylation is assigned when C is noted at the aforementioned spot while 0% methylation is assigned when T is indicated. A weighted average is calculated and designated as the final methylation level after counting the number of Cs and Ts at the position. For example, 10/10 Cs show full cytosine methylation, 6/10 Cs show partial methylation (60%), and 0/10 Cs represent unmethylated cytosine. M-Bias plots of the average methylation level per position in the reads of the two strands were performed before extraction to identify the fundamental technical biases in extracting reads as a trimming reference. Theoretically, the reads should be constant, but the first and second reads in each pair are usually biased at the 5’ and 3’ ends. The methylation state of the first couple of bases or the steep drop in the average methylation level of read 2 implies a filled-in unmethylated cytosine. Artifactual noise in the reads instigates incorrect methylation calling during the extraction procedure. MethylDackel gives a trimming suggestion on both the top and bottom lines, which can be applied as a parameter in the succeeding extraction. The extraction generates a bedGraph file with a header that shows the calling context and the BAM file name. The last two columns are the coverage information and methylated/unmethylated calls for each position, respectively, which can be utilized for data filtering and further data analyses.
4. Data Normalization and Statistical Analysis
4.1. CpG methylation
Library preparation methods can significantly influence the mean coverage per CpG. Sequence data does not have a standardized normalization method, unlike microarray methylation data. However, normalization is essential for downstream differential methylation detection since there should be an equivalent amount of sequence data for comparison. Downsampling normalizes an unbalanced number of read sequences to match that of similar sequence data. BAM files from the alignment and the bedGraph file from methylation extraction can be downsampled. Downsampling at the alignment level can be both time and memory-demanding, while it requires considerably less time and memory at the extraction level with similar numbers of methylation calls, detected CpG sites, read count distribution, and average coverage accuracy. Therefore, bed- Graph downsampling is recommended before further data comparison, especially for the detection of differential methylation regions (DMRs).
4.2. DMRs
DMR detection is one of the core methylation analyses in practice and involves analyzing genomic regions in multiple samples. The most common application involves finding abnormal methylation regions between cancer and normal samples that may serve as biomarkers or reveal the biology of the disease. Implementation approaches based on the DMR statistical framework vary among software programs with some of the major methods listed below.
BSmooth uses a local likelihood smoothing approach to identify DMRs in a sample-specific methylation calling [58]. It applies Welch’s t-test, which is an adaptation of Student’s t-test to compare multiple samples. The DMRs are CpG sites with observed P values above a predefined β value. However, the predefined threshold can lead to type II errors (false negatives) biasing the outcome. BiSeq has solved this issue by incorporating a false discovery rate and a beta-binomial model to take into account biological variation among replicates [59]. The statistical significance at target regions is then calculated with an adjustment to the step-like changes caused by the hierarchical process via a triangular kernel model. The p-values are normalized, transformed to z-scores, averaged, and compared. MethylSig is like BiSeq and applies a beta-binomial model to consider read coverage and biological variance. Metilene combines binary segmentation and multivariate Kolmogorov-Smirnov goodness-of-fit tests [60]. The nonparametric approach uses pre-segmented genomic regions, which are steadily minimized to a region with less than a predefined lower limit of CpGs or no improvement in statistical significance. This approach is sensitive to differences in cumulative sample distribution. Meanwhile, methylKit uses Fisher’s exact test for a one-sample case and logistical regression-based statistics for multiple replicates [61]. Defiant is a standalone program that uses weighted Welch expansion to identify DMRs [62]. Fisher’s exact test is used for two samples with only one replicate, while Welch’s t-test is used for those with multiple replicates, and unbiased sample variance is weighted based on coverage. The Benjamini-Hochberg approach is applied to adjust the p-value for multiple t-tests in DMR identification. The data distribution is innately binomial because most of the methylation scores are either fully methylated or fully unmethylated, which indicates a better binomial model performance than other models. The confounding effect of variance in read coverage and covariation of demographic parameters, such as gender, age, and ethics, are strongly associated with DMR detection. Hence, a normalized transformation of the data and adjustment for covariates is essential.
5. Case study
The computational analysis of WGBS data is challenging and involves analyzing FASTQ reads, methylation estimation, site annotation, DMR detection, and visualization. Here, we present a comprehensive case study of WGBS data analysis.
5.1. Analysis tools
The packages used in the case study and their installation guides are listed in Table 2. The user manuals of the packages are available from the websites.
Table 2.
Software tools for the analysis, interpretation, and visualization of WGBS data.
| Software | Language | Description | URL | Installation | Ref |
|---|---|---|---|---|---|
| Pre-alignment Data Processing | |||||
| FastQC | Java | Quality control tools providing summarized tables and figures. Both interactive application for small datasets analysis and command-line mode for large datasets analysis are available. FASTQ supports single-end and pair-end data. | https://www.bioinformatics.babraham.ac.uk/projects/fastqc/ | conda install -c bioconda fastqc | [63] |
| FastqCleaner | R | An interactive web-based Shiny application for quality control, filtering and trimming. Also available for offline GUI and command-line user interface. User-friendly and supports single-end and paired-end data. | https://www.bioconductor.org/packages/release/bioc/html/FastqCleaner.html | if (!requireNamespace(“BiocManager”, quietly = TRUE)) install.packages(“BiocManager”) BiocManager::install(“FastqCleaner”) |
[64] |
| Fastp | C++ | Command-line user interface. Multithreading parallel processing software for quality control, filtering and trimming. Supports single-end and pair-end data. Provide both informative HTML reports, and JASON format for further interpreting. | https://github.com/OpenGene/fastp | conda install -c bioconda fastp | [65] |
| TrimGalore* | Perl | Command-line user interface. wrapper script of Cutadapt to conduct automate quality and adapter trimming as well as post-trimming quality control. Supports single-end and pair-end data. Can autodetect PHRED format. | https://github.com/FelixKrueger/TrimGalore | curl -fsSL https://github.com/FelixKrueger/TrimGalore/archive/0.6.6.tar.gz-otrim_galore.tar.gz tar xvzf trim_galore.tar.gz conda install -c bioconda trim-galore |
[66] |
| Trimmomatic | Java | Command-line user interface. Designed for Illumina sequence data filtering and trimming. Pipeline-based architecture, allowing modification on individual ‘steps’ (adapter removal, quality filtering, etc.) to be applied to FASTQ files. Supports single-end and pair-end data. Cannot autodetect PHRED format. | https://github.com/timflutre/trimmomatic | conda install -c bioconda trimmomatic | [67] |
| Reads Alignment | |||||
| Bismark* | Perl | Three-letter FM-index aligner. A comprehensive aligner includes alignment, post-alignment quality control and visualization, and methylation calling. Alignment results can be analysed and visualized by SeqMonk. Uses Bowtie/Bowtie2 as alignment engines. Supports single-end and pair-end read alignments. Supports directional or non-directional BS-Seq libraries. Output discriminates between cytosine methylation in CpG, CHG and CHH context. Summarize alignment statistics report can be visualized. Available for parallel processing but vulnerable to multicore crashes. Highly user friendly for downstream visualization | https://www.bioinformatics.babraham.ac.uk/projects/bismark/ | conda install -c bioconda bismark | [47] |
| BS-seeker2 | Python | Three-letter FM-index aligner. Uses Bowtie/Bowtie2/SOAP as alignment engines. Supports single-end and pair-end read alignment. Has an updated version BS-Seeker3 but fails in indexing human genome. | https://github.com/BSSeeker/BSseeker2 | conda install -c bioconda bs-seeker2 | [68] |
| BWA-METH | Python | Three-letter based aligner that wraps BWA mem. Supports single-end reads and paired-end reads from the directional BS-Seq libraries. Do not provide mapping quality report. | https://github.com/brentp/bwa-meth | conda install -c bioconda bwameth wget https://github.com/brentp/bwa-meth/archive/master.zip unzip master.zip cd bwa-meth-master/sudo python setup.py install |
[42] |
| BitMapperBS* | G++ | Three-letter FM-index aligner. Supports single-end reads and paired-end reads from the directional BS-Seq libraries. Provide brief mapping efficiency report. Time and memory saving. Stable performance. | https://github.com/chhylp123/BitMapperBS | git clone https://github.com/chhylp123/BitMapperBS.gitcd BitMapperBS make conda install -c bioconda bitmapperbs |
[34] |
| BSMAP | C++, Python | Wild-card hash table aligner. Uses SOAP as alignment engine. Supports gapped or pair-end alignment and iterative trimming of low-quality base pairs. | https://github.com/genome-vendor/bsmap/blob/master/README.txt | tar zxfv bamsp-2.4.tgz make make install conda install -c bioconda bsmap |
[50] |
| LAST | C/G++, Python | Wild-card spaced suffix array index aligner. LAST is designed for general-purpose alignment but can be adapted to WGBS data process. Less user friendly than other aligners specific designed for BS-seq. | https://github.com/mcfrith/last-genome-alignments | conda install -c bioconda last | [69] |
| BatMeth | C/C++ | Three-letter FM-index agliner. Supports single-end and pair-end read alignments. Supports directional or non-directional BS-Seq libraries. Installation instruction is absent. | https://code.google.com/archive/p/batmeth/ | https://code.google.com/archive/p/batmeth/downloads | [70] |
| Bisulfighter | C++, Python, Perl | Wild-card spaced suffix array index aligner based on LAST. Supports single-end and pair-end read alignments. Supports directional or non-directional BS-Seq libraries.Do not support multithreading alignment. Also includes DMR detection based on hidden Markov models (HMMs) enabling automated adjustment of DMC chaining criteria (cite). | https://epigenome.cbrc.jp/bisulfighter | brew tap mtoutai/bisulfighter brew install mtoutai/bisulfighter/bisulfighte |
[71] |
| BRAT-nova | Python, Java | Three-letter FM-index aligner. A comprehensive aligner includes pre-alignment trimming, alignment, duplication removal, methylation calling. | http://compbio.cs.ucr.edu/brat/ | tar zxvf brat_nova.tar.gz cd brat_nova make |
[49] |
| GSNAP | C | Wild-card hash table aligner. | https://github.com/juliangehring/GMAP-GSNAP | wget http://research-pub.gene.com/gmap/src/gmap-gsnap-2018-07-04.tar.gz cd gmap-2018-07-04. /configure make sudo make install |
[51] |
| Post-alignment Data Processing | |||||
| Quality control | |||||
| SAMtools | C, Java, Perl, CSS, TeX | A suite of programs for interacting with high-throughput sequencing data (cite). Use Samtools stats and flagstats functions to check alignment quality. Samtools may fail to detect total input reads, and constantly report 100% unique mapping rate. A solution is calculating the input reads separately. | http://www.htslib.org/doc/samtools-stats.html | cd samtools-1.x ./configure --prefix=/where/to/install make make install |
[72] |
| Qualimap | Java, R | Qualimap examines alignment results in SAM/BAM files. Provides comprehensive chromosome-wise quality reports. Highly user-friendly but may be time and memory consuming when apply to human whole genome sequencing data. | http://qualimap.bioinfo.cipf.es/ | conda install -c bioconda qualimap | [73] |
| Goleft | Go, Shell, Python | Provide visualized chromosome-wise quality control reports. Not as thorough as qualimap but less time consuming. | https://github.com/brentp/goleft | go get -u github.com/brentp/goleft/… go install github.com/brentp/goleft/cmd/goleft |
[74] |
| Markduplicates (Picard) | Java | Locates, tags and trims duplicate reads in SAM/BAM files. | https://gatk.broadinstitute.org/hc/en-us/articles/360037052812-MarkDuplicates-Picard- | conda install -c bioconda picard | [75] |
| Methylation Extraction | |||||
| MethylDackel | C, Python | Supports post-alignment bias plotting, trimming, filtering and methylation calling. The BAM files need to be sorted and indexed in advance. | https://github.com/dpryan79/MethylDackel | git clone https://github.com/dpryan79/MethylDackel.git cd MethylDackel make LIBBIGWIG=“/some/path/to/libBigWig.a” make install prefix=/some/installation/path |
[57] |
| Annotation | |||||
| HOMER annotatePeaks.pl | C++, Perl, Roff | Designed for motif discovery for large scale ext-gen sequencing data. Command-line-based programs for UNIX-style operating systems. Accepts BED files or HOMER peak files as input. Before annotation, reference genomes are required. Two crucial columns in HOMER results for methylation analysis are Distance to the nearest TSS and Genomic Annotation. HOMER is straightforward and user-friendly. | http://homer.ucsd.edu/homer/ngs/quantification.html | conda install wget samtools r-essentials bioconductor-deseq2 bioconductor-edger | [76] |
| BioMart | R, Perl | Both GUI and command-line-based R package are available. | https://m.ensembl.org/info/data/biomart/index.html | if (!requireNamespace(“BiocManager”, quietly = TRUE)) install.packages(“BiocManager”) BiocManager::install(“biomaRt”) |
[77] |
| BSgenome | R | BSgenome allows for representation of genomes, and loading/unloading large matrix. | https://bioconductor.org/packages/release/bioc/html/BSgenome.html | source(“https://bioconductor.org/biocLite.R”) biocLite(“BSgenome”) |
[78] |
| Differenctial Methylation Region (DMR) | |||||
| defiant | Shell, R | Employs Weighted Welch Expansion. Automatically identifies input file type from bs_seeker and Bismark, as well the same input data that Metilene, MethylKit, and BSmooth use (cite). Commands are simple and straightforward. | https://github.com/hhg7/defiant | conda install -c bioconda defiant | [62] |
| DMAP | Not mentioned | Employs Fisher’s exact test, Chi-squared test and ANOVA test. Contains two main programs: diffmeth and identgeneloc. Diffmeth only accept SAM files generated from Bismark. BED/TXT files need to be processed by the rmapbscpg2 software in advance. Diffmeth only returns P-values for the input region without imposing a cutoff for P-value to identify DMR. Users must self-define a P-value threshold and apply multiple test corrections. Identgeneloc is designed for genes and features identification. DMAP is more compatiable with Bismark and SeqMonk. | https://www.otago.ac.nz/biochemistry/research/otago652955.html | Download from the website directly. | [79] |
| Metilene | Not mentioned | Employs binary segmentation algorithm combined with a two-dimensional statistical test and Bonferroni correction for adjsuted p-values are calculation. Works for large dataset and low coverage data. Able to estimate missing data. | http://www.bioinf.uni-leipzig.de/Software/metilene/ | tar -xvzf metilene .tar.gz make |
[60] |
| DMRseq | R | Specifically designed for WGBS DMR detection. Employs generalized least squares models. Provide highly accurate measurements and can work for small samples (as small as two per group). | https://github.com/kdkorthauer/dmrseq | if (!requireNamespace(“BiocManager”, quietly = TRUE)) install.packages(“BiocManager”) BiocManager::install(“dmrseq”) |
[80] |
| MethylSig | R | Employs beta binomial model. Identifies statistical differences in CpG context methylation. | https://github.com/sartorlab/methylSig | if (!requireNamespace(“BiocManager”, quietly = TRUE)) install.packages(“BiocManager”) BiocManager::install(“methylSig”) |
[81] |
| Visualization | |||||
| Intervene | Python, R | Intersection calculation and visualization of genomic regions. Contains three modules: Venn diagrams (up to six sets), UpSet plots, and pairwise clustered heat maps. Available in interactive web ShinyApp. Time and memory consuming when applied on large datasets. | https://github.com/asntech/intervene | conda install -c bioconda intervene | [82] |
| Seaborn | Python | Data visualization library based on matplotlib. Easy to combine with other statistical tools based on python. Significantly less time consuming than Intervene. More userfriendly but less flexible than matplotlib. | https://seaborn.pydata.org/index.html | conda install seaborn | [83] |
| Matplotlib | Python | A comprehensive library for creating static, animated, and interactive visualizations. Flexible and full-controlled by users. | https://matplotlib.org/index.html | python -m pip install -U pip python -m pip install -U matplotlib conda install matplotlib matplotlib-base mpl_sample_data |
[84] |
| Circos | Perl | Visualizes data in a circular layout. Highly flexible and requires experiences in coding. Recommend to illustrate positional relationships between the sequence of multiple genomes (e.g. similarities and differences from multiple datasets comparisons). | http://circos.ca/ | http://circos.ca/software/download/ | [85] |
| Comprehensive Analysis Pipelines | |||||
| SeqMonk | Visualisation and analysis of mapped sequence data. Accept SAM and BAM formats. Supports visualisation of mapped regions against an annotated genome and generated genome annotation reprots. Allows quantitative comaprisons between multiple datasets. Highly recommend for data generated from Bismark. Less compatible with data from BWA-METH, gemBS and other aligners. Available in GUI | https://www.bioinformatics.babraham.ac.uk/projects/seqmonk/ | tar -xzf seqmonk_v1.45.0_linux64.tar.gz | [86] | |
| gemBS | Python, C | Command line interface. Pipeline specifically designed for WGBS data analysis. Analyses include alignment, post-alignment quality control (can be visualized with gemBS build-in function) and methylation calling functions. GEM3 is used to conduct alignment. GEM3 is a three-letter customed FM-index aligner and outperform some traditional aligners in speed. Commands of gemBS is simple, but the configuration files can be misleading to first time users. To get gemBS work, a specific JSON file and a hidden folder. gembs need to be downloaded in the sample data provided by gemBS. | http://statgen.cnag.cat/gemBS/ | conda install -c bioconda gembs | [45] |
| BSmooth | C++, Perl | Command line interface. Analyses include alignment, quality assessment metrics based on stratifying methylation estimates by read position (local average to improve the precision), DMRs detection inferred from biological replicates (cite). Applys wild-card FM-index aligner. Uses Bowtie2/Merman as alignment engines. Also supports for color-space read mapping. Bsseq is part of the pipeline excluding the alignment step and can be installed via Bioconductor. The download link provided in the publication is invalid. Challenge for non-bioinformatics related researchers to install. |
https://github.com/BenLangmead/bsmooth-align
https://www.bioconductor.org/packages/release/bioc/vignettes/bsseq/inst/doc/bsseq.html |
if (!requireNamespace(“BiocManager”, quietly = TRUE)) install.packages(“BiocManager”) BiocManager::install(“bsseq”) |
[58] |
| Wg-blimp | Python, R | Available in ShinyAPP. Pipeline specifically designed for WGBS data analysis. Analyses include alignment, post-alignment quality control, methylation calling, detection of differentially methylated regions, segmentation and annotation. | https://github.com/MarWoes/wg-blimp | conda create -n wg-blimp wg-blimp python=3.6.7 r-base=4.0.2 methyldackel==0.4.0 | [87] |
| MethGo | Python | Command line interface. Analyses include cytosine coverage distribution, cytosine methylation level calling and distribution, cytosine methylation levels at transcription factor binding sites (TFBSs). | https://methgo.readthedocs.io/en/latest/ | virtualenv --no-site-packages --python=python2.7 methgo_env source methgo_env/bin/activate git clone https://github.com/paoyangchen-laboratory/methgo.git pip install -r methgo/requirements/base.txt pip install -r methgo/requirements/addition.txt |
[88] |
| Bicycle | Java | Specifically designed for WGBS data. Use Bowtie1/2 as alignment engines. Analyses include read alignment, error estimation in bisulfite conversion, identification of clonal and ambiguous reads, cytosine methylation calling, calculation of methylation ratios, beta scores and weighted mean of cytosine methylation estimation, annotation, and differential methylation for cytosines (DMC) and genomic regions (DMR). | http://www.sing-group.org/bicycle/ | http://www.sing-group.org/bicycle/download.html | [89] |
| BAT | Perl, R, Shell | Analyses include read alignment, methylation calling, annotation, DMR and visualization. The visualization includes hierarchical clustering of methylation level, mean methylation rates, group-wise mean methylation rates, pair-wise correlation of mean methylation level, and distribution of group methylation differences. | http://www.bioinf.uni-leipzig.de/Software/BAT/ | git clone https://github.com/helenebioinf/BAT | [90] |
| MethyPipe | R | Use BWT as alignment engine. Supports reads alignment, methylation calling, DMR, annotation and visualization | https://bioconductor.org/packages/release/bioc/html/methylPipe.html | if (!requireNamespace(“BiocManager”, quietly = TRUE)) install.packages(“BiocManager”) BiocManager::install(“methylPipe”) |
[91] |
| Nextflow methylseq | Nextflow, python | Includes two pieplines: Bismark pipeline and BWA-METH pipeline. Provides head-to-toe analyses, including pre-alignment quality control of raw reads, quality filtering and adapter trimming, alignment, post-alignment quality control, methylation calling. Does not support annotation and DMR detection. A comphrehensive toolkit but require some experience in nextflow. | https://github.com/nf-core/methylseq | conda install -c bioconda nextflow | [92] |
| PiGx_bsseq | Python, R, Shell, M4 | Wrapper script of TrimGalore, FastQC, Bismark, methylKit, genomation. Analyses includes pre-alignment quality control of raw reads, quality filtering and adapter trimming, alignment, post-alignment quality control, methylation calling, differential methylation, segmentation and annotation. A comprehensive toolkit for beginners. | https://github.com/BIMSBbioinfo/pigx_bsseq | guix package -i pigx-bsseq | [93] |
| snakePipes | Python | Analyses includes pre-alignment quality control, quality filtering and trimming (fastp), reads alignment (bwa-meth), post-alignment quality metrics (e.g. bisulfite conversion rate, mapping rate, coverage metrics, and methylation bias), methylation calling, and DMR (DMRseq) detection. | https://snakepipes.readthedocs.io/en/latest/content/workflows/WGBS.html | conda create -n snakePipes -c mpi-ie -c conda-forge -c bioconda snakePipes==2.3.1 | [94] |
| MOABS | C++, C, Perl | Analyses includes reads alignment (BSMAP), post-alignment quality control, methylation calling and DMR detection. The highlight is the beta-binomial hierarchical model based DMR detection, capable of processing two billion reads in 24 CPU hours (cite). | https://github.com/sunnyisgalaxy/moabs | conda install moabs | [95] |
| Clusterflow | Pearl, Python, HTML, R | A cluster of standardized bioinformatics analyses on high-performance cluster environment. The component in each step of are standalone. A comprehensive tool includes multiple choices in read QC and pre-processing, alignment, post-alignment processing and post-alignment QC. The program is relatively easy and quick to set up, as well as flexible in choosing the suitable modules. Highly recommend to the researchers with some computational experiences. | https://github.com/ewels/ClusterFlow | git clone https://github.com/ewels/clusterflow.git | [96] |
5.2. Test Data
The test pair-end dataset is provided in the Supporting Information. The Homo sapiens genome assembly GRCh38/hg38 was obtained from https://hgdownload.soe.ucsc.edu/downloads.html.
5.3. Data Analysis
5.3.1. Pre-alignment quality control
The FASTQ file is one of the most common formats used in the analysis with some basic rules regarding the format: each entry consists of four lines represented by a sequence identifier, sequence, quality score identifier, and quality score (Figure 5). Paired end reads have two FASTQ entries with the conventions “_R1” and “_R2” written to the samples’ representing forward and reverse reads, respectively.
Figure 5. FASTQ file elements.

(1) Sequence identifier: starts with the symbol “@” followed by the necessary information for troubleshooting and demultiplexing: identification of the instrument, flow cell, lane, tile, coordinate information of the cluster within the title, the read number as a member of a pair (1 or 2), and the filter indication (Y indicates the read is filtered, while N is otherwise). (2) Sequence: base calls. (3) Quality score identifier line: this is the separator and is always a plus (+) sign. (4) Quality score: base call quality (Phred +33) encoded by ASCII characters representing numerical quality scores for the raw sequence in line 2. The meaning of the quality value characters is found at https://ascii.cl/.
Raw FASTQ quality of the R1 (WGBS_R1.fastq) and R2 (WGBS_R2.fastq) reads was measured using the following code:

The results consisted of a .html format summary and a .zip folder with quality figures. MultiQC combines samples with multiple FastQC results into one .html report. Confirmation that all QC reports are in the targeted directory was done before running the command (Figure 6).
Figure 6. Quality control report of FastQC.
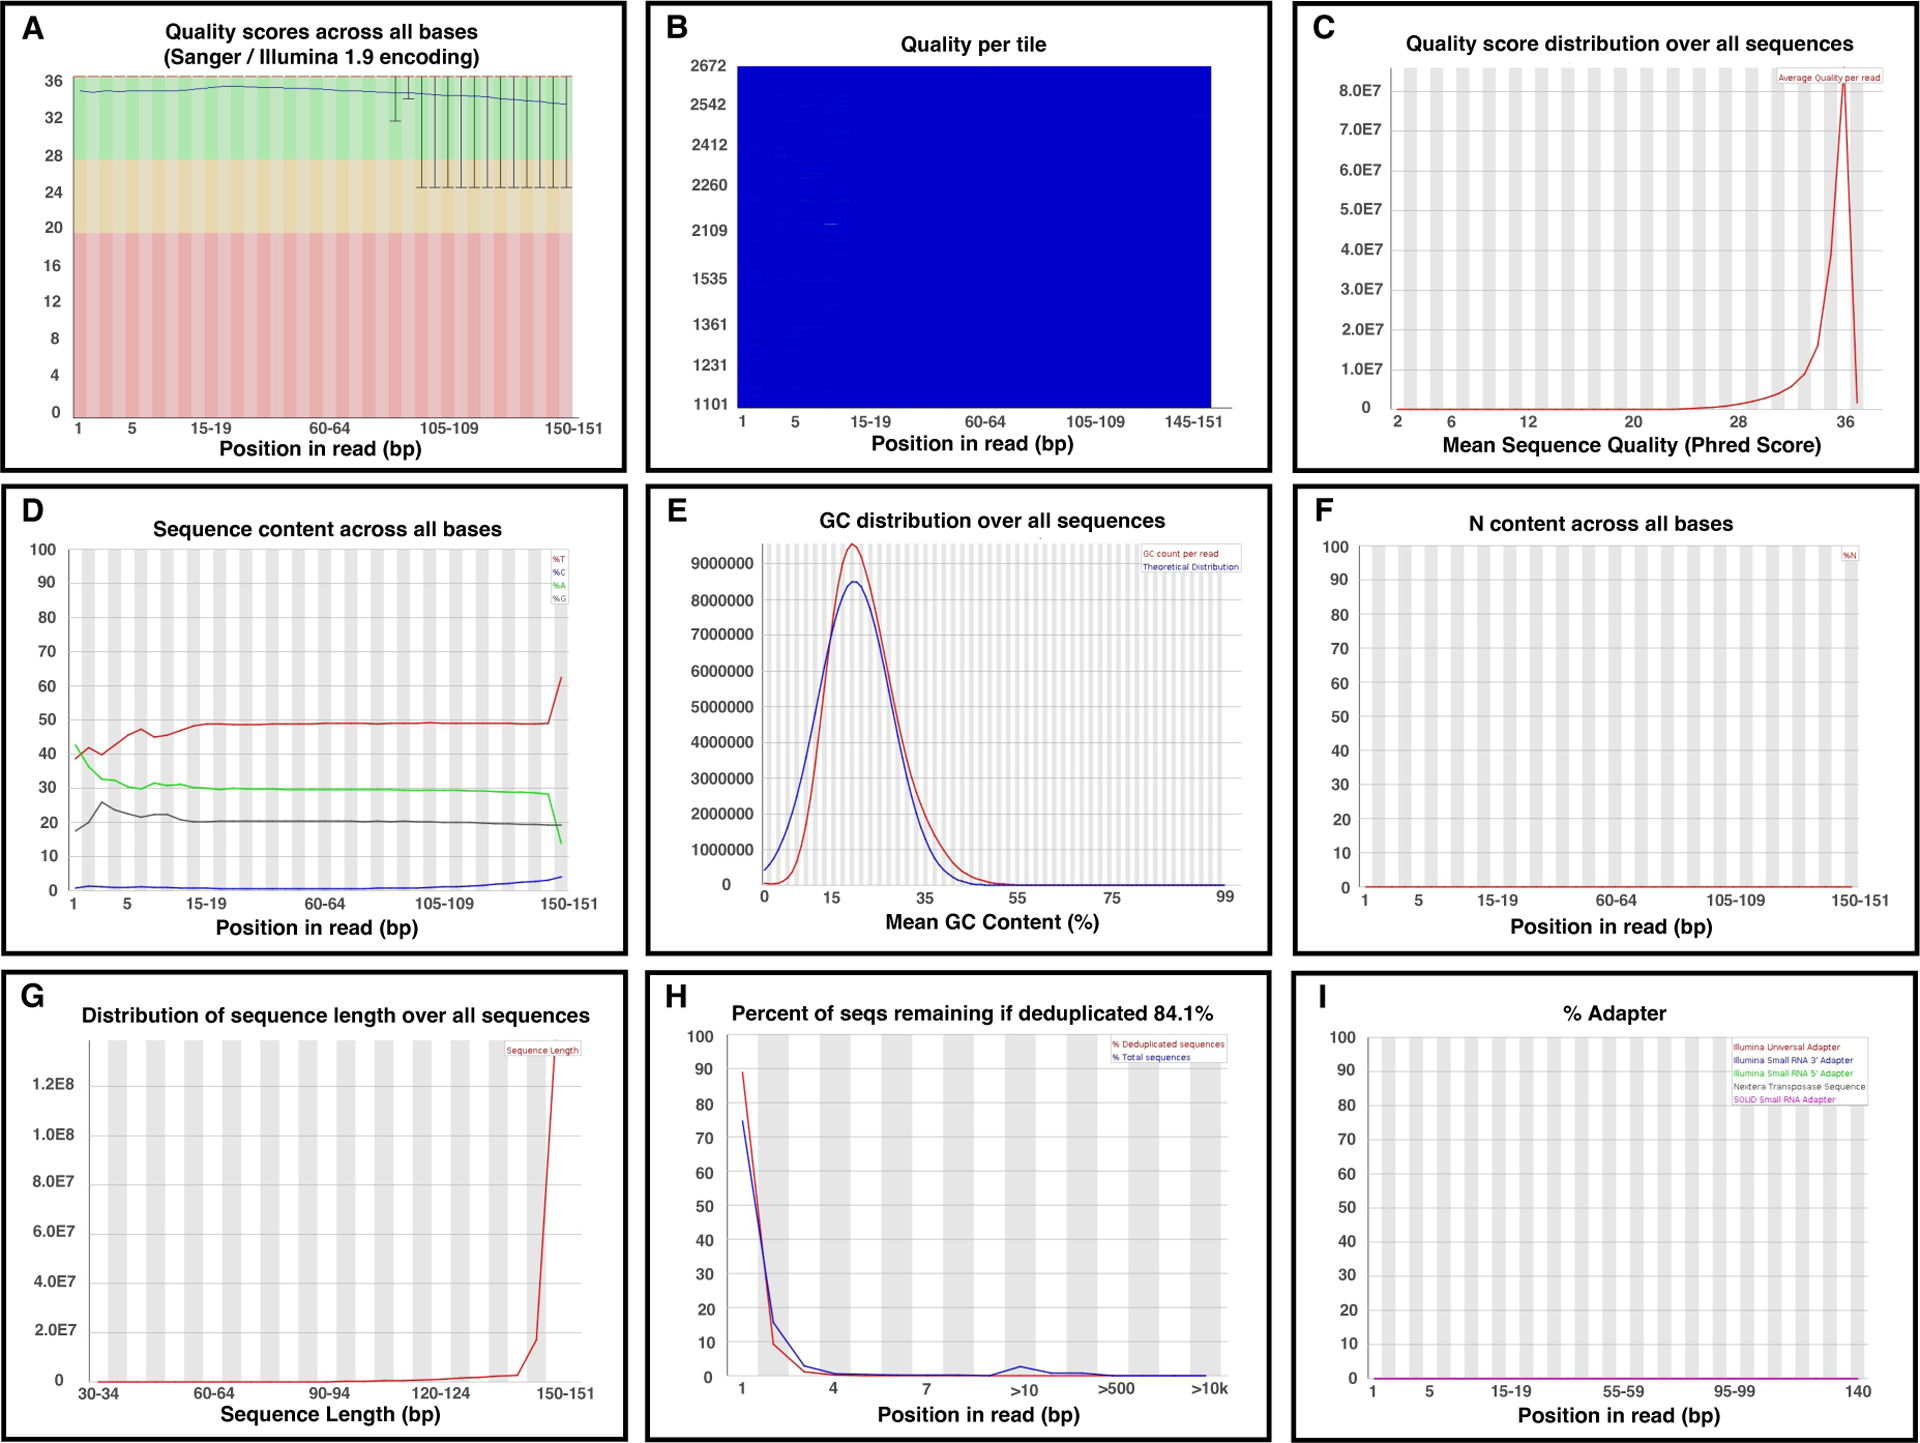
A. Per-base sequence quality. The boxplot shows the Phred quality scores across all read bases at each position in the input FASTQ file. The x-axis and y-axis represent the position of the reads and the quality score, respectively. The background colors categorize the quality into three levels: good quality (green), acceptable quality (yellow), and poor quality (red). Reduced quality calls are normally observed at the end of a read. The reads were qualified if the median for any base was ≥ 20 or the lower quartile for any base was ≥ 5. B. The per-tile sequence quality heat map is specific to Illumina libraries. Illumina maintains the original sequence identifiers, which allows quality checks of the encoded flowcell tiles of the reads. The cold (blue) and hot (red) colors indicate equal to or above average qualities of the running bases and below average qualities, respectively. Warnings are commonly observed in this part of the WGBS read. It is acceptable if the hotter colors are confined to a few specific areas and only impact a small range of tiles for limited cycles. The entire plot was blue. C. Per sequence quality scores provide an overview of the subset quality scores. This distribution is consistent with the per-base sequence quality boxplot. D. Per base sequence content plots the proportion of the four bases at each read position. The lines are parallel in eligible DNA sequencing, and the difference between the four bases is below 20% at all positions. However, a close-to-zero line of Cs and an overflow line of Ts is typically observed in WGBS data because the bisulfite conversion reduces read complexity. E. The per-sequence GC content compares the GC content distribution across the full input sequence reads to normal GC content distribution. However, methylated DNA shows skewed GC content due to bisulfite conversion. F. Per base N content is the percentage of bases with no base call (N) at each read position. A peaked N distribution suggests that the sequencer lacks confidence in deciding a valid base, which should be trimmed prior to alignment. G. WGBS data generated fragments of uniform length. The fragment size is the total length of the insert size and adapter. TruSeq libraries have short insert sizes causing increased vulnerability to adapter contamination and data loss. The sequence length had a mono-peak distribution. H. Sequence duplication level. Low and high duplication levels suggest high sequence coverage and low starting DNA quantity or PCR over-amplification, respectively. I. Adapter lines should be flat to zero; otherwise, adapter trimming is required in the next step.

5.3.2. Read trimming
This is essential to remove low-quality bases, overrepresented adapter sequences, and contaminant reads while maximizing the usable read length. Widely used trimming tools TrimGalore and Trimmomatic outperform other trimmers with respect to trim power and speed. TrimGalore contains auto-detect-adapter and post-trim-FastQC functions, which makes the trimming user-friendly; however, it is less aggressive than Trimmomatic.

The output and input directories were initially assigned with the default values used for a low-quality end trim (--quality 20 --phred33) since the overall QC of the data is known. TrimGalore auto-detects the nature of the adapter sequence; thus, it was not explicitly specified. The --pair parameter suggests that the pair-end reads are trimmed. The --trim1 parameter trims 1 bp from every 3’ end read, which may improve the alignment efficiency for Bismark processed paired-end data. The last parameter requires FastQC on the trimmed reads.
The command line below speeds up multiple pair-end FASTQ files.
![]()
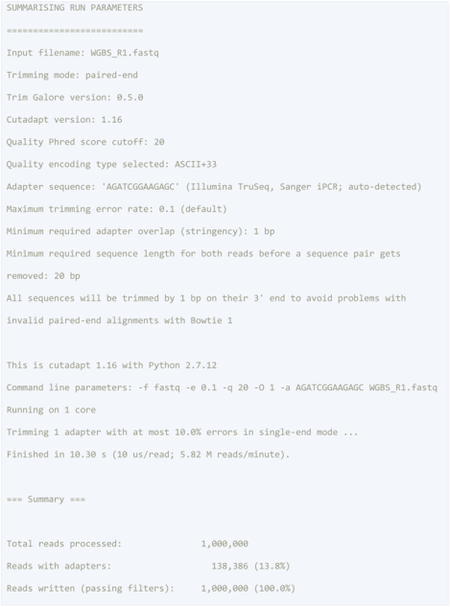
TrimGalore reports auto-detected adapter sequences and parameters in the command and contains detailed information on the percentage of trimmed bases. In the example below, 13.8% and 0.1% of bases were trimmed due to adapter sequences and low-quality scores, respectively. The quality of the raw data was acceptable and trimming improved the quality without excessive loss of information.

5.3.3. Alignment and methylation calling
Alignment is the most demanding process in this analysis with two aligners chosen: Bismark and BitMapperBS. Bismark is the most widely used aligner with companioned downstream visualization tools while BitMapperBS is the fastest and the least memory demanding.
Bismark
The reference genome was initially indexed:
![]()
A pair-end direction test of the data was performed to avoid incorrect R1 and R2 tag assignment (resulting in a zero-alignment rate) using the same seed for R1 and R2 reads before piping the data into the alignment step.
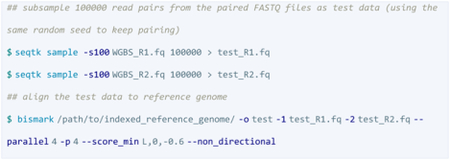
Bismark performs only two read alignments to the original top strand (OT) and the original bottom strand (OB) of a directional library and ignores the alignments coming from the strands complementary to OT (CTOT) and OB (CTOB) while all four strands provide valid alignments if a library is non-directional.
The best alignments came from OT and OB indicating that the labels for R1 and R2 were correct.
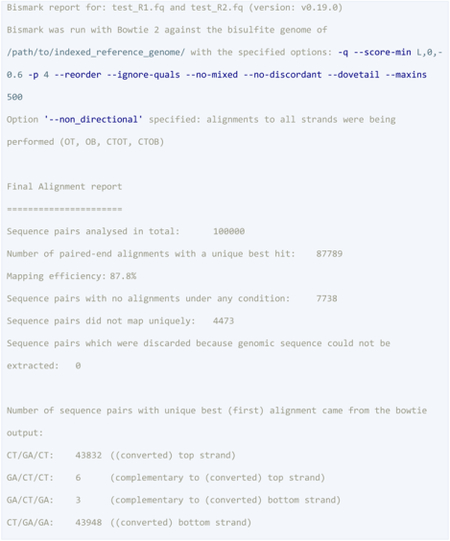
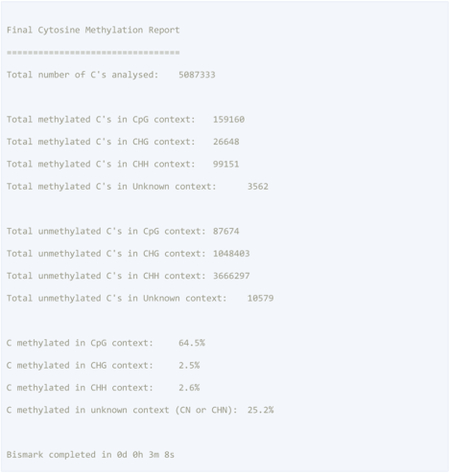
The data was processed by Bismark after the direction test using either Bowtie 1 or Bowtie 2 with the following instructions:

“--parallel 4” instructs Bismark to run 4 parallels while “-p 4” orders Bowtie 2 to run four threads; see below.
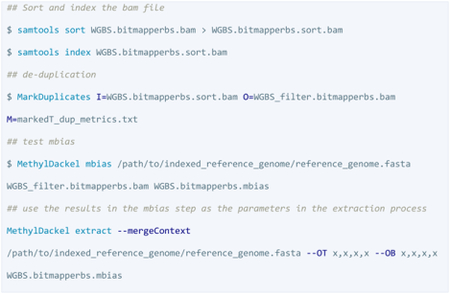
Bismark generates many temporary files when multiple files are aligned so Bismark is redirect to a temporary folder to avoid alignment failure. Bismark generates a BAM file and a txt-format report, which is visualized for quality control purposes. The BAM files should be sorted and indexed for deduplication before a bias plot check and methylation extraction.

Indexed and sorted BAM then undergoes a bias plot check with the parameter “remove (_r2)” only used for PBAT (SPLAT) libraries to remove random hexamers.

BitMapperBS
The reference genome was initially indexed as follows:
![]()
Then, the pair-end data was extracted by MethylDackel since BitMapperBS does not perform methylation extraction. Post-quality control reports using Qualimap or Samtools had discrepancies in unique alignment read rates compared with the BitMapperBS reports.

The BAM result then undergoes post-alignment quality control and methylation calling processes.
Annotation and analysis of DMRs
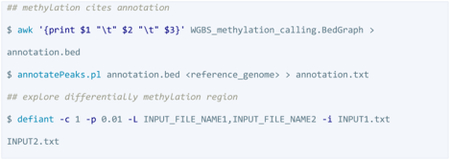
HOMER and Defiant was used to annotate the methylation sites and explore DMRs. The methylation calling results are in BedGraph format containing 5–6 columns (chromosome/start_postion/end_position/methylation_level/number_of_pairs_reporting_methylated_bases/ number_of_pairs_reporting_unmethylated_bases). The HOMER input should be in txt/BED format containing only chromosome position.
SeqMonk (https://www.bioinformatics.babraham.ac.uk/projects/seqmonk/) is a web-based analysis and visualization tool useful for genome browsing since it allows users to import and annotate any genomic features, quantify methylation, conduct comparative analyses, and perform multiple statistical tests between datasets or regions, including several methods to call DMRs. However, it may have some issues in taking BAMs generated from aligners other than Bismark due to flags in the BAM files. Despite this, it is highly recommended for its well-designed user-friendly interface.
6. Conclusion
DNA methylation and other epigenomic profiling dynamic markers are associated with the diagnosis and prognosis of different human diseases. Insightful and low-biased interpretations of the methylation outcomes are at the center of downstream biological mechanistic studies. In this review, we discuss the computational approaches for analyzing WGBS data and introduce the essential quality control analysis steps required to detect DMR from raw reads using available tools. Additionally, the potential confounders and countermeasures of methylation library preparations and data processing intrinsic to methylation are presented. We hope that potential users will understand the basic concepts in WGBS leading to the accelerated discovery of human diseases.
Supplementary Material
Acknowledgements
The authors appreciate the unknown referee’s valuable and profound comments. This work was supported by NIH grants (grant numbers R01CA223490 and R01CA230514).
Biography

Ting Gong is a Ph.D. candidate in Bioinformatics at University of Hawaii John A. Burns School of Medicine. She has a M.D. from the Shanghai Medical College, and M.P.H. in Epidemiology and Biostatistics from the Washington University in Saint Louis. Her areas of interest include machine learning, next generation sequencing, and cancer bioinformatics research. Off work, she enjoys dancing and restoring vintage antique leather.

Heather Borgard is a program manager for the bioinformatics core at University of Hawaii John A. Burns School of Medicine. She has a MSc in Biomedical Engineering from the University of British Columbia. She has several publications involving both biomedical and bioinformatics research. Her areas of interest include machine learning, predictive modeling, cancer research, and medical imaging.

Zao Zhang is a physician in internal medicine working in the hospital. He values humanity as important as science as it can guide and maximize the capacity of his daily patient care. Outside of his clinical practice, he is interested in clinical research and data science. He views data analysis as an important tool for discovering potential targets and analyzing the outcomes of treatments. Off work, he enjoys cooking, reading mysteries, traveling, and taking pictures of the Moon.

Youping Deng currently serves as the Director of Bioinformatics Core facility at JABSOM and Co-Director of Genomics Shared Resource at UH Cancer Center/JABSOM. His interests include Bioinformatics, biomedical informatics, cancer, genomics, systems biology. He has developed over 20 novel bioinformatics methods. He is currently section editor of BMC Medical Genomics and in charge of Bioinformatics algorithm and application section. He has published over 200 peer-reviewed publications due to his bioinformatics support, collaborative and independent research.
Conflict of Interest
The authors declare no conflict of interest.
Competing interests
The authors declare that they have no competing interests.
Availability of data and material
The WGBS raw reads dataset analyzed during the current study are available from the corresponding author upon reasonable request. The Homo sapiens genome assembly GRCh38 (hg38) was obtained from https://hgdownload.soe.ucsc.edu/downloads.html.
Reference:
- 1.Zamudio N, Barau J, Teissandier A et al. DNA methylation restrains transposons from adopting a chromatin signature permissive for meiotic recombination, Genes Dev 2015;29:1256–1270. [DOI] [PMC free article] [PubMed] [Google Scholar]
- 2.Ehrlich M, Wang RY. 5-Methylcytosine in eukaryotic DNA, Science 1981;212:1350–1357. [DOI] [PubMed] [Google Scholar]
- 3.Doskocil J, Sorm F. Distribution of 5-methylcytosine in pyrimidine sequences of deoxyribonucleic acids, Biochim Biophys Acta 1962;55:953–959. [DOI] [PubMed] [Google Scholar]
- 4.Greenberg MVC, Bourc’his D. The diverse roles of DNA methylation in mammalian development and disease, Nat Rev Mol Cell Biol 2019;20:590–607. [DOI] [PubMed] [Google Scholar]
- 5.Smith ZD, Meissner A. DNA methylation: roles in mammalian development, Nat Rev Genet 2013;14:204–220. [DOI] [PubMed] [Google Scholar]
- 6.Robertson KD. DNA methylation and human disease, Nat Rev Genet 2005;6:597–610. [DOI] [PubMed] [Google Scholar]
- 7.Horvath S, Zhang Y, Langfelder P et al. Aging effects on DNA methylation modules in human brain and blood tissue, Genome Biol 2012;13:R97. [DOI] [PMC free article] [PubMed] [Google Scholar]
- 8.Frommer M DM LEM, Collis CM, Watt F, Grigg GW, Molloy PL, and Paul CL. A genomic sequencing protocol that yields a positive display of 5-methylcytosine residues in individual DNA strands, Proc Natl Acad Sci USA 1992;89:5. [DOI] [PMC free article] [PubMed] [Google Scholar]
- 9.Stevens M, Cheng JB, Li D et al. Estimating absolute methylation levels at single-CpG resolution from methylation enrichment and restriction enzyme sequencing methods, Genome Res 2013;23:1541–1553. [DOI] [PMC free article] [PubMed] [Google Scholar]
- 10.Booth MJ, Ost TW, Beraldi D et al. Oxidative bisulfite sequencing of 5-methylcytosine and 5-hydroxymethylcytosine, Nat Protoc 2013;8:1841–1851. [DOI] [PMC free article] [PubMed] [Google Scholar]
- 11.Vaisvila R, Ponnaluri VKC, Sun Z et al. Enzymatic methyl sequencing detects DNA methylation at single-base resolution from picograms of DNA, Genome Res 2021. [DOI] [PMC free article] [PubMed] [Google Scholar]
- 12.Buenrostro JD, Wu B, Chang HY et al. ATAC-seq: A Method for Assaying Chromatin Accessibility Genome-Wide, Curr Protoc Mol Biol 2015;109:21 29 21–21 29 29. [DOI] [PMC free article] [PubMed] [Google Scholar]
- 13.Fraga MF, Fernâandez AF. Epigenomics in health and disease. Amsterdam ; Boston: Elsevier/Academic Press, 2016. [Google Scholar]
- 14.Olova N, Krueger F, Andrews S et al. Comparison of whole-genome bisulfite sequencing library preparation strategies identifies sources of biases affecting DNA methylation data, Genome Biol 2018;19:33. [DOI] [PMC free article] [PubMed] [Google Scholar]
- 15.Adusumalli S, Mohd Omar MF, Soong R et al. Methodological aspects of whole-genome bisulfite sequencing analysis, Brief Bioinform 2015;16:369–379. [DOI] [PubMed] [Google Scholar]
- 16.Head SR, Komori HK, LaMere SA et al. Library construction for next-generation sequencing: overviews and challenges, Biotechniques 2014;56:61–64, 66, 68, passim. [DOI] [PMC free article] [PubMed] [Google Scholar]
- 17.Cokus SJ, Feng S, Zhang X et al. Shotgun bisulphite sequencing of the Arabidopsis genome reveals DNA methylation patterning, Nature 2008;452:215–219. [DOI] [PMC free article] [PubMed] [Google Scholar]
- 18.Lister R, O’Malley RC, Tonti-Filippini J et al. Highly integrated single-base resolution maps of the epigenome in Arabidopsis, Cell 2008;133:523–536. [DOI] [PMC free article] [PubMed] [Google Scholar]
- 19.Xiang H, Zhu J, Chen Q et al. Single base-resolution methylome of the silkworm reveals a sparse epigenomic map, Nat Biotechnol 2010;28:516–520. [DOI] [PubMed] [Google Scholar]
- 20.Zemach A, McDaniel IE, Silva P et al. Genome-wide evolutionary analysis of eukaryotic DNA methylation, Science 2010;328:916–919. [DOI] [PubMed] [Google Scholar]
- 21.Raine A, Manlig E, Wahlberg P et al. SPlinted Ligation Adapter Tagging (SPLAT), a novel library preparation method for whole genome bisulphite sequencing, Nucleic Acids Res 2017;45:e36. [DOI] [PMC free article] [PubMed] [Google Scholar]
- 22.Adey A, Shendure J. Ultra-low-input, tagmentation-based whole-genome bisulfite sequencing, Genome Res 2012;22:1139–1143. [DOI] [PMC free article] [PubMed] [Google Scholar]
- 23.Miura F, Enomoto Y, Dairiki R et al. Amplification-free whole-genome bisulfite sequencing by post-bisulfite adaptor tagging, Nucleic Acids Res 2012;40:e136. [DOI] [PMC free article] [PubMed] [Google Scholar]
- 24.Miura F, Ito T. Highly sensitive targeted methylome sequencing by post-bisulfite adaptor tagging, DNA Res 2015;22:13–18. [DOI] [PMC free article] [PubMed] [Google Scholar]
- 25.Marcus B. Jones SKH, Anderson Ericka L., Li Weizhong, Dayrit Mark, Klitgord Niels, Fabani Martin M., Seguritan Victor, Green Jessica, Pride David T., Yooseph Shibu, Biggs William, Nelson Karen E., Venter J. Craig. Library preparation methodology can influence genomic and functional predictions in human microbiome research, Proc Natl Acad Sci USA 2015;112. [DOI] [PMC free article] [PubMed] [Google Scholar]
- 26.Feng S, Zhong Z, Wang M et al. Efficient and accurate determination of genome-wide DNA methylation patterns in Arabidopsis thaliana with enzymatic methyl sequencing, Epigenetics Chromatin 2020;13:42. [DOI] [PMC free article] [PubMed] [Google Scholar]
- 27.Urich MA, Nery JR, Lister R et al. MethylC-seq library preparation for base-resolution whole-genome bisulfite sequencing, Nat Protoc 2015;10:475–483. [DOI] [PMC free article] [PubMed] [Google Scholar]
- 28.Nair SS, Luu PL, Qu W et al. Guidelines for whole genome bisulphite sequencing of intact and FFPET DNA on the Illumina HiSeq X Ten, Epigenetics Chromatin 2018;11:24. [DOI] [PMC free article] [PubMed] [Google Scholar]
- 29.Analysing Bock C. and interpreting DNA methylation data, Nat Rev Genet 2012;13:705–719. [DOI] [PubMed] [Google Scholar]
- 30.Zhou L, Ng HK, Drautz-Moses DI et al. Systematic evaluation of library preparation methods and sequencing platforms for high-throughput whole genome bisulfite sequencing, Sci Rep 2019;9:10383. [DOI] [PMC free article] [PubMed] [Google Scholar]
- 31.Tan G, Opitz L, Schlapbach R et al. Long fragments achieve lower base quality in Illumina paired-end sequencing, Sci Rep 2019;9:2856. [DOI] [PMC free article] [PubMed] [Google Scholar]
- 32.Wreczycka K, Gosdschan A, Yusuf D et al. Strategies for analyzing bisulfite sequencing data, J Biotechnol 2017;261:105–115. [DOI] [PubMed] [Google Scholar]
- 33.Ekblom R, Wolf JB. A field guide to whole-genome sequencing, assembly and annotation, Evol Appl 2014;7:1026–1042. [DOI] [PMC free article] [PubMed] [Google Scholar]
- 34.Cheng H, Xu Y. BitMapperBS: a fast and accurate read aligner for whole-genome bisulfite sequencing, bioRxiv 2018. [Google Scholar]
- 35.Bock C, Tomazou EM, Brinkman AB et al. Quantitative comparison of genome-wide DNA methylation mapping technologies, Nat Biotechnol 2010;28:1106–1114. [DOI] [PMC free article] [PubMed] [Google Scholar]
- 36.Grehl C, Wagner M, Lemnian I et al. Performance of Mapping Approaches for Whole-Genome Bisulfite Sequencing Data in Crop Plants, Front Plant Sci 2020;11:176. [DOI] [PMC free article] [PubMed] [Google Scholar]
- 37.Tsuji J, Weng Z. Evaluation of preprocessing, mapping and postprocessing algorithms for analyzing whole genome bisulfite sequencing data, Brief Bioinform 2016;17:938–952. [DOI] [PMC free article] [PubMed] [Google Scholar]
- 38.Schbath S, Martin V, Zytnicki M et al. Mapping reads on a genomic sequence: an algorithmic overview and a practical comparative analysis, J Comput Biol 2012;19:796–813. [DOI] [PMC free article] [PubMed] [Google Scholar]
- 39.Langmead B, Wilks C, Antonescu V et al. Scaling read aligners to hundreds of threads on general-purpose processors, Bioinformatics 2019;35:421–432. [DOI] [PMC free article] [PubMed] [Google Scholar]
- 40.Langmead B Aligning short sequencing reads with Bowtie, Curr Protoc Bioinformatics 2010;Chapter 11:Unit 11 17. [DOI] [PMC free article] [PubMed] [Google Scholar]
- 41.Langmead B, Trapnell C, Pop M et al. Ultrafast and memory-efficient alignment of short DNA sequences to the human genome, Genome Biol 2009;10:R25. [DOI] [PMC free article] [PubMed] [Google Scholar]
- 42.Li H, Durbin R. Fast and accurate short read alignment with Burrows-Wheeler transform, Bioinformatics 2009;25:1754–1760. [DOI] [PMC free article] [PubMed] [Google Scholar]
- 43.H L. Aligning sequence reads, clone sequences and assembly contigs with BWA-MEM 2013. [Google Scholar]
- 44.Marco-Sola S, Sammeth M, Guigo R et al. The GEM mapper: fast, accurate and versatile alignment by filtration, Nat Methods 2012;9:1185–1188. [DOI] [PubMed] [Google Scholar]
- 45.Merkel A, Fernandez-Callejo M, Casals E et al. gemBS: high throughput processing for DNA methylation data from bisulfite sequencing, Bioinformatics 2019;35:737–742. [DOI] [PubMed] [Google Scholar]
- 46.Rauluseviciute I, Drablos F, Rye MB. DNA methylation data by sequencing: experimental approaches and recommendations for tools and pipelines for data analysis, Clin Epigenetics 2019;11:193. [DOI] [PMC free article] [PubMed] [Google Scholar]
- 47.Krueger F, Andrews SR. Bismark: a flexible aligner and methylation caller for Bisulfite-Seq applications, Bioinformatics 2011;27:1571–1572. [DOI] [PMC free article] [PubMed] [Google Scholar]
- 48.Harris EY, Ponts N, Le Roch KG et al. BRAT-BW: efficient and accurate mapping of bisulfite-treated reads, Bioinformatics 2012;28:1795–1796. [DOI] [PMC free article] [PubMed] [Google Scholar]
- 49.Harris EY, Ounit R, Lonardi S. BRAT-nova: fast and accurate mapping of bisulfite-treated reads, Bioinformatics 2016;32:2696–2698. [DOI] [PubMed] [Google Scholar]
- 50.Xi Y, Li W. BSMAP: whole genome bisulfite sequence MAPping program, BMC Bioinformatics 2009;10:232. [DOI] [PMC free article] [PubMed] [Google Scholar]
- 51.Wu TD, Reeder J, Lawrence M et al. GMAP and GSNAP for Genomic Sequence Alignment: Enhancements to Speed, Accuracy, and Functionality, Methods Mol Biol 2016;1418:283–334. [DOI] [PubMed] [Google Scholar]
- 52.Shang J, Zhu F, Vongsangnak W et al. Evaluation and comparison of multiple aligners for next-generation sequencing data analysis, Biomed Res Int; 2014:309650. [DOI] [PMC free article] [PubMed] [Google Scholar]
- 53.Manber Udi MG. Suffix Arrays: A New Method for On-Line String Searches, SIAM Journal on Computing 1993;22:14. [Google Scholar]
- 54.Cheng H, Wu M, Xu Y. FMtree: a fast locating algorithm of FM-indexes for genomic data, Bioinformatics 2018;34:416–424. [DOI] [PubMed] [Google Scholar]
- 55.Warnecke PM, Stirzaker C, Song J et al. Identification and resolution of artifacts in bisulfite sequencing, Methods 2002;27:101–107. [DOI] [PubMed] [Google Scholar]
- 56.Ji L, Sasaki T, Sun X et al. Methylated DNA is over-represented in whole-genome bisulfite sequencing data, Front Genet 2014;5:341. [DOI] [PMC free article] [PubMed] [Google Scholar]
- 57.MethylDackel A (mostly) universal methylation extractor for BS-seq experiments. https://github.com/dpryan79/MethylDackel, accessed: 11, 2021.
- 58.Hansen KD, Langmead B, Irizarry RA. BSmooth: from whole genome bisulfite sequencing reads to differentially methylated regions, Genome Biol 2012;13:R83. [DOI] [PMC free article] [PubMed] [Google Scholar]
- 59.Hebestreit KKH. BiSeq: Processing and analyzing bisulfite sequencing data. 2021.
- 60.Juhling F, Kretzmer H, Bernhart SH et al. metilene: fast and sensitive calling of differentially methylated regions from bisulfite sequencing data, Genome Res 2016;26:256–262. [DOI] [PMC free article] [PubMed] [Google Scholar]
- 61.Akalin A, Kormaksson M, Li S et al. methylKit: a comprehensive R package for the analysis of genome-wide DNA methylation profiles, Genome Biol 2012;13:R87. [DOI] [PMC free article] [PubMed] [Google Scholar]
- 62.Condon DE, Tran PV, Lien YC et al. Defiant: (DMRs: easy, fast, identification and ANnoTation) identifies differentially Methylated regions from iron-deficient rat hippocampus, BMC Bioinformatics 2018;19:31. [DOI] [PMC free article] [PubMed] [Google Scholar]
- 63.FastQC A Quality Control tool for High Throughput Sequence Data. http://www.bioinformatics.babraham.ac.uk/projects/fastqc/, accessed: 11, 2021.
- 64.Roser LG, Aguero F, Sanchez DO. FastqCleaner: an interactive Bioconductor application for quality-control, filtering and trimming of FASTQ files, BMC Bioinformatics 2019;20:361. [DOI] [PMC free article] [PubMed] [Google Scholar]
- 65.Chen S, Zhou Y, Chen Y et al. fastp: an ultra-fast all-in-one FASTQ preprocessor, Bioinformatics 2018;34:i884–i890. [DOI] [PMC free article] [PubMed] [Google Scholar]
- 66.M M. Cutadapt removes adapter sequences from high-throughput sequencing reads, EMBnetjournal 2011;7. [Google Scholar]
- 67.Bolger AM, Lohse M, Usadel B. Trimmomatic: a flexible trimmer for Illumina sequence data, Bioinformatics 2014;30:2114–2120. [DOI] [PMC free article] [PubMed] [Google Scholar]
- 68.Guo W, Fiziev P, Yan W et al. BS-Seeker2: a versatile aligning pipeline for bisulfite sequencing data, BMC Genomics 2013;14:774. [DOI] [PMC free article] [PubMed] [Google Scholar]
- 69.Frith MC, Mori R, Asai K. A mostly traditional approach improves alignment of bisulfite-converted DNA, Nucleic Acids Res 2012;40:e100. [DOI] [PMC free article] [PubMed] [Google Scholar]
- 70.Lim JQ, Tennakoon C, Li G et al. BatMeth: improved mapper for bisulfite sequencing reads on DNA methylation, Genome Biol 2012;13:R82. [DOI] [PMC free article] [PubMed] [Google Scholar]
- 71.Saito Y, Tsuji J, Mituyama T. Bisulfighter: accurate detection of methylated cytosines and differentially methylated regions, Nucleic Acids Res 2014;42:e45. [DOI] [PMC free article] [PubMed] [Google Scholar]
- 72.Li H, Handsaker B, Wysoker A et al. The Sequence Alignment/Map format and SAMtools, Bioinformatics 2009;25:2078–2079. [DOI] [PMC free article] [PubMed] [Google Scholar]
- 73.Garcia-Alcalde F, Okonechnikov K, Carbonell J et al. Qualimap: evaluating next-generation sequencing alignment data, Bioinformatics 2012;28:2678–2679. [DOI] [PubMed] [Google Scholar]
- 74.Pedersen BS, Collins RL, Talkowski ME et al. Indexcov: fast coverage quality control for whole-genome sequencing, Gigascience 2017;6:1–6. [DOI] [PMC free article] [PubMed] [Google Scholar]
- 75.Institute B Picard Tools. http://broadinstitute.github.io/picard/, accessed: 11, 2021.
- 76.Heinz S, Benner C, Spann N et al. Simple combinations of lineage-determining transcription factors prime cis-regulatory elements required for macrophage and B cell identities, Mol Cell 2010;38:576–589. [DOI] [PMC free article] [PubMed] [Google Scholar]
- 77.Kinsella RJ, Kahari A, Haider S et al. Ensembl BioMarts: a hub for data retrieval across taxonomic space, Database (Oxford); 2011:bar030. [DOI] [PMC free article] [PubMed] [Google Scholar]
- 78.H P. BSgenome: Software infrastructure for efficient representation of full genomes and their SNPs 2020.
- 79.Stockwell PA, Chatterjee A, Rodger EJ et al. DMAP: differential methylation analysis package for RRBS and WGBS data, Bioinformatics 2014;30:1814–1822. [DOI] [PubMed] [Google Scholar]
- 80.Korthauer K, Chakraborty S, Benjamini Y et al. Detection and accurate false discovery rate control of differentially methylated regions from whole genome bisulfite sequencing, Biostatistics 2019;20:367–383. [DOI] [PMC free article] [PubMed] [Google Scholar]
- 81.Park Y, Figueroa ME, Rozek LS et al. MethylSig: a whole genome DNA methylation analysis pipeline, Bioinformatics 2014;30:2414–2422. [DOI] [PMC free article] [PubMed] [Google Scholar]
- 82.Khan A, Mathelier A. Intervene: a tool for intersection and visualization of multiple gene or genomic region sets, BMC Bioinformatics 2017;18:287. [DOI] [PMC free article] [PubMed] [Google Scholar]
- 83.mwaskom/seaborn. 10.5281/zenodo.592845], accessed: 11, 2021. [DOI]
- 84.JD H Matplotlib: A 2D graphics environment, Computing in Science & Engineering 2007;9. [DOI] [PMC free article] [PubMed] [Google Scholar]
- 85.Krzywinski M, Schein J, Birol I et al. Circos: an information aesthetic for comparative genomics, Genome Res 2009;19:1639–1645. [DOI] [PMC free article] [PubMed] [Google Scholar]
- 86.A tool to visualise and analyse high throughput mapped sequence data. https://www.bioinformatics.babraham.ac.uk/projects/seqmonk/, accessed: 11, 2021.
- 87.Woste M, Leitao E, Laurentino S et al. wg-blimp: an end-to-end analysis pipeline for whole genome bisulfite sequencing data, BMC Bioinformatics 2020;21:169. [DOI] [PMC free article] [PubMed] [Google Scholar]
- 88.Liao WW, Yen MR, Ju E et al. MethGo: a comprehensive tool for analyzing whole-genome bisulfite sequencing data, BMC Genomics 2015;16 Suppl 12:S11. [DOI] [PMC free article] [PubMed] [Google Scholar]
- 89.Grana O, Lopez-Fernandez H, Fdez-Riverola F et al. Bicycle: a bioinformatics pipeline to analyze bisulfite sequencing data, Bioinformatics 2018;34:1414–1415. [DOI] [PubMed] [Google Scholar]
- 90.Helene Kretzmer CO, Steve Hoffmann. BAT: Bisulfite Analysis Toolkit: BAT is a toolkit to analyze DNA methylation sequencing data accurately and reproducibly. It covers standard processing and analysis steps from raw read mapping up to annotation data integration and calculation of correlating DMRs, F1000Res 2017;6. [DOI] [PMC free article] [PubMed] [Google Scholar]
- 91.Jiang P, Sun K, Lun FM et al. Methy-Pipe: an integrated bioinformatics pipeline for whole genome bisulfite sequencing data analysis, PLoS One 2014;9:e100360. [DOI] [PMC free article] [PubMed] [Google Scholar]
- 92.Ewels PA, Peltzer A, Fillinger S et al. The nf-core framework for community-curated bioinformatics pipelines, Nat Biotechnol 2020;38:276–278. [DOI] [PubMed] [Google Scholar]
- 93.Wurmus R, Uyar B, Osberg B et al. PiGx: reproducible genomics analysis pipelines with GNU Guix, Gigascience 2018;7. [DOI] [PMC free article] [PubMed] [Google Scholar]
- 94.Bhardwaj V, Heyne S, Sikora K et al. snakePipes: facilitating flexible, scalable and integrative epigenomic analysis, Bioinformatics 2019;35:4757–4759. [DOI] [PMC free article] [PubMed] [Google Scholar]
- 95.Sun D, Xi Y, Rodriguez B et al. MOABS: model based analysis of bisulfite sequencing data, Genome Biol 2014;15:R38. [DOI] [PMC free article] [PubMed] [Google Scholar]
- 96.Ewels P, Krueger F, Kaller M et al. Cluster Flow: A user-friendly bioinformatics workflow tool, F1000Res 2016;5:2824. [DOI] [PMC free article] [PubMed] [Google Scholar]
Associated Data
This section collects any data citations, data availability statements, or supplementary materials included in this article.
Supplementary Materials
Data Availability Statement
The WGBS raw reads dataset analyzed during the current study are available from the corresponding author upon reasonable request. The Homo sapiens genome assembly GRCh38 (hg38) was obtained from https://hgdownload.soe.ucsc.edu/downloads.html.


