

INTRODUCTION:
The IMMray PanCan-d test combines an 8-plex biomarker signature with CA19-9 in a proprietary algorithm to detect pancreatic ductal adenocarcinoma (PDAC) in serum samples. This study aimed to validate the clinical performance of the IMMray PanCan-d test and to better understand test performance in Lewis-null (le/le) individuals who cannot express CA19-9.
METHODS:
Serum samples from 586 individuals were analyzed with the IMMray PanCan-d biomarker signature and CA19-9 assay, including 167 PDAC samples, 203 individuals at high risk of familial/hereditary PDAC, and 216 healthy controls. Samples were collected at 11 sites in the United States and Europe. The study was performed by Immunovia, Inc (Marlborough, MA), and sample identity was blinded throughout the study. Test results were automatically generated using validated custom software with a locked algorithm and predefined decision value cutoffs for sample classification.
RESULTS:
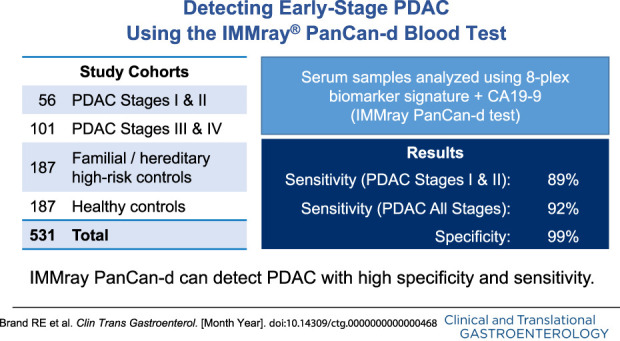
The IMMray PanCan-d test distinguished PDAC stages I and II (n = 56) vs high-risk individuals with 98% specificity and 85% sensitivity and distinguished PDAC stages I–IV vs high-risk individuals with 98% specificity and 87% sensitivity. We identified samples with a CA19-9 value of 2.5 U/mL or less as probable Lewis-null (le/le) individuals. Excluding these 55 samples from the analysis increased the IMMray PanCan-d test sensitivity to 92% for PDAC stages I–IV (n = 157) vs controls (n = 379) while maintaining specificity at 99%; test sensitivity for PDAC stages I and II increased from 85% to 89%.
DISCUSSION:
These results demonstrate the IMMray PanCan-d blood test can detect PDAC with high specificity (99%) and sensitivity (92%).
INTRODUCTION
Pancreatic ductal adenocarcinoma (PDAC) is one of the most lethal human cancers, with an increasing incidence and a 5-year survival of <10% (1,2). It is expected that PDAC will become the second leading cause of cancer deaths in the United States by 2030, surpassing colon cancer (3). The key to improve survival is early detection during a potentially curable stage. Early-stage PDAC is usually asymptomatic or with only nonspecific symptoms. Thus, most patients present late in their clinical course with advanced nonresectable disease. Typically, only 20% of sporadic PDACs are diagnosed during a potentially resectable stage (1,2). One recent surveillance study of high-risk, asymptomatic individuals with germline CDKN2A mutations reported a 75% detection rate of resectable tumors, resulting in a 5-year survival rate of 24%, which is substantially longer than in sporadic cases (6,7). Taken together, these findings suggest that earlier diagnosis could significantly increase survival for patients with PDAC (4,5,8,9) and that active surveillance of high-risk individuals can improve their survival (5,10). Unfortunately, only a minority of at-risk individuals (21% in a recent study) are enrolled in surveillance programs (11).
There is no gold standard for the diagnosis of PDAC, particularly during early stages. Imaging modalities such as magnetic resonance imaging and endoscopic ultrasound are currently the mainstay, but neither is 100% sensitive or specific. Fine-needle aspiration and needle biopsy can also be unreliable for diagnosing small lesions for which precise geographic targeting can be problematic. The most extensively evaluated blood-based PDAC biomarker is CA19-9, which has limited specificity, because elevated CA19-9 levels are associated with other clinical conditions. Furthermore, low or negative CA19-9 expression in individuals who are genotypically Lewis antigen null (i.e., le/le with mutations in both copies of the FUT3 gene (12–14)) further limits the reliability of this biomarker for PDAC detection. The frequency of the Lewis-null phenotype varies in different ethnic groups from 6% to more than 20% (15), compromising the sensitivity of CA19-9 as a PDAC biomarker. Although CA19-9 is not currently recommended for PDAC screening (16–18), its value as an anchor marker to aid in PDAC detection has recently been proposed (14,19).
Reliable and effective biomarkers are an important unmet clinical need for individuals at an increased risk of PDAC; thus, the objective of this study was the clinical validation of a multibiomarker signature for PDAC that encompasses both immunoregulatory and cancer-associated biomarkers (20–30). The IMMray PanCan-d assay was developed using concepts reported (30) with subsequent refinements, including the addition of conventional tumor biomarkers to increase the robustness of the assay and decrease the number of biomarkers used in the final 9-plex biomarker signature. After development in the Commercial Test Model Study (CTMS) (31), the IMMray PanCan-d algorithm and cutoff thresholds were locked. The results reported in this study describe the application of this IMMray PanCan-d test to large cohorts of individuals with PDAC, healthy individuals, and individuals at an increased genetic/familial risk of PDAC. Of importance, this latter cohort corresponds to the target population for testing with IMMray PanCan-d, that is, individuals at high risk of developing PDAC. This validation study included only samples that had not previously been tested with IMMray PanCan-d.
METHODS
Sample cohorts
Three sample cohorts were analyzed in this study: healthy individuals, individuals at high familial genetic risk of PDAC (PanFAM), and patients with PDAC (Table 1). The healthy cohort included individuals from multiple sites in the United States and Europe, was ethnically diverse, and had no history of or concurrent cancer. The familial/genetic high-risk cohort was collected from 3 US sites (University of Pittsburgh Medical Center, Massachusetts General Hospital, and University of Pennsylvania) participating in the PanFAM prospective clinical trial (ClinicalTrials.gov Identifier: NCT03693378) and comprised individuals with a strong family history of pancreatic cancer and/or individuals with known genetic mutations predisposing to PDAC who meet current criteria of PDAC surveillance (Table 2). None of the individuals tested were known to have developed PDAC at the time of sample collection.
Table 1.
Collection sites for study samples
| Sample origin | Cohort | ||
| Healthy | PanFAM | PDAC | |
| Beth Israel Deaconess Medical Center | 10 | ||
| Helsinki University Hospital, Finland | 29 | ||
| Massachusetts General Hospital | 76 | ||
| Mt. Sinai Medical Center | 19 | ||
| Sahlgrenska University Hospital, Gothenburg, Sweden | 79 | ||
| Ramón y Cajal Research Institute – IRYCIS, CIBERONC, Alcala University, Madrid, Spain | 13 | 19 | |
| Sweden Biobank (Växjö) | 100 | ||
| Hospital of the University of Pennsylvania | 51 | ||
| University of Pittsburgh Medical Center | 76 | 11 | |
| US Biobanks (Discovery Life Sciences, Huntsville, Alabama, and BioIVT, Westbury, New York) | 103 | ||
PDAC, pancreatic ductal adenocarcinoma.
Table 2.
Inclusion criteria for the PanFAM study (individuals at high risk of developing familial or hereditary PDAC)
| Age | |
| Two or more relatives with PDAC on the same side of the family, where 2 PDAC-affected individuals are FDR + at least 1 PDAC-affected individual is an FDR of the participant | Aged 50 yr or older OR 10 yr before onset in family |
| Two affected FDRs with PDAC | ≥50 yr old OR 10 yr before onset in family |
| Any of BRCA1, BRCA2, PALB2, or ATM mutations confirmed pathogenic or likely pathogenic + 1 FDR or SDR with PDAC | ≥50 yr old OR 10 yr before onset of an FDR and SDR |
| FAMMM with confirmed pathogenic or likely pathogenic mutation variants in: p16, CDKN2A | ≥50 yr old |
| Known mutation carrier for STK11 (Peutz Jeghers syndrome) | ≥35 yr old |
| Lynch syndrome (HNPCC) with confirmed pathogenic or likely pathogenic variants in the following: MLH1, MSH2, MSH6, PMS2, or EPCAM + 1 FDR or SDR with PDAC | ≥50 yr old OR 10 yr before onset of an FDR or SDR |
| Hereditary pancreatitis with confirmed PRSS1 pathogenic or likely pathogenic history of pancreatitis | ≥40 yr old |
FAMMM, familial atypical multiple mole-melanoma; FDR, first degree related; HNPCC, Hereditary Nonpolyposis Colorectal Cancer; PDAC, pancreatic ductal adenocarcinoma; SDR, secondary degree related.
PDAC samples were collected from multiple sites in Europe and the United States and included 56 early-stage (stages I and II) patients with PDAC. All serum samples were collected using a standard sample collection protocol. In brief, blood samples were collected in red top tubes and allowed to clot for 30–60 minutes before centrifugation for 10 minutes at 3,000g. Serum was then removed and aliquoted in cryovials and immediately frozen at −80 °C. Samples were shipped on dry ice and then thawed for analysis. All samples were analyzed within 2 years of collection, and all were stored frozen at −80 °C until thawed for analysis. PDAC staging was performed according to the American Joint Committee on Cancer Guidelines (31). Blood samples from patients with histologically confirmed PDAC were collected and processed before surgical or adjuvant treatment. Samples were blinded to laboratory personnel and randomized using an Excel template designed to avoid an overabundance of any cohort in any assay batch (maximum batch size was 62 samples).
IMMray PanCan-d biomarker assay
IMMray PanCan-d is a multiplex immunoassay that combines measurements of 9 serum biomarkers including CA19-9 using a mathematical algorithm. This signature was created and locked during CTMS using a support vector algorithm (31). The resulting signature algorithm can be expressed as a linear equation composed of the levels of 9 serum biomarkers included in the signature (log2-transformed fluorescence intensity) multiplied by real number coefficients:
A1*(log2 intensity 1) + A2*(log2 intensity 2) + … + A9*(log2 intensity 9) + C = Decision Value
A1–A9 are real number coefficients determined from the support vector algorithm, and C is the Y intercept for this linear equation. The identities of the IMMray PanCan-d single chain variable fragment antibodies are listed in Table 3.
Table 3.
Single-chain variable fragment antibodies included in the IMMray PanCan-d test
| Single-chain variable fragment antibody | Function of antibody target |
| A1026 | Tumor associated |
| A1048 | Hormone transport |
| A1065 | Bone metabolism |
| PC105 | Complement |
| PC150 | Protease inhibitor |
| PC157 | Complement |
| PC165 | Complement |
| PC242 | Coagulation |
Barcoded serum samples were analyzed with an antibody microarray platform composed of 8 single-chain variable fragment directed against 8 antigens after biotinylation (NHS-PEG4-Biotin No-Weigh Format; Thermo Fisher Scientific, Waltham, MA). The biotinylation reagent was quenched with Tris HCL, pH 7.5, and samples were diluted in phosphate-buffered saline containing tween and dissolved milk powder as a blocking agent before being pipetted onto microarrays. Each sample was analyzed in duplicate on blocked arrays on resin-coated slides (Thermo Scientific Nunc; Immunovia AB). After incubation, arrays were individually washed and then incubated with Streptavidin, Alexa Fluor 647 conjugate (Molecular Probes). After washing, array slides were dried and immediately scanned using an InnoScan 710 AL (Innopsys) microarray scanner. CA19-9 was measured separately using a Roche Cobas E411 Analyzer (Roche Diagnostics, Mannheim, Germany) according to the manufacturer's instructions.
Data analysis
High resolution images of each microarray slide were uploaded to cloud-based custom software (IMMray Evaluation Software, IES; Immunovia AB, Lund, Sweden), which matched the slide's barcode with its sample map and with the CA19-9 results uploaded from the Cobas E411 Analyzer (Roche). Spot alignment was performed by the software, followed by manual inspection and adjustment if required. The intensity of individual pixels in each spot and the associated background was measured, and outlier pixels (top and bottom 5%) were eliminated. The median intensity of each spot was then trimmed by subtracting the background fluorescence (median net trimmed signal). These trimmed signals were then log 2 transformed and normalized using the results of 6 calibrator samples included in each assay batch. Normalized intensities were then scaled as Z scores (mean = 0, SD = 1) based on the distribution of the sample results used to construct the model (CTMS). Scaled intensities were then multiplied by the appropriate coefficient (see abovementioned linear equation) to calculate decision values that are predictive of the individual's PDAC status relative to the predefined threshold. Positive and negative control results, statistical analysis of measured signal intensities, array background, number of excluded spots, magnitude of normalization factors, and comparison between duplicate arrays provided quality control measures for all aspects of the assay. Results were accepted as valid only if all QC parameters for each sample and batch were within predefined limits.
Decision values for each array were compared with predefined cutoffs for positive (<0.054), negative (>0.554), and borderline (>0.054 and <0.554) classifications. Samples were finally classified based on their duplicate array results as follows: positive/positive = positive; negative/negative = negative; borderline/any result = borderline. The borderline category is designed to prevent analytical variation in the assay from producing a false-positive or false-negative result and is supported by Monte Carlo analysis using the measured SDs of each of the 9 analytes for each sample's array pair (data not shown).
After valid results were obtained for all samples in the study (1 sample was excluded because of repeated QC failures), the sample results were unblinded and compared with the clinical history of each subject (healthy, PanFAM, or PDAC). Receiver operating characteristic (ROC) area under the curve (AUC) values and sensitivity/specificity were calculated based on these comparisons.
RESULTS
Characteristics of the sample cohorts
The median age of PDAC patients was 70 years, which was 11 years older than the PanFAM surveillance population, as expected. Both cohorts included individuals older than those in the healthy cohort, which had a median age of 49 years (Table 4). Women were overrepresented in the PanFAM cohort, whereas the PDAC cohort had more male than female individuals, as expected. Twenty-eight percentage of the PanFAM cohort had a history of cancers (Table 3) and were either cured or were in remission at the time of study entry. This high rate of previous neoplasms is not unexpected in a cohort with documented germline mutations predisposing to PDAC and other tumor types. Collectively, the 203 PanFAM subjects were receiving 619 prescription medications, some of which were related to their previous cancers (e.g., aromatase inhibitors). All individuals in the PanFAM cohort were under active imaging surveillance, and 25% exhibited clinically suspected intraductal papillary mucinous neoplasms (IPMNs) and 27% other pancreatic imaging abnormalities. IPMNs ranged from 1 to 10 in number (median 2) and from 0.2 to 2.2 cm in size (median 0.6). None of the IPMNs were categorized as main-duct IPMNs, and no worrisome features were described.
Table 4.
Study cohort characteristics
| Cohort | Median age (yr) | Male (%) | History of cancer | IPMNs | Other imaging abnormalities |
| Healthy | 49 | 51 | 0% | — | — |
| PanFAM | 59 | 36 | 28% | 25% | 27% |
| PDAC | 70 | 58 | — | — | — |
IMPN, intraductal papillary mucinous neoplasms; PDAC, pancreatic ductal adenocarcinoma.
IMMray PanCan-d results using a locked signature and predefined classification cutoffs
The distribution of decision values for the 3 sample cohorts is shown graphically in Figure 1. The results for the healthy and PanFAM cohorts are tightly clustered and seem similar to one another, although they were statistically different by t test (P < 0.001). The mean decision values for the Healthy and PanFAM cohorts were 1.65 and 1.40, respectively, with corresponding SDs of 0.68 and 0.67. Both these cohorts were quite different from the PDAC cohort that showed a much wider decision value distribution (−4.75 to 2.5) with a strong negative bias (the mean decision value was −1.26 with an SD of 1.58).
Figure 1.

Distribution of decision values in the 3 cohorts.
Excluding borderline results (see Data Analysis section), these decision values correspond to the following ROC AUC curves (Figure 2). Based on this analysis, IMMray PanCan-d sensitivity for early-stage (stages I and II) PDAC was 85% and 87% for all-stage PDAC with specificity of 98% against the PanFAM cohort and 99% against the healthy cohort. CA19-9 alone using the clinical reference range cutoff showed 75.8% sensitivity and 97.6% specificity in these cohorts.
Figure 2.

ROC curve comparison between PDAC (early-stage and all-stage PDAC) and the healthy and PanFAM cohorts. PDAC, pancreatic ductal adenocarcinoma; ROC, receiver operating characteristic.
Overall, 10% of samples were classified as borderline with a higher percentage of borderline results among the PDAC cohort than in the control cohorts (Table 5). The distribution of IMMray PanCan-d results by PDAC stage, sex, and smoking status are also shown. A comparison of the test classifications with sex or smoking status did not reach statistical significance by the χ2 test, P = 0.48 and P = 0.61, respectively.
Table 5.
IMMray PanCan-d result by cohort, PDAC stage, sex, and smoking history
| IMMray PanCan-d result (%) | |||
| Negative | Borderline | Positive | |
| Cohort | |||
| Healthy | 201 (93) | 13 (6) | 2 (1) |
| PanFAM | 180 (89) | 20 (10) | 3 (1) |
| PDAC | 19 (11) | 23 (14) | 125 (75) |
| PDAC stage | |||
| I | 0 | 0 | 1 |
| IA | 0 | 2 | 3 |
| IB | 3 | 3 | 12 |
| IIA | 0 | 1 | 6 |
| IIB | 4 | 4 | 17 |
| III | 5 | 7 | 26 |
| IV | 5 | 4 | 48 |
| Unknown | 2 | 2 | 12 |
| Sex | |||
| Male | 33 | 6 | 14 |
| Female | 32 | 5 | 11 |
| Smoking status | |||
| Current | 17 | 2 | 1 |
| Former | 20 | 3 | 2 |
| Never | 46 | 5 | 5 |
PDAC, pancreatic ductal adenocarcinoma.
The median ages for negative and borderline classifications in the PanFAM cohort were 59 and 60 years. The median ages for negative, borderline, and positive classifications in the PDAC cohort were 68, 71, and 71 years, respectively.
The distribution of results by imaging status for the PanFAM cohort is summarized in Table 6. A comparison of the test classifications with imaging findings shows an excess of imaging abnormalities in subjects classified as borderline (18%) compared with those classified as negative (7%), but this difference did not reach statistical significance by the χ2 test, P = 0.17. The decision values obtained in this study show a distribution of results that is very similar to that obtained in the CTMS study that was used to develop the final locked signature for IMMray PanCan-d in 2019 (Figure 3 and Table 7).
Table 6.
IMMray PanCan-d results in PanFAM subjects by imaging findings
| Imaging findings | IMMray PanCan-d results | ||
| Negative | Borderline | Positive | |
| Normal | 103 | 7 | 2 |
| IPMN | 41 | 9 | 1 |
| Parenchymal abnormalities | 48 | 7 | 0 |
Some specimens exhibited both IPMN and parenchymal abnormalities.
IMPN, intraductal papillary mucinous neoplasms.
Figure 3.

Decision values from Commercial Test Model Study.
Table 7.
IMMray PanCan-d Classification of PDAC samples by stage, excluding samples with CA19-9 <2.5
| Stage | Negatisve | Borderline | Positive |
| I | 0 | 0 | 1 |
| IA | 0 | 2 | 3 |
| IB | 3 | 3 | 13 |
| IIA | 0 | 1 | 6 |
| IIB | 2 | 4 | 18 |
| III | 3 | 6 | 27 |
| IV | 2 | 4 | 50 |
| Unknown | 1 | 1 | 7 |
PDAC, pancreatic ductal adenocarcinoma.
Impact of CA19-9 on IMMray PanCan-d results
Accumulating data suggest that individuals with very low baseline CA19-9 values are often deficient in FUT3, which is responsible for the terminal sugar addition that creates CA19-9 (12,13). Based on these observations and the fact that CA19-9 contributes significantly to calculated decision values for IMMray PanCan-d, we also evaluated the performance of IMMray PanCan-d in the subsets of each cohort that expressed significant amounts of CA19-9, using 2.5 U/mL as a cutoff. Eliminating samples with CA19-9 values less than or equal to 2.5 U/mL removed 55 samples from analysis and improved assay sensitivity from 85% to 89% for early-stage PDAC and from 87% to 92% for all-stage PDAC (Figure 4 and Table 8).
Figure 4.
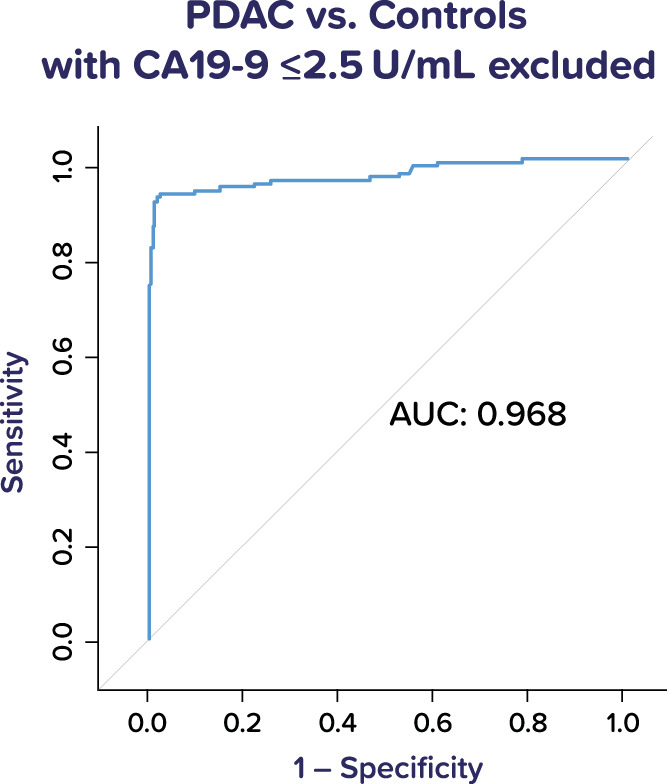
ROC curve for IMMray PanCan-d test performance in PDAC vs all controls, excluding samples with CA19-9 values of 2.5 U/mL or less. PDAC, pancreatic ductal adenocarcinoma; ROC, receiver operating characteristic.
Table 8.
Rates of CA19-9 values of 2.5 U/mL or less in study subjects
| National origin | Self-reported ethnicity | % CA19-9 <2.5 | |
| The United States | White | 8 | |
| The United States | African American | 26 | |
| The United States | Hispanic | 24 | |
| Spain | White | 13 | |
| Sweden | — | 4 | |
| Finland | — | 14 |
The prevalence of FUT3 deficiency has been reported to vary in different ethnic populations, and these findings were supported by the results in this study. We observed the following rates of CA19-9 values below 2.5 in the subjects from different nations and for those whose self-described ethnicity was known (Table 8).
These frequencies are similar to the reported frequencies of Lewis antigen–null individuals in the US White and African American populations (15). Because the 8 biomarkers measured on the IMMray platform contribute significantly to discrimination between PDAC and non-PDAC samples, we examined the decision values for samples with CA19-9 values less than 2.5 U/mL as a group by removing the CA19-9 contribution to those decision values and obtained the following ROC AUC curve for this relatively small group of samples (55 samples) (Figure 5). Using a modified 0.35 cutoff and a borderline interval of ± 0.25, this test performance corresponds to an assay sensitivity of 86% and specificity of 89%, excluding 28% of samples as borderline.
Figure 5.

ROC curve for samples with CA19-9 <2.5 U/mL. ROC, receiver operating characteristic.
DISCUSSION
The World Health Organization has proposed that millions of patients with cancer could be saved from premature death if diagnosed and treated earlier. To achieve this, more advanced diagnostic approaches must be developed and applied to detect lethal cancers such as PDAC earlier in their clinical course. Available clinical data support the conclusion that earlier diagnosis of high-risk individuals can lead to improved survival by increasing the percentage of PDACs diagnosed when they are potentially resectable (1,5–7,32,33).
The results reported in this study demonstrate that a locked 9-biomarker signature using predefined cutoffs can provide reliable distinction between individuals with and without PDAC. This is the first report that we are aware of using a blood-based biomarker assay to evaluate a population at high risk of PDAC (PanFAM cohort). The high specificity (98%) in this cohort suggests that the IMMray PanCan-d test can be a useful adjunct to image-based surveillance in this cohort. The similarity of the distributions of decision values in the healthy cohort and PanFAM cohort (which includes 28% cancer survivors) further supports the high specificity of this assay. IMMray PanCan-d assay sensitivity for both early-stage PDAC and all-stage PDAC is substantially greater than other reported blood tests, and its overall performance characteristics are better than those reported for some types of imaging modalities used in PDAC surveillance (34). The similar distribution of decision values observed in this study and in CTMS with completely independent sample cohorts suggests that the IMMray PanCan-d assay and its associated calibration and quality control procedures are sufficiently robust to provide reliable clinical information. We saw no impact on IMMray PanCan-d results based on sex, smoking status, or age of subjects. Although most PanFAM subjects were receiving multiple prescription medications, this did not greatly alter their observed decision value distribution compared with healthy controls who were 10 years younger in median age (mean decision values of 1.65 and 1.40, respectively, with nearly identical SDs).
The recognition that IMMray PanCan-d test sensitivity can be improved to 92% by excluding samples with very low CA19-9 values is clinically important and avoids the possibility of substantially underdiagnosing PDAC in ethnic groups with a higher prevalence of FUT3-null genotypes (e.g., African Americans and Hispanics in this study). The discrimination of the 8 IMMray biomarkers (without CA19-9) in samples with CA19-9 values less than or equal to 2.5 U/mL is encouraging and provides a starting point for developing a companion assay to better address this population.
This study has limitations. This study addresses the diagnostic accuracy of PanCan-d but cannot assess its clinical utility. We anticipate that the analysis of serial sample collections from our PanFAM prospective trial will provide this information. The median age of the 3 cohorts and their sex distributions vary substantially. We believed that the PanFAM cohort provides the most meaningful comparison for the PDAC cohort because it represents the target population for the clinical application of IMMray PanCan-d. The demographics of the PanFAM cohort are determined by the composition of high-risk PDAC surveillance programs participating the PanFAM clinical trial. The multicentric design of the study mitigates the risk that cohort bias at 1 or a few collection sites could influence results. Most of the PDAC samples were derived from Europeans, whereas the PanFAM samples were derived from Americans. Although the test is highly accurate and provides enhanced sensitivity and specificity over CA19-9, it is not 100% specific. Overall, 10% of samples produced borderline results, which are less clinically certain than a positive or negative result. We feel that a positive test result should trigger accelerated diagnostic activities to expedite appropriate patient care and/or follow-up in concordance with NCCN guidelines.
In summary, the IMMray PanCan-d assay has been shown to detect samples derived from patients with both early-stage and all-stage PDAC with high sensitivity and specificity. This performance was demonstrated in both a healthy cohort and a familial genetic high-risk cohort that may be an appropriate group for blood-based PDAC surveillance. Results were obtained using a previously locked signature and predefined cutoffs using clinical standard operating procedures, fully validated instruments, and custom software applications. A complete analysis of the prospective PanFAM clinical trial, which has accrued more than 1,000 participants, should provide additional relevant data regarding IMMray PanCan-d test performance and is expected within the next year.
CONFLICTS OF INTEREST
Guarantor of the article: Thomas C. King, MD, PhD
Specific author contributions: R.E.B, J.P., S.O.B, D.C.C., B.W.K, A.C., M.C., J.E., A.K, A.L.L, A.J.M., and C.D.: collection of specimens and drafting of manuscript. L.D.M.: planning of study and review of manuscript. T.C.K: planning and conducting of study, interpreting of data, and drafting of manuscript. All authors have approved the final draft.
Financial support: The collection of samples for this study was supported by a grant from Immunovia AB through the PanFAM Clinical Trial (ClinicalTrials.gov Identifier: NCT03693378) to Drs. Brand, Katona, and Chung.
Potential competing interests: Drs. Lucas and Brand have also been compensated by Immunovia AB or Immunovia, Inc for their participation in scientific/medical meetings as outside speakers. Dr. Mellby is an employee of Immunovia AB, and Dr. King is an employee of Immunovia, Inc.
Acknowledgments
Preparation of this article was expertly managed by Carrie Mansfield. Hannah Cincotta MT (ASCP) and Alexis Tashjian RN, MB (ASCP) provided expert technical assistance in the analysis of study samples.
Footnotes
STARD Statement: This manuscript complies with the STARD 2015 checklist for the reporting of studies of diagnostic accuracy.
References
- 1.Kamisawa T, Wood LD, Itoi T, et al. Pancreatic cancer. Lancet 2016;388:73–85. [DOI] [PubMed] [Google Scholar]
- 2.Ryan DP, Hong TS, Bardeesy N. Pancreatic adenocarcinoma. N Engl J Med 2014;371:1039–49. [DOI] [PubMed] [Google Scholar]
- 3.Rahib L, Smith BD, Aizenberg R, et al. Projecting cancer incidence and deaths to 2030: The unexpected burden of thyroid, liver, and pancreas cancers in the United States. Cancer Res 2014;74(11):2913–21. [DOI] [PubMed] [Google Scholar]
- 4.Sohn TA, Yeo CJ, Cameron JL, et al. Resected adenocarcinoma of the pancreas-616 patients: Results, outcomes, and prognostic indicators. J Gastrointest Surg 2000;4(6):567–79. [DOI] [PubMed] [Google Scholar]
- 5.Canto MI, Kerdsirichairat T, Yeo CJ, et al. Surgical outcomes after pancreatic resection of screening-detected lesions in individuals at high-risk for developing pancreatic cancer. J Gastrointest Surg 2020;24(5):1101–10. [DOI] [PMC free article] [PubMed] [Google Scholar]
- 6.Vasen H, Ibrahim I, Ponce CG, et al. Benefit of surveillance for pancreatic cancer in high-risk individuals: Outcome of long-term prospective followup studies from three European expert centers. J Clin Oncol 2016;34:2010–9. [DOI] [PubMed] [Google Scholar]
- 7.Canto MI, Almario JA, Schulick RD, et al. Risk of neoplastic progression in individuals at high risk for pancreatic cancer undergoing long-term surveillance. Gastroenterol 2018;155:740–51. [DOI] [PMC free article] [PubMed] [Google Scholar]
- 8.Hanada K, Okazaki A, Hirano N, et al. Effective screening for early diagnosis of pancreatic cancer. Best Pract Res Clin Gastroenterol 2015;29:929–39. [DOI] [PubMed] [Google Scholar]
- 9.Chari ST, Kelly K, Hollingsworth MA, et al. Early detection of sporadic pancreatic cancer: Summative review. Pancreas 2015;44:693–712. [DOI] [PMC free article] [PubMed] [Google Scholar]
- 10.Brentnall TA. Progress in the earlier detection of pancreatic cancer. J Clin Oncol 2016;34(17):1973–4. [DOI] [PubMed] [Google Scholar]
- 11.Everett JN, Burgos G, Chun J, et al. Cancer surveillance awareness and practice among families at increased risk for pancreatic adenocarcinoma. Cancer 2021;127:2271–8. [DOI] [PubMed] [Google Scholar]
- 12.Kawai S, Suzuki K, Nishio K, et al. Smoking and serum CA19-9 levels according to Lewis and secretor genotypes. Int J Cancer 2008;123:2880–4. [DOI] [PubMed] [Google Scholar]
- 13.Narimatsu H, Iwasaki H, Nakayama F, et al. Lewis and Secretor gene dosages affect CA19-9 and DU-PAN-2 serum levels in normal individuals and colorectal cancer patients. Cancer Res 1998;58:512–8. [PubMed] [Google Scholar]
- 14.Fahrmann JF, Schmidt CM, Mao X, et al. Lead-time trajectory of CA19-9 as an anchor marker for pancreatic cancer early detection. Gastroenterol 2021;160:1373–83. [DOI] [PMC free article] [PubMed] [Google Scholar]
- 15.Roback JD Combs MR Grossman BJ et al. In: Hillyer CD. (eds.). Technical Manual. 16th edn. AABB: Bethesda, MD, 2008. [Google Scholar]
- 16.Okano K, Suzuki Y. Strategies for early detection of resectable pancreatic cancer. World J Gastroenterol 2014;20(32):11230–40. [DOI] [PMC free article] [PubMed] [Google Scholar]
- 17.Locker GY, Hamilton S, Harris J, et al. ASCO 2006 update of recommendations for the use of tumor markers in gastrointestinal cancer. J Clin Oncol 2006;24(33):5313–27. [DOI] [PubMed] [Google Scholar]
- 18.Galli C, Basso D, Plebani MCA. 19-9: Handle with care. Clin Chem Lab Med 2013;51(7):1369–83. [DOI] [PubMed] [Google Scholar]
- 19.Modi S, Kir D, Saluja AK. Old dog, new tricks: Use of CA 19-9 for early diagnosis of pancreatic cancer. Gastroenterol 2021;160:1019–21. [DOI] [PubMed] [Google Scholar]
- 20.Borrebaeck CAK. Precision diagnostics: Moving towards protein biomarker signatures of clinical utility in cancer. Nat Rev Cancer 2017;17:199–203. [DOI] [PubMed] [Google Scholar]
- 21.Hanash SM, Pitteri SJ, Faca VM. Mining the plasma proteome for cancer biomarkers. Nature 2008;452:571–9. [DOI] [PubMed] [Google Scholar]
- 22.Radon TP, Massat NJ, Jones R, et al. Identification of a three-biomarker panel in urine for early detection of pancreatic adenocarcinoma. Clin Cancer Res 2015;21(15):3512–21. [DOI] [PMC free article] [PubMed] [Google Scholar]
- 23.Shaw VE, Lane B, Jenkinson C, et al. Serum cytokine biomarker panels for discriminating pancreatic cancer from benign pancreatic disease. Mol Cancer 2014;13:114. [DOI] [PMC free article] [PubMed] [Google Scholar]
- 24.Mayers JR, Wu C, Clish CB, et al. Elevation of circulating branched chain amino acids is an early event in human pancreatic adenocarcinoma development. Nat Med 2014;20(10):1193–8. [DOI] [PMC free article] [PubMed] [Google Scholar]
- 25.Jenkinson C, Elliott VL, Evans A, et al. Decreased serum thrombospondin-1 levels in pancreatic cancer patients up to 24 months prior to clinical diagnosis: Association with diabetes mellitus. Clin Cancer Res 2016;22(7):1734–43. [DOI] [PMC free article] [PubMed] [Google Scholar]
- 26.Brand RE, Nolen BM, Zeh HJ, et al. Serum biomarker panels for the detection of pancreatic cancer. Clin Cancer Res 2011;17(4):805–16. [DOI] [PMC free article] [PubMed] [Google Scholar]
- 27.Kim J, Barnlet WR, Oberg AL, et al. Detection of early pancreatic ductal adenocarcinoma with thrombospondin-2 and CA19-9 blood markers. Sci Transl Med 2017;9(398):eaah5583. [DOI] [PMC free article] [PubMed] [Google Scholar]
- 28.Gerdtsson AS, Malats N, Säll A, et al. A multicenter trial defining a serum protein signature associated with pancreatic ductal adenocarcinoma. Int J Proteomics 2015:587250. [DOI] [PMC free article] [PubMed] [Google Scholar]
- 29.Wingren C, Sandström A, Segersvärd R, et al. Identification of serum biomarker signatures associated with pancreatic cancer. Cancer Res 2012;72(10):2481–90. [DOI] [PubMed] [Google Scholar]
- 30.Mellby LD, Nyberg AP, Johansen JS, et al. Serum biomarker signature-based liquid biopsy for diagnosis of early-stage pancreatic cancer. J Clin Oncol 2018;36(28):2887–94. [DOI] [PMC free article] [PubMed] [Google Scholar]
- 31.Amin MB, Edge S, Greene F, et al. American Joint committee on cancer. AJCC Cancer Staging Manual. 8th edn. Springer: New York, NY, 2017. [Google Scholar]
- 32.Delfani P, Carlsson A, King TC, et al. Commercial test model study – a multicenter study (2021). Immunovia AB website (https://immunovia.com/poster-commercial-test-model-study-a-multicenter-survey/). Accessed February 2021.
- 33.Matsuno S, Egawa S, Fukuyama S, et al. Pancreatic cancer registry in Japan: 20 years of experience. Pancreas 2004;28:219–30. [DOI] [PubMed] [Google Scholar]
- 34.Shimizu Y, Yasui K, Matsueda K, et al. Small carcinoma of the pancreas is curable: New computed tomography finding, pathological study and postoperative results from a single institute. J Gastroenterol Hepatol 2005;20:1591–4. [DOI] [PubMed] [Google Scholar]