Abstract
Each year, more than 400,000 people die of malaria. Malaria is a mosquito-borne transmissible infection that affects humans and other animals. According to World Health Organization (WHO), 1.5 billion malaria cases and 7.6 million related deaths have been prevented from 2000 to 2019. Malaria is a disease that can be treated if early detected. We propose a support decision system for detecting malaria from microscopic peripheral blood cells images through convolutional neural networks (CNN). The proposed model is based on EfficientNetB0 architecture. The results are validated with 10-fold stratified cross-validation. This paper presents the classification findings using images from malaria patients and normal patients. The proposed approach is compared and outperforms the related work. Furthermore, the proposed ensemble method shows a recall value of 98.82%, a precision value of 97.74%, an F1-score of 98.28% and a ROC value of 99.76%. This work suggests that EfficientNet is a reliable architecture for automatic medical diagnostics of malaria.
Supplementary Information
The online version contains supplementary material available at 10.1007/s11042-022-12624-6.
Keywords: Convolutional neural networks, EfficientNet, Health informatics, Machine learning, Malaria
Introduction
Malaria is a mosquito-borne transmissible infection that affects humans and other animals. According to World Health Organization (WHO) [55], 1.5 billion malaria cases and 7.6 million related deaths have been prevented from 2000 to 2019. Moreover, 229 million new malaria cases have been recorded and 409.000 people passed away in 2019. Approximate two-thirds of fatalities are among children under the age of five and most of them occurred in sub-Saharan Africa. Moreover, around 12 billion dollars a year due to its impact on the services, industry, and tourism in Africa. Initial symptoms of malaria, such as chills, fever, headache or vomiting, can potentially be moderate and difficult to identify. However, without treatment malaria could produce severe sickness and cause death [4]. Therefore, early detection is the best manner to treat this disease.
Microscopic thick/thin-film blood smear examination conducted by qualified professionals is a reliable method for malaria diagnosis [20, 54]. This is a high time spending process where experts usually need to manually identify at least 5000 cells to verify the condition. Rapid detection tests are available and largely used. However, these tests are expensive and prone to errors. Moreover, manual diagnosis has other limitations which severely impacts the diagnostic accuracy. Large-scale screening or variability, especially in countries where the illness is widespread with limited resource settings [24]. Consequently, automatic pattern recognition tools supported by Big Data and machine learning have been employed to malaria blood smears since 2005 [48].
Convolutional Neural Networks (CNNs) are a type of deep neural networks used for different applications [7, 8, 18]. CNNs usually have one input layer, several hidden layers, and one output layer [13]. The inner hidden layers normally are made of fully connected layers, convolutional layers, and activation layers, as ReLu [14, 47]. CNNs improved automatic image classification methods as pre-processing the images is not required unlike other conventional machine learning algorithms [33, 52, 53].
Currently, ensemble models are an integral part of the state of the art [36]. Ensemble Learning refers to the techniques used to generate new models from other several trained models, combining their outputs such as a “committee” of decision-makers. The assumption is that the group decision, with singled predictions combined properly, should have an improved final accuracy over any individual committee participant, on average [2]. Several theoretical and empirical experiments suggest that ensemble models achieve better accuracy than the models that they integrate. Ensemble models have been applied in different areas of health diagnosis such as diabetes type-II [37], women thyroid prediction [57], neurological disorders [15] and cancer prediction [56]. Therefore, the novelty of this study in terms of model is to propose an ensemble approach. The proposed model is composed of the 10 partial models obtained in the 10-fold validation process of an EfficientNetB0 base model. This approach has presented relevant findings in previous research studies [16, 17, 27, 34].
The main contribution of this study is to recommend a computer-method for decision support system to detect malaria in blood smear images using EfficientNet [9, 46]. According to our analysis, no similar study proposes EfficientNet for automated diagnosis of malaria. Numerous experiments for malaria diagnosis have been described in the literature. It is critical to reveal all the procedures and tools to enable the readers to reproduce the results presented. Therefore, we present all the materials and Python code created with the Jupyter notebook. This work uses open-source technologies and by providing the supplementary files the readers can reproduce the experiments for additional investigation. EfficientNet can be utilized for transfer learning better [45] than other CNNs such as VGG16 or VGG19 [40], ResNet50 [44] or InceptionV3 [1]. EfficientNet architecture is made of eight models (B0 to B7), higher version number higher parameters and complexity. Moreover, EfficientNet models use transfer learning techniques to improve execution time and save computational power. Therefore, it usually gives better accuracy than other models concerning a smart scaling of resolution, width, and depth. This work uses the B0 model, with the minimum number of parameters. This model is selected since presents promising results and is feasible for our experimental setup. The number of parameters of B1-B7 models increases largely [46]. Moreover, this study used separated datasets to validate the CNN model and to guarantee the non-existence of overfitting. The validation dataset includes samples that were not used during training and testing. The authors have evaluated the algorithm using stratified 10-fold cross-validation. Finally, an ensemble model has been composed of ten intermediate models generated during the 10-fold stratified validation. This approach significantly increases the accuracy of any of the partial models. The source code is supplied as supplementary file A.
Related work
Numerous research activities related to optimization methods, as well as classification or clustering methods are available. According to Pootschi et al. [28] almost every classification method has been used for malaria diagnosis with thin blood smear samples, ranging from the unsupervised K-Mean Clustering [29] to other supervised techniques, as Naïve Bayes Tree [6], AdaBoost [51], Decision Tree [41], Support Vector Machine [38] or Linear Discriminant [21]. However, most of them are devoted to the study of the interaction between classification with features and segmentation, and few of them investigate explicitly parasite detection in blood cell images.
Comparing the performance of all different studies have limitations. On the one hand, most of the studies do not use the same image dataset and number of samples. Nevertheless, a trade-off between processing time and accuracy is observed, the longer the run-time, the better the accuracy. Moreover, the algorithm architecture also influences the runtime of the process [28].
Deep learning algorithms have recently been used to increase performance in several healthcare domains. Liang et al. [19] were one of the first researchers who apply CNN to malaria diagnosis. They used a more classical transfer model and a custom CNN model to automatically classify thin blood smear image cells, obtained by traditional optical microscope slides. Their results showed that their custom CNN model obtained a better performance (97.37% accuracy) over the more “traditional” transfer models.
Rajaraman et al. [32] evaluated several pre-trained CNN based deep learning algorithms as feature extractors toward classification. Up to 6 different architectures were used (AlexNet, VGG16, ResNet50, Xception, DenseNet121 and custom models) with accuracy results ranging from 91.50% to 95.9%. VGG16 and ResNet outperformed their competitors. They concluded that pre-trained CNNs are a promising tool for feature extraction.
Rahman et al. [31] used the dataset from the National Institute of Health, and a 5-fold cross-validation scheme, to test their models. A custom CNN (96,29% accuracy), a VGG16 (97.77%) and a CNN extracted features applied to SVM (94.77%). They concluded that the use of different pre-processing practices such as normalization or standardization does not impact the final performance. However, data augmentation procedures used on the training images reveals encouraging results.
Shah et al. [39] developed an image classification algorithm based on CNNs and tested it with a labelled image dataset. Their findings show 94.77% accuracy. They state relevant limitations related to computationally resources and suggest that the proposed results can be improved with higher computing power.
Quan et al. [30] worked on a novel and lightweight model based on CNNs, combining concepts from dense and residual networks and employing attention mechanisms. The proposed method was entitled Attentive Dense Circular Net (ACDN). The findings have been compared with the related work in the literature as DenseNet121 [11] or DPN92 [5]. The results show higher performance with 97.47% versus 90.94% and 87.88% reported by DenseNet121 and DPN92, respectively. Moreover, the proposed ACDN model presents high precision and a fast convergence speed.
Finally, Yang et al. [59] developed an interesting model, which uses thick blood smear images and was developed to run on smartphones. Their model involves fast screening of the images to detect parasite candidates. On the one hand, they classify the set of images publicly available by the community with a customized CNNs and obtained a 97.26% accuracy. On the other hand, they compared their model with others in the literature, also applying the previous fast screening step. The proposed model outperformed the accuracy reported by other architectures such as ResNet50 (accuracy: 93.88%), VGG19 (accuracy: 93.72%) and AlexNet (accuracy: 96.33%).
On the one hand, advantages such as reduced training time and enhanced performance are associated with transfer learning approaches. On the other hand, technical gaps such as negative transfer and overfitting are critical limitations associated with transfer learning. The use of transfer learning does not ensure an increase in performance and in this scenario, we are dealing with the negative transfer. Transfer learning will present effective results with the data used for training is similar to the target problem. Despite the improvements in transfer learning, however, there are no cohesive standards to deal with the negative transfer. Overfitting is a general limitation of predictive methods. In transfer learning approaches overfitting is closely related to the learning process of noise from the training stage that impacts the target negatively.
Methods and materials
The authors aim to clearly present all methods and materials used in this work. Section 3.1 describes the Malaria image datasets. The proposed CNN algorithm is described in Section 3.2. Ultimately, Section 3.3 introduces the experimental setup and validation procedure.
Malaria dataset
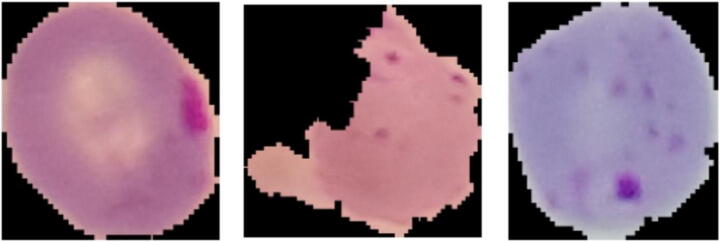
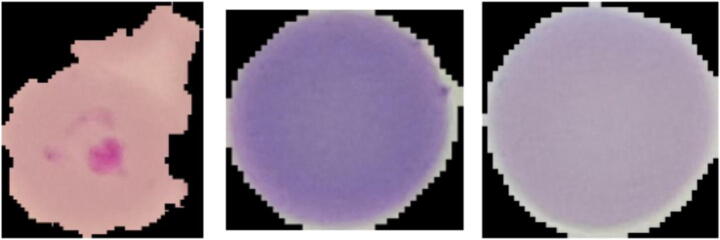
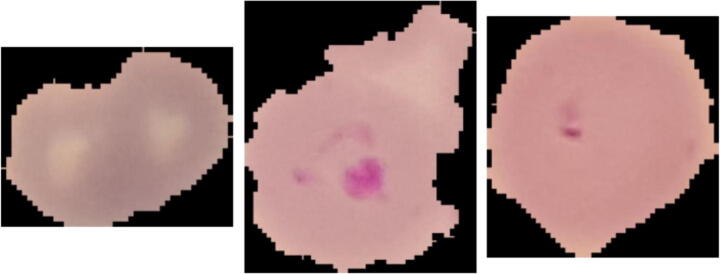
The images used to test the proposed approach have been obtained from an open dataset offered by the USA National Institutes of Health (NIH). The red blood cell micrographs in the dataset were gathered from Giemsa-stained thin blood smear slides. In total 150 different malaria-infected and 50 healthy patients treated at Chittagong Medical College Hospital are included [10]. Every image was manually labelled, de-identified and archived by a professional in the Mahidol Oxford Tropical Medicine Research Unit in Bangkok [32]. The database includes 27,558 red blood cell images, half infected (labelled as positive samples) and half clean (negative samples). The parasitized images consist of red blood cells affected by plasmodium. However, the uninfected ones can include several noise factors such as stain interferences or dust impurities. Samples of infected cell images can be shown in Fig. 1, whereas Fig. 2 shows three normal cell images.
Fig. 1.
Three infected cells (positive samples) randomly selected from the dataset
Fig. 2.
Three normal cells (negative samples) randomly selected from the dataset
We use an equal number of samples for both categories to correctly validate the system performance as suggested by [12]. In total, 22,046 samples have been used for “malaria” and “normal” classes (Table 1). Those images were utilized in the stratified cross-validation process. Moreover, the algorithm has been validated using a separate dataset. This dataset has 5512 samples and contains 2756 images for “normal” class and 2756 images for “malaria” class. The later datasets were not employed neither in the training or in testing phase. This process was carried out to guarantee and prove the non-existence of overfitting.
Table 1.
Dataset information
| Type | Training/testing images | Validation images |
|---|---|---|
| Normal | 11,023 | 2756 |
| Malaria | 11,023 | 2756 |
Proposed CNN
EfficientNetB0 model has been used, with a previous transfer learning process. To reduce overfitting by lowering the quantity of parameters a global_average_pooling2d layer was added. On top of that model, 3 inner dense layers with dropout layers and ReLu activation functions were added in sequence. To avoid overfitting, a 30% random dropout rate has been implemented. One final output dense layer with two output units was added for binary classification; in this case, the activation function is a softmax that provides the final computer-aided system. The order of the layers, the number of trainable and non-trainable parameters (weights) in each layer, and the output shape of each layer are shown in Table 2. The proposed model have 4,223,934 parameters.
Table 2.
Layer types, output shape and parameters of the model
| Layer (Type) | Output shape | Param # |
|---|---|---|
| EfficientNetB0 (Model) | 7 × 7 × 1280 | 4,049,564 |
| global_average_pooling2d | 1280 | 0 |
| dense (Dense) | 128 | 163,968 |
| dropout (Dropout) | 128 | 0 |
| dense_1 (Dense) | 64 | 8256 |
| dropout_1 (Dropout) | 64 | 0 |
| Dense_2 (Dense) | 32 | 2080 |
| Dropout_2 | 32 | 0 |
| Dense_3 (Dense) | 2 | 66 |
| Total Parameters: | 4,223,934 | |
| Trainable Parameters: | 4,181,918 | |
| Non-trainable Parameters: | 42,016 |
We use open-source libraries and software in this experiment. The readers can use the Google Colaboratory platform, selecting the GPU running environment to reproduce the findings. This platform can be used without cost since Google provides it for research purposes. The hardware is a Tesla K80 GPU of 12 GB. The EfficientNet architectures are scaled and pre-trained CNNs, that are used for image classifications applications by means of transfer learning. That model was developed by Google AI in 2019 and is ready for use from the GitHub platform [58]. Google AI developed the Albumentations library is also and is accessible from GitHub repositories [26]. The proposed model was successfully used to diagnosis of COVID-19 with X-Ray images [22].
The model uses three main different libraries such as EfficientNet as the base module, ImageDataAugmentator and the Albumentations. On the one hand, the EfficientNet algorithms are built with highly effective but simple compound scaling techniques. The method allows to scale up from baseline convolutional network to any required resource limitations whilst retaining model performance, acquired from transfer learning from external datasets. EfficientNet networks reach both better accuracy and superior efficiency over other CNNs such as MobileNetV2, GoogleNet, AlexNet, and ImageNet [46]. The current experiment implemented EfficientNetB0 that includes 4,049,564 parameters, as it is appropriate given the resources available and our objective. On the other hand, the Albumentations software is broadly utilized in engineering, deep learning investigation, artificial intelligence contests, and open-source developments. The library provides several image transformations well-optimized for execution. This software includes an augmentation method for computer vision, comprising object detection, segmentation and classification. This study has employed the Compose function of the Albumentations package. It has been shown that Albumentations decreases overfitting, enhance the performance of classifiers and then reduce running time as suggested in [3]. Augmentation is implemented in each fold, the model accuracy of the model increases, and execution time decreased.
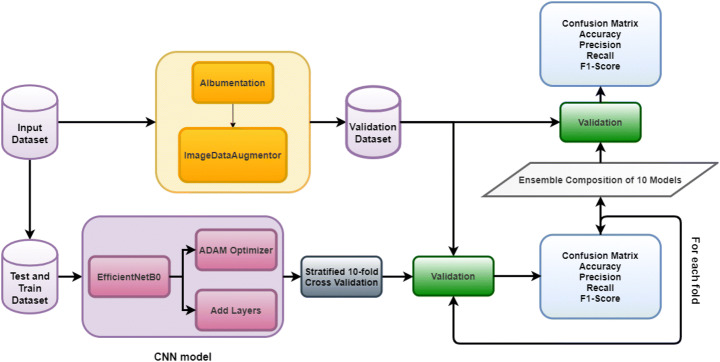
ImageDataAugmentator library is an image data generator for Keras, a Python interface for artificial neural networks, backing the utilization of advanced augmentation libraries (imgaug and albumentations) [49]. The library configures the Image data generator in accordance with the albumentations library to reduce execution time. A data generator is implemented by means of the constructor method of the ImageDataAugmentator class. Two parameters are needed, the first one is rescale, set as 1/255, used to convert each pixel value from a [0, 255] scale to [0, 1]. The second one is the augment parameter, which is designed to be used as the output of the compose method of the Albumentation software. Data generator has used further to process the image datasets. Figure 3 shows an overview of the experiments conducted.
Fig. 3.
Overview of the experiments conducted
Validation process
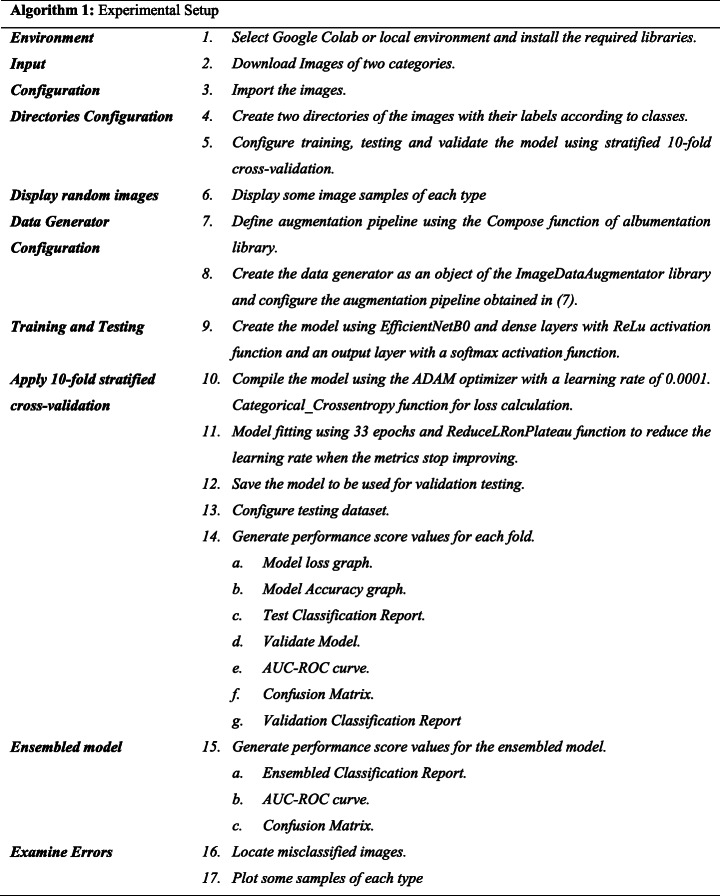
Two different phases were carried out to validate the model. First, the 10-fold cross-validation technique used the same dataset of images for training and testing; and second, a different dataset which includes images that were not used during the previous phase has been used to validate the model performance. Then the confusion matrix has been calculated. Precision, recall and F1-score have been computed for each one of both classes. At last, the averaged values for each fold were estimated. Algorithm 1 shows the practical setup utilised to carry out the experiment. Figure 4 presents the flowchart and steps of operation of the proposed algorithm.
Fig. 4.
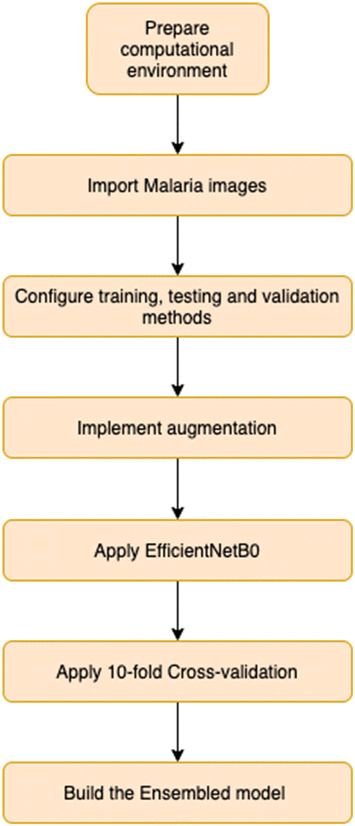
Overview of the proposed algorithm
Results
The Python code was executed on a laptop notebook DELL XPS 159560, Intel Core i7, 16GB RAM, equipped with an NVIDIA GeForce GTX 1050 video card, GPU support. The training phase of the customized EfficientNetB0 model was carried out employing a stratified 10-fold cross-validation technique. Altogether, each fold run 33 epochs. Furthermore, each fold consisted of 1240 steps. 16 was the value chosen for the mini-batch parameter.
Model training required a total of 409,200 iterations. The time elapsed for the training model was 1 day, 23:38:44. The initial learning rate was set to 0.0001. The model used a ReduceLROnPlateau technique since a reduction in the learning rate is required as soon as the improvement does not increase any longer. The callback function checks the enhancement, and if no progress is confirmed for a ‘PATIENCE’ value of epochs, the learning rate is lowered. PATIENCE level is set to 6, and min_lr = 0.000001 as the minimum learning rate before definitely stopping. ADAM optimization [25] was chosen as the solver method. In the supplementary files, the detailed data and the training and validation graphs for each fold of the proposed model are provided. Moreover, loss, confusion matrix, and area under the curve of receiver operating characteristics are also included as supplementary material. Each of the 10-fold models is trained, the models are used for the validation testing, using separated datasets. The performance reported in the experiments is encouraging. Figure 5 shows the history graph of the 8th integration of the 10-fold cross-validation process. The usual learning pattern is clearly seen in the evolution of the graphs, both accuracy and losses. The learning process stops when it does not improve any longer. Detailed information, including the software scripts, relating to the experiments can be seen as supplementary material.
Fig. 5.
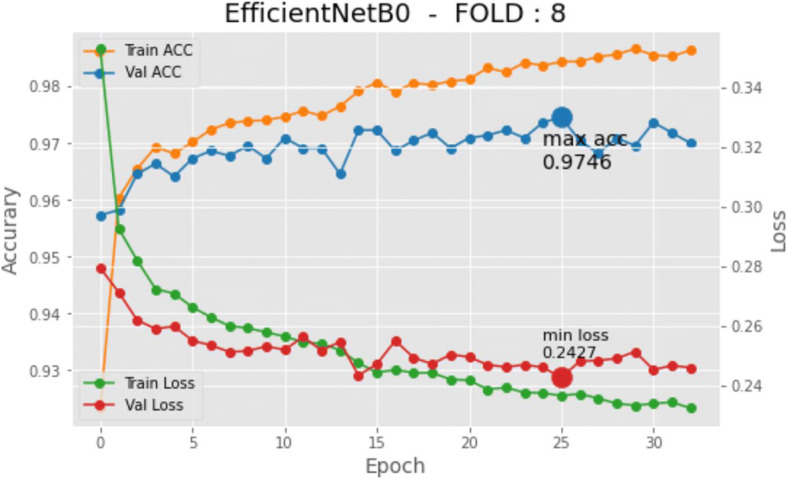
History graph (model loss and accuracy) for an iteration of the K-fold algorithm
Experimental results
Overall, training data included 22,046 different samples and 5512 samples have been used for testing. The findings are given for each one of the 10 folds, together with the average value. The precision, recall, F1-score and accuracy are provided for each class and for the average between classes.
Table 3 shows results related to the “malaria” class. Minimal performance values are obtained for the 0, 1, and 4-fold. The minimum precision values of 97.72% occurred in the 1-fold. Moreover, the minimum recall value is 96.19% in 8-fold. The minimum F1-score is 97.02% also at 8-fold. The average precision, recall, and F1-score are 98.07%, 97.05% and 97.55%, in that order.
Table 3.
Binary classification for “malaria” class
| Fold | Precision | Recall | F1-score |
|---|---|---|---|
| 0 | 0.977231 | 0.971920 | 0.974569 |
| 1 | 0.978221 | 0.976449 | 0.977335 |
| 2 | 0.981702 | 0.971920 | 0.976787 |
| 3 | 0.978102 | 0.971014 | 0.974545 |
| 4 | 0.978042 | 0.968297 | 0.973145 |
| 5 | 0.984259 | 0.963735 | 0.973889 |
| 6 | 0.979909 | 0.972801 | 0.976342 |
| 7 | 0.985441 | 0.981868 | 0.983651 |
| 8 | 0.978782 | 0.961922 | 0.970279 |
| 9 | 0.985185 | 0.964642 | 0.974805 |
| Average | 0.980687 | 0.970457 | 0.975535 |
The results regarding the normal class are shown in Table 4. The minimum recall value of 97.72% is reported in the 0-fold. The lowest precision value is 96,25% for 9-fold. Finally, 4-fold presents a minimum F1-score value of 97.33%. Average precision, recall, and F1-score values are 97.07%, 98.08% and 97.66%, respectively.
Table 4.
Binary classification for "normal" class
| Fold | Precision | Recall | F1-score |
|---|---|---|---|
| 0 | 0.971996 | 0.977293 | 0.974638 |
| 1 | 0.976428 | 0.978202 | 0.977314 |
| 2 | 0.972122 | 0.981835 | 0.976954 |
| 3 | 0.971145 | 0.978202 | 0.974661 |
| 4 | 0.968525 | 0.978202 | 0.973339 |
| 5 | 0.964444 | 0.984574 | 0.974405 |
| 6 | 0.972949 | 0.980018 | 0.976471 |
| 7 | 0.981900 | 0.985468 | 0.983681 |
| 8 | 0.962500 | 0.979110 | 0.970734 |
| 9 | 0.965302 | 0.985468 | 0.975281 |
| Average | 0.970731 | 0.980837 | 0.976648 |
Accuracy, precision, recall and F1-score values between classes are presented in Table 5. The calculated average accuracy is 97.56%. Furthermore, a precision value of 97.57%, a recall value of 97.56% and an F1-score value of 97.56% are reported.
Table 5.
Binary classification average between classes
| Fold | Accuracy | Precision | Recall | F1-score |
|---|---|---|---|---|
| 0 | 0.974603 | 0.974617 | 0.974603 | 0.974603 |
| 1 | 0.977324 | 0.977326 | 0.977324 | 0.977324 |
| 2 | 0.976871 | 0.976919 | 0.976871 | 0.976870 |
| 3 | 0.974603 | 0.974628 | 0.974603 | 0.974603 |
| 4 | 0.973243 | 0.973290 | 0.973243 | 0.973242 |
| 5 | 0.974150 | 0.974356 | 0.974150 | 0.974147 |
| 6 | 0.976407 | 0.976432 | 0.976407 | 0.976406 |
| 7 | 0.983666 | 0.983672 | 0.983666 | 0.983666 |
| 8 | 0.970508 | 0.970649 | 0.970508 | 0.970506 |
| 9 | 0.975045 | 0.975253 | 0.975045 | 0.975043 |
| Average | 0.975642 | 0.975714 | 0.975642 | 0.975641 |
Experimental validation
In this phase, the objective is to ensure the non-existence of overfitting. Therefore, we used an image dataset with samples that are not been used during the previous phase. The external dataset includes 2756 images of the “malaria” class and 2756 for the “normal” class. The validation phase has been carried out with each of the 10 models obtained in the previous 10-fold cross-validation phase. These validation results for classification between classes are shown in Table 6, where the parameter “Area Under the Curve” or “Receiving Operating Characteristics” (ROC) is also presented. The average accuracy value is 97,70%. Moreover, the averaged valued for precision, recall and F1-score are 97.70%, 0.97.69% and 97.69% respectively. A minimum variance between experiments (≅4 · 10−6, 1, 5 · 10−7 for ROC) is clearly shown in the table. Therefore, we can ensure the absence of overfitting.
Table 6.
Results of classification average between classes
| Fold | Accuracy | Precision | Recall | F1-score | ROC |
|---|---|---|---|---|---|
| 0 | 0.977142 | 0.977143 | 0.977141 | 0.977141 | 0.996143 |
| 1 | 0.978788 | 0.978801 | 0.978774 | 0.978773 | 0.997121 |
| 2 | 0.974084 | 0.974292 | 0.973875 | 0.973868 | 0.996094 |
| 3 | 0.978254 | 0.978278 | 0.978229 | 0.978228 | 0.996904 |
| 4 | 0.979563 | 0.979626 | 0.979499 | 0.979497 | 0.996379 |
| 5 | 0.973411 | 0.973491 | 0.973331 | 0.973328 | 0.996098 |
| 6 | 0.977894 | 0.977922 | 0.977866 | 0.977865 | 0.996798 |
| 7 | 0.978270 | 0.978310 | 0.978229 | 0.978228 | 0.996274 |
| 8 | 0.976499 | 0.976583 | 0.976415 | 0.976412 | 0.996893 |
| 9 | 0.975631 | 0.975754 | 0.975508 | 0.975504 | 0.996243 |
| Average | 0.976953 | 0.977020 | 0.976887 | 0.976884 | 0.996495 |
Regarding accuracy, 4-fold has proven to be the best in class. Figure 6 presents its receiver operating characteristics for binary data of 4-fold and Fig. 7 presents the confusion matrix for the cross-validation test.
Fig. 6.
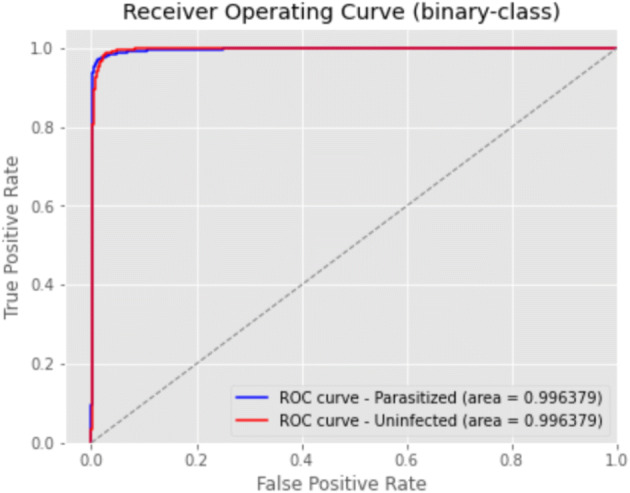
ROC for 4-fold
Fig. 7.
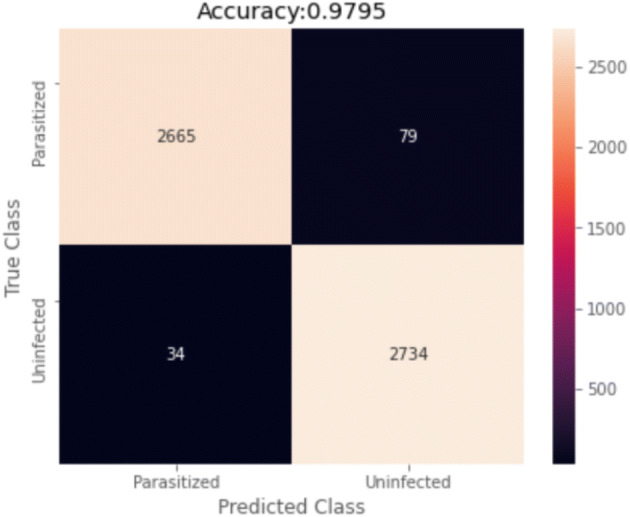
Confusion Matrix for 4-fold
Experimental results of the ensemble model
Finally, an ensemble model is proposed. The usual way to carry out an ensembled model is by using different models. However, the proposed ensemble model is composed of 10 trained models in each one of the 10-fold cross-validation. Therefore, there has not been necessary to conduct any additional training to build the ensemble. The results presented by the ensemble model obtained has been improved, despite the use of the same model, trained with almost the same set of images. The accuracy has risen to 98.29% from an averaged value of accuracy of 97.70%. This value represents a 25.75% error decrease of ensemble values over the averaged values of individual methods.
Figure 8 shows the Receiver Operating Curve of the ensemble model, calculated with the validation values; the AUC value is 99.76%.
Fig. 8.
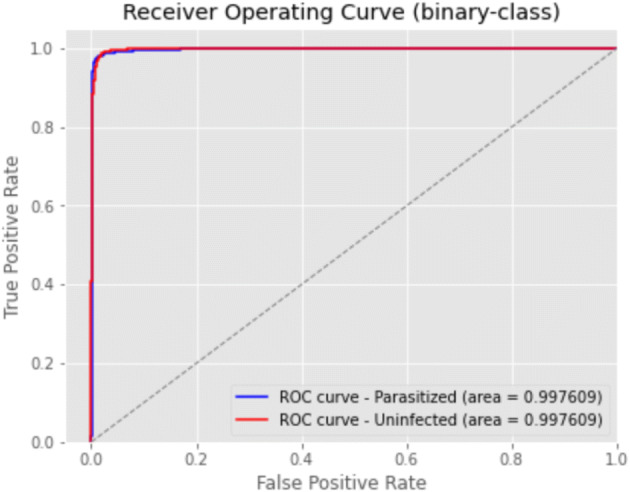
Roc for ensembled results
Finally, Fig. 9 presents the confusion matrix of this final experiment. False-positive classification almost doubles the quantity of false-negative ones, which seems to indicate that further tunning could be made in this direction as to future work. However, the impact of a false positive is critical when compared with the cost of a false negative. The patient detected with a false positive will be followed by the clinical team who will ensure the absence of disease.
Fig. 9.
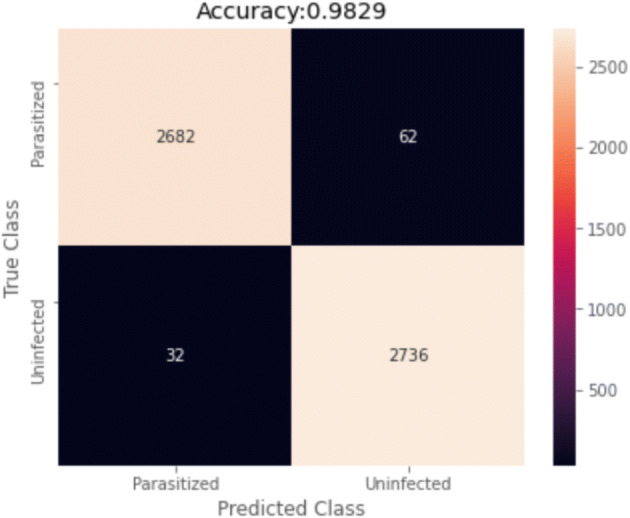
Confusion matrix for ensembled results
The ensemble model presents an F1-score of 0.9828, a recall of 0.9882, a precision of 0.9774, a false positive rate of 0.0222 and a false negative rate of 0.0118.
Discussion
The results are compared with the state of the art. However, it must be noted that the comparison is limited since the proposals use different datasets and parameters. Moreover, as most of the papers do not include the software, it is not feasible to evaluate their techniques to provide a more reliable comparison.
Several CNN methods applied to malaria diagnosis can be found in the literature and they increase every day [28]. The focus on these techniques is to help health professionals. The authors propose various architectures such as ResNet, DenseNet, DPN92 or ADCN [30] for automated medical diagnosis of malaria. We compare our model results with other similar studies that can be found in the literature. Table 7 presents the related work.
Table 7.
Comparison results of the state-of-art models for automated medical diagnosis of malaria
| Reference | Architecture | Accuracy | Recall | Precision | F1-Score |
|---|---|---|---|---|---|
| Liang [19] | Transfer Learning | 0.9199 | 0.8900 | 0.9512 | 0.9024 |
| Liang [19] | Own CNN | 0.9737 | 0.9775 | 0.9699 | 0.9736 |
| Rajaraman [32] | Own CNN | 0.9400 | 0.9310 | 0.9512 | 0.9410 |
| Rajaraman [32] | ResNet50 | 0.9570 | 0.9450 | 0.9690 | 0.9570 |
| Rahman [31] | Own CNN | 0.9629 | 0.9234 | 0.9804 | 0.9495 |
| Rahman [31] | VGG16 | 0.9777 | 0.9720 | 0.9719 | 0.9709 |
| Shah [39] | Own CNN | 0.9477 | 0.9526 | 0.9437 | 0.9481 |
| Quan [30] [11] | DenseNet121 | 0.9094 | 0.9251 | 0.8960 | 0.9103 |
| Quan [30] [5] | DPN92 | 0.8788 | 0.8681 | 0.8892 | 0.8785 |
| Quan [30] | ADCN | 0.9747 | 0.9520 | 0.9350 | 0.9434 |
| Yang [59] | VGG19 | 0.9372 | 0.8731 | 0.5299 | 0.6595 |
| Yang [59] | AlexNet | 0.9633 | 0.8215 | 0.7023 | 0.7573 |
| Yang [59] | Own CNN | 0.9726 | 0.8273 | 0.7898 | 0.8081 |
| Proposed | EfficientNetB0 | 0.9829 | 0.9882 | 0.9774 | 0.9828 |
Accuracy, Recall, Precision and F1-score has been chosen as the evaluation criteria as these performance metrics are provided by most of the literature [19, 30–32, 39, 59]. Our method outperforms all the related works concerning automated medical diagnosis. The results shown in Table 7 suggest that large and recognized CNN seem not to work optimally in this application. This kind of networks mostly has large and heavy architectures, with a huge number of trainable parameters. Although, simpler customized CNN architectures, with fewer parameters, outperform them. The results indicate that the increase in CNN complexity does not always result in better performance. This could be explained since microscopic peripheral blood cells images have low variability and complexity.
The accuracy of the state-of-art models for automated medical diagnosis of malaria values of Table 7 varies from 87,88% to 97,47%. The proposed method outperforms them. Therefore, the use of the EfficientNet model shows encouraging results for malaria disease. Table 7 contains the accuracy, precision, recall, and F1-score of each fold for the binary classification using the validation data set. Then, an ensemble model, with each one of the 10 different models obtained from the 10-fold validation processes has been developed which outperforms the individual results of its components. The results show an accuracy of 98,29%, a recall of 98,82%, a precision of 97.74% and an F1-score of 98.28%, which significantly improve the averaged and individual results, shown in Table 6. The AUC is 99,76% and the ROC curve can be shown in Fig. 7. Finally, the confusion matrix is displayed in Fig. 8.
As far as the authors of this paper know, no similar work for an automated system for malaria diagnosis can be found in the literature, including a set of characteristics as the followings:
The model is based on EfficientNet and uses a pre-trained model for transfer learning.
10-fold stratified cross-validation is applied for validation. This technique selects different datasets of samples for training and testing. It reduces bias and each one of the images is used 9 times in the training process and only 1 in the testing phase.
The method involves validation using a separated data set of images, not previously used in the training/testing phase. The validation process used 5.512 samples not previously used. No sign of overfitting has been detected in the results.
An ensemble model produced from each of the models obtained in the 10-fold cross-validation process.
We have used the Albumentation library to decrease the possibility of overfitting, improve transfer learning execution, expand the volume of the dataset, and reduce execution time.
The source code is accessible as a supplementary file to let the research community replicate the results obtained in this paper.
Following the same approach of [30], we present 3 samples of incorrectly classified images for both classes. Figure 10 shows three infected cells that were categorized as normal. The reason for this behaviour could be that the symptoms are not still obvious, or the pathogen has not been appropriately stained.
Fig. 10.
Three samples of malaria class images misclassified as normal
On the other hand, Fig. 11 shows three normal cell images that were classified as infected. It may be produced by impurities or staining artefacts, which are very similar to the appearance of the stained pathogen, in these uninfected cell images.
Fig. 11.
Three samples of normal class images misclassified as malaria
Currently, several machine learning approaches and problem solutions in numerous fields have been studied [23, 35, 42, 43, 50]. Several real-time applications have been proposed using transfer learning approaches such as Natural Language Processing (NLP), Automatic Speech Recognition (ASR), and to solve computer vision problems. These include complex real-world scenarios where several limitations are associated with the reduced availability of labelled data. The idea of using pre-trained models in different scenarios will enable the design of novel solutions to create new systems for enhanced living, on real-time applications. The authors state the promising results of the EfficientNet method to support the diagnosis of malaria. Additionally, this study proposes the use of Albumentation and ImageDataAugmentator libraries. This work supports the current body of knowledge because it gives an effective answer for the automated diagnosis of malaria. Automated decision algorithms do not intend to supplant medical experts. Instead, these methods will support medical teams, lower their detection time of malaria, and improve the treatment. In the future, the authors aim to test and compare the performance of similar transfer learning approaches to malaria disease.
Conclusion
This study proposes an automated system based on an EfficientNet to assist the identification of malaria in blood cells. The proposed technique employs the EfficientNetB0, and it has been assessed using 10-fold cross-validation. An ensembled algorithm composed of the 10 trained models previously computed is proposed. The results are promising with 98.29% accuracy, 98.82% recall, 97.74% precision, 98.28% F1-score and 99.76% AUC. The authors could not find a similar study that uses EfficientNet for automated detection of malaria.
Nevertheless, this work has limitations common to all the methods found in the literature. Considering the high number of people who have been infected by malaria, the image collections accessible are not yet robust enough. Even so, the number of images available can be continuously collected to train CNN algorithms states and increase their performance. Furthermore, it is necessary to thoroughly study the behaviour of this type of techniques taking into account the progression of the illness in the patient.
All the source code used in this experiment is provided as a supplemental file. Therefore, readers can reproduce the results. Consequently, future research activities can reproduce, update, revise, and modify different parameters to adjust the outcomes of the proposed work.
Supplementary Information
(PDF 1288 kb)
Footnotes
Publisher’s note
Springer Nature remains neutral with regard to jurisdictional claims in published maps and institutional affiliations.
Contributor Information
Gonçalo Marques, Email: goncalosantosmarques@gmail.com.
Antonio Ferreras, Email: antonio.ferrerasextremo@gmail.com.
Isabel de la Torre-Diez, Email: isator@tel.uva.es.
References
- 1.Al-Qizwini M, Barjasteh I, Al-Qassab H, Radha H (2017) Deep learning algorithm for autonomous driving using GoogLeNet. In IEEE Intelligent Vehicles Symposium (IV), Los Angeles
- 2.Brown G. “Ensemble Learning,” in Encyclopedia of Machine Learning. Boston: Springer; 2011. [Google Scholar]
- 3.Buslaev A, Iglovikov V, Khvedchenya E, Parinov A, Druzhinin M, Kalinin A. Albumentations: Fast and Flexible Image Augmentations. Information. 2020;11(2):125. doi: 10.3390/info11020125. [DOI] [Google Scholar]
- 4.Carballo H, King K. Emergency department management of mosquito-borne illness: malaria, dengue and west nile virus. Emerg Med Pract. 2014;16(5):1–23. [PubMed] [Google Scholar]
- 5.Chen Y, Li J, Xiao H, Jin X, Yan S, Feng J Dual path networks. 6 07 2017. [Online]. Available: https://arxiv.org/abs/1707.01629. [Accessed 26 02 2021]
- 6.Das D, Chakraborty C, Mitra B, Maiti A, Ray A. Quantitative microscopy approach for shape-based erythrocytes characterization in anaemia. J Microsc. 2013;249(2):136–149. doi: 10.1111/jmi.12002. [DOI] [PubMed] [Google Scholar]
- 7.Das D, Koley S, Bose S, Maiti A, Mitra B, Mukherjee G, Dutta P (2019) Computer aided tool for automatic detection and delineation of nucleus from oral histopathology images for OSCC screening vol 8
- 8.Dong C, Loy C, Tang X (2016) Accelerating the super-resolution convolutional neural network. In Compuer Vision - ECC, Cham, Springer International Publishing, pp 391–407
- 9.Duong L, Nguyen P, Di Sipio C, Di Ruscio D (2020) Automated fruit recognition using efficientnet and mixnet. Artículos académicos para comput electron agric vol 171
- 10.Ersoy I, Bunyak F, Higgins JM, Palaniappan K (2012) Coupled edge profile active contours for red blood cell flow analysis. In 9th IEEE International Symposium on Biomedical Imaging (ISBI), Barcelona
- 11.Huang G, Liu Z, Maaten L, Weinberger K Densely connected convolutional networks. 25 8 2016. [Online]. Available: https://arxiv.org/abs/1608.06993?source=post_page. [Accessed 26 02 2021]
- 12.Jan Z, Verma B (2019) Balanced image data based ensemble of convolutional neural networks. In IEEE Symposium Series on Computational Intelligence (SSCI), Xiamen, China
- 13.Ji X, Yu Q, Liu Y, Kong S (2019) A recognition method for Italian alphabet gestures based on convolutional neural network. In Intelligent Computing Theories and Application, Springer International Publishinf pp 663–664
- 14.Karthik R, Hariharan M, Ananda S, Mathikshara P, Johnson A, Menaka R. Attention embedded residual CNN for disease detection in tomato leaves. Applied Soft Comput. 2020;86:105933. doi: 10.1016/j.asoc.2019.105933. [DOI] [Google Scholar]
- 15.Kaur M, Malhi A, Pannu H. Machine learning ensemble for neurological disorders. Neural Comput & Applic. 2020;32(8):12697–12714. doi: 10.1007/s00521-020-04720-1. [DOI] [Google Scholar]
- 16.Kimura F, Shridhar M. Handwritten numerical recognition based on multiple algorithms. Pattern Recogn. 1991;24(10):969–983. doi: 10.1016/0031-3203(91)90094-L. [DOI] [Google Scholar]
- 17.Lam L, Suen S. Application of majority voting to pattern recognition: an analysis of its behavior and performance. IEEE Trans Syst Man Cybern Syst Hum. 1997;27(5):553–568. doi: 10.1109/3468.618255. [DOI] [Google Scholar]
- 18.Lawrence S, Giles CCTA. Face recognition: a convolutional neurl-network aproach. IEEE Trans Neural Netw. 1997;8(1):98–113. doi: 10.1109/72.554195. [DOI] [PubMed] [Google Scholar]
- 19.Liang Z, Powell A, Ersoy I, Poostchi M, Silamu K, Palaniappan K, Guo P, Hossain M, Sameer A, Maude R (2016) CNN-based image analysis for malaria diagnosis. In International Conference on bioinformatics and biomedicine, Shenzhen
- 20.Makhija K, Maloney S, Norton R. The utility of serial blood film testing for the diagnosis of malaria. Pathology. 2015;47(1):68–70. doi: 10.1097/PAT.0000000000000190. [DOI] [PubMed] [Google Scholar]
- 21.Malihi L, Ansari-Asl K, Behbahani A (2013) Malaria parasite detection in giemsa-stained blood cell images. In 2013 8th Iranian conference on machine vision and image processing (MVIP), Zanjan (Iran)
- 22.Marques G, Agarwal D, de la Torre I. Automated medical diagnosis of COVID-19 through EfficientNet convolutional neural network. Appl Soft Comput J. 2020;96:106691. doi: 10.1016/j.asoc.2020.106691. [DOI] [PMC free article] [PubMed] [Google Scholar]
- 23.Mirri S, Delnevo G, Roccetti M. Is a COVID-19 second wave possible in Emilia-Romagna (Italy)? Forecasting a future outbreak with particulate pollution and machine learning. Computation. 2020;8(3):74. doi: 10.3390/computation8030074. [DOI] [Google Scholar]
- 24.Mitiku K, Mengitsu G, Gelaw B. The reliability of blood film examination for malaria at the peripheral health unit. Ethiop J Health Dev. 2003;17(3):149–246. [Google Scholar]
- 25.Mohd Jais I, Ismail A, Syed Qamrun N. Adam optimization algorithm for wide and deep neural network. Knowl Eng Data Sci (KEDS) 2019;2(1):41–46. doi: 10.17977/um018v2i12019p41-46. [DOI] [Google Scholar]
- 26.Parinov A “albumentations,” albumentations-team, [Online]. Available: https://github.com/albumentations-team/albumentations. [Accessed 30 01 2021]
- 27.Perrone M, Cooper L (1995) When networks disagree: Ensemble methods for hybrid neural networks. In How We Learn; How We Remember: Toward an Understanding of Brain and Neural Systems, New Jersey, World Scientific, pp 342–358
- 28.Poostchi M, Silamut K, Maude R, Jaeger S, Thoma G. Image analysis and machine learning for detecting malaria. Transl Res. 2018;194(4):36–55. doi: 10.1016/j.trsl.2017.12.004. [DOI] [PMC free article] [PubMed] [Google Scholar]
- 29.Purwar Y, Shah S, Clarke G, Almugairi A, Muehlenbachs A. Automated and unsupervised detection of malarial parasites in microscopic images. Malaria J. 2011;10:364. doi: 10.1186/1475-2875-10-364. [DOI] [PMC free article] [PubMed] [Google Scholar]
- 30.Quan Q, Wang J, Liu L. An effective convolutional neural network for classifying red blood cells in malaria diseases. Interdiscip Sci Comput Life Sci. 2020;12:217–225. doi: 10.1007/s12539-020-00367-7. [DOI] [PubMed] [Google Scholar]
- 31.Rahman A, Zunair H, Rahman MYJ, Biswas S, Alam A, Alam N, Mahdy M Improving malaria parasite detection from red blood cell using deep convolutional neural networks. 23 07 2019. [Online]. Available: https://arxiv.org/abs/1907.10418. [Accessed 26 2 2021]
- 32.Rajaraman S, Antani S, Pootschi M, Silamut K, Hossain M. Pre-trained convolutional networks as feature extractors toward improved malaria parasite detection in thin blood smear images. Peer J. 2018;6(4):4578. doi: 10.7717/peerj.4568. [DOI] [PMC free article] [PubMed] [Google Scholar]
- 33.Rangel J, Martínez-Gómez J, Romero-González C, García-Varea J, Cazorla M. Semi-supervised 3D object recognition through CNN labeling. Appl Soft Comput. 2018;65:603–613. doi: 10.1016/j.asoc.2018.02.005. [DOI] [Google Scholar]
- 34.Re M, Valentini G. “Ensemble methods: A review,” in Advances in Machine Learning and Data Mining for Astronomy. London: Chapman & Hall; 2012. pp. 563–594. [Google Scholar]
- 35.Roccetti M, Delnevo G, Casini L, Mirri S. An alternative approach to dimension reduction for pareto distributed data: a case study. J Big Data. 2021;8(1):1–23. doi: 10.1186/s40537-021-00428-8. [DOI] [PMC free article] [PubMed] [Google Scholar]
- 36.Sagi O, Rochard L. Ensemble learning: A survey. Wiley Interdiscip Rev Data Min Knowl Discov. 2018;8:4. doi: 10.1002/widm.1249. [DOI] [Google Scholar]
- 37.Sarwar A, Ali M, Jatinder M, Sharma V. Diagnosis of diabetes type-II using hybrid machine learning based ensemble model. Int J Inf Technol. 2020;12:419–428. [Google Scholar]
- 38.Savkare S, Narote S (2015) Automated system for malaria parasite identification. In 015 International Conference on Communication, Information & Computing Technology (ICCICT), Mumbai (India)
- 39.Shah D, Kawale K, Shah M, Randive S, Mapari R (2020) Malaria parasite detection using deep learning (Beneficial to humankind). In 2020 4th International Conference on Intelligent Computing and Control Systems (ICICCS), Madurai, India
- 40.Simonyan K, Zisserman A (2015) Very deep convolutional networks for large-scale image recognition. arXiv 1409.1556, vol 9
- 41.Sio S, Sun W, Kumar S, Bin W, Tan S, Ong S, Kikuchi H, Oshima Y, Tan K. MalariaCount: an image analysis-based program for the accurate determination of parasitemia. J Microbiol Methods. 2007;68(1):11–18. doi: 10.1016/j.mimet.2006.05.017. [DOI] [PubMed] [Google Scholar]
- 42.Somasundaram A, Reddy US (2016, September) Data imbalance: effects and solutions for classification of large and highly imbalanced data. In international conference on research in engineering, computers and technology (ICRECT 2016) (pp 1–16)
- 43.Sun Y, Wong AK, Kamel MS. Classification of imbalanced data: a review. Int J Pattern Recognit Artif Intell. 2009;23(04):687–719. doi: 10.1142/S0218001409007326. [DOI] [Google Scholar]
- 44.Tai Y, Yang J, L X (2017) Image super-resolution via deep recursive residual network. In Proceedings of the IEEE Conference on Computer Vision and Pattern Recognition (CVPR)
- 45.Tan M Efficientnet: Improving accuracy and efficiency through automl and model scaling. 29 05 2019. [Online]. Available: https://ai.googleblog.com/2019/05/efficientnet-improving-accuracy-and.html. [Accessed 24 01 2021].
- 46.Tan M, Le Q (2019) Efficcientnet: Rethinking model scaling for convolutional neural networks. In Proceedings of the 36th International Conference on Machine Learning, Long Beach, California
- 47.Tavanei A, Ghodrati M, Kheradpiesheh S, Masquelier T, Maida A. Deep learning in spiking neural networks. Neural Netw. 2019;111:47–63. doi: 10.1016/j.neunet.2018.12.002. [DOI] [PubMed] [Google Scholar]
- 48.Tokumasu T, Fairhurst R, Ostera G. Band 3 modifications in plasmodium falciparum-infected AA and CC erythrocycles assayed by autocorrelation analysis using quantum dots. J Cell Sci. 2005;118(5):1091–1098. doi: 10.1242/jcs.01662. [DOI] [PubMed] [Google Scholar]
- 49.Tukiainen M “ImageDataAugmentor,” [Online]. Available: https://github.com/mjkvaak/ImageDataAugmentor. [Accessed 18 1 2021]
- 50.Verbraeken J, Wolting M, Katzy J, Kloppenburg J, Verbelen T, Rellermeyer JS. A survey on distributed machine learning. ACM Comput Surveys (CSUR) 2020;53(2):1–33. doi: 10.1145/3377454. [DOI] [Google Scholar]
- 51.Vink J, Laubscher M, Vlutters R, Silamut K, Maude R, Hasan M, Haan G. An automatic vision-based malaria diagnosis system. J Microsc. 2013;250(3):166–178. doi: 10.1111/jmi.12032. [DOI] [PubMed] [Google Scholar]
- 52.Wang Y, Wei X, Shen H, Ding L, Wan J. Robust fusion for RGB-D tracking using CNN features. Applied Soft Comput. 2020;92:106302. doi: 10.1016/j.asoc.2020.106302. [DOI] [Google Scholar]
- 53.Wang C, Zhao Z, Xu Y, Yu Y. A novel multi-focus image fusion by combining simplified very deep convolutional networks and patch-based sequential reconstruction strategy. Applied Soft Comput. 2020;91:106253. doi: 10.1016/j.asoc.2020.106253. [DOI] [Google Scholar]
- 54.WHO, Guidelines for the Treatment of Malaria, 3 ed., Geneva: World Health Organization, 2015 [PubMed]
- 55.WHO, World Malaria Report 2020, Geneva: World Health Organization, 2020, p. 299
- 56.Xiao Y, Wu J, Lin Z, Zhao X. A deep learning-based multi-model ensemble method for cancer prediction. Comput Methods Prog Biomed. 2018;153(1):1–9. doi: 10.1016/j.cmpb.2017.09.005. [DOI] [PubMed] [Google Scholar]
- 57.Yadav D, Pal S. To generate an ensemble model for women thyroid prediction using data mining techniques. Asian Pac J Cancer Prev. 2019;20(4):1275–1281. doi: 10.31557/APJCP.2019.20.4.1275. [DOI] [PMC free article] [PubMed] [Google Scholar]
- 58.Yakubovskiy P Implementation of EfficientNet model. Keras and TensorFlow Keras. [Online]. Available: https://github.com/qubvel/efficientnet. [Accessed 30 01 2021]
- 59.Yang F, Poostchi M, Yu H, Zhou Z, Silamut K, Yu J, Maude RJ, Jaeger S, Antani S. Deep learning for smartphone-based malaria parasite detection in thick blood smears. IEEE J Biomed Health Inform. 2020;24(5):1247–1438. doi: 10.1109/JBHI.2019.2939121. [DOI] [PubMed] [Google Scholar]
Associated Data
This section collects any data citations, data availability statements, or supplementary materials included in this article.
Supplementary Materials
(PDF 1288 kb)


